Embed Size (px)
Citation preview
Journal of Case Research in Business and Economics
The housing bubble, Page 1
The housing bubble and the GDP: a correlation perspective
Ray M. Valadez Pepperdine University
Abstract
One cannot pick up a financial publication or newspaper without noticing articles alleging, or at the very least insinuating, a relationship between the housing bubble burst and the most severe recession in the U.S. and other parts of the world since the great depression of the 1930’s. However, empirical studies statistically confirming such a relationship are a challenge to find. This study examines a relationship between the prices of houses and the United States GDP before, during, and after the period known as the “2007 global financial meltdown.” The study also expands into the global environment through its literature review. Tracking a housing price index and the U.S. GDP numbers over the last five years, data was retrieved from different sources but aligned in equal time and periods, reviewed, subjected to Regression Analysis, and tested for significance. The results indicate that there exists a relationship between the two variables such that a quarterly change in the housing price index may yield a quarterly change in Real GDP. The hypothesis test rejects the null hypothesis, thus supporting the notion that they are linked. However, the specific elements or combination of causal factors including the toxic mortgage debt that may have triggered the economic slowdown may continue to be debated far into the future. Many factors and forces created the perfect storm for the global financial crisis. However, it appears that the subprime mortgage lending disaster, whose center was the price bubble of the housing market, was the spark that started it all. Keywords: Housing bubble, Asset bubble, HPI, U.S. economy, Recession, GDP growth, financial crisis, Home price-rent ratio,
Journal of Case Research in Business and Economics
The housing bubble, Page 2
Introduction
The long standing relationship between a nation’s economic footing as measured by its GDP and housing prices has been observed and studied over the past century by academicians as well as by private and public officials. This study looks at the relationship before, during, and after the most climatic period of our economic time since the great depression of the 1930s. The period between the first quarter of 2005 and the end of 2009 saw dramatic changes in the behavior of financial and economic markets. Global financial markets came to a halt and global free market economies fell to their knees.
One cannot pick up a financial publication or newspaper without noticing articles alleging, or at the very least insinuating, a relationship between the housing bubble burst and the most severe global recession since the great depression of the 1930’s. However, empirical studies statistically confirming such a relationship are a rare find. As discussed in the literature review, esteemed authors in this field like Robert Shiller, along with publications such as the Economist, and global and government agencies such as the International Monetary Fund and the Federal Reserve of the United States have broached the experiential and empirical study of the housing effect on the economy. This study attempts to shed some light on the relationship between the Housing Price Index (HPI) and the Gross Domestic Product of a nation before, during, and after the mortgage and financial meltdown of 2007-2008. While this study is limited by the realization that we cannot draw causal inferences without scientific experimentation, the research and data statistical significance suggests that a relationship exists. For valid causal conclusions, we need an experiment with both a control and conditioned group which would be difficult to stage.
A brief background is given followed by the purpose, focus, declaration of the research question. The literature review provides a historical role of housing in an economy, several relationships of housing indexes and the GDP, and other metrics showing the development of the international housing bubble. The process of data collection is given in the methodology section. The statistical results are revealed followed by the conclusion and recommendation sections.
Background
When Alan Greenspan (2008) admitted that financial institutions were failing and the free
market economies were melting into a crisis, the world was astounded to hear that the financial maestro was “as surprised and shocked” (as reported in MSNBC, October 23, 2008) as everyone else. While the term housing bubble had been tossed about as early as 2003, the affirmation of its existence came in the fall of 2008. At this time, the world was dealing with the so called toxic assets of Collaterized Debt Obligations (CDOs) and the ensuing credit swaps fiascos, whose residual effects spilled over into 2009 and continued into 2010. The average person was referring to the cause of the economic meltdown as the popping of the housing bubble. However, the cause of the economic meltdown was far more complex than the housing bubble bursting. Although this study reveals a statistically significant correlation between the housing price index and the GDP, it does not substantiate its cause. Some economists believe that the housing sector not only drives entire economies, but also causes financial crises and ensuing economic recessions. However, there may well be other determinants.
Journal of Case Research in Business and Economics
The housing bubble, Page 3
After the dot.com bubble burst, the term “asset bubble” became part of the daily chatter in most financial discussions. Gradually the term has made its way into our daily lives in part because of headlines, blurbs, and commentary in the media. In this paper an asset bubble is defined as an inflation of the price of an asset relative to its fundamental value. It is a mindset that utters the coined term “irrational exuberance,” which was used to describe the stock market’s behavior in the 90s by Alan Greenspan (1996) and further depicted by Robert Shiller (2005) in his book “Irrational Exuberance.” Shiller thought the term was catchy and refers to it as a “mindset that occurs during speculative bubbles” (Shiller, 2005). Some economists believe this exuberance spilled over to the real estate market after the 2000 security market crash. Investors shifted from investing in securities to investing in real estate, and their enthusiasm caught on with novice real estate flippers.
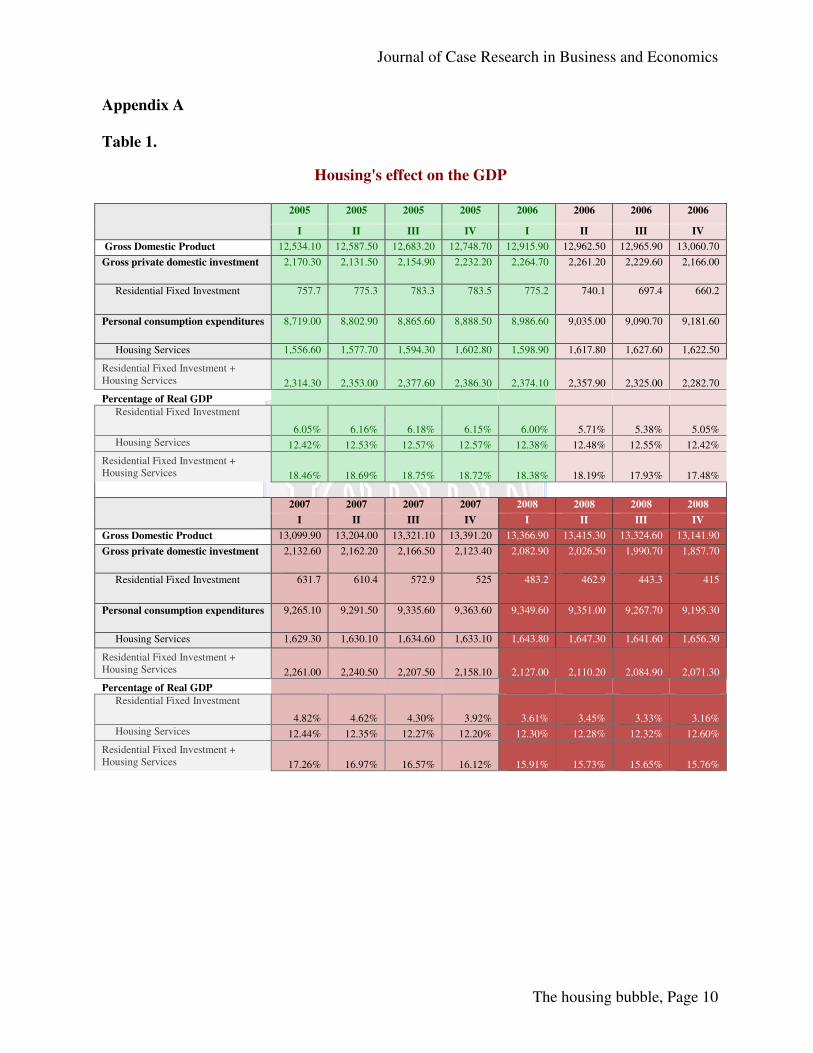
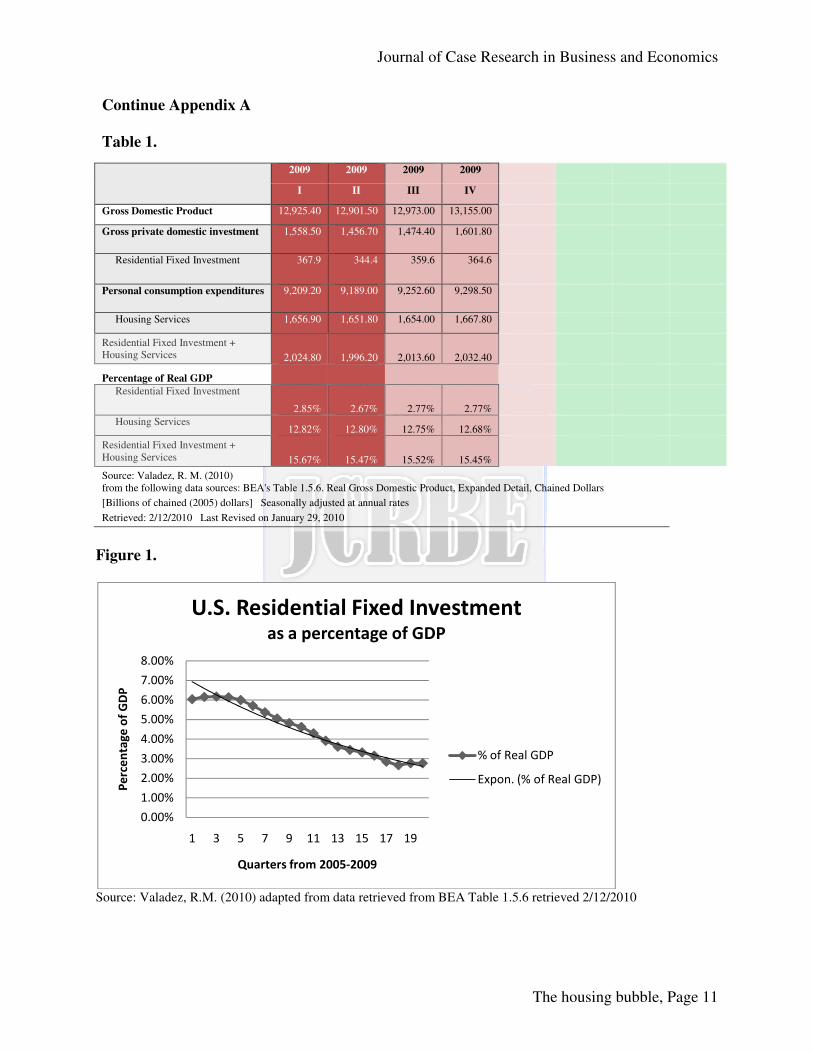
Traditionally, the line entry “Residential Fixed Investment” in the BEA tables has been used to measure the portion of the GDP dedicated to residential fixed investment. It normally runs approximately 5 percent of Real GDP in the U.S. This number is presented in Table 1 for the years of the study in Appendix A as well as graphically displayed in Figure 1 in Appendix A. Prior to the meltdown in September 2005, it stood at approximately 6.18 percent of Real GDP. According to economists at Goldman Sachs, the residential investment percentage was at a 40-year high in the U.S., yet the growth in households was at a 40-year low (As cited by The Economist, 2005a). The residential investment percentage then began to diminish each quarter until the end of 2009 to approximately 2.8 percent of GDP. According to Leamer’s (2007) study, “residential investment consistently and substantially contributes to weakness before recessions but business investment in equipment and software does not” (p.164). His study further revealed that the recovery for residences is faster than equipment and software in the U.S. economy. On the international front, one of the best studies of 14 countries during 1970-2001 generated by the International Monetary Fund states that house-price busts hurt the economies in 19 out of 20 housing busts led to a recession, “with GDP after three years falling to an average of 8 % below its previous growth trend” (As cited in The Economist, 2005a).
In combining the Residential Fixed Investment and Housing Services, they contribute to approximately 18 percent of the Real GDP in the U.S. This number was as high as 18.75 prior to the meltdown in September 2005. It now stands at 15.5 percent of GDP. Most of the change has occurred in the Residential Fixed Investment number. These combined percentages are significant when one considers the size of the U.S. economy, which stood at over 13 trillion at the end of 2009 chained in 2005 dollars.
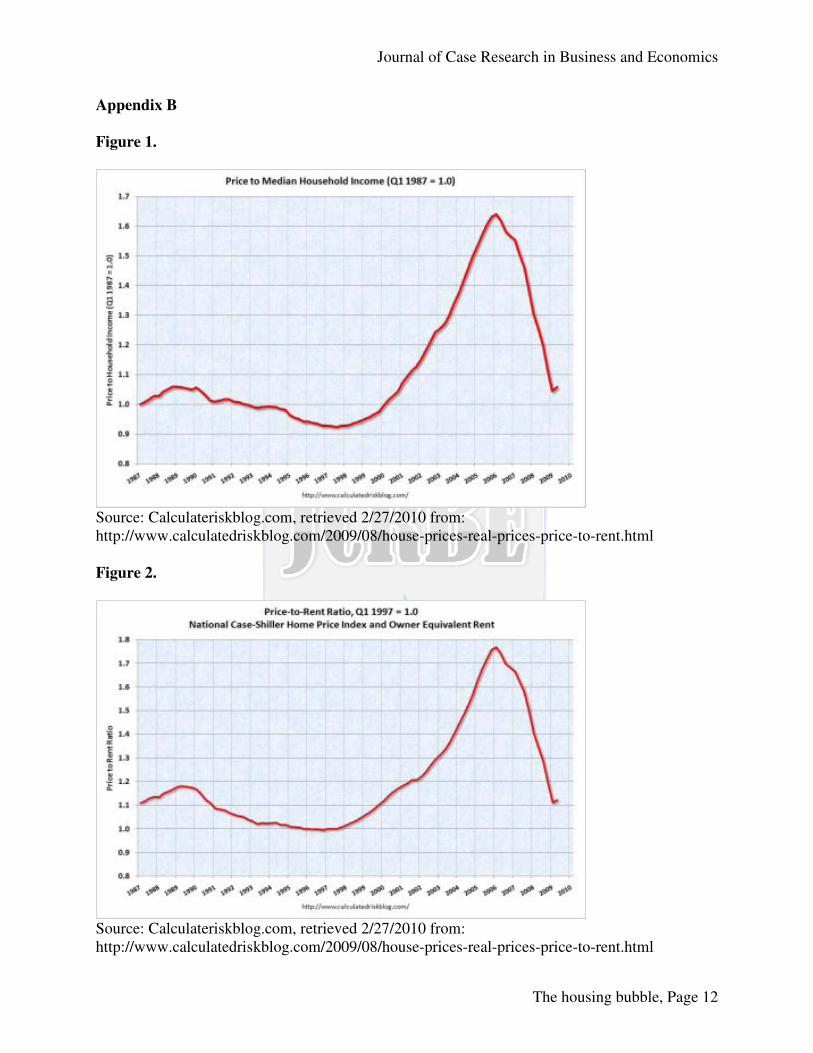
Ratio measurements such as housing prices to income and to a rental index have been used to examine the efficacy of housing prices. These two well known measures are the Price-to-Income and Price-to-Rent ratios. Figures 1 and 2 in Appendix B provide the graphic display of these ratios. They suggest that house prices in the U.S. were too high, which created a housing price bubble. While useful, each has fundamental flaws; they are national and do not consider other variables such as credit transparency issues, inventory levels, government intervention, and other forces at play.

Journal of Case Research in Business and Economics
The housing bubble, Page 4
Purpose
The recent news of the housing bubble burst and the severity of the global recession
brought about the need to determine if a relationship existed between housing prices and Real GDP. If so, was the relationship statistically significant? The purpose of this paper is not to declare the validity of any position regarding the cause of the financial meltdown, but rather to reveal the statistical correlation between housing and GDP. While the correlation may not determine the exogenous cause, it is a rational way to explain the relationship. Focus
This study focuses on the relationship between a Housing Price Index and the Real GDP. It centers on the time period of the greatest financial meltdown and the deepest economic recession in over seven decades. Within this time frame financial institutions began to lose trust in one another and in governments to such an extent that they stopped lending to each another. Most economists believe that the wheels of distrust began the summer of 2007. Further, the media cited the subprime mortgage debt as the primary cause. The debt was restructured into security investment vehicles by Wall Street in the form of Collaterized Debt Obligations along with other assets to get better ratings from the rating bureaus. The escalating prices of houses were also associated with the mortgage industry’s lack of transparency and the regulation in the repackaging of the debt by the security industry. Literature Review
While the primary focus of the study was the United States, similarities have been found
in other nations as well. For example, the Economist (2005a, 2005b) predicted the impending global crisis in its articles, “In come the waves” and “After the fall.” Additionally, Thomas Helbling and Marco Terrones (2003) gave the topic attention in their publication in the external publications of the International Monetary Fund, which was also released prior to the meltdown. During the meltdown, Edward Leamer (2007) provided an interesting analysis of the housing effects on the GDP, which he points to the most important sector when contending with economic recessions. Of course, the U.S. National Association of Home Builders, who has proprietary interest on the subject, maintains an array of data and articles that supports Leamer’s conclusions as well as other studies. More recently, several authors from the Brookings Institute, including Barry Bosworth and Aaron Flaaen (2009), have addressed what happened during the crisis. Bosworth and Flaaen conclude that the enormous growth of the subprime mortgage market and the lack of its regulation along with transparency in lending procedures were the decisive factors of the crisis. According to the Economist (2005c), the rate of new home building was far outpacing natural demand, and exceeded demographic demand. There were a few signs of oversupply of housing units; in fact, levels were at near record lows, which were attributed to the intensity of the housing frenzy as opposed to any actual supply shortage. This frenzy was fed by an overzealous market that assumed incorrectly that housing prices would continue to escalate ad infinitum. According to another Economist article, “the total value of residential property in developed economies rose by more than $30 trillion [since 2000], to over $70 trillion, an increase equivalent to 100% of those countries’ combined GDP’s (2005a). Even back then the
Journal of Case Research in Business and Economics
The housing bubble, Page 5
Economist had predicted that several countries would experience price falls of 20 percent or more. Although Chairman Greenspan argued that the diversity of the housing markets made a national bubble unlikely, the signs of impending danger were apparent. As an economist at Goldman Sachs pointed out at the time, residential investment at 5.75% of GDP was at the higher end of levels from the past four decades (Economist, 2005c). Additonally, as previously mentioned, this percentage soared as high as 6.18 percent later in 2005.
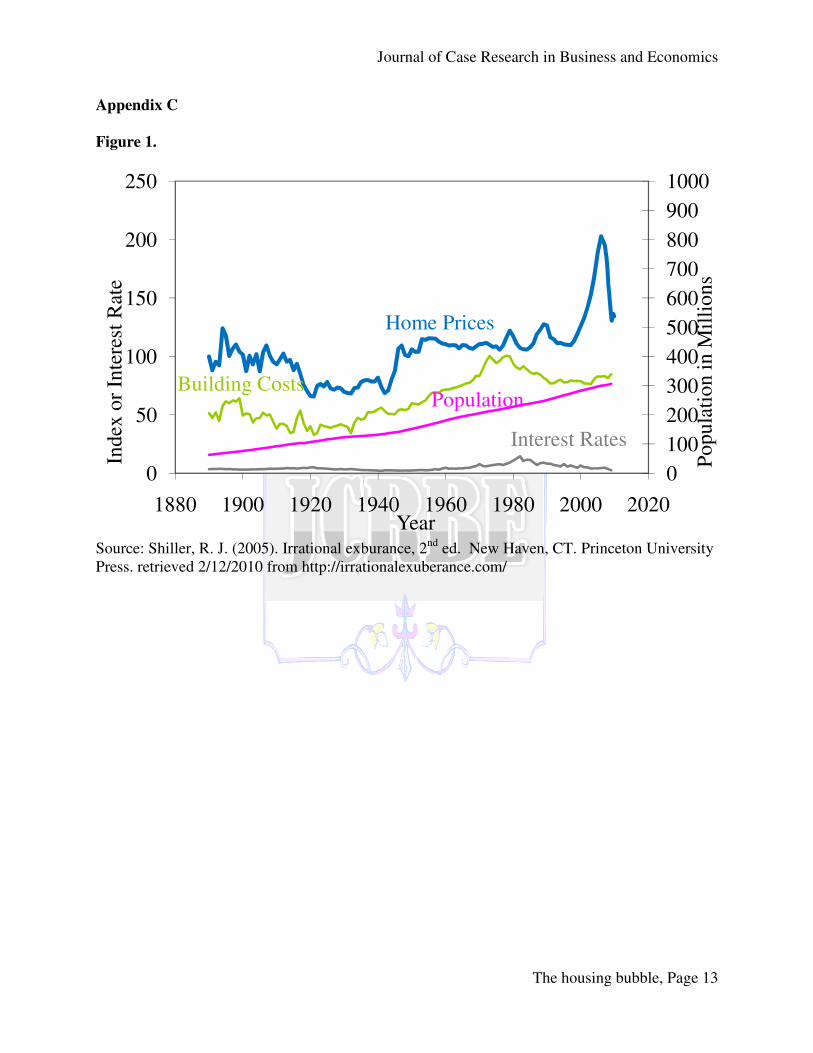
Furthermore, houses were becoming far more expensive due to an increase in the relation of purchase price to income from 2.75 time median income to 3.4 times median income (Economist, 2005c). In April 2005 the cost of a median single family home had risen to 15% more than at the same time in the previous year, which should have been an early indicator of the building “frothiness” in the market and the unsustainable nature of the prices. The only other time in U.S. history when there were comparable housing price booms was near the end of WWII when prices went up 60% over a five year period. Prices eventually self-corrected to pre-WWI levels. However, while the current boom is comparable, it may not easily self-correct and may have a greater impact because of the price increases of more than 70% over an 8 year period (Shiller, 2006). Figure 1 in Appendix C depicts a more dramatic sense of the home price escalation that occurred in the first decade of this century
The International Monetary Fund study, mentioned in the Background section of paper, found that losses in domestic production after house-price busts have been twice as great as losses after stock market crashes, which usually result in long recessionary periods (Economist, 2005a). This was further substantiated by Leamer’s (2007) U.S. study. The impact of home building starts, housing re-sale, and home prices on the U.S. economy is being felt across all sectors, and is manifested through the global economic crisis as well. According to the National Association of Home Builder’s, their industry accounted for 13.6% of U.S. GDP in the first quarter of 2009, which is down from 2005’s numbers of 16.7% of US GDP (As cited by Kruger, 2009). The numbers from the BEA Table 1.5.6 show a similar trend. Table 1 in Appendix A provides the numbers for these metrics. As previously mentioned, historically residential construction and housing services averaged 17-18 percent of GDP.
A 2007 study conducted by the Center for Economic and Policy Research tracked the Housing Price Index (HPI) over a ten year period, which indicated that prior to mid-1990, house prices increased at about the same rate as other baskets of goods or services. But since then, the HPI has increased by more than 50% after adjusting for inflation. This study goes on to suggest that house prices/rental prices and home ownership/rental vacancies are both inversely related (As cited by Baker, 2007).
The NAHB (2009) projected that housing would soon cease to have a negative impact on GDP and become a positive contributor due to a significant drop in existing home prices that made it cheaper to own than rent. But some economists fear that the far-reaching nature of the current economic crisis will create only short-lived recovery, or at best achieve sporadic gains for several quarters before realizing any sustainable gains. In their Bloomberg (2009) article “US Recovery May Start, Then Sputter as Zarnowitz Rule is Bent”, authors Rich Miller and Matthew Benjamin suggest that the current contraction may follow the Zarnowitz rule that deep recessions are almost always followed by times of rapid recovery. Because of extensive reach of this crisis, any recovery may be hampered by structural impediments that prevent a sustained recovery in the short run (Miller & Benjamin, 2009). On the other hand, current skepticism regarding a sustainable economic recovery should be tempered with evidence of the Zarnowitz Rule in history, which shows a direct correlation between the strength of recovery to the depth of the
Journal of Case Research in Business and Economics
The housing bubble, Page 6
recession (Bond, 2009). Also, the Taylor’s rule benchmark, another traditional metric, was recently applied by William Seyfried (2009). Seyfried tested the monetary policy of low interest rates on housing prices in several countries to explain the housing bubble development and its possible economic effects in France, Germany, Ireland, Spain, Great Britain and the United States. Additionally, he (2009) proposed and expanded model of the Taylor’s rule using gap analysis. Methodology
The readily available data sources on housing and GDP for the U.S. were investigated. The Bureau of Economic Analysis was the first and best source to get adjusted GDP numbers by month, quarter, and annually. In particular, BEA Table 1.1.1 provided the source for the quarterly changes of the adjusted GDP. The latest update as of the writing of this paper was January 28, 2010 and posted in the BEA’s website on January 29, 2010. First American CoreLogic started their housing price index several years ago and has steadily been gaining a reputation. Their HPI is now being used by the Federal Reserve of the United States. The latest HPI figures as of today are November 9, 2009, with monthly data as well as quarterly, semiannual, and annual.
The quarterly data of First American CoreLogic’s Housing Price Index was tracked alongside the quarterly changes of the Real GDP as posted in BEA Table 1.1.1 during the period from the first quarter of 2005 to the third quarter of 2009. A regression analysis was done using Number Crunching Statistical Service (NCSS) software. Several tests were done to measure the normality of distribution, constant residual variance, and the test that the relationship is a straight line besides the analysis of variance.
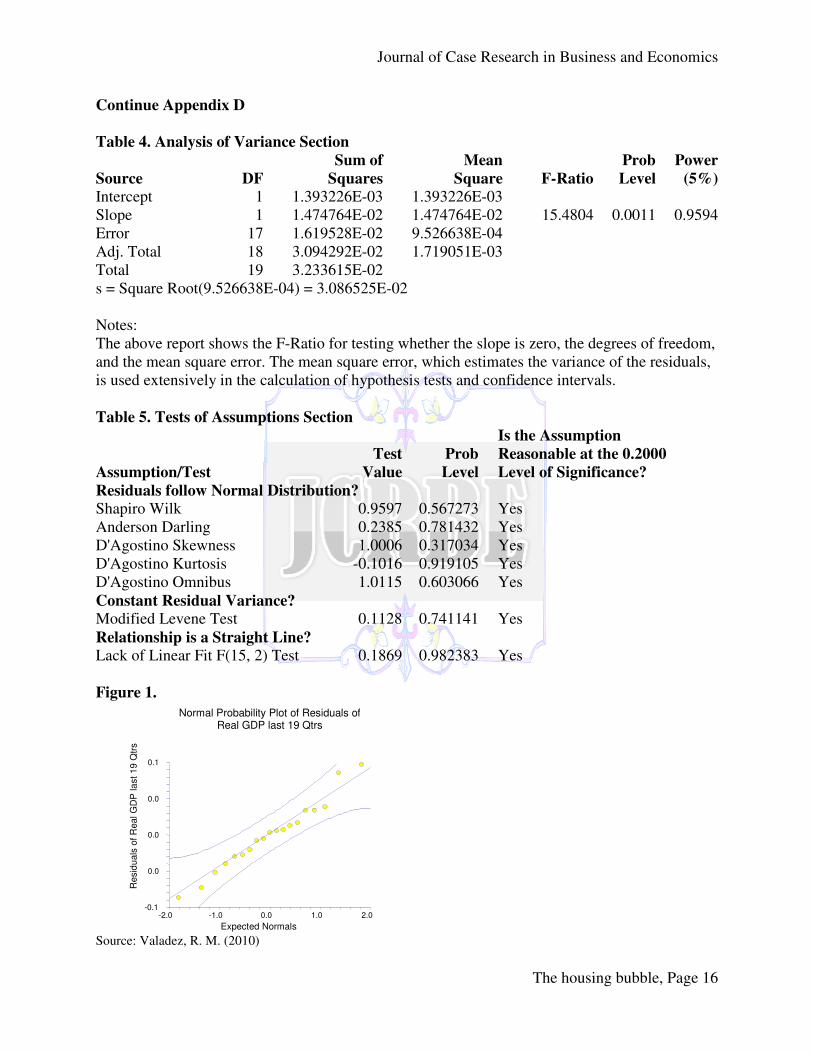
In Table 5 in Appendix D the normality of distribution using the Shapiro Wilk, Anderson Darling, and D’Agostino test for skewness, kurtosis, and omnibus are provided. A probability scatter plot of Residuals of the quarterly changes of Real GDP was plotted in Figure 1 in Appendix D against expected Normals. For the Constant Variance test, the modified Levene test was done. Finally, the Lack of Linear Fit (15, 2) test was done. All of these tests suggest that the assumptions are reasonable at the 0.2000 level of significance.
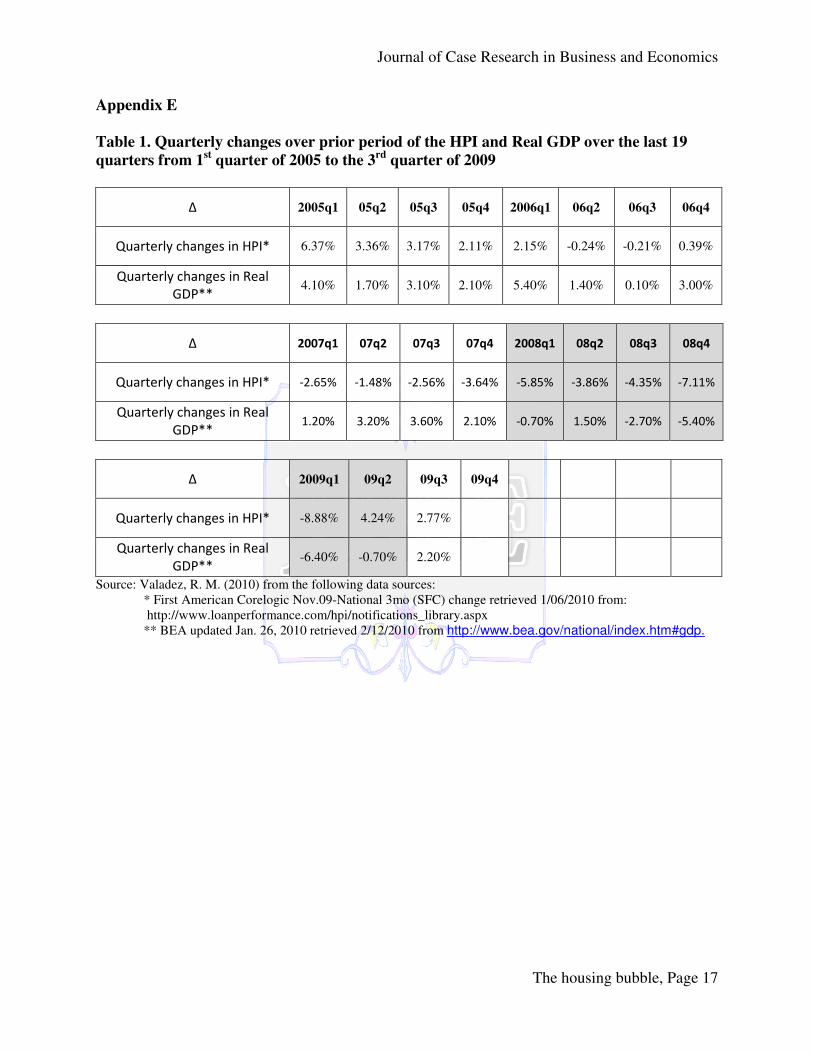
The following hypothesis was pursued: H1-There is a significant correlation between the quarterly change in the HPI and a quarterly change in Real GDP. H0-There is not a significant correlation between the quarterly change in the HPI and a quarterly change in Real GDP. The measure for dependence between two variables is the Pearson product-moment correlation coefficient in Table 1 of Appendix D. The changes in quarterly HPI and changes in Real GDP are provided in Appendix E, Table 1.
Results
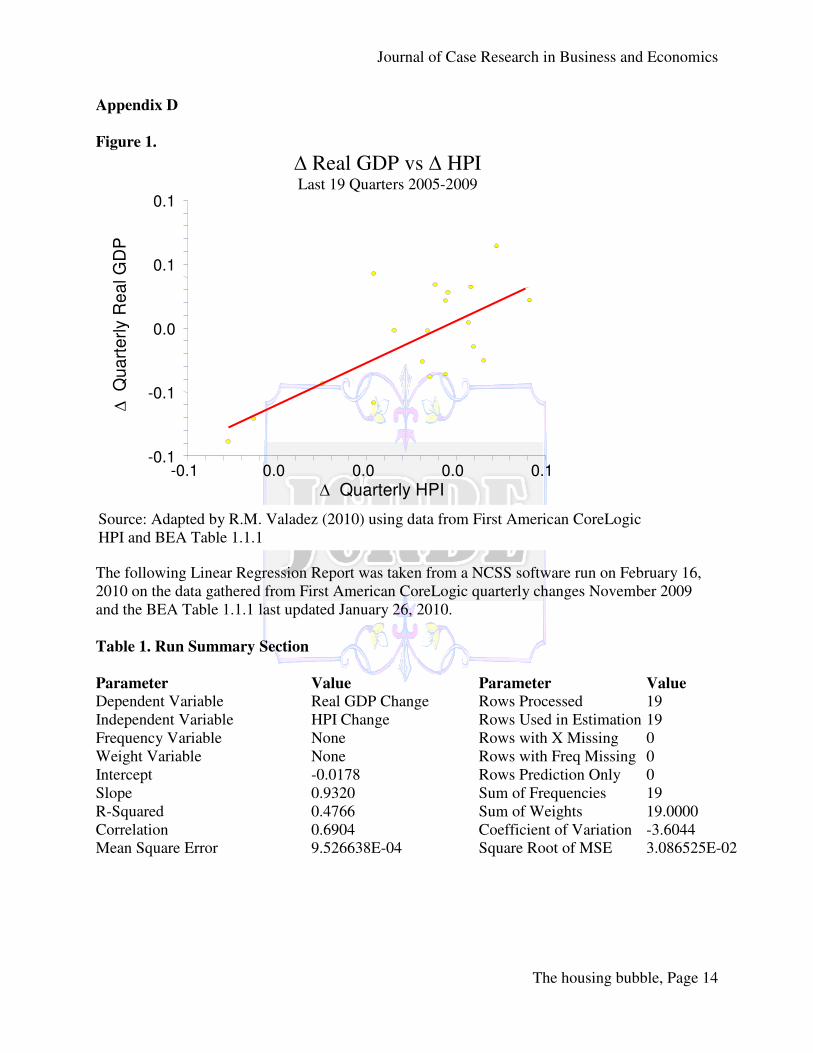
According to the Regression analysis in Appendix D there exist a linear relationship between the First American CoreLogic HPI index and the Real GDP of the U.S. The statistical p-value of 0.0011 of the t-test is less than our assigned level of confidence of 95 percent. The equation of the straight line relating Real GDP Change and HPI Change is estimated as: Real GDP Change = (-0.0178) + (0.9320) HPI Change using the 19 observations in this dataset. The
Journal of Case Research in Business and Economics
The housing bubble, Page 7
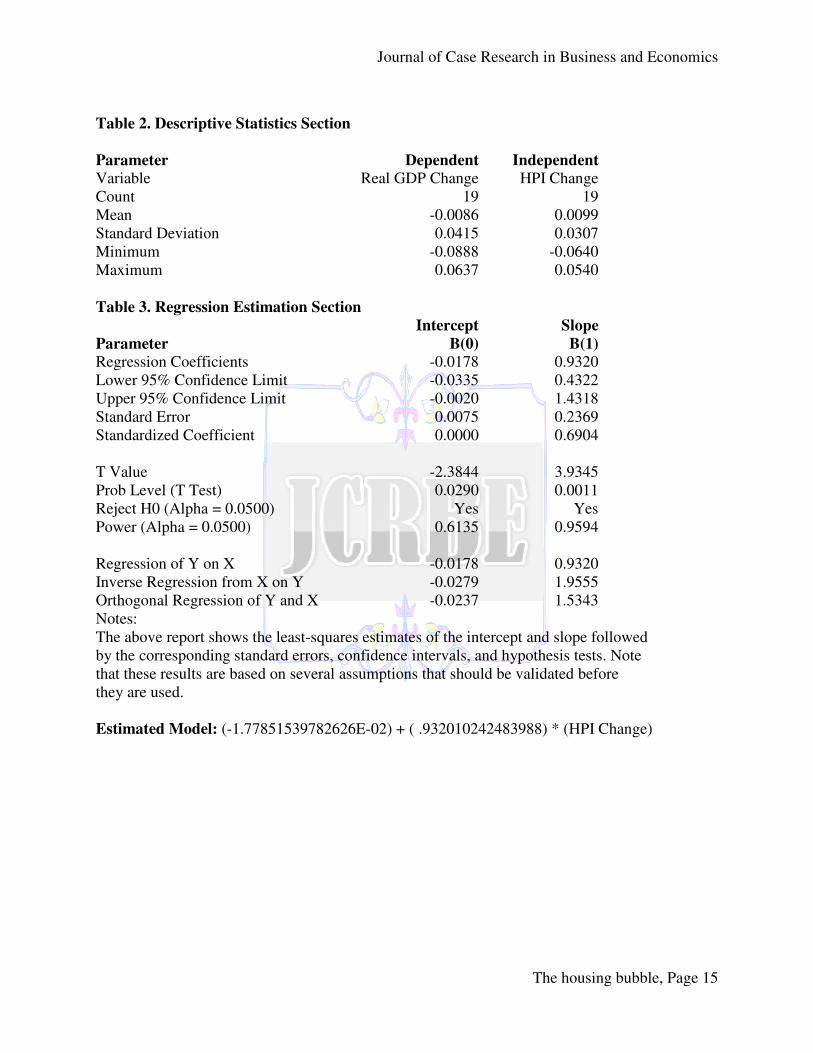
y-intercept, the estimated value of Real GDP Change when HPI Change is zero, is -0.0178 with a standard error of 0.0075. The slope, the estimated change in Real GDP Change per unit change in HPI Change, is 0.9320 with a standard error of 0.2369. The value of R-Squared, the proportion of the variation in Real GDP Change that can be accounted for by variation in HPI Change, is 0.4766. The correlation between Real GDP Change and HPI Change is 0.6904. A significance test that the slope is zero resulted in a t-value of 3.9345. The significance level of this t-test is 0.0011. Since 0.0011 < 0.0500, the hypothesis that the slope is zero is rejected. The estimated slope is 0.9320. The lower limit of the 95% confidence interval for the slope is 0.4322 and the upper limit is 1.4318. The estimated intercept is -0.0178. The lower limit of the 95% confidence interval for the intercept is -0.0335 and the upper limit is -0.0020.
The Descriptive Statistics are displayed in Table 2 of Appendix D followed by the Regression Estimation in Table 3, the Analysis of Variance in Table 4, and the Test of Assumptions is provided in Table 5. The Pearson correlation was 0.69 with an R-Squared of 0.4766. These correlation measures provide convincing evidence that a strong relationship exists between the quarterly changes in the HPI and quarterly changes in Real GDP.
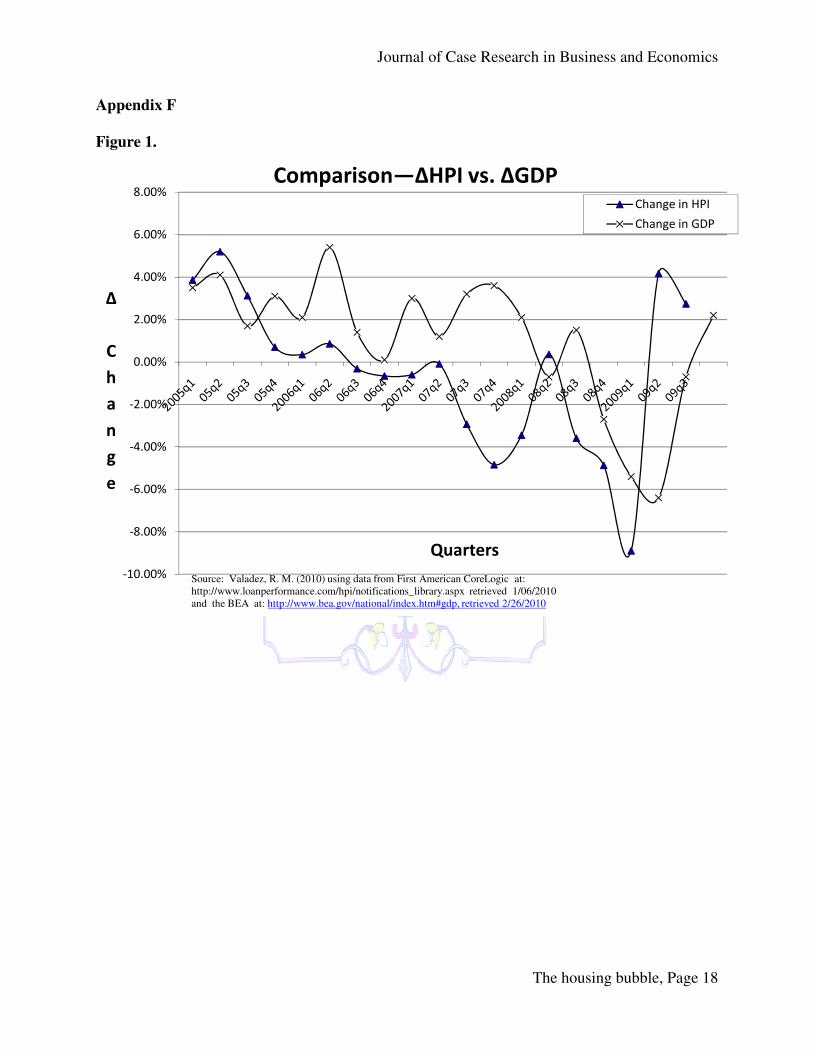
The graphic display of the quarterly changes in HPI and the quarterly changes in Real GDP is in Appendix F, Figure 1.
Conclusion and Recommendations
The long standing relationship between a nation’s economic footing as measured by its
GDP and housing prices has been observed and studied over the past century by academicians as well as by private and public officials. This study looked at the relationship between housing and GDP before, during, and after the most climatic period of our economic time since the great depression of the 1930s. The period between the first quarter of 2005 and the end of 2009 saw dramatic changes in the behavior of financial and economic markets. Global financial markets came to a halt and global free market economies fell to their knees. Could housing have such dramatic effects on the economy of a nation? This question was examined in this study. The literature review along with the results of this study’s correlation analysis provides convincing evidence that a strong relationship exists between the two variables. However, to establish a scientific causal effect will be a challenge because managing control groups in this arena is impossible.
Regression analysis and Pearson’s correlation coefficient utilizing NCSS software were used to investigate the relationship between the change in HPI and the change in GDP in the U.S. However, one cannot state, even if there is statistical significance, that one variable causes another. Measuring the strength of the relationship using regression analysis provides the confidence that a relationship exists and dependence may be present. Correlations may suggest possible causal relationships. The causes underlying the relationship between the HPI and GDP may be indirect or overlap in such a way as to provide pairing or interdependence. A correlation between variables where the data is normally distributed increases the confidence level in measuring the linear relationship. Additionally, we cannot assume the relationship is linear. This relationship between the quarterly change in the HPI and the quarterly change in Real GDP may not be linear in nature over time. Further studies are warranted in light of the results shed by this study.

Journal of Case Research in Business and Economics
The housing bubble, Page 8
References
Baker, D. (2007). 2007 Housing Bubble Update: 10 Economic Indicators to Watch. Washington,
DC: Center for Economic Policy and research. Bond, T. (2009). Global Speculations: The Great Wall of Worry. July 30, 2009. London:
Barclays capital. Bosworth, B. & Flaaen, A. (2009). America’s financial crisis: the end of an era. Proceedings of
the ADBI Conference, Tokyo, Japan April 22-23, 2009. Retrieved February 7, 2010 from http://www.brookings.edu/~/media/Files/rc/papers/2009/0414_financial_crisis_bosworth/0414_financial_crisis_bosworth.pdf
Bloomberg.com news (2009). U.S. recovery may start, then sputter as Zarnowitz rule is bent. Retrieved May 11, 2009 from http://www.bloomberg.com/apps/news?pid=20670001&sid=aVK2m3ibUH60/
Federal Reserve. (1996, December 5) Remarks by chairman Alan Greenspan. At the annual dinner and Francis Boyer Lecture of The American Enterprise Institute for Public Policy Research. Washington, D.C. retrieved from www.federalreserve.gov/boardDocs/speeches/1996/19961205.htm retrieved 2/20/2010
Helbling, T. & Terrones, M. (2003). When bubbles burst. an external publication by the International Monetary Fund. Retrieved February 10, 2010 from http://www.imf.org/external/pubs/ft/weo/2003/01/chapter2.pdf
International Monetary Fund. (2003, April). IMF: World Economic and Financial Surveys. Retrieved February 9, 2010, from IMF World Economic Outlook (WEO): http://www.imf.org/external/pubs/ft/weo/2003/01/index.htm
International Monetary Fund. (2008, n.d.). WEO, Chapter 3: The Changing Housing Cycle and
the Implicatrions for Monetary Policy. Retrieved February 9, 2010, from IMF Web site: http://www.imf.org/external/pubs/ft/weo/2008/01/pdf/c3.pdf
Kruger, D. (2009, May 11). Mortgages over 5% mean Fed purchases as bonds slump (update 2). Bloomberg News. Retrieved, February 10, 2010 from http:www.bloomberg.com/apps/news?pid=20670001&sid=aF6zZkk7cA4s
Leamer, E. E. (2007, n.d.). Housing is the Business Cycle. Retrieved February 5, 2010, from Federal Reserve of Kansas City Web site: http://www.kansascityfed.org/publicat/sympos/2007/PDF/Leamer_0415.pdf
Miller, R., & Benjamin, M. (2009, May 11). U.S. Recovery May Start, Then Sputter as Zarnowitz
Rule is Bent. Retrieved February 10, 2010, from http://www.bloomberg.com/apps/new?pid=20670001&sid=aVK2m3ibUh6o
MSNBC. (2008, October 23). Greenspan admits ‘mistake’ that helped crisis. Retrieved February 19, 2010 from www.msnbc.msn.com/id/27335454/
National Association of Home Builders. (2009, July 30). Housing's Contribution to Gross
Domestic Product. Retrieved February 12, 2010, from http://www.nahb.com/generic.aspx?sectionID=784genericContentID=66226
National Association of Home Builders. (2010, February 3). NAHB's Eye On The Economy:
Housing Struggles as the Economy Slowly Grows. Retrieved February 9, 2010, from NAHB Web site: http://www.nahbmonday.com/eyeonecon/issues/2010-02-03.html

Journal of Case Research in Business and Economics
The housing bubble, Page 9
Seyfried, W. (2009). Monetary policy and housing bubbles: a multinational perspective. Research in Business & Economic Journal. (2) 2009. Retrieved January 5, 2010 from http:www.aabri.com/manuscripts/09351.pdf
Shiller, R. J. (2006, March 1). Economist's Voice. Retrieved February 19, 2010, from The Berkeley Electronic Press: http://www.bepress.com/ev/vol3/iss4/art4
Shiller, R. J. (2005) Irrational exuberance, Second edition. New Haven, CT. Princeton University Press. Retrieved February 20, 2010 from http://irrationalexuberance.com/definition.htm retrieved 2/20/2020.
The Economist. (2005a, June 16). The Economist: World: In come the waves. Retrieved February 6, 2010, from http://www.economist.com/world/united-states/displaystory.cfm?story_id=E1_QDTDQVG
The Economist. (2005b, June 16). Housing Prices: After the fall. Retrieved February 6, 2010, from http://www.economist.com/opinion/displaystory.cfm?story_id=E1_QDSJQVR
The Economist. (2005c, May 26). The Housing Market: Frenzied Froth. Retrieved February 6, 2010, from http://www.economist.com/world/united-states/displaystory.cfm?story_id=E1_QDTDQVG
Journal of Case Research in Business and Economics
The housing bubble, Page 10
Appendix A
Table 1.
Housing's effect on the GDP
2005 2005 2005 2005 2006 2006 2006 2006
I II III IV I II III IV
Gross Domestic Product 12,534.10 12,587.50 12,683.20 12,748.70 12,915.90 12,962.50 12,965.90 13,060.70
Gross private domestic investment 2,170.30 2,131.50 2,154.90 2,232.20 2,264.70 2,261.20 2,229.60 2,166.00
Residential Fixed Investment 757.7 775.3 783.3 783.5 775.2 740.1 697.4 660.2
Personal consumption expenditures 8,719.00 8,802.90 8,865.60 8,888.50 8,986.60 9,035.00 9,090.70 9,181.60
Housing Services 1,556.60 1,577.70 1,594.30 1,602.80 1,598.90 1,617.80 1,627.60 1,622.50
Residential Fixed Investment + Housing Services 2,314.30 2,353.00 2,377.60 2,386.30 2,374.10 2,357.90 2,325.00 2,282.70
Percentage of Real GDP
Residential Fixed Investment
6.05% 6.16% 6.18% 6.15% 6.00% 5.71% 5.38% 5.05%
Housing Services 12.42% 12.53% 12.57% 12.57% 12.38% 12.48% 12.55% 12.42%
Residential Fixed Investment + Housing Services 18.46% 18.69% 18.75% 18.72% 18.38% 18.19% 17.93% 17.48%
2007 2007 2007 2007 2008 2008 2008 2008
I II III IV I II III IV
Gross Domestic Product 13,099.90 13,204.00 13,321.10 13,391.20 13,366.90 13,415.30 13,324.60 13,141.90
Gross private domestic investment 2,132.60 2,162.20 2,166.50 2,123.40 2,082.90 2,026.50 1,990.70 1,857.70
Residential Fixed Investment 631.7 610.4 572.9 525 483.2 462.9 443.3 415
Personal consumption expenditures 9,265.10 9,291.50 9,335.60 9,363.60 9,349.60 9,351.00 9,267.70 9,195.30
Housing Services 1,629.30 1,630.10 1,634.60 1,633.10 1,643.80 1,647.30 1,641.60 1,656.30
Residential Fixed Investment + Housing Services 2,261.00 2,240.50 2,207.50 2,158.10 2,127.00 2,110.20 2,084.90 2,071.30
Percentage of Real GDP
Residential Fixed Investment
4.82% 4.62% 4.30% 3.92% 3.61% 3.45% 3.33% 3.16%
Housing Services 12.44% 12.35% 12.27% 12.20% 12.30% 12.28% 12.32% 12.60%
Residential Fixed Investment + Housing Services 17.26% 16.97% 16.57% 16.12% 15.91% 15.73% 15.65% 15.76%
Journal of Case Research in Business and Economics
The housing bubble, Page 11
Continue Appendix A
Table 1.
2009 2009 2009 2009 I II III IV
Gross Domestic Product 12,925.40 12,901.50 12,973.00 13,155.00 Gross private domestic investment 1,558.50 1,456.70 1,474.40 1,601.80
Residential Fixed Investment 367.9 344.4 359.6 364.6
Personal consumption expenditures 9,209.20 9,189.00 9,252.60 9,298.50
Housing Services 1,656.90 1,651.80 1,654.00 1,667.80
Residential Fixed Investment + Housing Services 2,024.80 1,996.20 2,013.60 2,032.40
Percentage of Real GDP Residential Fixed Investment
2.85% 2.67% 2.77% 2.77% Housing Services
12.82% 12.80% 12.75% 12.68%
Residential Fixed Investment + Housing Services 15.67% 15.47% 15.52% 15.45%
Source: Valadez, R. M. (2010)
from the following data sources: BEA's Table 1.5.6. Real Gross Domestic Product, Expanded Detail, Chained Dollars
[Billions of chained (2005) dollars] Seasonally adjusted at annual rates
Retrieved: 2/12/2010 Last Revised on January 29, 2010
Figure 1.
Source: Valadez, R.M. (2010) adapted from data retrieved from BEA Table 1.5.6 retrieved 2/12/2010
0.00%
1.00%
2.00%
3.00%
4.00%
5.00%
6.00%
7.00%
8.00%
1 3 5 7 9 11 13 15 17 19
Pe
rce
nta
ge
of
GD
P
Quarters from 2005-2009
U.S. Residential Fixed Investmentas a percentage of GDP
% of Real GDP
Expon. (% of Real GDP)
Journal of Case Research in Business and Economics
The housing bubble, Page 12
Appendix B
Figure 1.
Source: Calculateriskblog.com, retrieved 2/27/2010 from: http://www.calculatedriskblog.com/2009/08/house-prices-real-prices-price-to-rent.html Figure 2.
Source: Calculateriskblog.com, retrieved 2/27/2010 from: http://www.calculatedriskblog.com/2009/08/house-prices-real-prices-price-to-rent.html
Journal of Case Research in Business and Economics
The housing bubble, Page 13
Appendix C
Figure 1.
Source: Shiller, R. J. (2005). Irrational exburance, 2nd ed. New Haven, CT. Princeton University Press. retrieved 2/12/2010 from http://irrationalexuberance.com/
0
100
200
300
400
500
600
700
800
900
1000
0
50
100
150
200
250
1880 1900 1920 1940 1960 1980 2000 2020
Po
pu
lati
on
in
Mil
lio
ns
Ind
ex o
r In
tere
st R
ate
Year
Home Prices
Building CostsPopulation
Interest Rates
Journal of Case Research in Business and Economics
The housing bubble, Page 14
Appendix D
Figure 1.
The following Linear Regression Report was taken from a NCSS software run on February 16, 2010 on the data gathered from First American CoreLogic quarterly changes November 2009 and the BEA Table 1.1.1 last updated January 26, 2010.
Table 1. Run Summary Section
Parameter Value Parameter Value Dependent Variable Real GDP Change Rows Processed 19 Independent Variable HPI Change Rows Used in Estimation 19 Frequency Variable None Rows with X Missing 0 Weight Variable None Rows with Freq Missing 0 Intercept -0.0178 Rows Prediction Only 0 Slope 0.9320 Sum of Frequencies 19 R-Squared 0.4766 Sum of Weights 19.0000 Correlation 0.6904 Coefficient of Variation -3.6044 Mean Square Error 9.526638E-04 Square Root of MSE 3.086525E-02
-0.1
-0.1
0.0
0.1
0.1
-0.1 0.0 0.0 0.0 0.1
∆ Real GDP vs ∆ HPI Last 19 Quarters 2005-2009
∆ Quarterly HPI
∆
Qu
art
erl
y R
ea
l G
DP
Source: Adapted by R.M. Valadez (2010) using data from First American CoreLogic HPI and BEA Table 1.1.1
Journal of Case Research in Business and Economics
The housing bubble, Page 15
Table 2. Descriptive Statistics Section
Parameter Dependent Independent Variable Real GDP Change HPI Change Count 19 19 Mean -0.0086 0.0099 Standard Deviation 0.0415 0.0307 Minimum -0.0888 -0.0640 Maximum 0.0637 0.0540 Table 3. Regression Estimation Section Intercept Slope Parameter B(0) B(1) Regression Coefficients -0.0178 0.9320 Lower 95% Confidence Limit -0.0335 0.4322 Upper 95% Confidence Limit -0.0020 1.4318 Standard Error 0.0075 0.2369 Standardized Coefficient 0.0000 0.6904 T Value -2.3844 3.9345 Prob Level (T Test) 0.0290 0.0011 Reject H0 (Alpha = 0.0500) Yes Yes Power (Alpha = 0.0500) 0.6135 0.9594 Regression of Y on X -0.0178 0.9320 Inverse Regression from X on Y -0.0279 1.9555 Orthogonal Regression of Y and X -0.0237 1.5343 Notes: The above report shows the least-squares estimates of the intercept and slope followed by the corresponding standard errors, confidence intervals, and hypothesis tests. Note that these results are based on several assumptions that should be validated before they are used. Estimated Model: (-1.77851539782626E-02) + ( .932010242483988) * (HPI Change)
Journal of Case Research in Business and Economics
The housing bubble, Page 16
Continue Appendix D
Table 4. Analysis of Variance Section Sum of Mean Prob Power Source DF Squares Square F-Ratio Level (5%) Intercept 1 1.393226E-03 1.393226E-03 Slope 1 1.474764E-02 1.474764E-02 15.4804 0.0011 0.9594 Error 17 1.619528E-02 9.526638E-04 Adj. Total 18 3.094292E-02 1.719051E-03 Total 19 3.233615E-02 s = Square Root(9.526638E-04) = 3.086525E-02 Notes: The above report shows the F-Ratio for testing whether the slope is zero, the degrees of freedom, and the mean square error. The mean square error, which estimates the variance of the residuals, is used extensively in the calculation of hypothesis tests and confidence intervals. Table 5. Tests of Assumptions Section Is the Assumption Test Prob Reasonable at the 0.2000 Assumption/Test Value Level Level of Significance? Residuals follow Normal Distribution? Shapiro Wilk 0.9597 0.567273 Yes Anderson Darling 0.2385 0.781432 Yes D'Agostino Skewness 1.0006 0.317034 Yes D'Agostino Kurtosis -0.1016 0.919105 Yes D'Agostino Omnibus 1.0115 0.603066 Yes Constant Residual Variance? Modified Levene Test 0.1128 0.741141 Yes Relationship is a Straight Line? Lack of Linear Fit F(15, 2) Test 0.1869 0.982383 Yes
Figure 1.
Source: Valadez, R. M. (2010)
-0.1
0.0
0.0
0.0
0.1
-2.0 -1.0 0.0 1.0 2.0
Normal Probability Plot of Residuals of Real GDP last 19 Qtrs
Expected Normals
Resid
uals
of R
eal G
DP
la
st 1
9 Q
trs
Journal of Case Research in Business and Economics
The housing bubble, Page 17
Appendix E
Table 1. Quarterly changes over prior period of the HPI and Real GDP over the last 19
quarters from 1st quarter of 2005 to the 3
rd quarter of 2009
∆ 2005q1 05q2 05q3 05q4 2006q1 06q2 06q3 06q4
Quarterly changes in HPI* 6.37% 3.36% 3.17% 2.11% 2.15% -0.24% -0.21% 0.39%
Quarterly changes in Real
GDP** 4.10% 1.70% 3.10% 2.10% 5.40% 1.40% 0.10% 3.00%
∆ 2007q1 07q2 07q3 07q4 2008q1 08q2 08q3 08q4
Quarterly changes in HPI* -2.65% -1.48% -2.56% -3.64% -5.85% -3.86% -4.35% -7.11%
Quarterly changes in Real
GDP** 1.20% 3.20% 3.60% 2.10% -0.70% 1.50% -2.70% -5.40%
∆ 2009q1 09q2 09q3 09q4
Quarterly changes in HPI* -8.88% 4.24% 2.77%
Quarterly changes in Real
GDP** -6.40% -0.70% 2.20%
Source: Valadez, R. M. (2010) from the following data sources: * First American Corelogic Nov.09-National 3mo (SFC) change retrieved 1/06/2010 from: http://www.loanperformance.com/hpi/notifications_library.aspx
** BEA updated Jan. 26, 2010 retrieved 2/12/2010 from http://www.bea.gov/national/index.htm#gdp.
Journal of Case Research in Business and Economics
The housing bubble, Page 18
Appendix F
Figure 1.
-10.00%
-8.00%
-6.00%
-4.00%
-2.00%
0.00%
2.00%
4.00%
6.00%
8.00%
∆
C
h
a
n
g
e
Quarters
Comparison—∆HPI vs. ∆GDPChange in HPI
Change in GDP
Source: Valadez, R. M. (2010) using data from First American CoreLogic at: http://www.loanperformance.com/hpi/notifications_library.aspx retrieved 1/06/2010and the BEA at: http://www.bea.gov/national/index.htm#gdp, retrieved 2/26/2010