Embed Size (px)
Citation preview
HARRY E. BLOUNT [email protected]
415-274-5452
The HDD Industry Transformed: New Risks and Opportunities Emerge
February 13, 2007February 13, 2007February 13, 2007February 13, 2007
Lehman Brothers does and seeks to do business with companies covered in its research reports. As a result, investors should be aware that the firm may have a conflict of interest that could affect the objectivity of this email communication.
Customers of Lehman Brothers in the United States can receive independent, third-party research on the company or companies covered in this report, at no cost to them, where such research is available. Customers can access this independent research at www.lehmanlive.com or can call 1-800-2-LEHMAN to request a copy of this research.
Investors should consider this communication as only a single factor in making their investment decision
PLEASE SEE ANALYST CERTIFICATIONS AND IMPORTANT DISCLOSURES BEGINNING ON PAGE 39
Harry E. Blount, [email protected]
415-274-5452
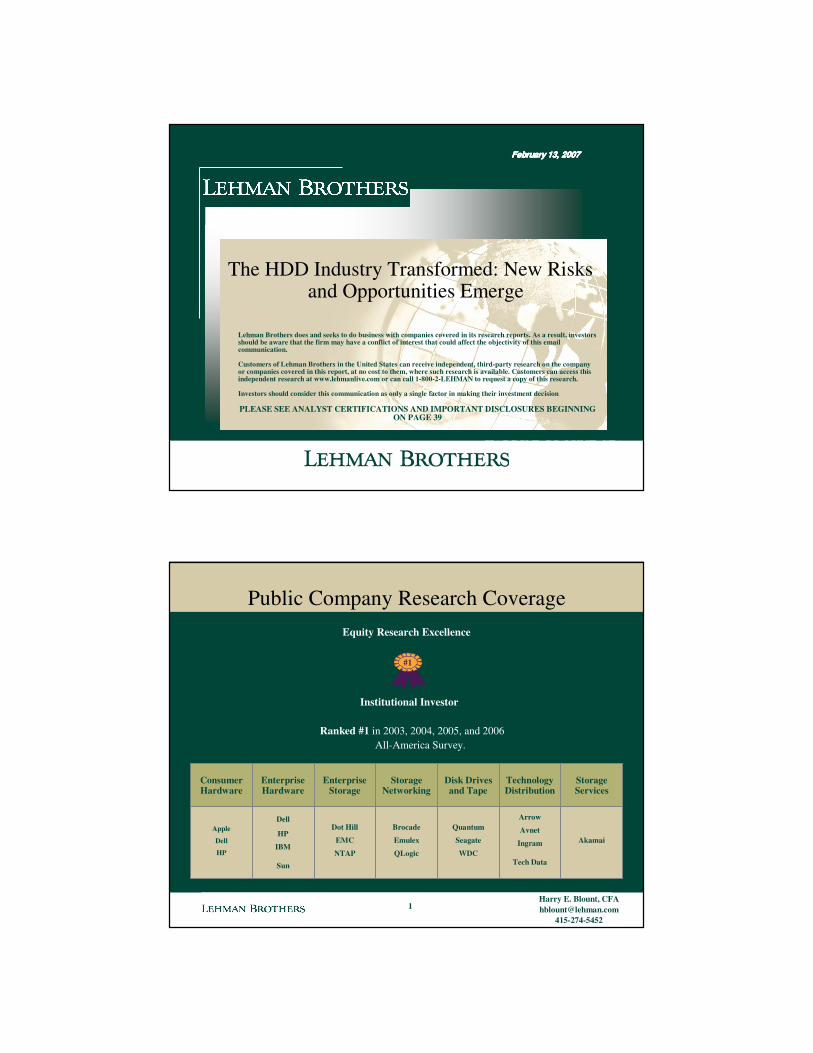
Public Company Research Coverage
EnterpriseHardware
Storage Services
Enterprise Storage
Dot Hill
EMC
NTAP
TechnologyDistribution
Arrow
Avnet
Ingram
Tech Data
Storage Networking
Brocade
Emulex
QLogic
Disk Drives and Tape
Quantum
Seagate
WDC
Consumer Hardware
Apple
Dell
HP
Dell
HP
IBM
Sun
Akamai
Equity Research Excellence
Ranked #1 in 2003, 2004, 2005, and 2006 All-America Survey.
# 3#1
Institutional Investor
1

Harry E. Blount, [email protected]
415-274-5452
Agenda
� Industry Report Card
� Share Shifts
� Competitive Analysis and Outlook
� Where Should HDD Stocks Be Valued?
2
Harry E. Blount, [email protected]
415-274-5452
Industry Report Card
2006 Was a Pretty Good Year
3
Harry E. Blount, [email protected]
415-274-5452
2006 Report Card
Rapid transition to NB likely to continueUNIT GROWTH PC units slowing,
1.8” iPod
STX likely to rebound to pre-MXO levelsMARGINS
Benefit of Mix Likely to Slow, Cost-Optimized
3.5”
Transition to PMR going reasonably well,
Hybrid HDDsTECHNOLOGY
Flash price collapse, Hybrid HDDs,
Ruthenium
Four years in a rowREVENUE GROWTH Slowing units and mix benefits
METRIC 2006 Results 2007 OutlookHDD Stocks
Outperform Broader IT and Indexes
STOCK PERFORMANCE Flash, Hybrids, Seasonality, Margins
CHANNEL PRACTICES What happened in retail in 4Q06?eSys
INDUSTRY CONSOLIDATION
When and how will next consolidation
happen?Maxtor gone, 1-2 more
likely
+
-
+
+
+
+
+/-
Source: Company Reports and Lehman Brothers Estimates4
Harry E. Blount, [email protected]
415-274-5452
Four Consecutive Years of Revenue GrowthHDD Industry Revenue & Y/Y GrowthHDD Industry Revenue & Y/Y GrowthHDD Industry Revenue & Y/Y GrowthHDD Industry Revenue & Y/Y Growth
$0
$5
$10
$15
$20
$25
$30
$35
1990
1991
1992
1993
1994
1995
1996
1997
1998
1999
2000
2001
2002
2003
2004
2005
2006
$ bi
llion
s$
billi
ons
$ bi
llion
s$
billi
ons
(20%)
(15%)
(10%)
(5%)
0%
5%
10%
15%
20%
25%
Y/Y
% grow
thY
/Y %
growth
Y/Y
% grow
thY
/Y %
growth
Total HDD Revenue Y/Y Growth
5
Source: TrendFocus
Harry E. Blount, [email protected]
415-274-5452
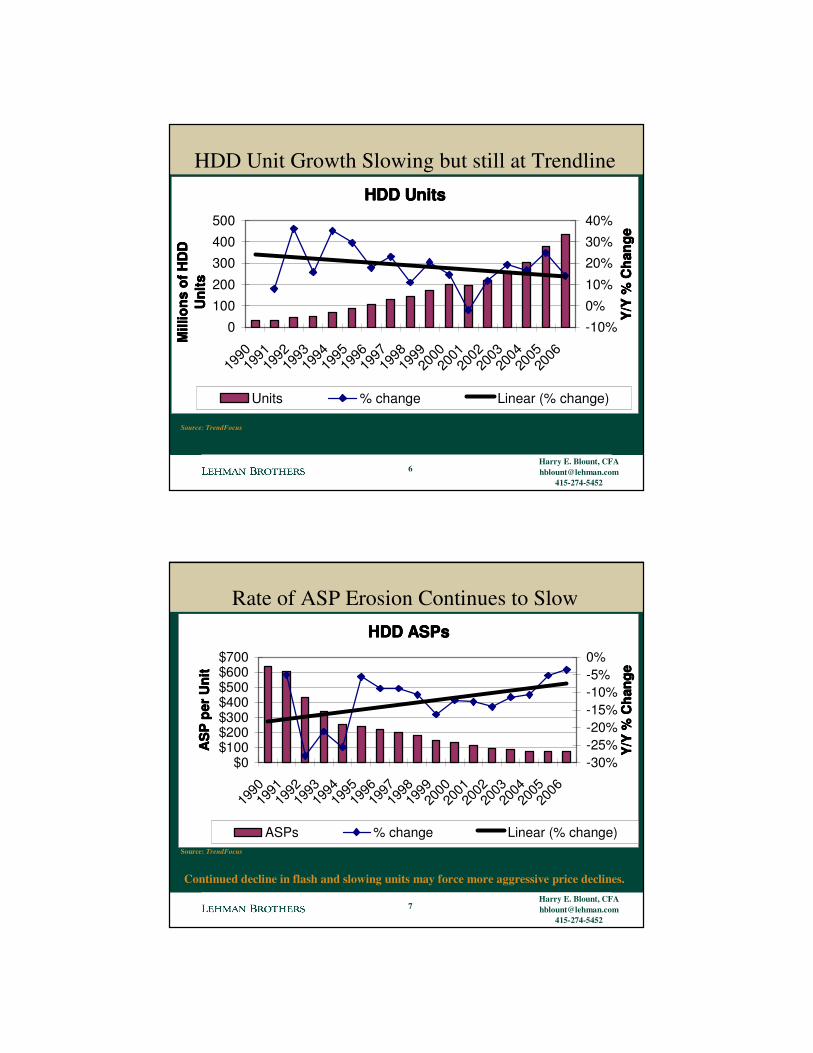
HDD Unit Growth Slowing but still at Trendline
Source: TrendFocus
HDD UnitsHDD UnitsHDD UnitsHDD Units
0
100
200
300
400
500
1990
1991
1992
1993
1994
1995
1996
1997
1998
1999
2000
2001
2002
2003
2004
2005
2006
Mill
ions
of H
DD
M
illio
ns o
f HD
D
Mill
ions
of H
DD
M
illio
ns o
f HD
D
Uni
tsU
nits
Uni
tsU
nits
-10%
0%
10%
20%
30%
40%
Y/Y
% C
hang
eY
/Y %
Cha
nge
Y/Y
% C
hang
eY
/Y %
Cha
nge
Units % change Linear (% change)
6
Harry E. Blount, [email protected]
415-274-5452
Rate of ASP Erosion Continues to Slow
Source: TrendFocus
HDD ASPsHDD ASPsHDD ASPsHDD ASPs
$0$100$200$300$400$500$600$700
1990
1991
1992
1993
1994
1995
1996
1997
1998
1999
2000
2001
2002
2003
2004
2005
2006
AS
P p
er U
nit
AS
P p
er U
nit
AS
P p
er U
nit
AS
P p
er U
nit
-30%-25%-20%-15%-10%-5%0%
Y/Y
% C
hang
eY
/Y %
Cha
nge
Y/Y
% C
hang
eY
/Y %
Cha
nge
ASPs % change Linear (% change)
Continued decline in flash and slowing units may force more aggressive price declines.
7
Harry E. Blount, [email protected]
415-274-5452
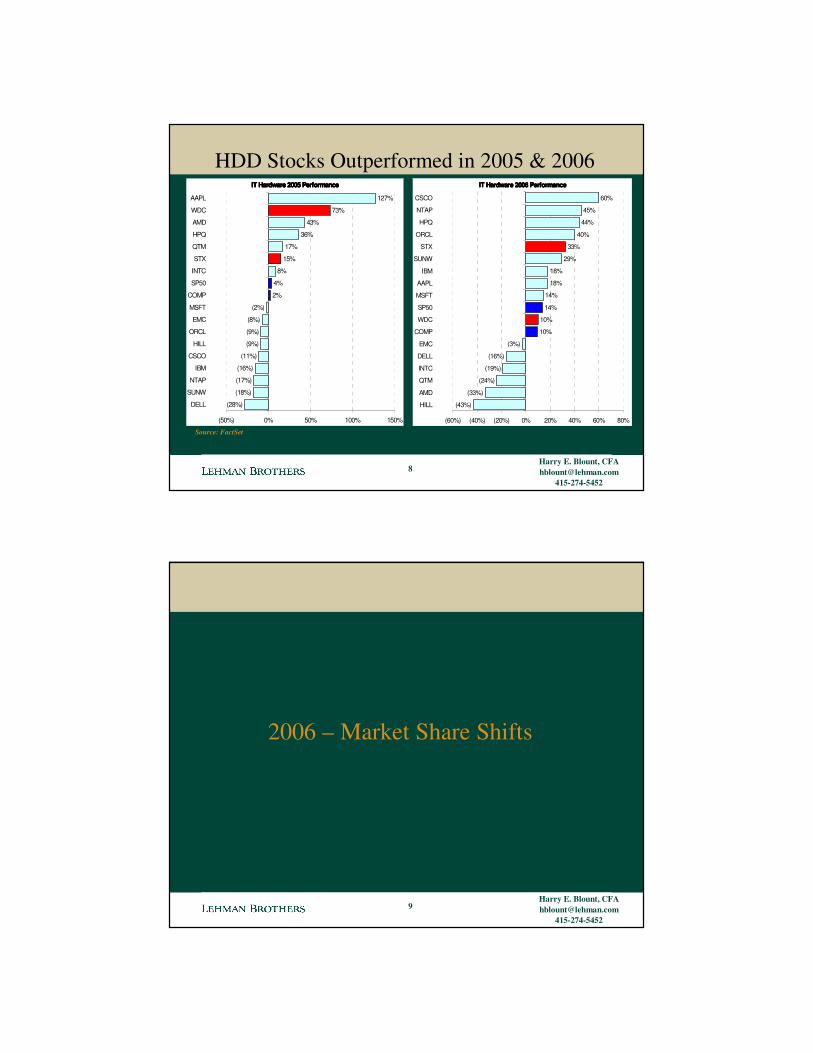
HDD Stocks Outperformed in 2005 & 2006IT Hardware 2005 PerformanceIT Hardware 2005 PerformanceIT Hardware 2005 PerformanceIT Hardware 2005 Performance
73%
15%
8%
4%
2%
(2%)
43%
36%
17%
(8%)
(9%)
(9%)
(11%)
(16%)
(17%)
(18%)
(28%)
127%
(50%) 0% 50% 100% 150%
DELL
SUNW
NTAP
IBM
CSCO
HILL
ORCL
EMC
MSFT
COMP
SP50
INTC
STX
QTM
HPQ
AMD
WDC
AAPL
IT Hardware 2006 PerformanceIT Hardware 2006 PerformanceIT Hardware 2006 PerformanceIT Hardware 2006 Performance
45%
29%
18%
18%
14%
14%
44%
40%
33%
10%
10%
(3%)
(16%)
(19%)
(24%)
(33%)
(43%)
60%
(60%) (40%) (20%) 0% 20% 40% 60% 80%
HILL
AMD
QTM
INTC
DELL
EMC
COMP
WDC
SP50
MSFT
AAPL
IBM
SUNW
STX
ORCL
HPQ
NTAP
CSCO
Source: FactSet
8
Harry E. Blount, [email protected]
415-274-5452
2006 – Market Share Shifts
9
Harry E. Blount, [email protected]
415-274-5452
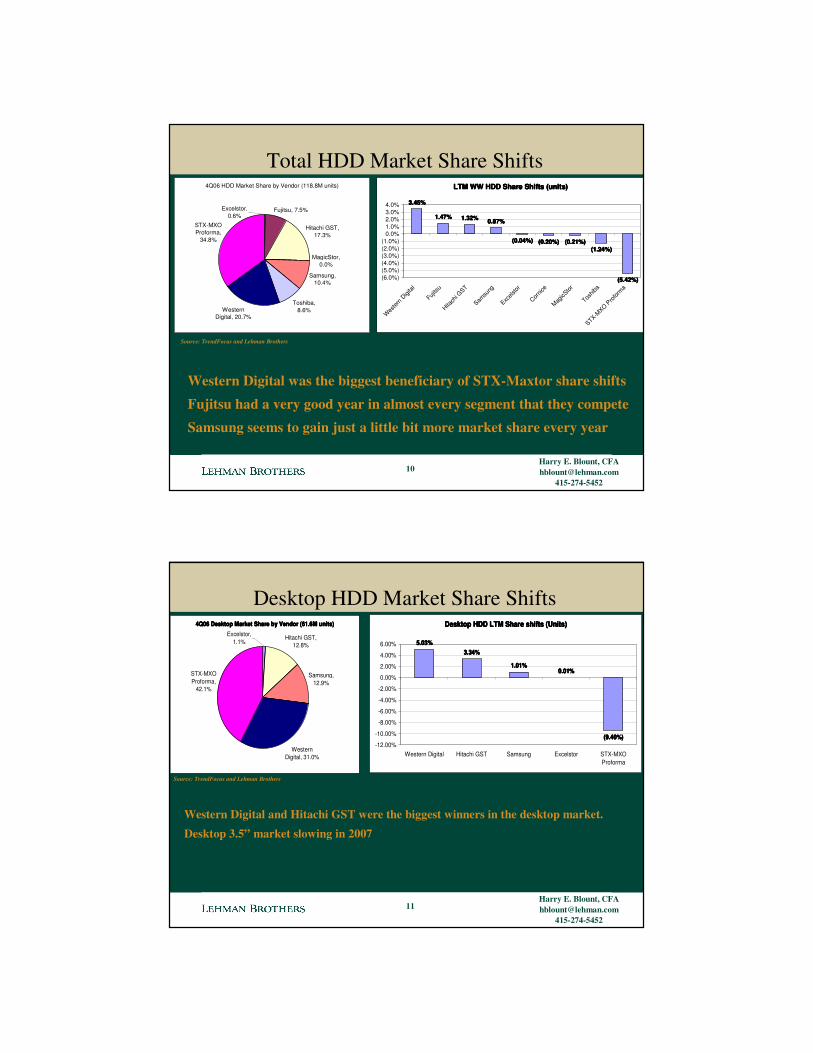
Total HDD Market Share Shifts
Source: TrendFocus and Lehman Brothers
LTM WW HDD Share Shifts (units)LTM WW HDD Share Shifts (units)LTM WW HDD Share Shifts (units)LTM WW HDD Share Shifts (units)
3.45%3.45%3.45%3.45%
1.47%1.47%1.47%1.47% 1.32%1.32%1.32%1.32% 0.87%0.87%0.87%0.87%
(0.04%)(0.04%)(0.04%)(0.04%) (0.20%)(0.20%)(0.20%)(0.20%) (0.21%)(0.21%)(0.21%)(0.21%)(1.24%)(1.24%)(1.24%)(1.24%)
(5.42%)(5.42%)(5.42%)(5.42%)(6.0%)(5.0%)(4.0%)(3.0%)(2.0%)(1.0%)
0.0%1.0%2.0%3.0%4.0%
Wes
tern D
igital
Fujitsu
Hitach
i GST
Samsu
ng
Excels
tor
Cornic
e
MagicS
tor
Toshib
a
STX-MXO P
rofor
ma
4Q06 HDD Market Share by Vendor (118.8M units)
Fujitsu, 7.5%
Hitachi GST, 17.3%
MagicStor, 0.0%
Samsung, 10.4%
Toshiba, 8.6%Western
Digital, 20.7%
STX-MXO Proforma,
34.8%
Excelstor, 0.6%
Western Digital was the biggest beneficiary of STX-Maxtor share shiftsFujitsu had a very good year in almost every segment that they competeSamsung seems to gain just a little bit more market share every year
10
Harry E. Blount, [email protected]
415-274-5452
Desktop HDD Market Share Shifts
Source: TrendFocus and Lehman Brothers
Desktop HDD LTM Share shifts (Units)Desktop HDD LTM Share shifts (Units)Desktop HDD LTM Share shifts (Units)Desktop HDD LTM Share shifts (Units)
5.03%5.03%5.03%5.03%3.34%3.34%3.34%3.34%
1.01%1.01%1.01%1.01%0.01%0.01%0.01%0.01%
(9.40%)(9.40%)(9.40%)(9.40%)-12.00%
-10.00%
-8.00%
-6.00%
-4.00%
-2.00%
0.00%
2.00%
4.00%
6.00%
Western Digital Hitachi GST Samsung Excelstor STX-MXOProforma
4Q06 Desktop Market Share by Vendor (61.6M units)4Q06 Desktop Market Share by Vendor (61.6M units)4Q06 Desktop Market Share by Vendor (61.6M units)4Q06 Desktop Market Share by Vendor (61.6M units)
Hitachi GST, 12.8%
Samsung, 12.9%
Western Digital, 31.0%
STX-MXO Proforma,
42.1%
Excelstor, 1.1%
Western Digital and Hitachi GST were the biggest winners in the desktop market.Desktop 3.5” market slowing in 2007
11
Harry E. Blount, [email protected]
415-274-5452
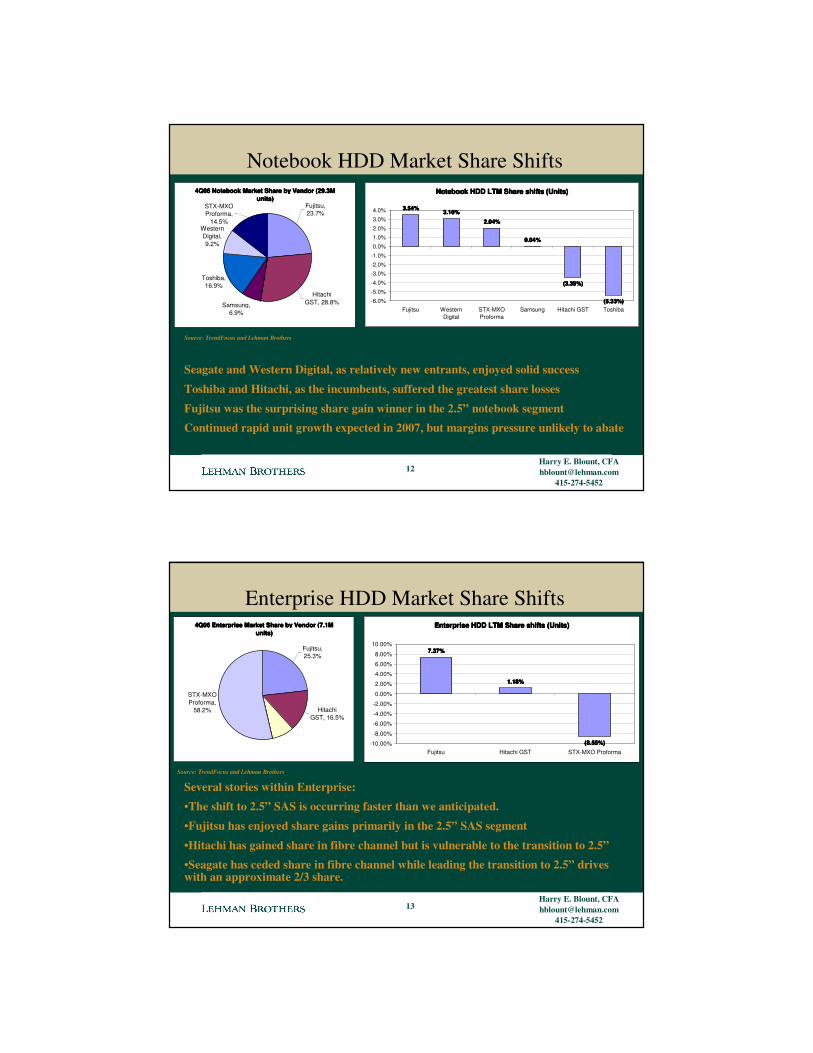
Notebook HDD Market Share Shifts
Seagate and Western Digital, as relatively new entrants, enjoyed solid success
Toshiba and Hitachi, as the incumbents, suffered the greatest share losses
Fujitsu was the surprising share gain winner in the 2.5” notebook segmentContinued rapid unit growth expected in 2007, but margins pressure unlikely to abate
Source: TrendFocus and Lehman Brothers
Notebook HDD LTM Share shifts (Units)Notebook HDD LTM Share shifts (Units)Notebook HDD LTM Share shifts (Units)Notebook HDD LTM Share shifts (Units)
3.54%3.54%3.54%3.54%3.10%3.10%3.10%3.10%
2.04%2.04%2.04%2.04%
0.04%0.04%0.04%0.04%
(3.39%)(3.39%)(3.39%)(3.39%)
(5.33%)(5.33%)(5.33%)(5.33%)-6.0%
-5.0%
-4.0%
-3.0%-2.0%
-1.0%
0.0%
1.0%2.0%
3.0%
4.0%
Fujitsu WesternDigital
STX-MXOProforma
Samsung Hitachi GST Toshiba
4Q06 Notebook Market Share by Vendor (29.3M 4Q06 Notebook Market Share by Vendor (29.3M 4Q06 Notebook Market Share by Vendor (29.3M 4Q06 Notebook Market Share by Vendor (29.3M units)units)units)units)
Samsung, 6.9%
Toshiba, 16.9%
Western Digital, 9.2%
Hitachi GST, 28.8%
Fujitsu, 23.7%
STX-MXO Proforma,
14.5%
12
Harry E. Blount, [email protected]
415-274-5452
Enterprise HDD Market Share Shifts
Several stories within Enterprise:•The shift to 2.5” SAS is occurring faster than we anticipated.
•Fujitsu has enjoyed share gains primarily in the 2.5” SAS segment
•Hitachi has gained share in fibre channel but is vulnerable to the transition to 2.5”•Seagate has ceded share in fibre channel while leading the transition to 2.5” drives with an approximate 2/3 share.
Source: TrendFocus and Lehman Brothers
Enterprise HDD LTM Share shifts (Units)Enterprise HDD LTM Share shifts (Units)Enterprise HDD LTM Share shifts (Units)Enterprise HDD LTM Share shifts (Units)
7.37%7.37%7.37%7.37%
1.18%1.18%1.18%1.18%
(8.55%)(8.55%)(8.55%)(8.55%)-10.00%
-8.00%
-6.00%
-4.00%
-2.00%
0.00%
2.00%
4.00%
6.00%
8.00%
10.00%
Fujitsu Hitachi GST STX-MXO Proforma
4Q06 Enterprise Market Share by Vendor (7.1M 4Q06 Enterprise Market Share by Vendor (7.1M 4Q06 Enterprise Market Share by Vendor (7.1M 4Q06 Enterprise Market Share by Vendor (7.1M units)units)units)units)
STX-MXO Proforma,
58.2% Hitachi GST, 16.5%
Fujitsu, 25.3%
13
Harry E. Blount, [email protected]
415-274-5452
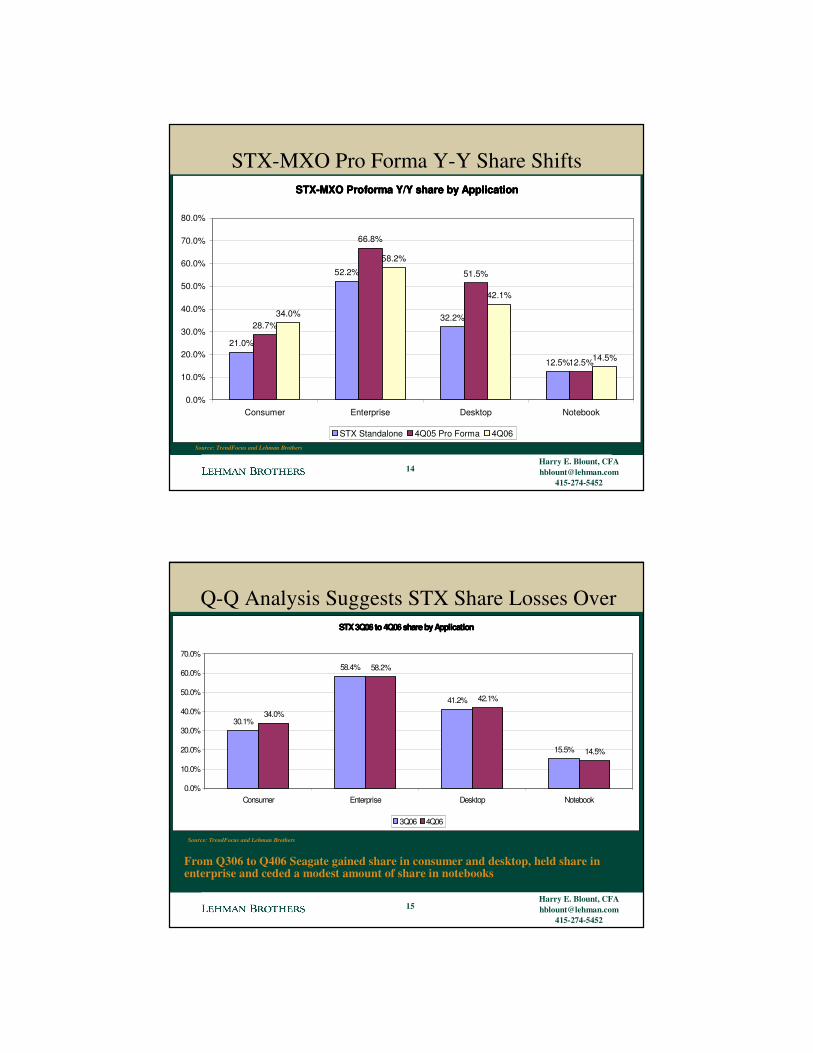
STX-MXO Pro Forma Y-Y Share Shifts
Source: TrendFocus and Lehman Brothers
STX-MXO Proforma Y/Y share by ApplicationSTX-MXO Proforma Y/Y share by ApplicationSTX-MXO Proforma Y/Y share by ApplicationSTX-MXO Proforma Y/Y share by Application
21.0%
52.2%
32.2%
12.5%
28.7%
66.8%
51.5%
12.5%
34.0%
58.2%
42.1%
14.5%
0.0%
10.0%
20.0%
30.0%
40.0%
50.0%
60.0%
70.0%
80.0%
Consumer Enterprise Desktop Notebook
STX Standalone 4Q05 Pro Forma 4Q06
14
Harry E. Blount, [email protected]
415-274-5452
Q-Q Analysis Suggests STX Share Losses Over
Source: TrendFocus and Lehman Brothers
STX 3Q06 to 4Q06 share by ApplicationSTX 3Q06 to 4Q06 share by ApplicationSTX 3Q06 to 4Q06 share by ApplicationSTX 3Q06 to 4Q06 share by Application
30.1%
58.4%
41.2%
15.5%
34.0%
58.2%
42.1%
14.5%
0.0%
10.0%
20.0%
30.0%
40.0%
50.0%
60.0%
70.0%
Consumer Enterprise Desktop Notebook
3Q06 4Q06
From Q306 to Q406 Seagate gained share in consumer and desktop, held share in enterprise and ceded a modest amount of share in notebooks
15
Harry E. Blount, [email protected]
415-274-5452
Competitive Analysis
16
Harry E. Blount, [email protected]
415-274-5452
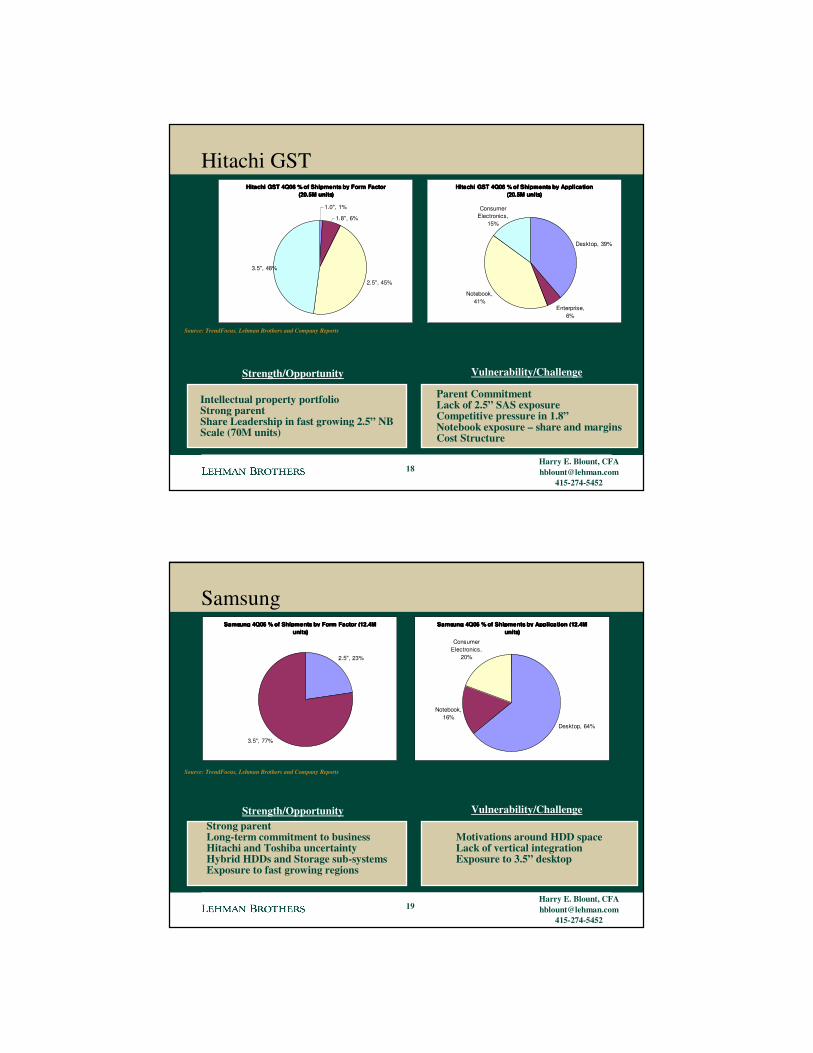
FujitsuFujitsu 4Q06 % of Shipments by Application (8.9 units)Fujitsu 4Q06 % of Shipments by Application (8.9 units)Fujitsu 4Q06 % of Shipments by Application (8.9 units)Fujitsu 4Q06 % of Shipments by Application (8.9 units)
Enterprise, 20.2%
Notebook, 78.0%
Consumer Electronics,
1.8%
Fujitsu 4Q06 % of Shipments by Form Factor (8.9 units)Fujitsu 4Q06 % of Shipments by Form Factor (8.9 units)Fujitsu 4Q06 % of Shipments by Form Factor (8.9 units)Fujitsu 4Q06 % of Shipments by Form Factor (8.9 units)
2.5", 83.8%
3.5", 16.2%
Source: TrendFocus, Lehman Brothers and Company Reports
Strength/Opportunity Vulnerability/Challenge
Early Move into 2.5” Enterprise SASHitachi uncertainty Alternative to Seagate in enterprise
Notebook exposure – share and marginsWestern Digital entrance into enterpriseLack of scale (30M units in 2006)
17
Harry E. Blount, [email protected]
415-274-5452
Hitachi GSTHitachi GST 4Q06 % of Shipments by Application Hitachi GST 4Q06 % of Shipments by Application Hitachi GST 4Q06 % of Shipments by Application Hitachi GST 4Q06 % of Shipments by Application
(20.5M units)(20.5M units)(20.5M units)(20.5M units)
Desktop, 39%
Enterprise, 6%
Notebook, 41%
Consumer Electronics,
15%
Hitachi GST 4Q06 % of Shipments by Form Factor Hitachi GST 4Q06 % of Shipments by Form Factor Hitachi GST 4Q06 % of Shipments by Form Factor Hitachi GST 4Q06 % of Shipments by Form Factor (20.5M units)(20.5M units)(20.5M units)(20.5M units)
1.0", 1%
1.8", 6%
2.5", 45%
3.5", 48%
Source: TrendFocus, Lehman Brothers and Company Reports
Strength/Opportunity Vulnerability/Challenge
Intellectual property portfolioStrong parentShare Leadership in fast growing 2.5” NBScale (70M units)
Parent CommitmentLack of 2.5” SAS exposureCompetitive pressure in 1.8”Notebook exposure – share and marginsCost Structure
18
Harry E. Blount, [email protected]
415-274-5452
SamsungSamsung 4Q06 % of Shipments by Application (12.4M Samsung 4Q06 % of Shipments by Application (12.4M Samsung 4Q06 % of Shipments by Application (12.4M Samsung 4Q06 % of Shipments by Application (12.4M
units)units)units)units)
Desktop, 64%
Notebook, 16%
Consumer Electronics,
20%
Samsung 4Q06 % of Shipments by Form Factor (12.4M Samsung 4Q06 % of Shipments by Form Factor (12.4M Samsung 4Q06 % of Shipments by Form Factor (12.4M Samsung 4Q06 % of Shipments by Form Factor (12.4M units)units)units)units)
2.5", 23%
3.5", 77%
Source: TrendFocus, Lehman Brothers and Company Reports
Strength/Opportunity Vulnerability/ChallengeStrong parentLong-term commitment to businessHitachi and Toshiba uncertaintyHybrid HDDs and Storage sub-systemsExposure to fast growing regions
Motivations around HDD spaceLack of vertical integrationExposure to 3.5” desktop
19
Harry E. Blount, [email protected]
415-274-5452
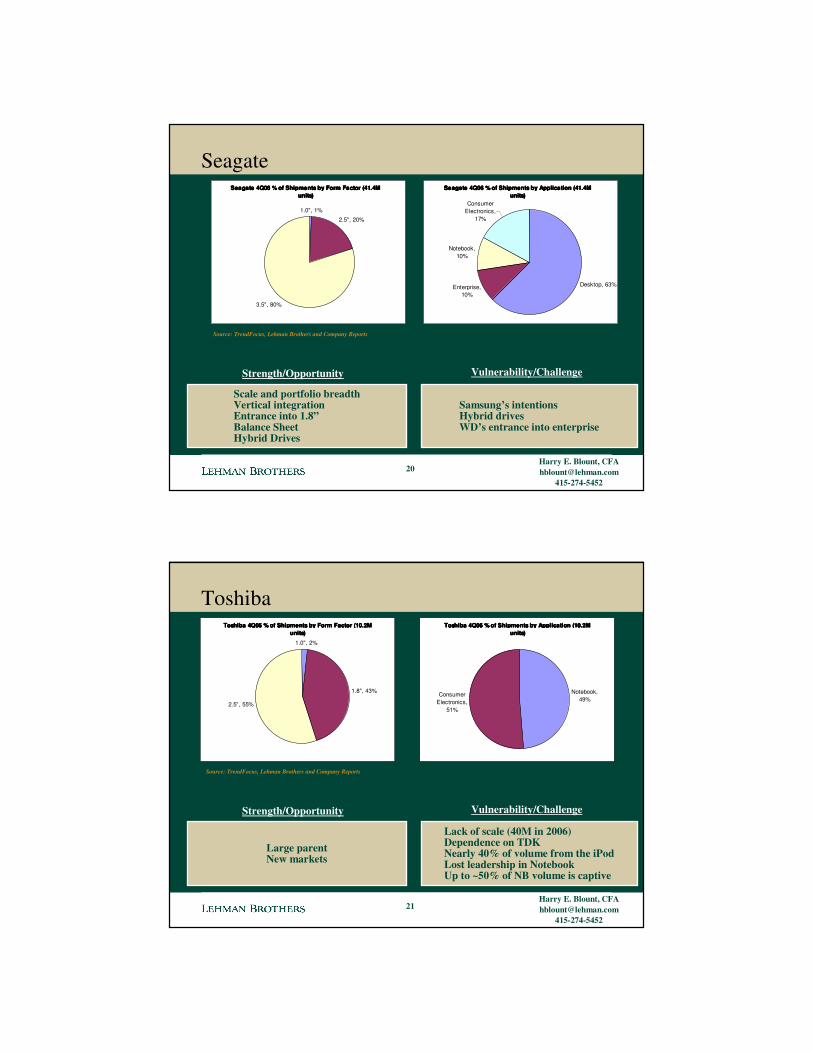
SeagateSeagate 4Q06 % of Shipments by Application (41.4M Seagate 4Q06 % of Shipments by Application (41.4M Seagate 4Q06 % of Shipments by Application (41.4M Seagate 4Q06 % of Shipments by Application (41.4M
units)units)units)units)
Desktop, 63%Enterprise, 10%
Notebook, 10%
Consumer Electronics,
17%
Seagate 4Q06 % of Shipments by Form Factor (41.4M Seagate 4Q06 % of Shipments by Form Factor (41.4M Seagate 4Q06 % of Shipments by Form Factor (41.4M Seagate 4Q06 % of Shipments by Form Factor (41.4M units)units)units)units)
1.0", 1%
2.5", 20%
3.5", 80%
Source: TrendFocus, Lehman Brothers and Company Reports
Strength/Opportunity Vulnerability/Challenge
Scale and portfolio breadthVertical integrationEntrance into 1.8”Balance SheetHybrid Drives
Samsung’s intentionsHybrid drivesWD’s entrance into enterprise
20
Harry E. Blount, [email protected]
415-274-5452
ToshibaToshiba 4Q06 % of Shipments by Application (10.2M Toshiba 4Q06 % of Shipments by Application (10.2M Toshiba 4Q06 % of Shipments by Application (10.2M Toshiba 4Q06 % of Shipments by Application (10.2M
units)units)units)units)
Notebook, 49%
Consumer Electronics,
51%
Toshiba 4Q06 % of Shipments by Form Factor (10.2M Toshiba 4Q06 % of Shipments by Form Factor (10.2M Toshiba 4Q06 % of Shipments by Form Factor (10.2M Toshiba 4Q06 % of Shipments by Form Factor (10.2M units)units)units)units)
1.0", 2%
1.8", 43%
2.5", 55%
Source: TrendFocus, Lehman Brothers and Company Reports
Strength/Opportunity Vulnerability/Challenge
Large parentNew markets
Lack of scale (40M in 2006)Dependence on TDKNearly 40% of volume from the iPodLost leadership in NotebookUp to ~50% of NB volume is captive
21
Harry E. Blount, [email protected]
415-274-5452
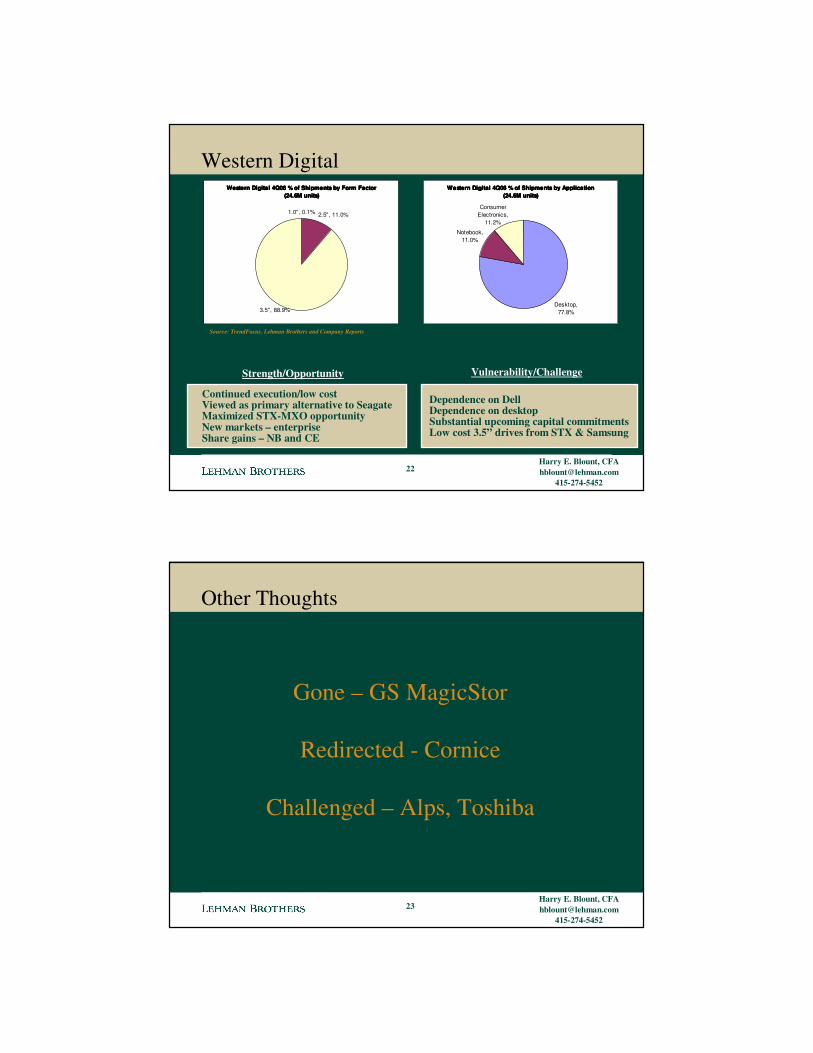
Western DigitalWestern Digital 4Q06 % of Shipments by Application Western Digital 4Q06 % of Shipments by Application Western Digital 4Q06 % of Shipments by Application Western Digital 4Q06 % of Shipments by Application
(24.6M units)(24.6M units)(24.6M units)(24.6M units)
Desktop, 77.8%
Notebook, 11.0%
Consumer Electronics,
11.2%
Western Digital 4Q06 % of Shipments by Form Factor Western Digital 4Q06 % of Shipments by Form Factor Western Digital 4Q06 % of Shipments by Form Factor Western Digital 4Q06 % of Shipments by Form Factor (24.6M units)(24.6M units)(24.6M units)(24.6M units)
1.0", 0.1% 2.5", 11.0%
3.5", 88.9%
Source: TrendFocus, Lehman Brothers and Company Reports
Strength/Opportunity Vulnerability/Challenge
Continued execution/low costViewed as primary alternative to SeagateMaximized STX-MXO opportunityNew markets – enterpriseShare gains – NB and CE
Dependence on DellDependence on desktopSubstantial upcoming capital commitmentsLow cost 3.5” drives from STX & Samsung
22
Harry E. Blount, [email protected]
415-274-5452
Gone – GS MagicStor
Redirected - Cornice
Challenged – Alps, Toshiba
Other Thoughts
23
Harry E. Blount, [email protected]
415-274-5452
2007 Outlook – Partly Cloudy
Desktop PC SlowingThe year of the 2.5” (Enterprise, Consumer and desktop)
Rapid but Hollow Notebook Unit Growth
24
Harry E. Blount, [email protected]
415-274-5452
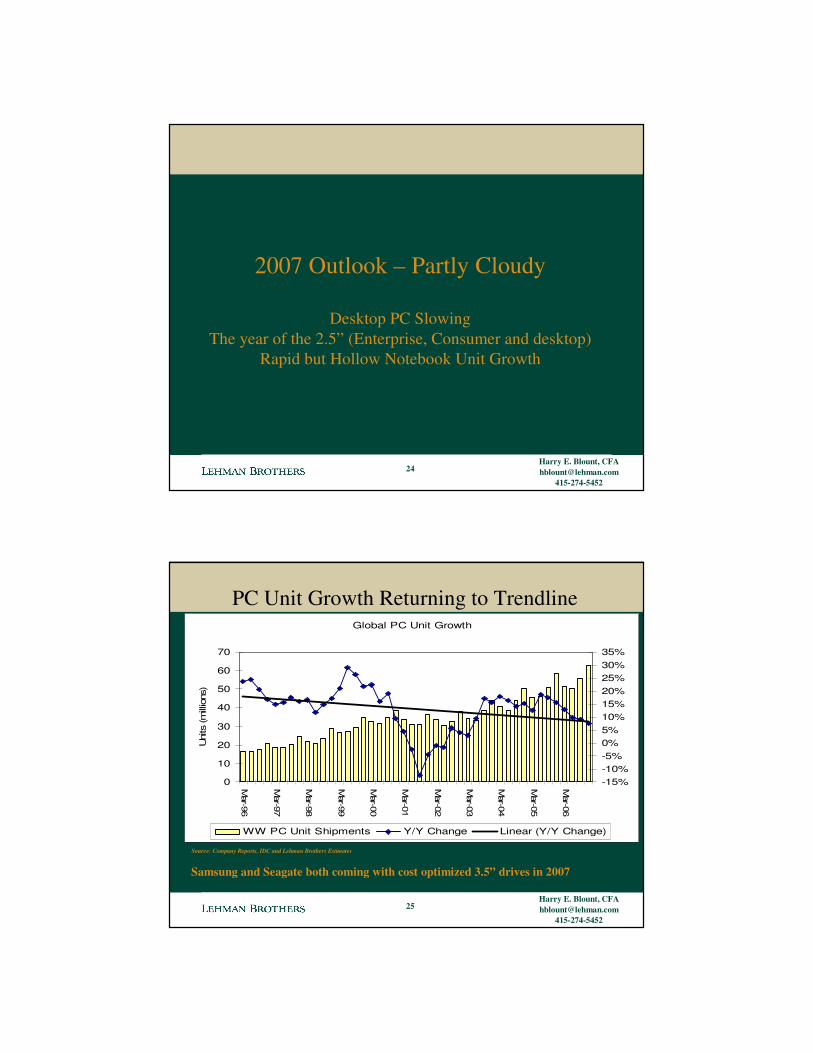
PC Unit Growth Returning to Trendline
Source: Company Reports, IDC and Lehman Brothers Estimates
Global PC Unit Growth
0
10
20
30
40
50
60
70
Mar-96
Mar-97
Mar-98
Mar-99
Mar-00
Mar-01
Mar-02
Mar-03
Mar-04
Mar-05
Mar-06
Uni
ts (m
illio
ns)
-15%-10%-5%0%5%10%15%20%25%30%35%
WW PC Unit Shipments Y/Y Change Linear (Y/Y Change)
25
Samsung and Seagate both coming with cost optimized 3.5” drives in 2007
Harry E. Blount, [email protected]
415-274-5452
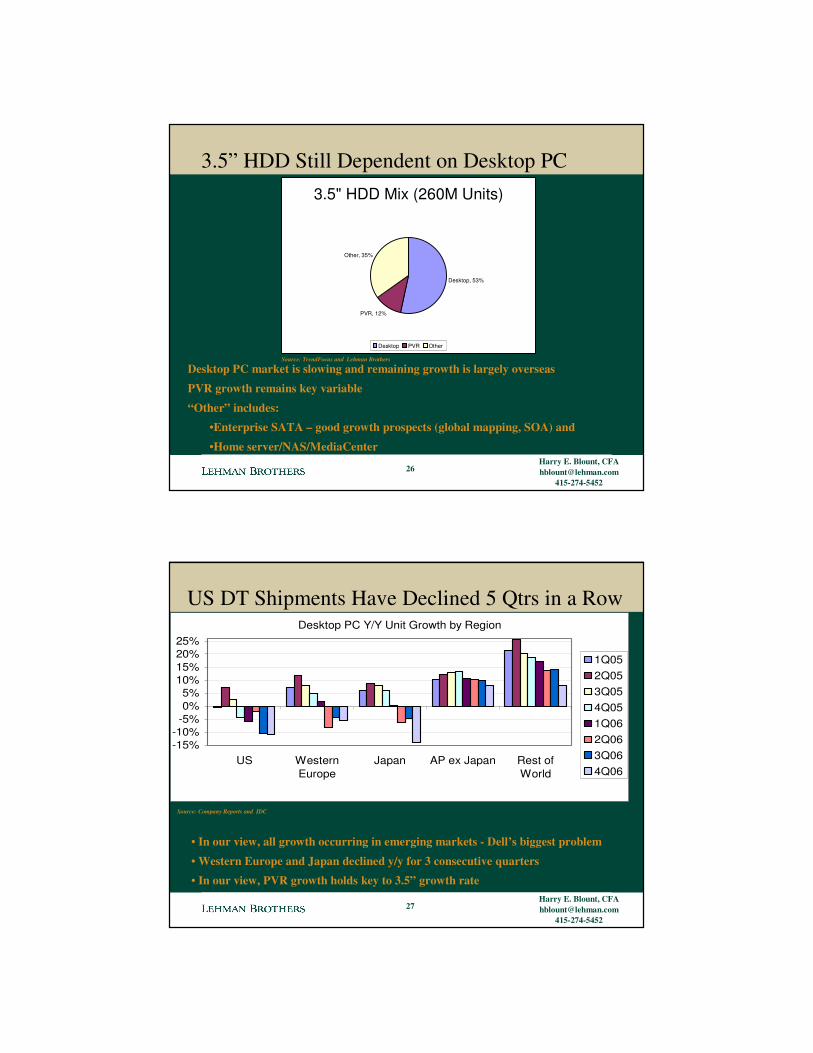
3.5” HDD Still Dependent on Desktop PC
Source: TrendFocus and Lehman Brothers
Desktop PC market is slowing and remaining growth is largely overseas
PVR growth remains key variable
“Other” includes: •Enterprise SATA – good growth prospects (global mapping, SOA) and
•Home server/NAS/MediaCenter
3.5" HDD Mix (260M Units)
Desktop, 53%
PVR, 12%
Other, 35%
Desktop PVR Other
26
Harry E. Blount, [email protected]
415-274-5452
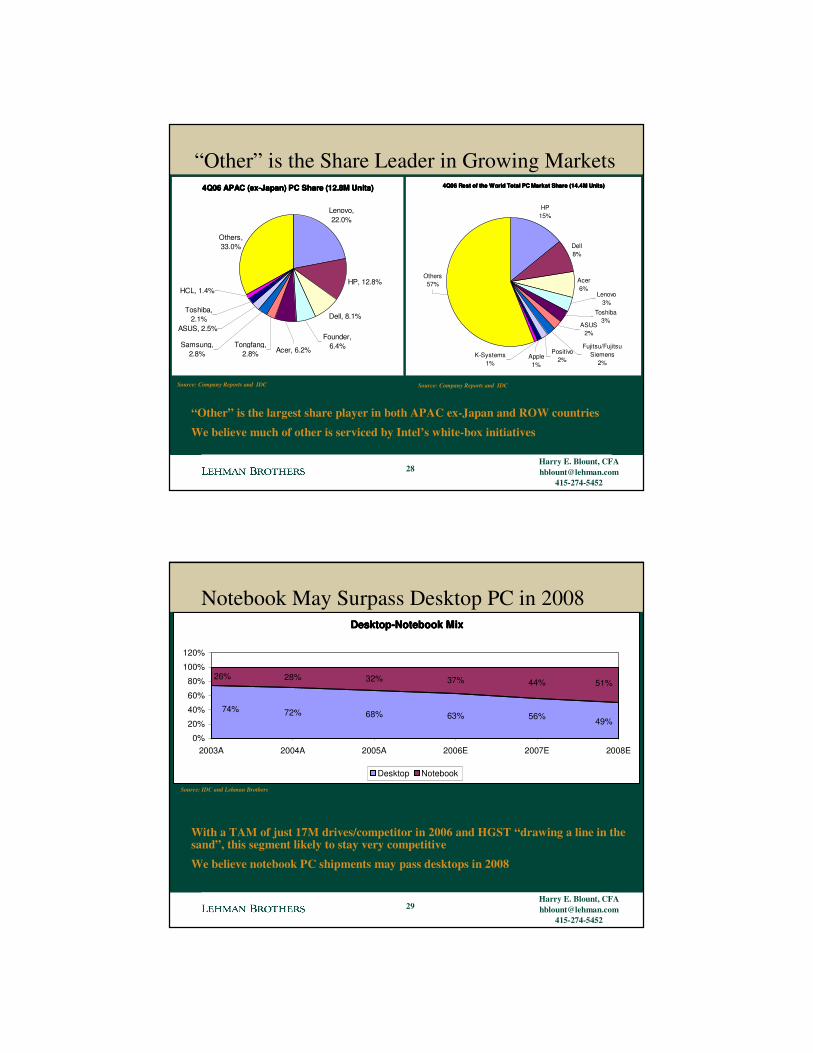
US DT Shipments Have Declined 5 Qtrs in a Row
Source: Company Reports and IDC
Desktop PC Y/Y Unit Growth by Region
-15%-10%-5%0%5%
10%15%20%25%
US WesternEurope
Japan AP ex Japan Rest ofWorld
1Q052Q053Q054Q051Q062Q063Q064Q06
• In our view, all growth occurring in emerging markets - Dell’s biggest problem
• Western Europe and Japan declined y/y for 3 consecutive quarters• In our view, PVR growth holds key to 3.5” growth rate
27
Harry E. Blount, [email protected]
415-274-5452
“Other” is the Share Leader in Growing Markets
Source: Company Reports and IDC
4Q06 APAC (ex-Japan) PC Share (12.8M Units)4Q06 APAC (ex-Japan) PC Share (12.8M Units)4Q06 APAC (ex-Japan) PC Share (12.8M Units)4Q06 APAC (ex-Japan) PC Share (12.8M Units)
Lenovo, 22.0%
HP, 12.8%
Dell, 8.1%
Founder, 6.4%
Others, 33.0%
HCL, 1.4%
Toshiba, 2.1%
ASUS, 2.5%
Acer, 6.2%Tongfang,
2.8%Samsung,
2.8%
4Q06 Rest of the World Total PC Market Share (14.4M Units)4Q06 Rest of the World Total PC Market Share (14.4M Units)4Q06 Rest of the World Total PC Market Share (14.4M Units)4Q06 Rest of the World Total PC Market Share (14.4M Units)
HP15%
Dell8%
Acer6%
Others57%
Positivo2%Apple
1%K-Systems
1%
Fujitsu/Fujitsu Siemens
2%
ASUS2%
Toshiba3%
Lenovo3%
Source: Company Reports and IDC
“Other” is the largest share player in both APAC ex-Japan and ROW countries
We believe much of other is serviced by Intel’s white-box initiatives
28
Harry E. Blount, [email protected]
415-274-5452
Notebook May Surpass Desktop PC in 2008
Source: IDC and Lehman Brothers
With a TAM of just 17M drives/competitor in 2006 and HGST “drawing a line in the sand”, this segment likely to stay very competitive
We believe notebook PC shipments may pass desktops in 2008
Desktop-Notebook MixDesktop-Notebook MixDesktop-Notebook MixDesktop-Notebook Mix
72% 68% 63%
28% 32% 37% 44%
74%56% 49%
26%51%
0%
20%
40%
60%
80%
100%
120%
2003A 2004A 2005A 2006E 2007E 2008E
Desktop Notebook
29
Harry E. Blount, [email protected]
415-274-5452
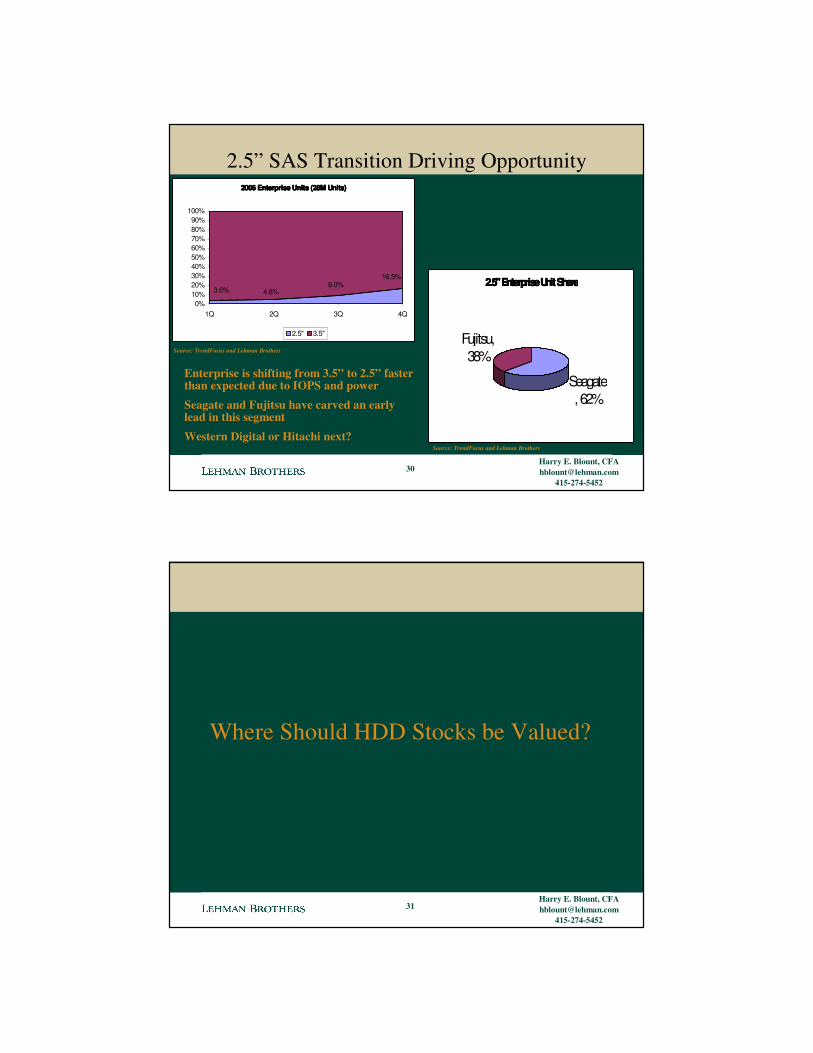
2.5” SAS Transition Driving Opportunity
Source: TrendFocus and Lehman Brothers
Enterprise is shifting from 3.5” to 2.5” faster than expected due to IOPS and powerSeagate and Fujitsu have carved an early lead in this segmentWestern Digital or Hitachi next?
2006 Enterprise Units (28M Units)2006 Enterprise Units (28M Units)2006 Enterprise Units (28M Units)2006 Enterprise Units (28M Units)
16.5%9.0%
4.8%3.6%
0%10%20%30%40%50%60%70%80%90%
100%
1Q 2Q 3Q 4Q
2.5" 3.5"
2.5" Enterprise Unit Share2.5" Enterprise Unit Share2.5" Enterprise Unit Share2.5" Enterprise Unit Share
Seagate, 62%
Fujitsu, 38%
Source: TrendFocus and Lehman Brothers
30
Harry E. Blount, [email protected]
415-274-5452
Where Should HDD Stocks be Valued?
31
Harry E. Blount, [email protected]
415-274-5452
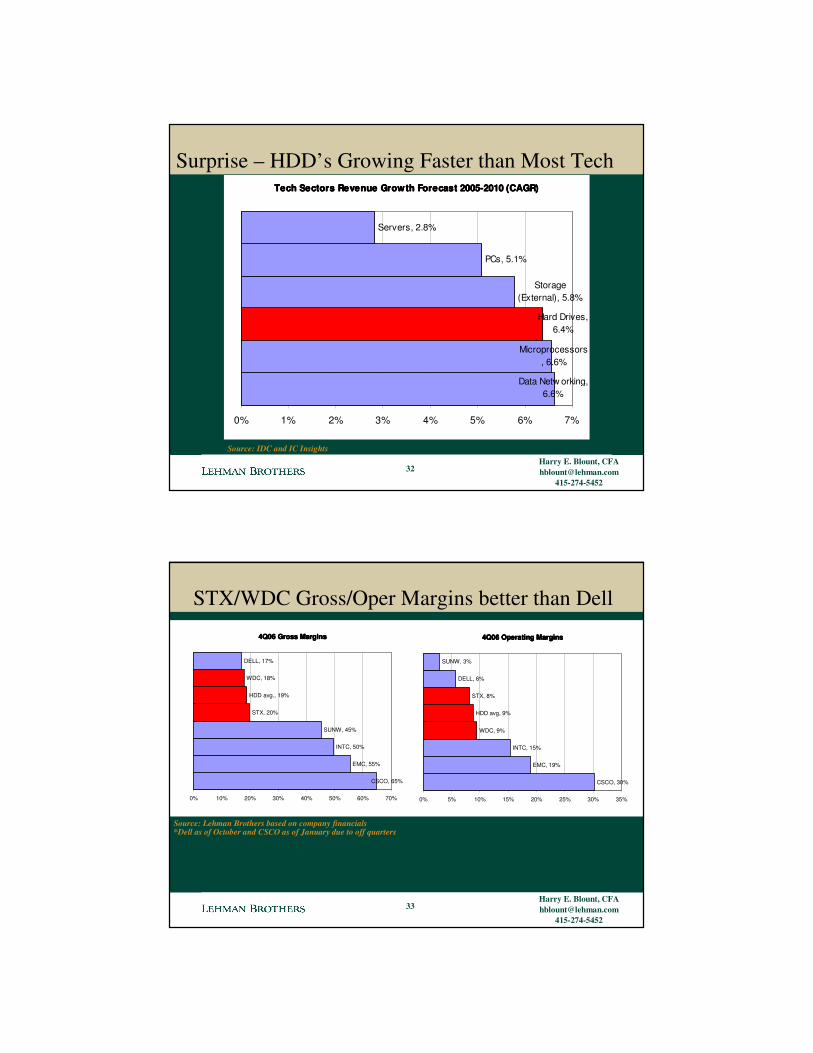
Surprise – HDD’s Growing Faster than Most Tech
Source: IDC and IC Insights
Tech Sectors Revenue Growth Forecast 2005-2010 (CAGR)Tech Sectors Revenue Growth Forecast 2005-2010 (CAGR)Tech Sectors Revenue Growth Forecast 2005-2010 (CAGR)Tech Sectors Revenue Growth Forecast 2005-2010 (CAGR)
Data Netw orking, 6.6%
Microprocessors, 6.6%
Hard Drives, 6.4%
Storage (External), 5.8%
PCs, 5.1%
Servers, 2.8%
0% 1% 2% 3% 4% 5% 6% 7%
32
Harry E. Blount, [email protected]
415-274-5452
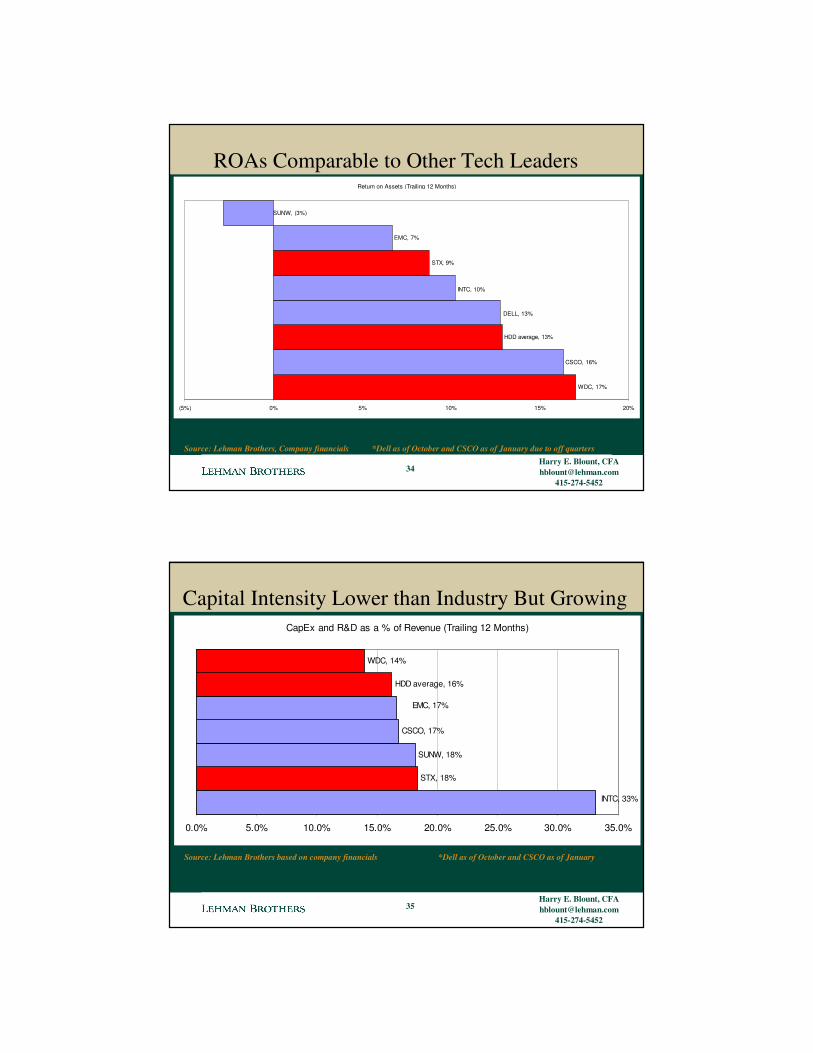
STX/WDC Gross/Oper Margins better than Dell
Source: Lehman Brothers based on company financials*Dell as of October and CSCO as of January due to off quarters
4Q06 Gross Margins4Q06 Gross Margins4Q06 Gross Margins4Q06 Gross Margins
CSCO, 65%
EMC, 55%
INTC, 50%
SUNW, 45%
STX, 20%
HDD avg., 19%
WDC, 18%
DELL, 17%
0% 10% 20% 30% 40% 50% 60% 70%
4Q06 Operating Margins4Q06 Operating Margins4Q06 Operating Margins4Q06 Operating Margins
CSCO, 30%
EMC, 19%
INTC, 15%
WDC, 9%
HDD avg, 9%
STX, 8%
DELL, 6%
SUNW, 3%
0% 5% 10% 15% 20% 25% 30% 35%
33
Harry E. Blount, [email protected]
415-274-5452
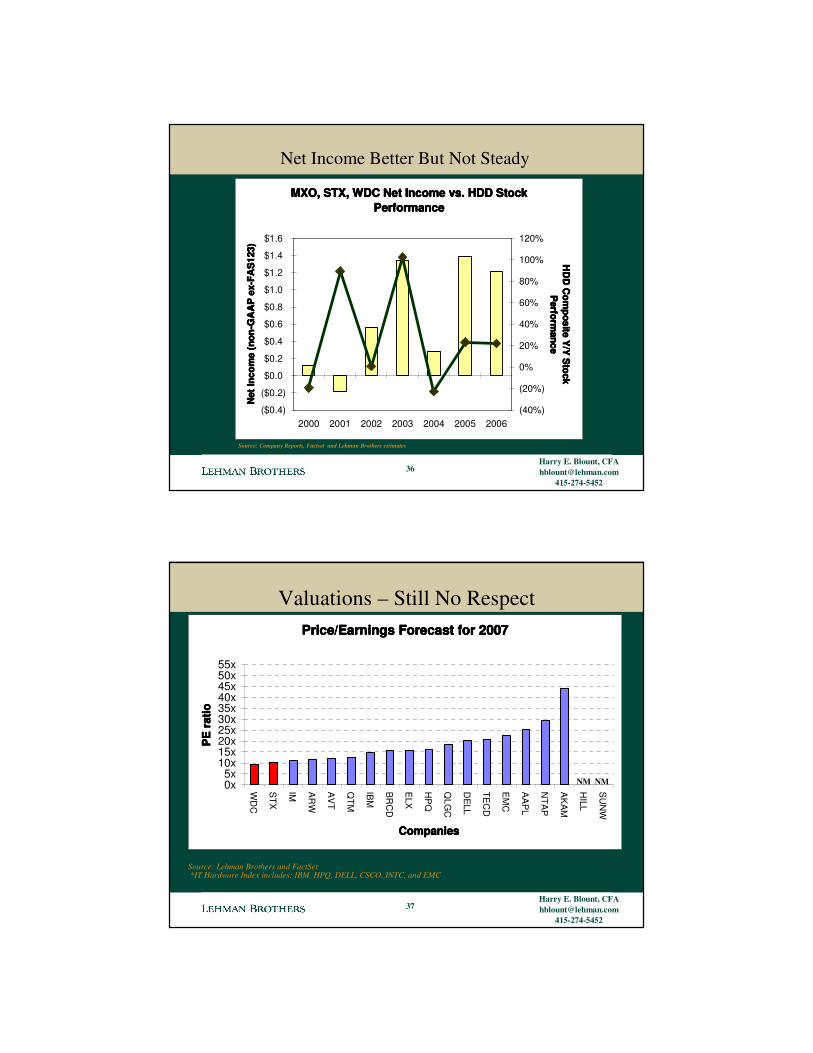
ROAs Comparable to Other Tech Leaders
Source: Lehman Brothers, Company financials *Dell as of October and CSCO as of January due to off quarters
Return on Assets (Trailing 12 Months)
CSCO, 16%
HDD average, 13%
EMC, 7%
WDC, 17%
SUNW, (3%)
DELL, 13%
INTC, 10%
STX, 9%
(5%) 0% 5% 10% 15% 20%
34
Harry E. Blount, [email protected]
415-274-5452
Capital Intensity Lower than Industry But Growing
Source: Lehman Brothers based on company financials *Dell as of October and CSCO as of January
CapEx and R&D as a % of Revenue (Trailing 12 Months)
STX, 18%
SUNW, 18%
CSCO, 17%
WDC, 14%
INTC, 33%
HDD average, 16%
EMC, 17%
0.0% 5.0% 10.0% 15.0% 20.0% 25.0% 30.0% 35.0%
35
Harry E. Blount, [email protected]
415-274-5452
Net Income Better But Not Steady
MXO, STX, WDC Net Income vs. HDD Stock MXO, STX, WDC Net Income vs. HDD Stock MXO, STX, WDC Net Income vs. HDD Stock MXO, STX, WDC Net Income vs. HDD Stock Performance Performance Performance Performance
($0.4)
($0.2)
$0.0
$0.2
$0.4
$0.6
$0.8
$1.0
$1.2
$1.4
$1.6
2000 2001 2002 2003 2004 2005 2006
Net
Inco
me
(non
-GA
AP
ex-
FAS
123)
Net
Inco
me
(non
-GA
AP
ex-
FAS
123)
Net
Inco
me
(non
-GA
AP
ex-
FAS
123)
Net
Inco
me
(non
-GA
AP
ex-
FAS
123)
(40%)
(20%)
0%
20%
40%
60%
80%
100%
120%H
DD
Com
posite Y/Y
Stock
HD
D C
omposite Y
/Y S
tock H
DD
Com
posite Y/Y
Stock
HD
D C
omposite Y
/Y S
tock P
erformance
Perform
anceP
erformance
Perform
ance
Source: Company Reports, Factset and Lehman Brothers estimates
36
Harry E. Blount, [email protected]
415-274-5452
Valuations – Still No Respect
Source: Lehman Brothers, IDC, and First Call
Source: Lehman Brothers and FactSet*IT Hardware Index includes: IBM, HPQ, DELL, CSCO, INTC, and EMC
Price/Earnings Forecast for 2007Price/Earnings Forecast for 2007Price/Earnings Forecast for 2007Price/Earnings Forecast for 2007
0x5x
10x15x20x25x30x35x40x45x50x55x
WD
C
STX
IM AR
W
AV
T
QTM
IBM
BR
CD
ELX
HP
Q
QLG
C
DE
LL
TEC
D
EM
C
AA
PL
NTA
P
AK
AM
HILL
SU
NW
CompaniesCompaniesCompaniesCompanies
PE
rat
ioP
E r
atio
PE
rat
ioP
E r
atio
37
NM NM

Harry E. Blount, [email protected]
415-274-5452
THANK YOU! – QUESTIONS
Please let me know if you would like to be added to my distribution list for the
following publications:
Weekly - In Blount TermsMonthly - IT Hardware Monthly
38
Harry E. Blount, [email protected]
415-274-5452
Analyst Certification and Important Disclosures
Analyst Certification:I, Harry Blount, hereby certify (1) that the views expressed in this research email accurately reflect my personal views about any or all of the subject securities or issuers referred to in this email and (2) no part of my compensation was, is or will be directly or indirectly related to the specific recommendations or views expressed in this email.
Important DisclosuresLehman Brothers does and seeks to do business with companies covered in its research reports. As a result, investors should be aware that the firm may have a conflict of interest that could affect the objectivity of this email communication.
Customers of Lehman Brothers in the United States can receive independent, third-party research on the company or companies covered in this report, at no cost to them, where such research is available. Customers can access this independent research at www.lehmanlive.com or can call 1-800-2-LEHMAN to request a copy of this research.
Investors should consider this communication as only a single factor in making their investment decision.
The analysts responsible for preparing this report have received compensation based upon various factors including the Firm’s total revenues, a portion of which is generated by investment banking activities.
Stock price and ratings history charts along with other important disclosures are available on our disclosure website at www.lehman.com/disclosures And may also be obtained by sending a written request to: LEHMAN BROTHERS CONTROL ROOM, 745 SEVENTH AVENUE, 19TH FLOOR NEW YORK, NY 10019
39
Harry E. Blount, [email protected]
415-274-5452
Important Disclosures (continued)Mentioned Stocks
2-EW / PositiveUSD$27.90 MSFTMICROSOFT
3-UW / Neutral1373 (JP)6770.TALPS2-EW / PositiveUSD$19.30 INTCINTEL CORP
3-UW / Neutral9660 (JP)6762.TTDK1-OW / NeutralUSD$19.08 IMINGRAM MICRO
2-EW / Positive820 (JP)6501.THITACHI2-EW / NeutralUSD$91.57 IBMINTL BUS MACHINE
3-UW / Positive727 (JP)6502.TTOSHIBA1-OW / NeutralUSD$38.73 HPQHEWLETT-PACKARD
2-EW / Neutral566,000 (KR)5930.KSSAMSUNG2-EW / NeutralUSD$3.54 HILLDOT HILL SYSTEMS
2-EW / Positive804 (JP)6702.TFUJITSU2-EW / NeutralUSD$13.51 EMCEMC CORP
2-EW / NeutralUSD$18.51 WDCWESTERN DIGITAL 2-EW / NeutralUSD$17.46 ELXEMULEX CORP
3-UW / NeutralUSD$36.76 TECDTECH DATA CP 2-EW / NeutralUSD$23.15 DELLDELL INC
2-EW / NeutralUSD$6.07 SUNWSUN MICROSYSTEMS 1-OW / PositiveUSD$25.32 CSCOCISCO SYSTEMS
1-OW / NeutralUSD$25.08 STXSEAGATE1-OW / NeutralUSD$9.04 BRCDBROCADE COMM SYS
1-OW / NeutralUSD$34.77 AVTAVNET INC
2-EW / NeutralUSD$2.40 QTMQUANTUM DLT 2-EW / NeutralUSD$37.52 ARWARROW ELECTRONIC
2-EW / NeutralUSD$17.32 QLGCQLOGIC CORP 2-EW / PositiveUSD$14.37 AMDADVANCED MICRO DEVICES
1-OW / PositiveUSD$16.63 ORCLORACLE CORP 2-EW / NeutralUSD$48.22 AKAMAKAMAI TECH INC
1-OW / NeutralUSD$37.75 NTAPNETWORK APPLIANCE 1-OW / NeutralUSD$85.91 AAPLAPPLE INC
RatingRecent PriceTickerName RatingRecent PriceTickerName
40
Harry E. Blount, [email protected]
415-274-5452
Important Disclosures (continued)Other Material Conflicts:
Lehman Brothers International (Europe), Seoul branch is a liquidity provider of equity linked notes for Samsung.
Guide to Lehman Brothers Equity Research Rating System
Our coverage analysts use a relative rating system in which they rate stocks as 1-Overweight, 2- Equal weight or 3-Underweight (see definitions below) relative to other companies covered by the analyst or a team of analysts that are deemed to be in the same industry sector (“the sector coverage universe”). To see a list of companies that comprise a particular sector coverage universe, please go to www.lehman.com/disclosures.
In addition to the stock rating, we provide sector views which rate the outlook for the sector coverage universe as 1-Positive, 2-Neutral or 3-Negative (see definitions below). A rating system using terms such as buy, hold and sell is not the equivalent of our rating system. Investors should carefully read the entire research report including the definitions of all ratings and not infer its contents from ratings alone.
41
Harry E. Blount, [email protected]
415-274-5452
Important Disclosures (continued)Stock Rating
1-Overweight - The stock is expected to outperform the unweighted expected total return of the sector coverage universe over a 12-month investment horizon.
2-Equal weight - The stock is expected to perform in line with the unweighted expected total return of the sector coverage universe over a 12-month investment horizon.
3-Underweight - The stock is expected to underperform the unweighted expected total return of the sector coverage universe over a 12-month investment horizon.
RS-Rating Suspended - The rating and target price have been suspended temporarily to comply with applicable regulations and/or firm policies in certain circumstances including when Lehman Brothers is acting in an advisory capacity on a merger or strategic transaction involving the company.
Sector View
1-Positive - sector coverage universe fundamentals are improving.
2-Neutral - sector coverage universe fundamentals are steady, neither improving nor deteriorating.
3-Negative - sector coverage universe fundamentals are deteriorating.
Distribution of Ratings:
Lehman Brothers Equity Research has 1994 companies under coverage.
41% have been assigned a 1-Overweight rating which, for purposes of mandatory disclosures, is classified as a Buy rating, 39% of companies with this rating are investment banking clients of the Firm.
41% have been assigned a 2-Equal weight rating which, for purposes of mandatory disclosures, is classified as a Hold rating, 28% of companies with this rating are investment banking clients of the Firm.
13% have been assigned a 3-Underweight rating which, for purposes of mandatory disclosures, is classified as a Sell rating, 22% of companies with this rating are investment banking clients of the Firm.
42
Harry E. Blount, [email protected]
415-274-5452
Important Disclosures (continued)This material has been prepared and/or issued by Lehman Brothers Inc., member SIPC, and/or one of its affiliates (“Lehman Brothers”) and has been approved by Lehman Brothers International (Europe), authorized and regulated by the Financial Services Authority, in connection with its distribution in the European Economic Area. This material is distributed in Japan by Lehman Brothers Japan Inc., and in Hong Kong by Lehman Brothers Asia Limited. This material is distributed in Australia by Lehman Brothers Australia Pty Limited, and in Singapore by Lehman Brothers Inc., Singapore Branch. (“LBIS”). Where this material is distributed by LBIS, please note that it is intended for general circulation only and the recommendations contained herein does not take into account the specific investment objectives, financial situation or particular needs of any particular person. An investor should consult his Lehman Brothers’ representative regarding the suitability of the product and take into account his specific investment objectives, financial situation or particular needs before he makes a commitment to purchase the investment product. This material is distributed in Korea by Lehman Brothers International (Europe) Seoul Branch. This document is for information purposes only and it should not be regarded as an offer to sell or as a solicitation of an offer to buy the securities or other instruments mentioned in it. No part of this document may be reproduced in any manner without the written permission of Lehman Brothers. With the exception of disclosures relating to Lehman Brothers, this research report is based on current public information that Lehman Brothers considers reliable, but we make no representation that it is accurate or complete, and it should not be relied on as such. In the case of any disclosure to the effect that Lehman Brothers Inc. or its affiliates beneficially own 1% or more of any class of common equity securities of the subject company, the computation of beneficial ownership of securities is based upon the methodology used to compute ownership under Section 13(d) of the United States' Securities Exchange Act of 1934. In the case of any disclosure to the effect that Lehman Brothers Inc. and/or its affiliates hold a short position of at least 1% of the outstanding share capital of a particular company, such disclosure relates solely to the ordinary share capital of the company. Accordingly, while such calculation represents Lehman Brothers’ holdings net of any long position in the ordinary share capital of the company, such calculation excludes any rights or obligations that Lehman Brothers may otherwise have, or which may accrue in the future, with respect to such ordinary share capital. Similarly such calculation does not include any shares held or owned by Lehman Brothers where such shares are held under a wider agreement or arrangement (be it with a client or a counterparty) concerning the shares of such company (e.g. prime broking and/or stock lending activity). Any such disclosure represents the position of Lehman Brothers as of the last business day of the calendar month preceding the date of this report. This material is provided with the understanding that Lehman Brothers is not acting in a fiduciary capacity. Opinions expressed herein reflect the opinion of Lehman Brothers and are subject to change without notice. The products mentioned in this document may not be eligible for sale in some states or countries, and they may not be suitable for all types of investors. If an investor has any doubts about product suitability, he should consult his Lehman Brothers representative. The value of and the income produced by products may fluctuate, so that an investor may get back less than he invested. Value and income may be adversely affected by exchange rates, interest rates, or other factors. Past performance is not necessarily indicative of future results. If a product is income producing, part of the capital invested may be used to pay that income. © 2007 Lehman Brothers. All rights reserved. Additional information is available on request. Please contact a Lehman Brothers entity in your home jurisdiction. Lehman Brothers policy for managing conflicts of interest in connection with investment research is available at www.lehman.com/researchconflictspolicy. Ratings, earnings per share forecasts and price targets contained in the Firm's equity research reports covering U.S. companies are available at www.lehman.com/disclosures.Complete disclosure information on companies covered by Lehman Brothers Equity Research is available at www.lehman.com/disclosures.
43
Harry E. Blount, [email protected]
415-274-5452
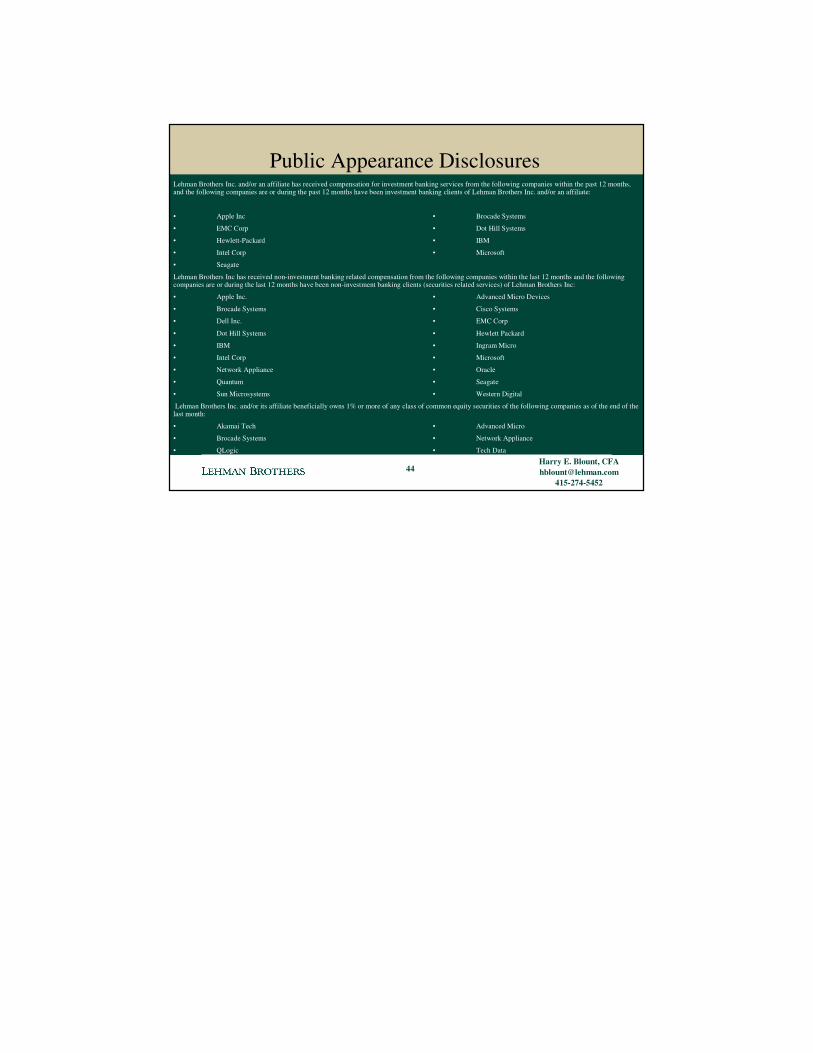
Public Appearance DisclosuresLehman Brothers Inc. and/or an affiliate has received compensation for investment banking services from the following companies within the past 12 months, and the following companies are or during the past 12 months have been investment banking clients of Lehman Brothers Inc. and/or an affiliate:
• Apple Inc • Brocade Systems
• EMC Corp • Dot Hill Systems
• Hewlett-Packard • IBM
• Intel Corp • Microsoft
• Seagate
Lehman Brothers Inc has received non-investment banking related compensation from the following companies within the last 12 months and the following companies are or during the last 12 months have been non-investment banking clients (securities related services) of Lehman Brothers Inc:
• Apple Inc. • Advanced Micro Devices
• Brocade Systems • Cisco Systems
• Dell Inc. • EMC Corp
• Dot Hill Systems • Hewlett Packard
• IBM • Ingram Micro
• Intel Corp • Microsoft
• Network Appliance • Oracle
• Quantum • Seagate
• Sun Microsystems • Western Digital
Lehman Brothers Inc. and/or its affiliate beneficially owns 1% or more of any class of common equity securities of the following companies as of the end of the last month:
• Akamai Tech • Advanced Micro
• Brocade Systems • Network Appliance
• QLogic • Tech Data
44