Embed Size (px)
Citation preview
EUR 24944 EN - 2011
The H1N1 (2009) influenza pandemic
Insights into its dynamics from different types of epidemiological data
Authors Lia Orfei (Joint Research Centre of the European Commission) liaorfeijrceceuropaeu Reneacute Snacken (European Centre for Disease Prevention and Control) ReneSnackenecdceuropaeu Andrew J Amato Gauci (European Centre for Disease Prevention and Control) AndrewAmatoecdceuropaeu
Nikolaos I Stilianakis (Joint Research Centre of the European Commission) nikolaosstilianakisjrceceuropaeu
The mission of the JRC-IPSC is to provide research results and to support EU policy-makers in their effort towards global security and towards protection of European citizens from accidents deliberate attacks fraud and illegal actions against EU policies European Commission Joint Research Centre Institute for the Protection and Security of the Citizen Contact information Address Bd 68 Via E Fermi 2749 I-21027 Ispra (VA) Italy E-mail nikolaosstilianakisjrceceuropaeu Tel +39 (0) 332 786427 Fax +39 (0) 332 785154 httpipscjrceceuropaeu httpwwwjrceceuropaeu Legal Notice Neither the European Commission nor any person acting on behalf of the Commission is responsible for the use which might be made of this publication
Europe Direct is a service to help you find answers
to your questions about the European Union
Freephone number ()
00 800 6 7 8 9 10 11
() Certain mobile telephone operators do not allow access to 00 800 numbers or these calls may be billed
A great deal of additional information on the European Union is available on the Internet It can be accessed through the Europa server httpeuropaeu JRC66469 ISBN 978-92-79-21314-4 (print) ISBN 978-92-79-21266-6 (pdf) ISSN 1018-5593 (print) ISSN 1831-9424 (online) doi10278872655 Luxembourg Publications Office of the European Union copy European Union 2011 Reproduction is authorised provided the source is acknowledged Printed in Italy
1
Table of contents Summary 2 Introduction 3 Sources of data 3
Surveillance systems 3 The internet 3
Key epidemiological quantities and methods 4 Estimation using incidence data only 4
Incident cases 4 Incident deaths 4 Application estimation of epidemiological parameters using incident cases only 5
Estimation using cluster data 6
Incubation period 6 Serial interval 6 Secondary attack rate 6
Estimation using individual level data 6
Age and clinical conditions 6 Travel information 6 Sero-prevalence 7 Application severity of pandemic influenza in Europe 7
Respiratory support 8 ICU 9 Deaths 9
Final remarks 10 Acknowledgements 12 References 13
2
Summary
The mission of the Joint Research Centre (JRC) is to provide customer-driven scientific and technical support for the conception development implementation and monitoring of EU policies As a service of the European Commission the JRC functions as a reference centre of science and technology for the Union Close to the policy-making process it serves the common interest of the Member States while being independent of special interests whether private or national This work was done in collaboration with the European Centre for Disease Prevention and Control (ECDC) which mission is to identify assess and communicate current and emerging threats to human health posed by infectious diseases In order to assess the transmission potential and the severity of the recent H1N1 (2009) influenza pandemic within the European Union a series of different types of epidemiological data were used We describe the way these data have been employed to estimate some key epidemiological parameters of the pandemic A preliminary statistical analysis of EU data related to Severe Acute Respiratory Infections (SARI) provided interesting insights into the severity of the pandemic as this was manifested in Europe
3
Introduction
In March 2009 the first cases of infection by the new influenza virus previously referred to as AH1N1v (now termed influenza A(H1N1) 2009) occurred in Mexico On the 11
th June 2009 the World Health Organisation [1]
declared a pandemic after the virus spread worldwide and caused community level outbreaks in a number of countries [1] On the 10
th August 2010 the pandemic was announced to be over shifting the attention to what
needs to be done in the post-pandemic period in terms of surveillance Localized outbreaks are still observed but most of the transmission is expected during the standard influenza season which officially started on October 4
th 2010 (Week40)
Emergencies such as an influenza pandemic require massive interventions from the public health authorities These must be driven by a thorough quantitative assessment of the situation and the possible future scenarios The European Centre for Disease Prevention and Control (ECDC) [2] gave some indications on what they called lsquostrategic parametersrsquo the knowledge of which contributes to a comprehensive early assessment of a crisis These include among others
- The case definition in order to identify the correct population under observation - Incidence of cases by age group and other risk factors eg co-morbidities - Parameters for modeling such as the reproduction number and the serial interval - Estimates of severity such as age specific-mortality and hospitalization
This paper focuses on the key epidemiological parameters that contributed to the assessment of the recent influenza pandemic and on the different types of data that were available to estimate these A summary of the main results that have been published in the scientific literature cited in Medline until the end of 2010 is also given Finally a statistical analysis of epidemiological data related to the severity of the influenza A (H1N1) 2009 pandemic in Europe is presented
Sources of data
Surveillance systems
Many countries have surveillance systems in place which routinely collect data on a variety of infectious diseases including influenza and are usually directly involved in detecting and monitoring a crisis situation They provide timely information on the evolution of an outbreak as well as background information on the pattern usually observed for a particular disease Generally surveillance data includes the number of reported cases mortality hospitalizations geographical location of cases virological data etc National surveillance systems also report to international bodies such as the ECDC and WHO with country-specific data for further analysis
The internet
Data can also be gathered from the web using systems that pre-select sources of information for the user (Epidemic Intelligence) These systems can be grouped into categories according to the level of details provided [3]
- News aggregators (eg (Really Simple Syndication) RSS feeds) that only provide links to news articles or scientific papers The user scans through the information and selects data to be analyzed
- Automated specific systems such as the Medical Information System (MedISys) developed by the Joint Research Centre (JRC) of the European Commission which also provides some basic analysis of the data found on the web Advantages of these systems include unbiased selection of information in real time while disadvantages can be the amount of false positives and possible overestimation of the apparent impact Therefore a further filtering step is often necessary to deal with these limitations MedISys indeed allows for manual moderation through the Rapid News Service tool an editorial system used by the ECDC
- Moderated systems (eg ProMED) where analysts scan the news and articles and provide full reports that the user can analyze further Advantages are fewer false positives and disadvantages include delay in the reporting and possible selection bias and underestimation of the impact
The information derived from the internet has been of importance in particular during the initial phase of the H1N1 (2009) influenza pandemic According to the source different types of data can be identified
- Low level of detail aggregated number of incident cases incident deaths geographical spread of cases etc Most likely to be found on the web and publicly available sources
4
- Intermediate level of detail age gender hospitalizations Intensive Care Unit (ICU) use clinical profiles etc Generally available from Surveillance systems not always accessible for everyone At this level we can also include data on contacts between infected individuals that belong to the same cluster (school household etc)
- High level of detail laboratory confirmed cases circulating strains immunity etc Commonly only available from clinical and laboratory studies with limited access An important exception is influenza for which routine sentinel surveillance provides information at this level of detail
Key epidemiological quantities and methods
The Special Report published by the ECDC summarizes the estimates of some of the so called strategic parameters for the whole of the EUEEA community [4] These can be roughly grouped into two categories
- parameters used to quantify the transmissibility of the disease such as the reproduction number R (basic (R0) or effective (Re) ie the mean number of infections due to a primary case in a totally susceptible population or the average number of secondary cases per primary case observed in a population respectively) the serial interval (the time interval between identical observable stages eg the onset of symptoms of disease in successive cases in a chain of transmission) the generation time (the time between primary and secondary case infection generally not observable) the incubation period (the time interval between initial infection and disease onset) the epidemic growth rate (the average number of new cases per unit of time) The ECDC reports that the basic reproduction number R0 is likely to have been between 11 to 14 in Europe the serial interval between 22 and 23 days the mean generation time between 25 and 3 days and the mean incubation period from 15 to 2 days
- parameters used to estimate the severity of the infection such as the clinical attack ratio (the proportion of symptomatic cases in the population over the entire course of the epidemic) the case fatality ratio CFR (proportion of deaths in the infected population) the hospitalization ratio the ICU use ratio For these quantities it is difficult to give precise estimates mainly because the denominator is affected by the underreported mild and asymptomatic cases and cannot be estimated with any real degree of accuracy The ECDC [4] provided some of the above figures to represent a reasonable worst case scenario the attack rate could be up to 20 (as the top end of the expected range for this quantity 5-20) mortality ratio up to 3 per 100000 population and hospitalization ratio up to 100 per 100000 population
The following sections summarize a number of estimates for some of these parameters for other countries around the world
Estimation using incidence data only
Incident cases
A recent study [5] shows that estimates of R0 from incidence data alone can be given if these show a clear wave pattern because it contains information on the distribution of the serial interval If this wave pattern is not very evident or the generation time is too short (less than 15 days) then at least 10 independent observations of the generation time are needed together with at least 300 cumulative incident cases to derive a precise estimate of R0 Early studies gave estimates of R0 that varied from a minimum of 05 for the Netherlands [6] 14-16 for Mexico [7] to a maximum of 24 for Australia [8] White et al [9] estimated R0 to be 22-23 for the USA when using raw data on clinical cases from CDC which decreased to 17-18 after adjusting for missing onset dates underreporting of cases and changes in case reporting
Incident deaths
Crude estimates of the case fatality ratio and the overall mortality rate are possible if information on the population at risk is available Specifically for the CFR both numerator and denominator are likely to be biased as they are subject to underascertainment (the clinicians tend to attribute the deaths to the complications of influenza) as well as delays in reporting besides representing only a subset of the infected cases Crude CFR estimates were around 005 [10] for ILI cases while the crude mortality rate for the US was estimated at less than 4 per 100000 population [11]
5
Application estimation of epidemiological parameters using incident cases only
The JRC has developed HEDIS (Health Emergency and Disease Information System) [12] a web-based portal with restricted access offering a central destination and access point for all the information derived from various sources communication tools Geographic Information Systems and modeling applications allowing European stakeholders responsible for health threats response to consult and exchange health-related information Embedded into HEDIS the JRC is currently developing the web-based software system IAMOS (Infectious Agent Modelling System) which ultimately will encompass both several standard epidemiological models and real-time modeling tools to analyze a number of infectious diseases that currently represent a threat worldwide ECDC published the weekly aggregate numbers of reported influenza cases for each member state during the whole course of the epidemic [13] Using this very basic level of data the IAMOS tools were applied to give the a posteriori estimates of some key parameters by matching the real cases with simulated data derived from a deterministic SEIR type model (Susceptible-Exposed-Infectious-Recovered) that explicitly considers asymptomatic but infectious individuals and captures the essential transmission dynamics for an influenza outbreak [14] The parameters of this model have been fixed to the values that produced the best match to the real data and taken as estimates of the epidemiological quantities we are interested in As an illustrative example Fig 1 shows the data from Italy during the second wave of influenza (October-December 2009 red dots) and the corresponding simulated data from the above mentioned model Two scenarios have been fitted the first considers the whole population to be susceptible in the initial phase of the infection cycle and the second assumes a proportion of the population to be immune to the virus before it began to spread The proportion of immune people was assumed according to an estimation performed by the Robert Koch Institute (RKI) in Germany In fact researchers at the RKI have combined the most likely hypotheses on immunity due to infection to vaccination and to pre-existing cross-protection (more evident in the elderly) The resulting proportion is between 23 and 38 [15] Therefore in our simulation we made a conservative assumption of an overall proportion of 25 immune population for illustrative purposes to stay within the lower bound of the abovementioned estimates
Fig 1 Pandemic influenza weekly incidence rates per 100000 population in Italy (red dots) and corresponding simulated rates from a deterministic SEIR model (red and green lines) The simulations above correspond to the epidemiological parameters we have fixed to best match the data Under the assumption that the incubation period was 2 days and that the recovery period for individuals with symptoms was 35 days and for asymptomatics 1 day the reproduction number R0 was 125 under the fully susceptible population assumption and 129 for the assumption that 25 of the population was immune The attack rates (or the overall proportion of the population that is affected by the virus) were 12 and 10 respectively These examples show that crude estimation of epidemiological parameters is possible when having incidence data only limitations of this approach are mainly due to data being subject to delays in reporting and aggregating and the absence of information on individuals such as age gender place of infection
6
Estimation using cluster data
In this case groups of individuals belonging to the same structured environment are considered for example they can belong to the same household go to the same school be members of the same close communities etc These settings allow tracking of the contacts between members as well as laboratory confirmation of all suspect cases These types of data are essential to directly observe the following
Incubation period
Incubation period is the time between infection with the virus and onset of symptoms A recent systematic review of 38 studies [16] estimated the median incubation period for several infectious diseases finding that the one for seasonal influenza A is around 14 days (95 CI 13-15)
Serial interval
Early estimates of the mean serial interval in 216 households in the US indicated that the infection of a secondary case occurred early (26 days) 95 credible interval
1 22-35) that children were most likely to be the
primary case or to be infected and that the proportion of household members who developed symptoms after being in contact with another infected member decreased with the size of the household [17] Similar results were also given by the analysis of a school outbreak in the US [18] where the serial interval
2 ranged from 26 to
32 days More recently studies have given estimates of this quantity for several countries around the world which seem to be largely consistent for example in Germany analysis of contacts in 36 households led to an estimate of the median serial interval of 3 days while most patients remained infectious for up to 5 days [19] In Canada the median interval was 34 days [20] while in Chile it was 3 days [21]
Secondary attack rate
This is the cumulative incidence rate of cases infected by a primary case Estimates are more variable varying from values largely in line with seasonal influenza (7-8 [22]) to over 30-40 among school children [23] Limitations are mainly attributable to the specificity of the setting in fact estimates may be truncated due to local saturation of contacts and extrapolation of results to a wider community with different mixing mechanisms is questionable
Estimation using individual level data
This is generally the desirable level of detail to have in order to allow assessment of relationships between risk factors Examples of individual level data include
Age and clinical conditions
Knowledge of age allows calculation of age-specific levels of transmission and severity which would allow for example more targeted treatment and vaccination campaigns to achieve the optimal level of immunity in the community Information on clinical profile comorbidities type and length of hospitalization or ICU (intensive care unit) use are also needed to assess the actual severity of the infection and the ways it affects different age groups as well as the efficacy of short-term treatments [1]
Travel information
Studies have shown that treating the imported cases as endogenous can lead to substantial underestimation of R0 [24] To adjust for this one solution found by Hens et al [25] is to consider in their simulation a transitory period of 6 days after which all new cases are supposed to have been infected by other members of the same population
1 The credible interval is the corresponding of the confidence interval when estimates are given via Bayesian methods
2 Please note that in the cited paper the authors use the term lsquogeneration intervalrsquo
7
Sero-prevalence
According to the WHO [1] serological surveys are by far the best way to make any inference on the population susceptibility and estimate transmission parameters because asymptomatic patients can spread the infection but are not easily captured by the routine surveillance systems By providing exact estimates of the number of exposed and infected persons this information allows precise estimates of the risk of infection in the whole population Sero-prevalence studies have been conducted before and during the pandemic and provided some insight on the level of pre-existing immunity in the population and on the efficacy of vaccination campaigns For example in Italy a recent study has shown that about 1 out of 5 of the elderly (gt65 years of age) is protected [26] In the US two studies have shown respectively that 33 and 34 of adults older than 60 years have serum cross-reactive antibodies to the 2009 A(H1N1) 2009 influenza virus [27] [28] These results are consistent with others for Finland [29] the UK [30] and Norway [31]
Application severity of pandemic influenza in Europe
Member States routinely report data on a number of infectious diseases in the EU to The European Surveillance System (TESSy) of the ECDC In particular influenza cases are reported regularly by General Practices during the standard influenza season which roughly runs from week 40 to week 20 of the following year In addition between week 222009 and week 282010 13358 Severe Acute Respiratory Infection (SARI) cases and 606 deaths were reported to ECDC Among these 817 are confirmed virus AH1N1 and 03 virus A cases while for 18 of the patients the virus subtype is not reported Moreover note that the routine collection of SARI cases was introduced by ECDC in week 362009 the cases reported before this date were communicated retrospectively after the introduction of the new system Finally not all countries recorded SARI patients in the early weeks of the pandemic for example 73 of SARI cases between week 22 and 36 are from UK The weekly incidence of SARI cases follow a clear pattern (Fig 2) with a first wave in late spring 2009 and a second one in autumn 2009 This shape is not affected by the uncertainty about the virus subtype of a relatively small fraction of the data indeed in the UK which represent the majority of influenza cases during the summer 100 of patients were confirmed AH1N1 cases On the other hand the bulk of fatalities seem to have occurred during the second wave of the pandemic (not shown)
0
200
400
600
800
1000
1200
1400
1600
1800
2000
22 24 26 28 30 32 34 36 38 40 42 44 46 48 50 52
1 3 5 7 9
11 13 15 17 19 22 24 28
2009 2010
SAR
I cas
es
Time
Fig 2 weekly incidence of SARI cases in 11 EU countries from week 222009 to week 282010 (N=13358)
8
As we can see from Fig 3 the SARI cases age distribution peaks at the age groups between 1 and 19 with another slight increase between the age of 40 and 59
0
100
200
300
400
500
600
700
SAR
I cas
es
Age groups
F
M
Fig 3 age and gender distribution of SARI cases (N=11409) Severe Acute Respiratory Infection (SARI) or deaths attributable to influenza were not reported by the pre-pandemic surveillance systems The routine collection of SARI cases was introduced by ECDC during the autumn-winter wave when the pandemic had already hit most countries For this reason and probably because of the pressure under which the individual surveillance systems already were only 11 out of 27 Member States contributed to the collection and sharing of these data In our analysis for completeness we include data from the beginning of the pandemic (week 222009) We have information on the hospitalization date for 66 of the SARI cases Two countries in particular did not report the hospitalization dates for most of the cases Finland with 97 missing dates and Austria with 92 missing dates Belgium did not report any deaths therefore it was excluded from the relevant analyses It needs to be noted that there is also a sizeable variability in the sources of data and therefore in the data quality and representativeness [4] Countries are different for the health seeking behavior of their population and the public health policies that influence these behaviors Keeping in mind these limitations of the data we analyzed a few measures of severity of the pandemic influenza
Respiratory support
Six countries reported mostly unknown type of respiratory support administered to the patients Among the SARI cases for whom we have this information (N=2703) 76 needed ventilation or oxygen while for the rest respiratory support was not necessary with some marked difference between countries Notably in the Netherlands 86 of the patients were treated as not needing respiratory support In general ventilation was the preferred type of support given in most age groups (Fig 4) except in Malta and Romania where most of the patients were given oxygen
9
0
50
100
150
200
250SA
RI c
ase
s
Age groups
OXYGEN
VENT
Fig 4 Age distribution of administered respiratory support (N=2055)
ICU
Five countries (Ireland Malta the Netherlands Romania and Slovakia) reported information on whether the hospitalization required ICU treatment versus inpatient treatment only France reported only patients in ICU Cyprus did not have any patients requiring ICU while for the others the hospitalization unit type was mostly unknown Of the 3957 SARI patients with available information on the hospital unit type 44 needed ICU support Age played a relevant role in determining whether a patient was put in intensive care with the highest percentage in the 50-54 and the 65-69 year-olds groups
Deaths
In total 5 of the SARI patients for which we have this information died with marked differences among countries (Fig 5) in Cyprus this percentage reached 35 The country with the second highest percentage was France where only SARI patients admitted to ICU were reported
Fig 5 Case-fatality ratio in SARI cases by country The numerator in the labels represents the number of deaths and the denominator the number of SARI cases
10
As expected there is a strong association between age and fatal outcome indeed the oldest age group includes patients that are most likely to be affected by co-morbidities and underlying medical conditions that could increase the probability of adverse outcomes of influenza Fig 6 suggests an increasing trend of the case fatality ratio with an increasing number of underlying conditions The most common combinations of multiple existing conditions are chronic heart disease and diabetes together with chronic lung disease HIV or other immuno-deficiencies and obesity
Fig 6 percentage of fatalities by number of pre-existing conditions (N=6033) The numerator in the labels represents the number of deaths and the denominator the number of SARI cases with pre-conditions If we were to judge the severity of the pandemic in these countries by this calculation of the CFR it would be indeed considered to be an extremely virulent outbreak However even if the CFR was highly variable across countries overall the mortality rate was only 03 per 100000 population under surveillance Note that this only regards 7 out of 11 countries for which we have information on the denominator (ie the population under surveillance) More recent studies have begun to consider novel measures of the severity of the pandemic In fact given that young adults seem to have been particularly affected by the virus an interesting recent study measures the impact of the pandemic in terms of Years of Life Lost (YLL) total burden on the health system and use of Intensive Care Units Viboud et al [32] conclude that this pandemic can be seen as much more severe from these different perspectives with between 334000 and 1973000 YLL compared to a standard influenza season which falls in the lower bound of this range This novel vision promotes the use of alternative measures to reflect the characteristics of the affected population sub-groups
Final remarks
Epidemiological modelling is key to preparedness for crisis situations caused by the emergency of infectious disease outbreaks In fact it provides estimates of baselines to refer to in order to evaluate the size and severity of the outbreak and the tools for early detection of anomalies For this reason agreement on the minimum data needed to perform meaningful estimations on essential epidemiological parameters is necessary to avoid providing advice based on too little information As nowadays the internet is more and more used to search for and exchange information on diseases symptoms and treatment it can be seen as a novel data source for quantitative assessments and therefore a
11
complementary tool for detecting outbreak An example is given in this paper with the application of the IAMOS tool which used data publicly available from the ECDC website Despite sophisticated modeling efforts there is always substantial uncertainty in the estimation of epidemiological parameters during the initial phase of a new outbreak In the 2009 pandemic one of the main causes of uncertainty was lack of information on prior immunity In order to achieve a better assessment of the immunity levels of the population serological studies need to be enhanced Indeed several reports indicated that there has been substantial pre-existing immunity in the 60+ year olds ([26] to [31]) which prevented this age group from being severely affected by the virus Overall the 2009 influenza pandemic was not a severe one Severity is not a simple quantity to measure being a combination of effects on individuals on the society (health care systems burdened work absenteeism access to care etc) characteristics of the virus and the intensity of transmission and symptoms Direct measures of severity include the CFR although reliable estimates are not available at the beginning of a pandemic together with hospitalization and Intensive Care treatment rates In the TESSy database about 1 out of 6 hospitalized persons needed ICU support with age being an important risk factor Thus it seems that when elderly were hit they were hit hard probably due to underlying pre-conditions andor lack of adequate immune response
12
Acknowledgements
The authors thank Phillip Zucs and Andrea Ammon from ECDC for their useful comments and suggestions
13
References
1 WHO httpwwwwhointen 2 Nicoll A Ammon A Amato Gauci A Ciancio B Zucs P Devaux I Plata F Mazick A Moslashlbak K Asikainen T
Kramarz P Experience and lessons learned from surveillance and studies of the 2009 pandemic in Europe Public Health 2010124(1)14-23
3 Linge JP Steinberger R Weber TP Yangarber R van der Goot E Al Khudhairy DH Stilianakis NI Internet surveillance systems for early alerting of health threats Euro Surveill 200914(13)pii=19162
4 Amato Gauci AJ Zucs P Snacken R Ciancio B Lopez V Broberg E et al European Centre for Disease Prevention and Control Special Report The 2009 A(H1N1) pandemic in Europe Stockholm ECDC 2010
5 Becker NG Wang D Clements M Type and quantity of data needed for an early estimate of transmissibility when an infectious disease emerges Euro Surveill 2010 15(26) pii=19603
6 Hahneacute S Donker T Meijer A Timen A van Steenbergen J Osterhaus A van der Sande M Koopmans M Wallinga J Coutinho R Dutch New Influenza A(H1N1)v Investigation Team Epidemiology and control of influenza A(H1N1)v in the Netherlands the first 115 cases Euro Surveill 200914(27)pii=19267
7 Fraser C Donnelly C Cauchemez S Hanage WP Van Kerkhove MD Hollingsworth TD Griffin J Baggaley RF Jenkins HE Lyons EJ Jombart T Hinsley WR Grassly NC Balloux F Ghani AC Ferguson NM Rambaut A Pybus OG Lopez-Gatell H Apluche-Aranda CM Bojorquez Chapela I Palacios Zavala E Espejo Guevara DM Checchi F Garcia E Hugonnet S Roth CJl Pandemic potential of a strain of influenza A (H1N1) early findings Science 2009 324(5934)1557-1561
8 McBryde E Bergeri I van Gemert C Rotty J Headley E Simpson K Lester R Hellard M Fielding J Early transmission characteristics of influenza A(H1N1)v in Australia Victorian state 16 May ndash 3 June 2009 Euro Surveill 14(42) pii 19363 2009
9 White LF Wallinga J Finelli L Reed C Riley S Lipsitch M Pagano M Estimation of the reproductive number and the serial interval in early phase of the 2009 influenza AH1N1 pandemic in the USA Influenza Other Respi Viruses 2009 3(6)267-76
10 Nishiura H Case fatality ratio of pandemic influenza The Lancet Infectious Diseases Vol 10 July 2010 11 CDC httpwwwcdcgov 12 HEDIS httphedisjrceceuropaeu 13 ECDC Weekly Influenza Surveillance Overview (WISO)
httpecdceuropaeuenhealthtopicsseasonal_influenzaepidemiological_dataPagesWeekly_Influenza_Surveillance_Overviewaspx
14 Stilianakis N I Perelson A S Hayden F G Emergence of drug resistance during an influenza epidemic insights from a mathematical model J Infect Dis 1998177863-873
15 ECDC Forward Look Assessment Likely scenarios for influenza in 2010 and the 20102011 influenza season in Europe and the consequent work priorities httpwwwecdceuropaeuenhealthtopicsH1N1Documents1003_RA_forward_look_influenzapdf
16 Lessler J Reich NG Brookmeyer R Perl TM Nelson KE Cummings DA Incubation periods of acute respiratory viral infections a systematic review Lancet Infect Dis 20099291ndash300
17 Cauchemez S Donnelly CA Reed C Ghani AC Fraser C Kent CK Finelli L Ferguson NM Household transmission of 2009 pandemic influenza A (H1N1) virus in the United States N Engl J Med 2009 Dec 31361(27)2619-27
18 Yang Y Sugimoto JD Halloran ME Basta NE Chao DL Matrajt L et al The transmissibility and control of pandemic influenza A (H1N1) virus Science 2009 Oct 30326(5953)729-33 Epub 2009 Sep 10
19 Suess T Buchholz U Dupke S Grunow R an der Heiden M Heider A et al Robert Koch Institute Shedding Investigation Group Shedding and transmission of novel influenza virus AH1N1 infection in households--Germany 2009 Am J Epidemiol 2010 Jun 1171(11)1157-64 Epub 2010 May 3
20 Sikora C Fan S Golonka R Sturtevant D Gratrix J Lee BE Jaipaul J Johnson M Transmission of pandemic influenza A (H1N1) 2009 within households Edmonton Canada J Clin Virol 2010 Jul 27 [Epub ahead of print]
21 Pedroni E Garcia M Espinola V Guerrero A Gonzalez C Olea A et al Outbreak of 2009 pandemic influenza A9H1N1) Los Lagos Chile April-June 2009 EuroSurveill 201015(1)pii=19456
22 Cowling BJ Chan KH Fang VJ Lau LL So HC Fung RO et al Comparative epidemiology of pandemic and seasonal influenza A in households N Engl J Med 2010 Jun 10362(23)2175-84
23 Health Protection Agency West Midlands H1N1v Investigation Team Preliminary descriptive epidemiology of a large school outbreak of influenza A(H1N1)v in the West Midlands United Kingdom May 2009 Euro Surveill 200914(27)pii=19264
24 Paine S et al Transmissibility of 2009 pandemic influenza A(H1N1) in New Zealand effective reproduction number and influence of age ethnicity and importations Euro Surveill 201015(24)pii=19591
25 Hens N et al Estimation of the effective reproduction number for pandemic influenza from notification data
14
made publicly available in real time A multi-country analysis for influenza AH1N1v 2009 Vaccine (2010) doi101016jvaccine201005010
26 Rizzo C Rota MC Bella A Alfonsi V Declich S Caporali MG et al Cross-reactive antibody responses to the 2009 AH1N1v influenza virus in the Italian population in the pre-pandemic period Vaccine 28 (2010) 3558ndash3562
27 CDC Morbidity and Mortality Weekly Report (MMWR) Serum Cross-Reactive Antibody Response to a Novel Influenza A (H1N1) Virus After Vaccination with Seasonal Influenza Vaccine May 22 200958(19)521-524
28 Hancock et al Cross-reactive antibody responses to the 2009 pandemic H1N1 influenza virus N Engl J Med 20093611945-52
29 Ikonen N Strengell M Kinnunen L Oumlsterlund P Pirhonen J Broman M Davidkin I Ziegler T Julkunen I High frequency of cross-reacting antibodies against 2009 pandemic influenza A(H1N1) virus among the elderly in Finland Euro Surveill 201015(5)pii=19478
30 Miller E et al Incidence of 2009 pandemic influenza A H1N1 infection in England a cross sectional serological study The Lancet Online 21 Jan 2010 (Epub ahead of print)
31 Waalen K Kilander A Dudman SG Krogh GH Aune T Hungnes O High prevalence of antibodies to the 2009 pandemic influenza A(H1N1) virus in the Norwegian population following a major epidemic and a large vaccination campaign in autumn 2009 Euro Surveill 201015(31)pii=19633
32 Viboud C et al Preliminary Estimates of Mortality and Years of Life Lost Associated with the 2009 AH1N1 Pandemic in the US and Comparison with Past Influenza Seasons PLoS Curr Influenza 2010 March 20 RRN1153 doi101371currentsRRN1153
European Commission EUR 24944 ENndash Joint Research Centre ndash Institute for the Protection and Security of the Citizen Title The H1N1 (2009) influenza pandemic Insights into its dynamics from different types of epidemiological data Authors Lia Orfei Reneacute Snacken Andrew J Amato Gauci Nikolaos I Stilianakis Luxembourg Publications Office of the European Union 2011 ndash 14 pp ndash 21 x 297 cm EUR ndash Scientific and Technical Research series ndash ISSN 1018-5593 (print) ISSN 1831-9424 (online) ISBN 978-92-79-21314-4 (print) ISBN 978-92-79-21266-6 (pdf) doi10278872655 Abstract In order to assess the transmission potential and the severity of the recent H1N1 (2009) influenza pandemic within the European Union a series of different types of epidemiological data were used We describe the way these data have been employed to estimate some key epidemiological parameters of the pandemic A preliminary statistical analysis of EU data related to Severe Acute Respiratory Infections (SARI) provided interesting insights into the severity of the pandemic as this was manifested in Europe
How to obtain EU publications Our priced publications are available from EU Bookshop (httpbookshopeuropaeu) where you can place an order with the sales agent of your choice The Publications Office has a worldwide network of sales agents You can obtain their contact details by sending a fax to (352) 29 29-42758
The mission of the JRC is to provide customer-driven scientific and technical support for the conception development implementation and monitoring of EU policies As a service of the European Commission the JRC functions as a reference centre of science and technology for the Union Close to the policy-making process it serves the common interest of the Member States while being independent of special interests whether private or national
L
B-N
A-2
49
44
-EN
- C
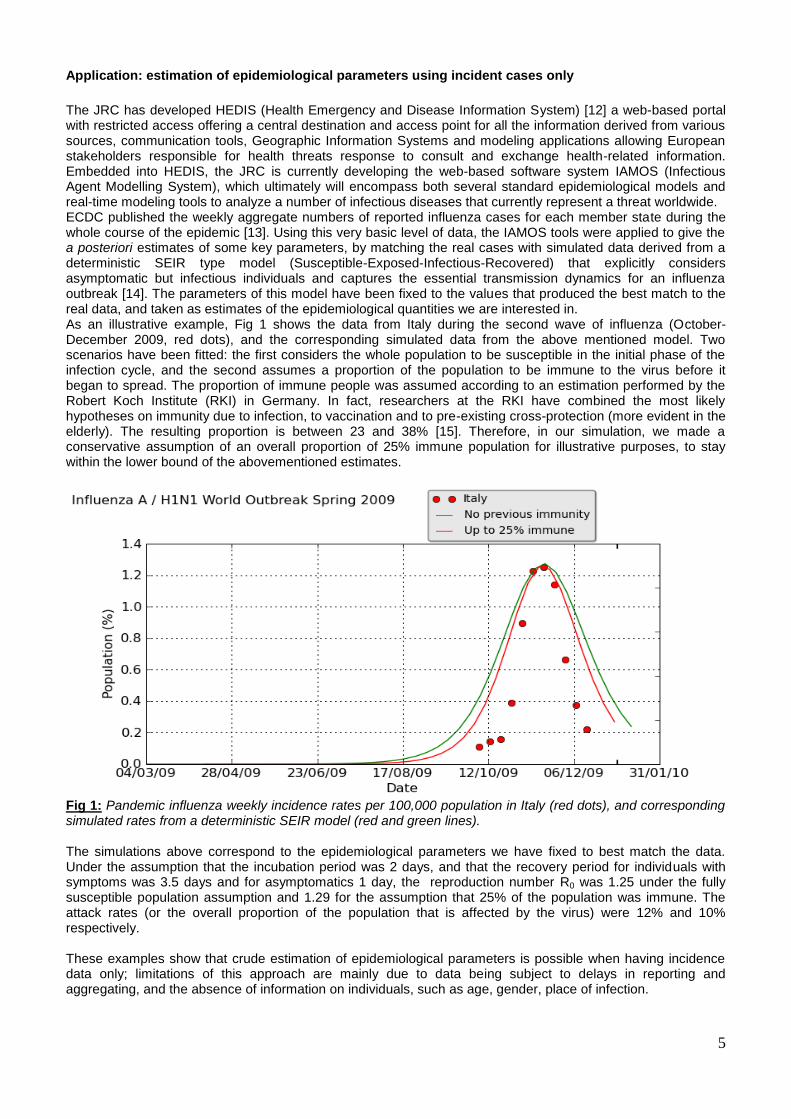
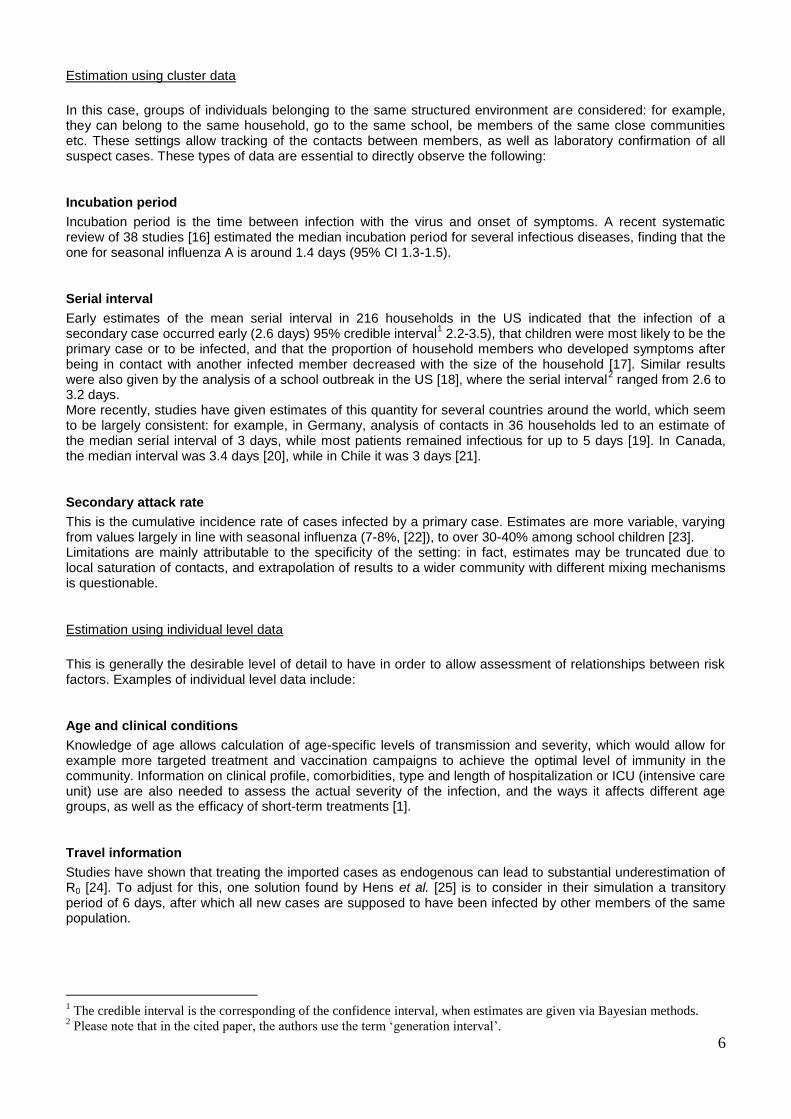
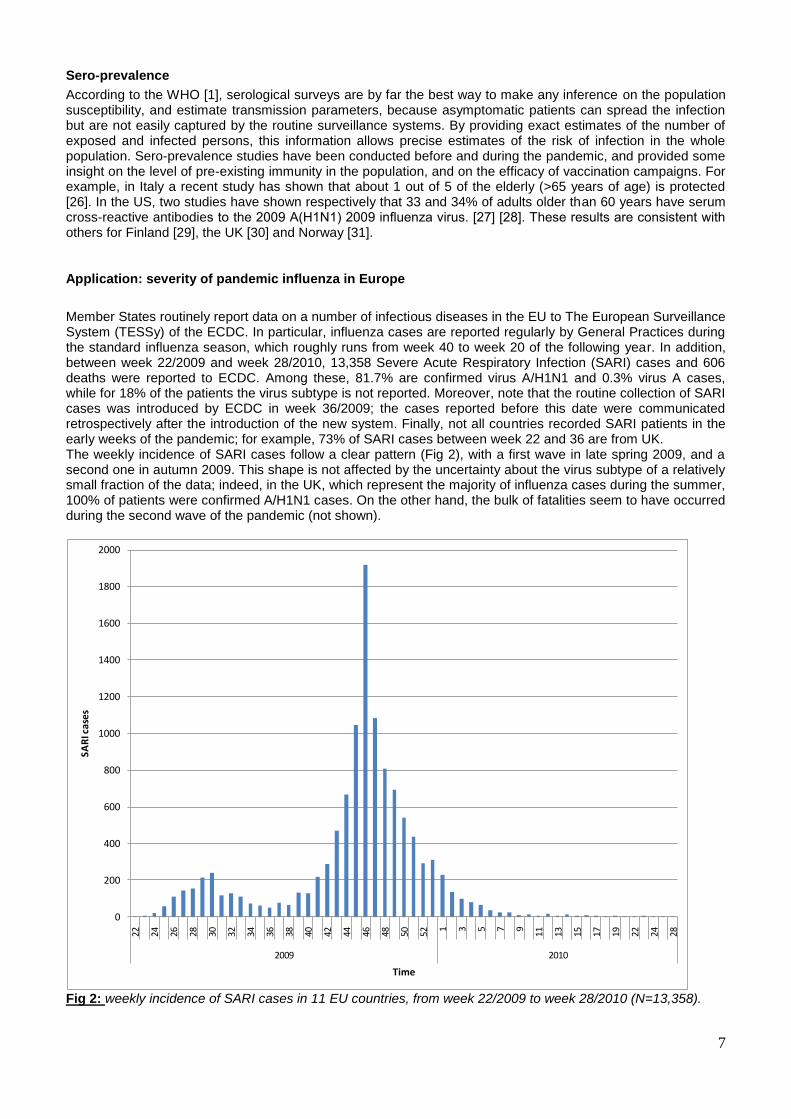
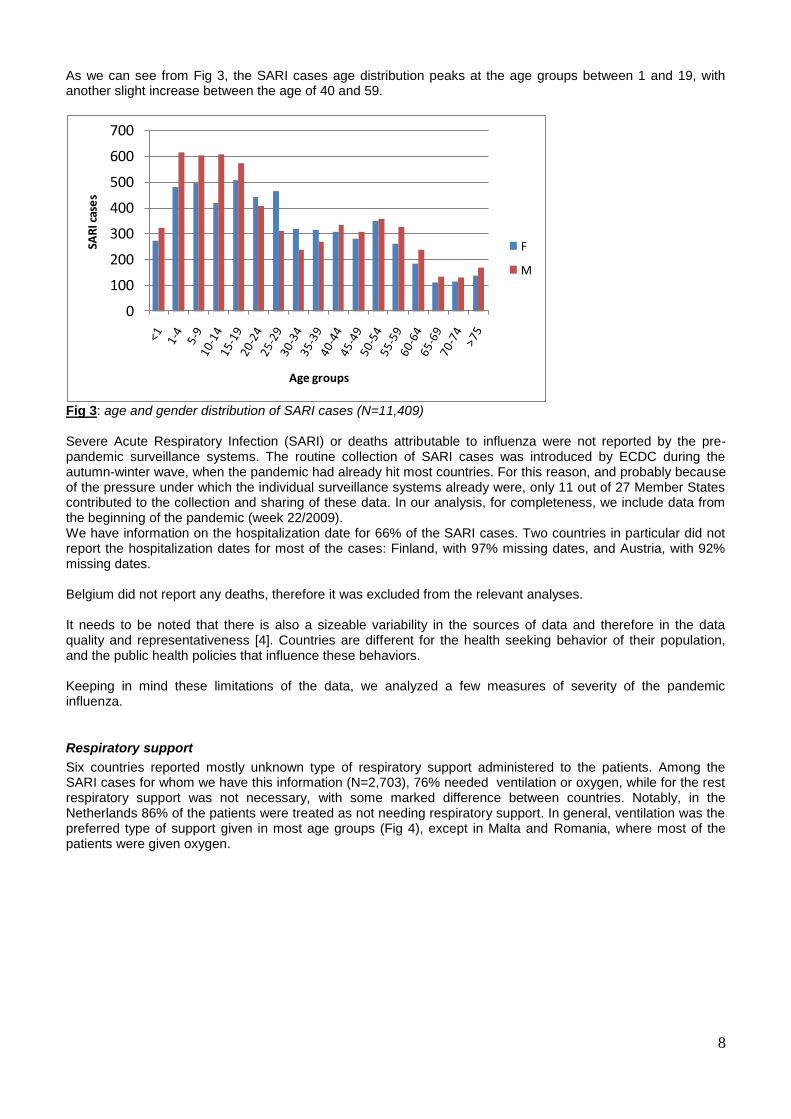
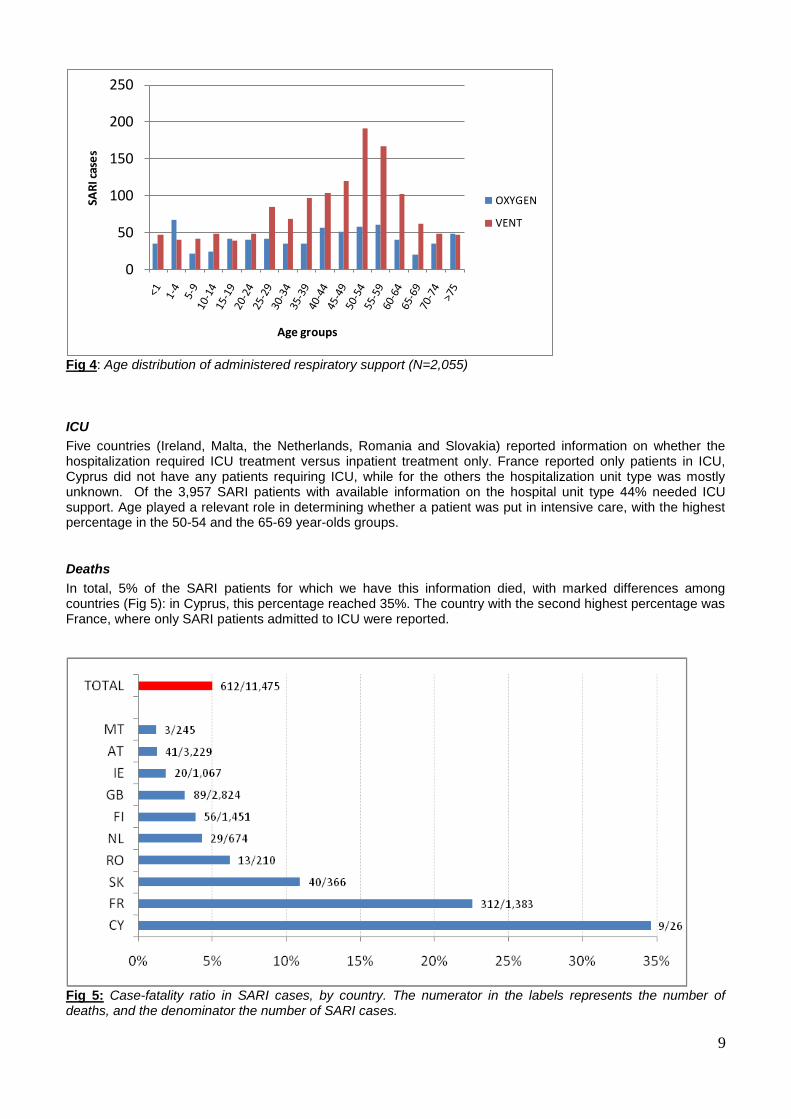
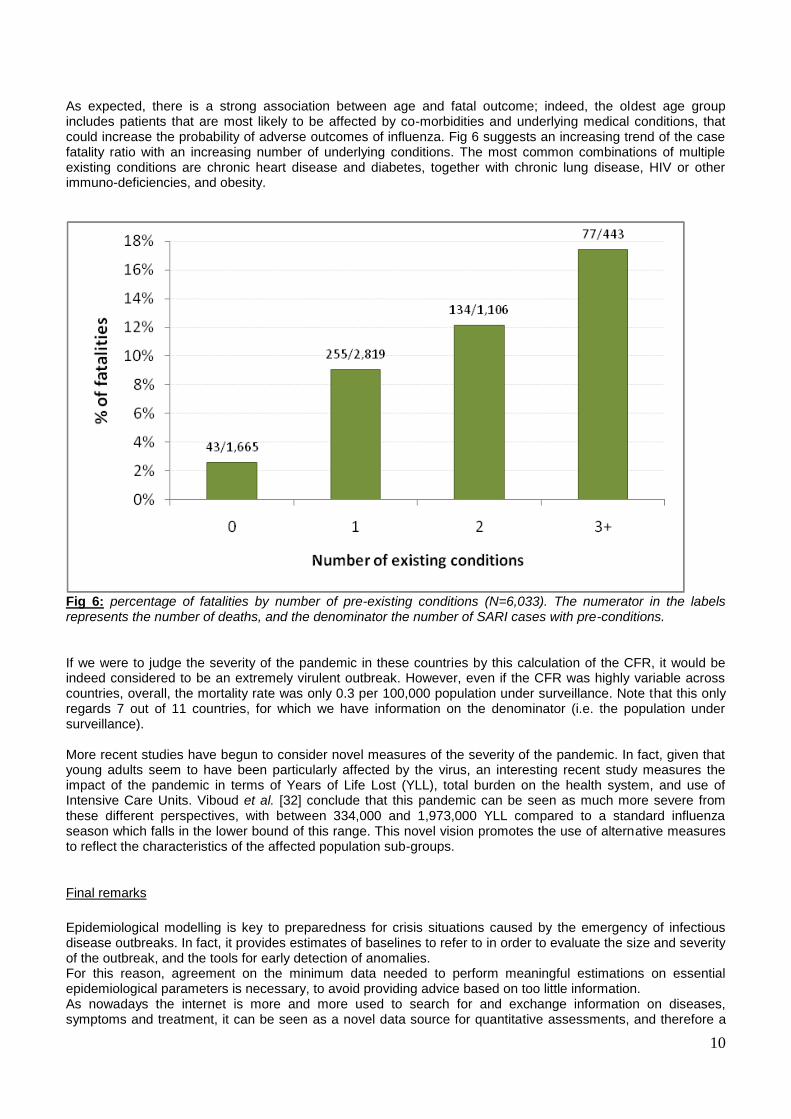