Embed Size (px)
Citation preview

The Green Grid
Energy Savings and Carbon Emissions Reductions Enabled by a Smart Grid
1016905

ELECTRIC POWER RESEARCH INSTITUTE 3420 Hillview Avenue, Palo Alto, California 94304-1338 ▪ PO Box 10412, Palo Alto, California 94303-0813 ▪ USA
800.313.3774 ▪ 650.855.2121 ▪ [email protected] ▪ www.epri.com
The Green Grid
Energy Savings and Carbon Emissions Reductions Enabled by a Smart Grid
1016905
Technical Update, June 2008
EPRI Project Manager
O. Siddiqui

DISCLAIMER OF WARRANTIES AND LIMITATION OF LIABILITIES
THIS DOCUMENT WAS PREPARED BY THE ORGANIZATION(S) NAMED BELOW AS AN ACCOUNT OF WORK SPONSORED OR COSPONSORED BY THE ELECTRIC POWER RESEARCH INSTITUTE, INC. (EPRI). NEITHER EPRI, ANY MEMBER OF EPRI, ANY COSPONSOR, THE ORGANIZATION(S) BELOW, NOR ANY PERSON ACTING ON BEHALF OF ANY OF THEM:
(A) MAKES ANY WARRANTY OR REPRESENTATION WHATSOEVER, EXPRESS OR IMPLIED, (I) WITH RESPECT TO THE USE OF ANY INFORMATION, APPARATUS, METHOD, PROCESS, OR SIMILAR ITEM DISCLOSED IN THIS DOCUMENT, INCLUDING MERCHANTABILITY AND FITNESS FOR A PARTICULAR PURPOSE, OR (II) THAT SUCH USE DOES NOT INFRINGE ON OR INTERFERE WITH PRIVATELY OWNED RIGHTS, INCLUDING ANY PARTY'S INTELLECTUAL PROPERTY, OR (III) THAT THIS DOCUMENT IS SUITABLE TO ANY PARTICULAR USER'S CIRCUMSTANCE; OR
(B) ASSUMES RESPONSIBILITY FOR ANY DAMAGES OR OTHER LIABILITY WHATSOEVER (INCLUDING ANY CONSEQUENTIAL DAMAGES, EVEN IF EPRI OR ANY EPRI REPRESENTATIVE HAS BEEN ADVISED OF THE POSSIBILITY OF SUCH DAMAGES) RESULTING FROM YOUR SELECTION OR USE OF THIS DOCUMENT OR ANY INFORMATION, APPARATUS, METHOD, PROCESS, OR SIMILAR ITEM DISCLOSED IN THIS DOCUMENT.
ORGANIZATION(S) THAT PREPARED THIS DOCUMENT
Global Energy Partners, LLC
Electric Power Research Institute
This is an EPRI Technical Update report. A Technical Update report is intended as an informal report of continuing research, a meeting, or a topical study. It is not a final EPRI technical report.
NOTE
For further information about EPRI, call the EPRI Customer Assistance Center at 800.313.3774 or e-mail [email protected].
Electric Power Research Institute, EPRI, and TOGETHER…SHAPING THE FUTURE OF ELECTRICITY are registered service marks of the Electric Power Research Institute, Inc.
Copyright © 2008 Electric Power Research Institute, Inc. All rights reserved.

iii
CITATIONS This document was prepared by
Global Energy Partners, LLC 3569 Mt. Diablo Blvd., Suite 200 Lafayette, CA 94549
Principal Investigator K. Parmenter P. Hurtado
Electric Power Research Institute 3420 Hillview Ave. Palo Alto, CA 94304
Principal Investigator O. Siddiqui
This document describes research sponsored by the Electric Power Research Institute (EPRI).
This publication is a corporate document that should be cited in the literature in the following manner:
The Green Grid: Energy Savings and Carbon Emissions Reductions Enabled by a Smart Grid. EPRI, Palo Alto, CA: 2008. 1016905.


v
PRODUCT DESCRIPTION This paper, prepared as part of the EPRI Energy Efficiency Initiative, provides a first-order quantification of energy savings and carbon-dioxide (CO2) emissions reduction impacts of a Smart Grid infrastructure.
Results and Findings First-order estimates of energy savings and CO2 emission reduction impacts were quantified for five applications enabled by a Smart Grid: 1) continuous commissioning for commercial buildings; 2) distribution voltage control; 3) enhanced demand response and load control; 4) direct feedback on energy usage; and 5) enhanced energy efficiency program measurement and verification capabilities. In addition, first-order estimates of CO2 emissions reductions impacts were quantified for two mechanisms not tied to energy savings: 6) facilitation of expanded integration of intermittent renewable resources and 7) facilitation of plug-in hybrid electric vehicle (PHEV) market penetration. The emissions reduction impact of a Smart Grid, based on these seven mechanisms, is estimated as 60 to 211 million metric tons of CO2 per year in 2030.
Challenges and Objectives This study is intended to provide utility professionals and policy makers with an understanding of the range of benefits enabled by a Smart Grid infrastructure, with a focus on energy savings and greenhouse gas emissions reduction.
Applications, Values, and Use This analysis can help a utility frame a business case for a Smart Grid infrastructure, including an advanced metering infrastructure (AMI), which includes a robust set of societal benefits beyond the operational benefits normally considered.
EPRI Perspective EPRI has been developing Smart Grid research for years through its IntelliGrid program. IntelliGrid has produced methodologies to guide utilities through the process of Smart Grid development, from conceptualization, definition of functional requirements, specification of applications, and design and architecture to roll out and deployment. This study is complementary to that constellation of EPRI Smart Grid research and is one of the first that attempts to quantify energy savings and emissions reduction impacts of a Smart Grid.
Approach The project team prepared this report through secondary research of publicly available content, including EPRI literature, as well as consultation with industry experts within and outside of EPRI.
Keywords Smart grid Green grid Direct feedback Energy efficiency Demand response Carbon emissions


vii
CONTENTS
1 THE NEW IMPERATIVE – CARBON REDUCTION ..............................................................1-1
2 THE SMART GRID CONCEPT ..............................................................................................2-1
3 SMART GRID MECHANISMS FOR ENERGY EFFICIENCY & CARBON REDUCTIONS ...3-1
4 ENHANCE CUSTOMER SERVICE........................................................................................4-1 Continuous Commissioning & Proactive Maintenance of End-Use Equipment ...................4-1 Easier Access to Green Power ............................................................................................4-3 Greater Options for Dynamic Pricing and Demand Response Services..............................4-3
5 IMPROVE OPERATIONAL EFFICIENCY..............................................................................5-1 Reduced Line Losses...........................................................................................................5-1 Reduced Transportation Requirements through Automated Meter Reading .......................5-4 Indirect Feedback to Customers on Energy Use through Improved Metering & Billing .......5-4
6 FACILITATE ENHANCED DEMAND RESPONSE AND LOAD CONTROL .........................6-1 Energy Savings through Peak Demand Reductions (Demand Response Programs) .........6-2 Energy Savings through Peak Demand Reductions (Other Load Control Programs) .........6-5 Eased Deployment of Renewable Resources to Meet Peak Demand.................................6-5 Reduced Operation of Less Efficient Peaking Plants...........................................................6-6
7 TRANSFORM CUSTOMER ENERGY USE BEHAVIOR.......................................................7-1 Direct Feedback to Consumers via Display Devices ...........................................................7-1 Indirect Feedback to Consumers via Improved Billing .........................................................7-3
8 SUPPORT NEW UTILITY BUSINESS MODELS...................................................................8-1 Accelerated Deployment of Energy Efficiency and Demand Response through Superior Measurement and Verification Capabilities..........................................................................8-1 Accelerated Innovation in Devices through Open Standards...............................................8-4
9 SMART GRID MECHANISMS FACILITATING CARBON EMISSIONS REDUCTIONS INDEPENDENT OF ENERGY SAVINGS..................................................................................9-1
Integration of Intermittent Renewables ................................................................................9-1 Facilitation of Plug-In Hybrid Electric Vehicles (PHEVs)......................................................9-3
10 ALL PATHS LEAD TO CARBON REDUCTION................................................................10-1
11 CONCLUSION....................................................................................................................11-1
A APPENDIX: SUMMARY OF SMART GRID BENEFITS....................................................... A-1


ix
LIST OF FIGURES
Figure 1-1 EPRI 2008 Prism – Technical Potential for CO2 Reductions in US Electric Sector .................1-2 Figure 1-2 Four Building Blocks of Energy Efficiency Infrastructure..........................................................1-3 Figure 2-1 Smart Grid Concept, PJM Illustration .......................................................................................2-2 Figure 2-2 Smart Grid Concept, EPRI Illustration......................................................................................2-3 Figure 2-3 Illustration of Prices to Devices Concept..................................................................................2-3 Figure 2-4 Concept of Dynamic Energy Management Enabled by a Smart Grid ......................................2-5 Figure 3-1 Utility Smart Grid Goals: All Paths Lead to Carbon Reductions...............................................3-2 Figure 3-2 Summary of Energy-Savings & Carbon-Reduction Mechanisms Enabled by a Smart Grid ....3-3 Figure 4-1 Enhance Customer Service: Energy Savings & CO2 Reduction Mechanisms.........................4-1 Figure 5-1 Improve Operational Efficiency: Energy Savings & CO2 Reduction Mechanisms....................5-1 Figure 6-1 Enhance Demand Response: Energy Savings & CO2 Reduction Mechanisms.......................6-1 Figure 6-2 Energy Savings Estimation for a Demand Response Event ....................................................6-2 Figure 6-3 Aggregated Demand Savings from Auto-DR Participants (June 23, 2006) .............................6-3 Figure 7-1 Transform Customer Behavior: Energy Savings & CO2 Reduction Mechanisms.....................7-1 Figure 7-2 Direct Energy Feedback Display Devices (Several Examples)................................................7-2 Figure 8-1 Support New Business Models – Energy Savings & CO2 Reduction Mechanisms..................8-1 Figure 8-2 Estimate of U.S. Energy Efficiency Achievable Potential through 2030...................................8-2 Figure 10-1 Emission of Greenhouse Gases in the United States, 2006 (U.S. EIA)...............................10-1 Figure 10-2 U.S. Electricity Generation Mix, 2007 (U.S. EIA) .................................................................10-2 Figure 10-3 U.S. Electricity Generation Mix, 2030 (U.S. EIA, AEO 2008)...............................................10-2 Figure 10-4 EPRI Prism Projected 2030 U.S. Generation Mix ................................................................10-3 Figure A-1 Summary of Potential Smart Grid Benefits ............................................................................. A-1


xi
LIST OF TABLES
Table 4-1 Impact of Continuous Commissioning of Large Commercial Buildings (2030) .........................4-3 Table 5-1 Impact of Reduced Line Losses – Voltage Reduction (2030) ...................................................5-3 Table 6-1 Impact of Increased Demand Response (2030)........................................................................6-4 Table 7-1 Impact of Direct Feedback on Energy Usage (2030) ................................................................7-3 Table 8-1 Impact of Enhanced Energy Efficiency M&V (2030)..................................................................8-4 Table 9-1 CO2 Impact of Smart Grid Enablement of Renewable Resource Deployment (2030) ..............9-3 Table 10-1 Smart Grid Energy Savings and Avoided CO2 Emissions Summary (2030) .........................10-4


1-1
1 THE NEW IMPERATIVE – CARBON REDUCTION The U.S. electricity grid is one of the most significant technological achievements of the 20th century. This remarkable infrastructure worth over $1 trillion includes approximately 1 million megawatts of generating capacity, 200,000 miles of high voltage transmission lines and 5.5 million miles of distribution lines that deliver power to enable services essential for living. Since electricity, which flows at the speed of light, cannot be economically stored in significant quantities, the grid must continuously balance supply to demand in real-time throughout each day. It’s no wonder that many consider the electricity grid the most complex machine ever built.
Over the years, utilities have made various cost-effective improvements to the generation and dispatch of electricity to maintain reasonably reliable and affordable service in the face of evolving electricity demands. Yet, today’s grid still largely resembles the fundamental structure of its 19th century roots, with central generating stations and electromechanical power delivery systems operated from control centers.
Today, utilities must also address a new societal and regulatory obligation – mitigating emissions of greenhouse gases, principally carbon dioxide (CO2), in an effort to curb global climate change and its potentially deleterious implications for mankind. This has far-reaching ramifications for the future of the grid.
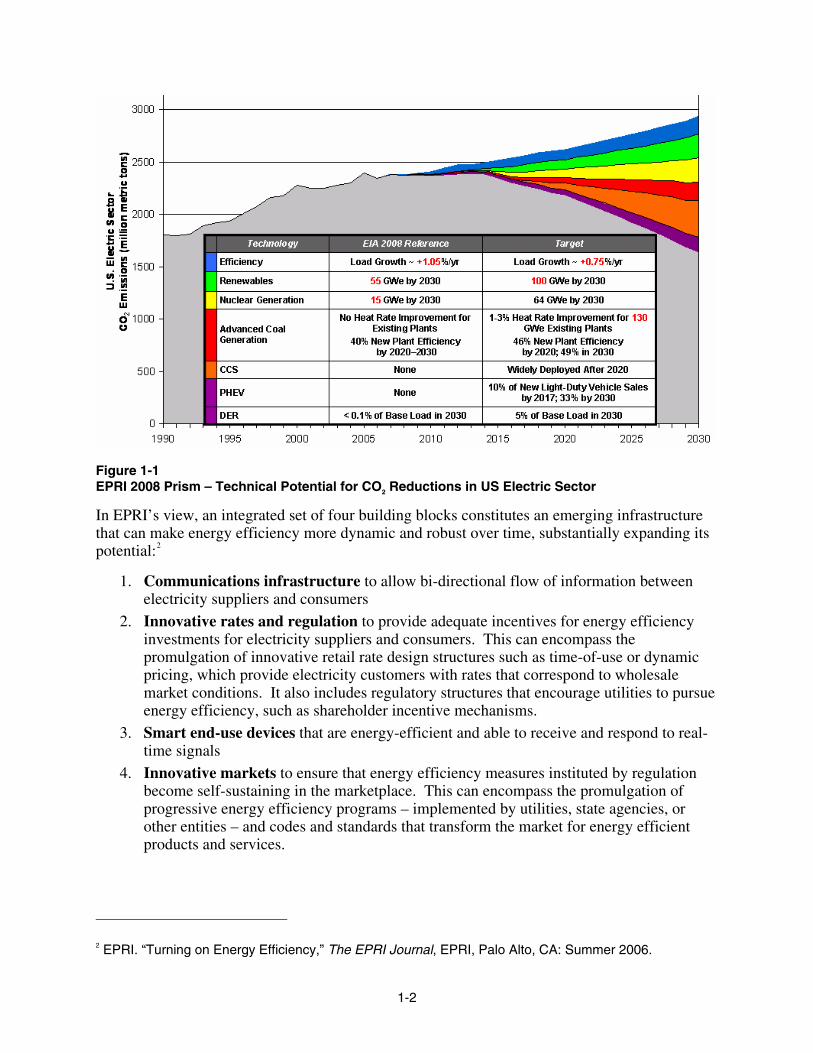
EPRI’s Prism analysis indicates that the U.S. electricity sector will need to rely on a portfolio of technologies to meet future carbon reduction goals, including energy efficiency, renewables, nuclear, advanced coal, carbon capture and storage, plug-in hybrid electric vehicles, and distributed energy resources. The EPRI Prism chart, shown as Figure 1-1, illustrates what most industry experts agree: energy efficiency – the top slice of the Prism shown in blue – is the most technically and economically viable near-term option for the electric power industry to reduce its carbon footprint.1
1 The Power to Reduce CO2 Emissions: The Full Portfolio. EPRI, Palo Alto, CA: 2008.
1-2
Figure 1-1 EPRI 2008 Prism – Technical Potential for CO2 Reductions in US Electric Sector
In EPRI’s view, an integrated set of four building blocks constitutes an emerging infrastructure that can make energy efficiency more dynamic and robust over time, substantially expanding its potential:2
1. Communications infrastructure to allow bi-directional flow of information between electricity suppliers and consumers
2. Innovative rates and regulation to provide adequate incentives for energy efficiency investments for electricity suppliers and consumers. This can encompass the promulgation of innovative retail rate design structures such as time-of-use or dynamic pricing, which provide electricity customers with rates that correspond to wholesale market conditions. It also includes regulatory structures that encourage utilities to pursue energy efficiency, such as shareholder incentive mechanisms.
3. Smart end-use devices that are energy-efficient and able to receive and respond to real-time signals
4. Innovative markets to ensure that energy efficiency measures instituted by regulation become self-sustaining in the marketplace. This can encompass the promulgation of progressive energy efficiency programs – implemented by utilities, state agencies, or other entities – and codes and standards that transform the market for energy efficient products and services.
2 EPRI. “Turning on Energy Efficiency,” The EPRI Journal, EPRI, Palo Alto, CA: Summer 2006.

1-3
Figure 1-2 Four Building Blocks of Energy Efficiency Infrastructure
While the establishment of innovative rates, regulations, and markets and the development of smart and efficient end-use devices are all key pillars of energy efficiency, the development of a Smart Grid communications infrastructure has the potential to compound energy savings beyond what is achievable through conventional piecemeal deployments of energy efficiency and demand response measures. A Smart Grid, in essence, can make the energy efficiency benefits of the whole greater than the sum of its parts.
This paper describes and quantifies how the enhanced communications and control functionality of a Smart Grid can unleash the following mechanisms to facilitate greater levels of energy savings, and therefore reductions in carbon dioxide emissions:
• Continuous commissioning of buildings
• Reduced transmission and distribution (T&D) line losses
• Direct feedback to customers
• More effective and reliable demand response and load control
• Enhanced measurement & verification (M&V) capabilities
Our analysis shows that a Smart Grid could potentially reduce annual energy consumption by 56 to 203 billion kWh in 2030, corresponding to a 1.2 to 4.3% reduction in projected retail electricity sales in 2030.3 In addition, a Smart Grid can facilitate greater integration of renewable generation resources and greater deployment of plug-in hybrid electric vehicles (PHEVs). Both of these mechanisms, while not associated with energy savings, will reduce greenhouse gas emissions, insofar as (a) renewables such as wind and solar displace fossil-burning energy sources and (b) PHEVs avoid emissions from conventional internal combustion engines in the transportation sector. The combined environmental impact of these seven Smart Grid mechanisms is an estimated annual reduction in greenhouse gas emissions equivalent to 60 to 211 million metric tons of CO2 in 2030.
3 U.S. Energy Information Administration. “Annual Energy Outlook 2008”. Reference Case electricity forecast for Residential, Commercial, and Industrial sectors.


2-1
2 THE SMART GRID CONCEPT The term Smart Grid may be best understood as the overlaying of a unified communications and control system on the existing power delivery infrastructure to provide the right information to the right entity (e.g. end-use devices, T&D system controls, customers, etc.) at the right time to take the right action. It is a system that optimizes power supply and delivery, minimizes losses, is self-healing, and enables next-generation energy efficiency and demand response applications.
Regional transmission operator PJM views a Smart Grid as encompassing three elements:4
1. Transitioning the grid from a radial system to a true network to ensure connectivity from generation sources to end-use customers;
2. Converting from an electro-mechanical to a fully digital system to support information and automation-enabled assets; and
3. Enabling two-way communication within the grid community so that customers can, if they choose, move from passive to active participation in the marketplace.
A Smart Grid entails an open standard for communications with devices – both T&D and end-use devices – advanced metering infrastructure (AMI), two-way communications between a utility and its customers, and smart interconnections to distributed energy resources. Figures 2-1 and 2-2 provide conceptual illustrations of a Smart Grid.
Figure 2-1 depicts the interaction between consumer (end-use) devices with communication capabilities, energy providers, and transmission and distribution (T&D) functions enabled by Smart Grid network operations. The end-use devices receive information such as price signals and respond by adjusting their operation accordingly and communicating their energy use characteristics upstream to the electricity provider. Consumer communication devices facilitate load aggregation and control from the scale of a single residential meter to an aggregation of multiple buildings. Energy providers consist of central generation stations and distributed energy resources including renewable energy sources. The transmission portion of the grid monitors and adjusts energy resources to provide supply continuously. The distribution portion continually models system operation and manages and corrects problems to provide reliable service. All the functions interconnect by two-way communications through the grid operator.
4 Facilitating the Transition to a Smart Electric Grid. Testimony of Audrey Zibelman, PJM Chief Operating Officer and Executive Vice President, before U.S. House of Representatives Committee on Energy and Commerce. May 3, 2007.

2-2
Figure 2-1 Smart Grid Concept, PJM Illustration5
Figure 2-2 illustrates communication pathways and sensor locations in a Smart Grid and relative orientations of energy resources, T&D functions, a regional operator, a load serving entity, and consumers. The illustration suggests, for example, automation for fault anticipation and outage detection as well as dispatchable demand response for targeted load reduction to provide relief for specific circuits.
5 PJM. “Bringing the Smart Grid Idea Home”. 2007

2-3
Figure 2-2 Smart Grid Concept, EPRI Illustration6
One of the potential applications of a Smart Grid is the notion of Prices-to-Devices (P2D), whereby dynamic utility price signals are conveyed with advanced notice or in real-time to end-use devices, which in-turn automatically adjust their operation to, for example, reduce peak demand. Figure 2-3 illustrates the concept of communications from the utility interfacing with a building’s energy management system and ultimately with smart end-use devices.
Figure 2-3 Illustration of Prices to Devices Concept 6 EPRI IntelliGrid program

2-4
A Smart Grid can serve as the conduit that transmits utility signals to smart meters or communication gateway devices, end-use devices, and to direct feedback displays that visualize the signals and thereby help consumers to manage energy use based on market prices, performance targets, or environmental considerations. A Smart Grid can also serve as the conduit to convey information on consumer responses to price signals back to utilities, thereby providing a knowledge feedback loop to help utilities more accurately predict the availability of demand-side resources and utilize them to improve overall system performance.
Another Smart Grid application is greater use of distributed energy resources during capacity constrained periods or when other conditions justify their use in the consumer’s best interest. A Smart Grid will enable more streamlined interconnection with distributed generation sources and extend two-way communication and control.
Moreover, the intelligence of a Smart Grid will facilitate greater utilization of intermittently available renewable resources such as solar and wind, from which will accrue reductions in CO2 emissions. Because of the intermittent nature of wind and solar, their operation entails minute-to-minute fluctuations in power generated as wind speeds change or clouds affect solar exposure. These fluctuations in power, if not counterbalanced in real time, can lead to frequency imbalance and disturb the stability of the electrical system. The intelligence of a Smart Grid, however, can provide these counterbalances necessary for system stability through more precise demand-response for load control and dispatch of other generation resources. A first-order estimate of a Smart Grid’s contribution to CO2 reductions projected from enhanced integration of intermittent renewable generation sources is described in Chapter 9.
A Smart Grid will also facilitate the market adoption and interconnection of plug-in hybrid electric vehicles (PHEVs), hybrid electric vehicles that can be plugged into electrical outlets for recharging. A first-order estimate of a Smart Grid’s contribution to CO2 reductions projected from PHEV deployments is described in Chapter 9.
A Smart Grid is a critical element in EPRI’s vision for Dynamic Energy Management, the synergistic effect of a Smart Grid with smart energy-efficient end-use devices, advanced whole building control systems, and smart distributed energy resources to yield energy savings and peak demand reductions greater than what could otherwise be realized. A Smart Grid would potentially link all of these elements together and provide constant communications between a utility and its customers to optimize energy efficiency and mitigate emissions. Figure 2-4 illustrates the Dynamic Energy Management concept applied to a building.

2-5
Figure 2-4 Concept of Dynamic Energy Management Enabled by a Smart Grid
Although the focus of this paper is a Smart Grid’s potential energy savings and carbon reduction impacts, a Smart Grid has numerous additional operational, customer, and societal benefits. The Appendix includes an extensive list of Smart Grid benefits to consumers, the environment, electric utilities, and the nation as a whole. The next chapter provides an overview of a Smart Grid’s goals and the mechanisms for energy savings and carbon reductions enabled by a Smart Grid.


3-1
3 SMART GRID MECHANISMS FOR ENERGY EFFICIENCY & CARBON REDUCTIONS From a utility’s perspective, a Smart Grid can be viewed as a means to further five primary goals:
(1) Enhance Customer Service;
(2) Improve Operational Efficiency;
(3) Enhance Demand Response and Load Control;
(4) Transform Customer Energy Use Behavior; and
(5) Support More Utility Energy Efficiency Investment.
In furthering these goals, a Smart Grid can streamline operations and enable utilities to tap into new avenues to save energy and reduce carbon emissions to levels greater than would otherwise be attainable. Figure 3-1 depicts how selected mechanisms enabled by a Smart Grid are related to these fundamental utility goals, and how they represent pathways to energy savings and/or carbon reductions.
The remainder of this document describes the mechanisms for energy savings and carbon reductions enabled by a Smart Grid as they pertain to each of the five goals. Although numerous mechanisms have been identified, this study emphasizes the more direct mechanisms for energy savings and, in-turn, reduced carbon emissions. Several of the mechanisms associated with these goals are somewhat indirect or their energy savings potentials are difficult to quantify readily on a national scale because they involve complex market, institutional, and behavioral interactions that can vary considerably across the nation. This study quantifies the energy savings and carbon reduction impact of selected discrete mechanisms to provide insight into the magnitude of Smart Grid environmental benefits. The first-order approximations have been made using readily available data combined with expert judgment.

3-2
Reduce Carbon
Emissions
Yield Energy Savings (kWh)
Smart Grid
Reduce Peak Demand
Indirect Feedback via
Improved Billing
Reduced Transportationvia Automated Meter Reading
Reduced Line Losses;
Voltage Control
Improve Operational Efficiency
Greater EEDeployment
via Enhanced M&V
Expanded Options for Dynamic Pricing
and Demand Response
Indirect Feedback via Improved Metering and
Billing
Peak Demand Reductions
Reduced Operation of
Peaking Plants
Continuous Commissioning/
Proactive Maintenance
Integration of Intermittent Renewables
Facilitation of PHEV
Deployment
Accelerated Device Innovation via
Open Standards
Transform Customer Energy
Use Behavior
EnhanceDemand Response/
Load Control
Enhance Customer Service
Support MoreUtility EE
Investment
Direct Feedbackvia
Display Devices
Greater Availability of Green Power
Eased Deployment of Renewables to
Meet Peak Demand
Figure 3-1 Utility Smart Grid Goals: All Paths Lead to Carbon Reductions
The mechanisms selected for analysis and first-order approximation are indicated in bold in Figure 3-2. As the figure shows, some of the energy savings and carbon reduction benefits overlap across the various goals. For example, indirect feedback to customers via improved billing is related to improvements in operational efficiency and to transforming customer energy use behavior. In addition, greater options for dynamic pricing and demand response are related to enhancing customer service as well as to enhancing demand response.

3-3
Figure 3-2 Summary of Energy-Savings & Carbon-Reduction Mechanisms Enabled by a Smart Grid
Enhance Customer Service
Improve Operational Efficiency
Enhance Demand
Response and Load Control
Transform Customer Energy
Use Behavior
Support New Utility
Business Models
Smart Grid
♦ Continuous Commissioning/Proactive Maintenance
♦ Greater Availability of Green Power
♦ Expanded Options for Dynamic Pricing and Demand Response Services
♦ Reduced Line Losses; Voltage Control
♦ Reduced Meter-Reading Transportation Requirements through Automated Meter Reading
♦ Indirect Feedback to Customers through Improved Metering and Billing
♦ Energy Savings through Peak Demand Reductions
♦ Eased Deployment of Renewable Resources to Meet Peak Demand
♦ Reduced Operation of Less Efficient Peaking Plants
♦ Direct Feedback to Consumers of Energy Usage via Display Devices
♦ Indirect Feedback to Consumers Via Improved Billing
♦ Greater Deployment of Energy Efficiency and through Enhanced Measurement and Verification (M&V) Capabilities
♦ Accelerated Device Innovation through Open Standards


4-1
4 ENHANCE CUSTOMER SERVICE A Smart Grid has the potential to enhance customer service in a variety of ways. A Smart Grid’s advanced communications infrastructure, for example, allows the information transfer necessary to monitor outages, power quality, and other disruptions in service. With two-way communications, utilities can locate problem areas, inform customers, and restore service more quickly. This quick response time results in improved power quality and reliability, reduced service interruptions, and shorter outage durations for customers.
A Smart Grid will also enable utilities to offer an expanded portfolio of services to customers. Figure 4-1 summarizes a Smart Grid’s primary mechanisms for energy savings and the corresponding reductions in carbon emissions through enhanced customer service.
Smart Grid Goal: Enhance Customer Service Mechanisms for Energy Savings and Reductions in Carbon Emissions
♦ Continuous Commissioning/ Proactive Maintenance Services
♦ Easier Access to “Green Power”
♦ Greater Options for Dynamic Pricing and Demand Response Service
Figure 4-1 Enhance Customer Service: Energy Savings & CO2 Reduction Mechanisms
Continuous Commissioning & Proactive Maintenance of End-Use Equipment
Monitoring and proactive maintenance of end-use equipment can be an avenue for energy savings and associated reductions in carbon emissions. When equipment such as a chiller system, refrigeration equipment, or an energy management control system is first installed in a building, it is typically commissioned, meaning that it is sized, specified, and tested for a particular duty cycle and pattern of operation based on expected levels of occupancy, weather, and other load-determining factors. Whether or not equipment is properly commissioned at the time of installation (which in many cases, it is not), changes in operational requirements over time tend to render initial equipment settings sub-optimal for operational efficiency as well as for energy efficiency. As a result, re-commissioning is important to ensure the best equipment performance. In some cases, the systems in existing buildings were never commissioned during design and construction; retro-commissioning is the term used to describe commissioning in these buildings.
In the absence of a Smart Grid, commissioning existing equipment for optimal performance and efficiency is typically a tedious, time-consuming process for building facility managers, requiring manual inspection and testing of end-use devices. However, the advent of a Smart Grid would facilitate continuous commissioning, whereby equipment settings and performance

4-2
could be constantly monitored and updated to optimize performance and efficiency in a more automated fashion.
With the two-way communications of a Smart Grid infrastructure in place, a utility could monitor the performance of major customer equipment through advanced interval metering and on-premise energy management control systems. The utility would be able to send alerts to a facility energy manager to indicate if major equipment is not performing up to nameplate efficiency specifications. With this information in hand, the facility manager may then choose to either adjust the operational settings of existing equipment or replace sub-optimal equipment with more energy-efficient equipment to improve overall operational efficiency. Depending on the service agreement, the utility may also offer to send a representative to re-commission the equipment for a customer. The result would be a greater degree of proactive maintenance that would benefit the customer by improving operation and reducing energy costs, and would benefit the utility by fostering enhanced customer relations and potentially reducing peak load. The energy savings would also equate to a reduction in carbon emissions.
Experience shows that commissioning is particularly cost-effective in large commercial buildings (> 100,000 ft2), and can yield overall energy savings of 15% (or 17 kBTU/ft2-yr), and electricity savings of 9% (or 1.7 kWh/ft2-yr).7 Despite its benefits, commissioning has yet to achieve widespread penetration – there is still considerable room for growth. A Smart Grid has the potential to accelerate the adoption of commissioning programs, and offers a new opportunity in the form of continuous commissioning.
To quantify the potential impact of continuous commissioning of large commercial buildings, we first determined the electricity use in all existing non-mall buildings with floor space greater than 100,000 ft2; this value was 359 billion kWh in 2003.8 Assuming that the large commercial building segment maintains a proportionate share of total electricity consumption into the future, this consumption is projected as 492 billion kWh in the reference year of 2030.9 We then determined a marginal market penetration range for continuous commissioning in 5% to 20% of large commercial buildings attributable to a Smart Grid. On this basis, the annual energy savings potential ranges from 2.2 to 8.8 billion kWh, depending on the level of market penetration. This is equivalent to a 0.14 to 0.18% reduction in retail sales of electricity projected in the EIA 2008 Annual Energy Outlook for the year 2030. Table 4-1 summarizes the results of this analysis.
7 The Cost-Effectiveness of Commercial-Buildings Commissioning: A Meta-Analysis of Energy and Non-Energy Impacts in Existing Buildings and New Construction in the United States, LBNL, Berkeley, CA: December 2004. LBNL-56637. 8 2003 Commercial Building Energy Consumption Survey, Energy Information Administration, U.S. Department of Energy, Washington, DC: December 2006. 9 Total U.S. electricity consumption in 2003: 3,494 TWh. Total U.S. electricity consumption projected in 2030 (AEO 2008 Reference Case): 4,775 TWh. Scaling ratio 2030/2003: 1.37.

4-3
Table 4-1 Impact of Continuous Commissioning of Large Commercial Buildings (2030)
Continuous Commissioning of Large Commercial Buildings Electricity Use in Non-Mall Commercial Buildings ≥ 100,000 ft2, 2003i
359 billion kWh Electricity Use in Non-Mall Commercial Buildings ≥ 100,000 ft2, 2030ii
492 billion kWh Percent Reduction in Building Energy Use by Continuous Commissioning iii
9% Market Penetration Effect, 2030
5% 2.2 billion kWh 10% 4.4 billion kWh 15% 6.6 billion kWh 20% 8.8 billion kWh
i. 2003 Commercial Building Energy Consumption Survey, Energy Information Administration, U.S. Department of Energy, Washington, DC: December 2006. ii. Total U.S. electricity consumption in 2003: 3,494 TWh. Total U.S. electricity consumption projected in 2030 (AEO 2008 Reference Case): 4,775 TWh. Scaling ratio 2030/2003: 1.37. iii. The Cost-Effectiveness of Commercial-Buildings Commissioning: A Meta-Analysis of Energy and Non-Energy Impacts in Existing Buildings and New Construction in the United States, LBNL, Berkeley, CA: December 2004. LBNL-56637.
Easier Access to Green Power
A Smart Grid can enhance customer service by expanding the availability of Green Power, an option that a significant and growing segment of consumers and businesses value. More precisely, a Smart Grid provides the required intelligence to integrate intermittent renewable resources such as wind and solar into the power system to meet the requirements of system reliability and stability. This mechanism is explained in Chapter 9.
Greater Options for Dynamic Pricing and Demand Response Services
Though primarily intended to reduce peak demand through load reduction and/or load shifting, demand response services (including mechanisms such as dynamic pricing) can often result in a degree of energy savings and, subsequently, reductions in carbon emissions. A Smart Grid will increase the frequency and duration for which customers respond to demand response events, which could lead to more energy savings and reduced carbon emissions. This benefit crosses over to the Smart Grid goal of Enhancing Demand Response and Load Control, and is afforded a more detailed discussion and quantification in Chapter 6.


5-1
5 IMPROVE OPERATIONAL EFFICIENCY A Smart Grid will enable a number of operational benefits for utilities, many of which go hand-in-hand with the customer service benefits already discussed. Benefits include advanced distribution management functions, outage management, power theft detection, as well as automated change of service, improved asset management capabilities, greater load profiling ability, grid stabilization, and a variety of advanced metering functions.
Figure 5-1 summarizes the main mechanisms for energy savings and CO2 reductions due to improved operational efficiency enabled by a Smart Grid.
Smart Grid Goal: Improve Operational Efficiency Mechanisms for Energy Savings and Reductions in Carbon Emissions
♦ Reduced Line Losses
♦ Reduced Transportation Requirements through Automated Meter Reading
♦ Indirect Feedback to Consumers on Energy Use through Improved Metering and Billing Capability
Figure 5-1 Improve Operational Efficiency: Energy Savings & CO2 Reduction Mechanisms
Reduced Line Losses
According to data from the Energy Information Administration, net generation in the U.S. was about 4,055 million megawatt hours (MWh) in 2005 while retail power sales during that year were about 3,816 million MWh.10 T&D losses, therefore, amounted to 239 million MWh, or 5.9% of net generation.
There are a number of measures utilities can undertake that can reduce T&D losses, including upgrading distribution transformers, reconductoring transmission lines, utilizing distributed generation closer to load centers, and building new substations. However, these measures typically require large capital expenditures and are usually undertaken to meet T&D capacity or replacement requirements rather than for the purpose of reducing losses. The loss reduction impact of such T&D infrastructure projects are usually regarded as ancillary benefits not central to their respective business cases.
10 U.S. DOE, Energy Information Administration, Tables 1.1 (Net Generation by Energy Source by Type of Producer, 1994 through 2005) and 7.2 (Retail Sales and Direct Use of Electricity to Ultimate Customers by Sector, by Provider, 1994 through 2005). Net Generation is net of utility power system auxiliary loads, including electricity consumption at power stations and other utility facilities.

5-2
A Smart Grid has the potential to reduce energy losses that occur in the transmission and distribution of electricity from generation sources to end-users using the existing power infrastructure. The promulgation of open communications standards through a Smart Grid will enable utilities to monitor and modulate the operating parameters of what today are operationally incompatible components in the T&D infrastructure.
In transmission, for example, a Smart Grid will facilitate more effective reactive power compensation and voltage control to maintain system voltages within acceptable limits and minimize system losses. Reactive power flows in the grid consume transmission capacity, thus limiting a system’s ability to move real power. Management and control to minimize reactive power in the grid, via a Smart Grid, will allow a utility to maximize the amount of real power that can be transferred across congested transmission lines and thereby minimize transmission losses.
The primary operating lever that utilities can use to affect the flow of reactive power is voltage control, which is accomplished through the use of various devices that inject, absorb, or force the flow of reactive power in the grid. These devices include: synchronous generators, synchronous condensers, shunt capacitors, shunt reactors, static VAR compensators (SVC), and STATCOM (STATic COMpensators). A Smart Grid will facilitate the application and monitoring of such devices.
Similarly, a Smart Grid will enable opportunities to reduce distribution line losses through adaptive voltage control at substations and line drop compensation on voltage regulators and load tap changers (LTCs) to levelize feeder voltages based on load. The American National Standards Institute (ANSI) standard C84.1, specifies a preferred tolerance of +/- 5% for 120V nominal service voltage to the customer meter, or a range of 114 – 126 V. Utilities tend to keep the average voltage above 120V to provide a safety margin during peak load periods.11 However, maintaining voltage on the upper end of the ANSI C84.1 band at all times, which most utilities do, wastes energy. A Smart Grid will allow utilities to place sensors at the ends of feeders to monitor and maintain voltage at 114 V, which minimizes energy losses without compromising the quality of delivered electrical service. While the impact of voltage reduction on energy consumption will vary from circuit to circuit based on resistive or reactive nature of the load, utility experience has shown that, on average, a 1% reduction in voltage yields a 0.8% reduction in power draw.12
A Smart Grid will also facilitate more intelligent controls on capacitors, optimizing their usage to reduce system losses further. A Smart Grid will also enable automatic reconfiguration to minimize losses during the day, which requires distribution state estimations, more sensors, and real time control.
To quantify the impact of a Smart Grid on T&D efficiency we have focused on the potential to regulate voltage more precisely. We have assumed that additional voltage reduction enabled by a Smart Grid would be confined to the residential sector, since residential loads tend to be more resistive and therefore more responsive to voltage reduction, as opposed to commercial and industrial loads which tend to be more reactive due to increased motor and refrigeration loads.
11 Northwest Energy Efficiency Alliance. Distribution Efficiency Initiative, Market Progress Report, No. 1. Report #E05-139. Prepared by Global Energy Partners, LLC, Lafayette, CA: May 18, 2005. 12 Ibid.

5-3
Of the 2,179 distribution substations in the U.S. (reference ii in Table 5-1), 70% are assumed to serve predominantly residential circuits (reference iii in Table 5-1). Table 5-1 presents a range of savings induced by a Smart Grid as a function of:
• Market penetration of voltage regulation between 25% and 50% of residential distribution substations by 2030 (7.5% of distribution circuits already have voltage regulation capability)13; and
• Average percent voltage reduction between 1% and 4% (i.e. between 1.3 and 5.0 V from a baseline of 126 V).
Table 5-1 Impact of Reduced Line Losses – Voltage Reduction (2030)
Energy Savings Corresponding to Reduced Line Losses (Voltage Reduction Example)
Baseline Residential Retail Electricity Sales, 2030i [billion kWh] 1,737
U.S. Distribution Substations ii 2,179
U.S. Distribution Substations Serving Predominantly Residential Circuits iii 1,525
Ratio of Residential Electricity Sales per Residential Distribution Substation 1.14 billion kWh / Res. Distribution Substation
Ratio of Load Reduction to Voltage Reduction 0.8
(1% reduction in voltage yields 0.8% reduction in load) Average Percent Voltage Reduction 1.0% 2.0% 3.0% 4.0% Market Penetration Effect, 2030 [billion kWh]
25% of Res. Dist. Substations (381) 3.5 7.0 10.4 14.0
50% of Res. Dist. Substations (762) 7.0 14.0 20.8 28.0
i. Annual Energy Outlook 2008 with Projections to 2030 (Revised Preliminary Reference Case), Energy Information Administration, U.S. Department of Energy, Washington, DC: March 2008. DOE/EIA-0383(2008). ii. The Electric Delivery System, U.S. Department of Energy, Office of Electricity Delivery & Energy Reliability. Washington, DC: February 2006. iii. Assumption based on application of ratio of “Substations Serving Residential and Small Commercial” to “Total No. Substations” in Table 4-2 (“Summary of Utility Distribution System Metrics”) of Northwest Energy Efficiency Alliance’s Distribution Efficiency Initiative, Market Progress Report, No. 1. Report #E05-139. Prepared by Global Energy Partners, LLC. May 18, 2005. On this basis, we quantify the savings range for a Smart Grid in reducing losses through voltage regulation as 3.5 to 28.0 billion kWh per year in 2030.
13 Northwest Energy Efficiency Alliance. Distribution Efficiency Initiative, Market Progress Report, No. 1. Report #E05-139. Prepared by Global Energy Partners, LLC, Lafayette, CA: May 18, 2005.

5-4
Reduced Transportation Requirements through Automated Meter Reading
A Smart Grid’s advanced metering functions will greatly simplify a utility’s meter reading process. Since meters can be read from a central location through automated meter reading, utilities will not need to dispatch workers to drive to read each meter. This reduction in transportation requirements means less fuel consumption and less carbon emissions from the vehicle tailpipe. Moreover, advanced metering will also virtually eliminate meter reading errors, and will facilitate more frequent, accurate, and informative billing.
Indirect Feedback to Customers on Energy Use through Improved Metering & Billing
Informative billing is a pathway for indirect feedback to consumers on their energy use characteristics beyond conventional billing. Some studies suggest that such indirect feedback mechanisms inspire changes in consumer energy use behavior, yielding significant energy and demand savings and associated reductions in greenhouse gas emissions.
However, based on the range of studies and demonstrations conducted, the conservation effect of enhanced billing and indirect feedback is inconclusive. A prominent meta study of energy bill reductions attributable to information indicated that indirect feedback through enhanced billing detail resulted in a 0 to 10% reduction in energy consumption.14 A pilot study of 106 participants in Milton, Ontario (Canada) showed that indirect feedback through enhanced weekly billing in various formats yielded no discernable reduction in energy consumption.15
This divergence in results suggests that a conservation effect is a function of electricity rates levels, rate design structure, regional attitudes towards energy conservation, information delivery mechanism (online and/or mailed delivery), and data presentation (graphical representation, normative and historical benchmark comparisons, choice of highlighted metrics, etc.)
This mechanism for energy savings crosses over to the Smart Grid goal of Transforming Customer Energy Use Behavior, which is discussed in greater detail in Chapter 7. However, the marginal energy savings and carbon reduction benefits of this mechanism attributable directly to a Smart Grid are assumed to be negligible relative to other potential mechanisms enabled by a Smart Grid.
14 Darby, Sarah. “The Effectiveness of Feedback on Energy Consumption: A Review for DEFRA of the Literature on Metering, Billing, and Direct Displays”, Environmental Change Institute, University of Oxford, UK: April 2006. 15 Robinson, Jennifer. “The Effect of Electricity-Use Feedback on Residential Consumption: A Case Study of Customers with Smart Meters in Milton, Ontario.” University of Waterloo. 2007.

6-1
6 FACILITATE ENHANCED DEMAND RESPONSE AND LOAD CONTROL The advanced communications infrastructure of a Smart Grid will allow utilities to monitor aggregate grid load continuously, to give customers price signals that more accurately represent wholesale market prices (dynamic pricing), to control residential loads by direct manipulation of end-use devices during capacity-constrained periods within user-prescribed thresholds (direct load control or DLC), and to interrupt commercial and industrial customer loads at times of seasonal peaks by direct control or direct request of the utility system operator (interruptible load). Dynamic pricing provides customers with an economic incentive to reduce loads during peak periods of the day or during special peak events (e.g. Critical Peak Pricing) when electricity rates are higher. Consumers may exhibit such demand response on their own accord even without utility DLC.
In addition, the interface of a Smart Grid with two-way communications and smart devices will make it easier for customers to participate in automated demand response (Auto-DR) programs. Auto-DR technology enables customers, either with or without assistance from their electric service provider, to pre-program load reduction strategies into smart devices such as Energy Management and Control Systems. Once programmed, load is then automatically reduced based on communication signals from the utility without the need for any further customer intervention; although a manual over-ride option would generally be accommodated. The advanced control capabilities of devices operating within a Smart Grid will also make it easier for utilities to implement other types of load control technologies such as load-limiting devices and thermal energy storage systems that may yield more permanent peak demand reductions, as distinguished from demand response programs that yield temporary peak load reductions.
All of these characteristics will help accelerate the adoption of demand response and load control programs. The obvious benefit is the ability to reduce peak demand, which in turn provides relief during capacity-constrained periods, reduces transmission congestion, minimizes operation of peaking plants, and defers the need for new generation. In addition, the load reductions offered by demand response and load control programs facilitated by a Smart Grid can yield energy savings and reductions in carbon emissions. The three main mechanisms for energy savings and carbon reductions associated with this Smart Grid goal are listed in Figure 6-1.
Smart Grid Goal: Enhance Demand Response Mechanisms for Energy Savings and Reductions in Carbon Emissions
♦ Energy Savings through Peak Demand Reductions
♦ Eased Deployment of Renewable Resources to Reduce Peak Demand
♦ Reduced Operation of Less Efficient Peaker Plants
Figure 6-1 Enhance Demand Response: Energy Savings & CO2 Reduction Mechanisms

6-2
Energy Savings through Peak Demand Reductions (Demand Response Programs)
The curtailment of load during a demand response event yields energy savings, and therefore reduced emissions, as illustrated in Figure 6-2. The amount of energy savings is a function of the frequency and duration of the demand response event. While utilities and customers engage in demand response today, a Smart Grid will enable more frequent and longer duration demand response events, which will yield incremental energy savings and reduced carbon emissions.
8,760 0 Hours Below MW Condition
Dem
an
d (
MW
)
Baseload MW
Requirements
Intermediate MW
Requirements
Unconstrained Peak Load
Constrained Peak Load
Energy Savings Potential
Figure 6-2 Energy Savings Estimation for a Demand Response Event16
Global Energy Partners recently conducted an impact assessment of a series of Auto-DR programs implemented in commercial buildings in California in the 2006-2007 period. The results show that the net energy savings corresponding to the programs are consistently measurable and positive. Each demand response event yielded peak demand reductions and energy savings, followed by a brief period of energy “rebound” where energy consumption increased in the couple of hours following a demand response event. The net result in energy savings, however, was always positive for each of the buildings analyzed. Figure 6-3 shows the results of the Auto-DR technology for commercial customers participating in PG&E’s Critical Peak Pricing tariff on June 23, 2006.17 The results illustrate the peak demand reduction enabled by the Auto-DR technology.
16 Redrawn from: Demand Trading: Building Liquidity, EPRI, Palo Alto, CA: 2002. 1001635. 17 California Public Utility Commission Docket No. A.05-06-006 et al. MP1/KLM/k47.

6-3
Figure 6-3 Aggregated Demand Savings from Auto-DR Participants (June 23, 2006)
The average ratio calculated for the programs was 65 kWh of energy savings for each kW of peak demand reduction. To date, data of this type are only available for commercial buildings. For the purposes of this first order approximation, we assume that these data apply to residential and industrial buildings as well, and that they can be extended to apply to all types of demand response programs, not just auto-DR.
In addition, a study by the Brattle Group projects that dynamic pricing programs enabled though an advanced communications and metering infrastructure (vis-à-vis, a Smart Grid) has the potential to reduce peak demand by 5%, assuming 43% of customers in each sector (residential, commercial and industrial) implement a cost-effective combination of demand response enabling technologies.18 This level of peak demand reduction represents a marginal upper-bound potential of demand response due to an advanced Smart Grid infrastructure.
To estimate the potential energy savings associated with this level of peak demand reduction, the 5% Brattle value is multiplied by the peak demand forecast for 2030, and the ratio of 65 kWh saved per kW of peak demand reduction observed in the California Auto-DR project is applied. Since the peak demand reduction potential is optimistic, we have included a range of potential energy savings that begins at zero and has an upper bound of 3.7 billion kWh per year, which is equivalent to a 0.08% reduction in the retail sales of electricity across the residential, commercial, and industrial sectors, as summarized in Table 6-1.
18 The Brattle Group. The Power of Five Percent: How Dynamic Pricing Can Save $35 Billion in Electricity Costs. San Francisco, CA: May 16, 2007.

6-4
Table 6-1 Impact of Increased Demand Response (2030)
Energy Savings Corresponding to Increased Demand Response Peak Demand Forecast, 2030i
1,140 GW = 1.14 billion kW Potential for Peak Demand Reduction due to Smart Gridii 5% (residential, commercial, and industrial sectors combined)
Ratio of Energy Savings to Peak Demand Reduction Achieved by Auto-DR Programs in California in 2007iii
65 kWh per KW Energy Savings, 2030
0 - 3.7 billion kWh
i. North American Electric Reliability Corporation (NERC). Peak Demand and Energy Projection Bandwidths — 2005-2014 Regional and National. Value for 2030 was determined as an extrapolation of projected U.S. summer peak demand.
ii. The Power of Five Percent: How Dynamic Pricing Can Save $35 Billion in Electricity Costs, The Brattle Group, San Francisco, CA: May 16, 2007.
iii. Data compiled by Global Energy Partners for commercial buildings. Due to limited available data, we assume that this extends to residential and industrial buildings and to other types of demand response programs as a first order approximation.
The event-based or price-induced load reductions associated with demand response efforts also yield economic benefits for utilities and consumers. Brattle values the economic benefits of 5% peak demand reduction at $35 billion over a 20-year time horizon, attributable to avoided generation capacity costs, avoided energy costs, and avoided T&D capacity costs.19
However, it is important to note that demand response activities that only serve to shift load from on-peak to off-peak periods may not necessarily save energy. In such cases, even if net energy consumption is the same, if the supply mix is more carbon-emitting during the off-peak period (i.e. greater use of coal) than during the on-peak period (i.e. greater use of cleaner-burning gas-fired peakers) the net result of load shifting could be an increase in carbon emissions. Moreover, some demand-responsive load shifting strategies, while economically sound for both consumers and the utility, may actually increase net energy consumption through a rebound effect in which more energy is used during the off-peak to compensate for energy saved during the on-peak.20,21 For example, pre-cooling a building during off-peak hours to avoid running air conditioning at peak (i.e. allowing building temperatures to rise up to the designated comfort threshold), while perhaps yielding bill savings for the customer and satisfying peak load reduction objectives of
19 Ibid. 20 A Survey Of Time-of-Use (TOU) Pricing and Demand-Response (DR) Programs, prepared for the U.S. Environmental Protection Agency, prepared by Energy & Environmental Economics, San Francisco, CA: July 2006. 21 Barbose, G., C. Goldman, R. Bharvirkar, N. Hopper, M. Ting and B. Neenan, Real Time Pricing as a Default or Optional Service for C&I Customers: A Comparative Analysis of Eight Case Studies, Lawrence Berkeley National Laboratory, University of California, Berkeley, CA: 2005. Report LBNL-57661.

6-5
the utility, could result in a net increase in carbon emissions. Nevertheless, as mentioned previously, recent results from Auto-DR programs in California suggest that the energy savings during a typical demand response event outweigh the subsequent energy increase due to rebound after the event, resulting in a net energy-savings benefit. Moreover, modeling work conducted in New England determined that demand response programs yielded a net reduction in emissions of CO2, as well as nitrogen- and sulfur-oxides.22
Energy Savings through Peak Demand Reductions (Other Load Control Programs)
Other load control programs besides those characterized as demand response may yield temporary or even permanent peak load reductions and corresponding energy savings. An examination of the combined annual impacts of all load control programs (including demand response via dynamic pricing, DLC, interruptible loads, thermal energy storage, and load limiting devices in energy management systems) implemented by large utilities across the U.S. shows that the net energy savings corresponding to the programs are also consistently measurable and positive. For example, load control programs implemented in the U.S. in 2005 yielded peak demand reductions of 10,359 MW and energy savings of 1.01 billion kWh.23 That is, the programs resulted in energy savings of 97 kWh for each kW of peak load reduction. The average ratio observed over the last ten years of peak load management programs tracked by the U.S. Energy Information Administration is 113 kWh of energy savings for each kW of peak load reduction, which is considerably is higher than the 65 kWh/kW ratio observed for recent Auto-DR programs. The variance may be due in part to the more permanent nature of some of the non-demand-response load control efforts.
A Smart Grid will likely facilitate the implementation of all types of load control programs beyond just demand response, due to its advanced control features. However, the extent to which the energy savings from these other types of load control programs will increase directly due to a Smart Grid is difficult to predict without additional data or analysis.
Eased Deployment of Renewable Resources to Meet Peak Demand
As discussed previously, Smart Grid infrastructure will allow for easier implementation of distributed photovoltaic systems during hot days when power plants are constrained.24 In addition, a Smart Grid will enable wind power to be delivered more effectively when available to address peak demand. The increased use of renewable resources reduces energy production requirements in fossil-fuel-fired generation plants and lowers greenhouse gas emissions. This mechanism is described in more detail in Chapter 9.
22 Synapse Energy Economics, Inc. “Modeling Demand Response and Air Emissions in New England”. September 2003. 23 Electric Power Annual 2005, Energy Information Administration, U.S. Department of Energy, Washington, DC: 2006. Table 9.4: Demand-Side Management Program Annual Effects by Sector, 1994 through 2005. 24 Michel, Jeffrey, “Climate Protection Strategies using Advanced Power Meters,” EnergyPulse, Denver, CO: April 3, 2007 (Part I), April 4, 2007 (Part II).

6-6
Reduced Operation of Less Efficient Peaking Plants
Peaker plants, which are only operated during peak demand periods, are typically less efficient than base load generation plants; peakers require start-up and shut-down operations, whereas base load plants operate continuously. Therefore, avoiding the use of peaker plants through additional demand response, load control, or load shifting enabled by a Smart Grid may, at face value, be considered as another mechanism for kilowatt-hour savings. With respect to load shifting activities, however, there is an important caveat to potential carbon reductions: most peaker plants are natural gas-fired. While gas-fired peaker plants may be less efficient than base load generation plants fueled with coal, gas is also a cleaner burning fuel than coal, emitting less CO2 per unit of energy generated. So, a shift in energy consumption away from peaker plants to base load plants may not necessarily equate to marginal carbon reduction. It is dependent on the unit efficiencies of individual plants and the changing composition of a utility’s supply mix over the course of a day.

7-1
7 TRANSFORM CUSTOMER ENERGY USE BEHAVIOR Decades of literature indicate that increased awareness of energy costs and environmental impacts motivates customers to alter their behavior to be more energy efficient. The advanced metering and communications infrastructure of a Smart Grid will provide both direct and indirect feedback on energy consumption and cost to consumers, empowering them to become more responsive and proactive in how they use energy. Figure 7-1 lists the mechanisms for achieving energy savings and carbon emissions reductions associated with the Smart Grid goal of Transforming Customer Energy Use Behavior.
Smart Grid Goal: Enable Market Transformation in Customer Energy Use Behavior
Mechanisms for Energy Savings and Reductions in Carbon Emissions
♦ Direct Feedback to Consumers via Display Devices
♦ Indirect Feedback to Consumers via Improved Billing
Figure 7-1 Transform Customer Behavior: Energy Savings & CO2 Reduction Mechanisms
Direct Feedback to Consumers via Display Devices
A Smart Grid can enable direct feedback to consumers on their power consumption conveyed on sophisticated meters and/or via in-home or in-building display devices. The information presented to consumers could consist of various parameters conveyed numerically, graphically, or symbolically as conditions, alerts or alarms, including: (a) current and historical energy use, (b) equivalent CO2 emissions based on (a); (c) instantaneous demand; (d) contemporaneous prices; and (e) ambient temperature, humidity, and lighting levels. The forms of display devices under development vary, consisting of visual indicators employing data tables, charts, color-codes (e.g., the Ambient Energy “Energy Orb”), and flashing lights as well as audio indicators in which alarms are triggered by preset values to inform the consumer of pending price events or energy use thresholds. These display devices, examples of which are shown in Figure 7-2, may be used in conjunction with demand response programs or may be used simply to increase consumer awareness.

7-2
Figure 7-2 Direct Energy Feedback Display Devices (Several Examples)
A U.K. meta-study of over 20 direct feedback studies or pilots conducted across the U.S., Canada, and Europe, documents an energy savings range of 5 to 15% attributable to direct feedback through in-home displays of energy use in residential applications, independent of demand response programs.25 However, similar results have been realized by other means, such as intensive involvement through daily meter readings or external support from a support group or coach. Studies of the persistence of energy savings indicate that consumer behavior generally persists if it is formed over three months or longer, provided that the feedback is continued.26
In addition, a 2006 study conducted by Hydro One showed energy savings of 6% resulting from real-time feedback devices in homes in Ontario, Canada.27 The device implemented in the Hydro One study conveyed information on energy use, cost, and CO2 emissions.
Both of these studies indicate that the potential to transform consumer behavior through direct feedback alone — not including effects of energy efficient end-use devices, demand response programs or dynamic pricing — is potentially high. However, consensus is lacking on which feedback mechanisms are most effective.
Since data on direct feedback impact in the U.S. is limited, we have applied the lower bound of observed energy savings and assumed, conservatively, that direct feedback enabled by a Smart Grid has the potential to yield energy savings of 5% for the residential sector. Similar data for the commercial and industrial sectors are not readily available. So, as a first order approximation, we assumed that energy savings of 2.5% are feasible for both the commercial and industrial sectors. We then evaluated the potential energy savings for a range of possible market penetration levels for the target year of 2030. The annual energy savings potential across all three sectors ranges from 40-121 billion kWh depending on the level of market penetration, as summarized in Table 7-1. The lower bound assumes 25% penetration while the upper bound assumes 75% penetration; a wide margin considering that this mechanism is highly dependant on the actions taken by
25 Darby, Sarah. “The Effectiveness of Feedback on Energy Consumption: A Review for DEFRA of the Literature on Metering, Billing, and Direct Displays”, Environmental Change Institute, University of Oxford, UK: April 2006. 26 Ibid. 27 EPRI. “Protecting Investments in Advanced Metering Infrastructure Using IntelliGrid® Architecture” EPRI, Palo Alto, CA: February 2007. 1014784.

7-3
utilities to provide feedback. These values correspond to a 0.8-2.6% reduction in forecasted retail electricity sales in 2030.
Table 7-1 Impact of Direct Feedback on Energy Usage (2030)
Direct Feedback Residential Commercial Industrial Total Baseline Retail Electricity Sales, 2030i [billion kWh]
1,738 1,925 1,033 4,696 Percent Reduction in Energy Use Enabled by Direct Feedback
5% 2.5% 2.5% - Market Penetration Effect, 2030 [billion kWh]
25% 21.7 12.0 6.5 40.2 50% 43.4 24.0 12.9 80.3 75% 65.2 36.1 19.4 120.7
i. Annual Energy Outlook 2008 with Projections to 2030, Energy Information Administration, U.S. Department of Energy, Washington, DC: March 2008. DOE/EIA-0383 (2008).
Indirect Feedback to Consumers via Improved Billing
As discussed previously, the operational benefit of advanced metering allows utilities to send customers frequent, accurate, and informative billing that contains comprehensive energy use data. Billing of this nature can inspire changes in the energy use behavior of consumers, often yielding significant energy and demand savings. This form of indirect feedback via billing has been practiced in much of the U.S. for many years with the existing grid infrastructure and metering methods, but a Smart Grid potentially simplifies the process. Nevertheless, the potential for increased energy savings through this mechanism in the U.S. is likely limited unless the additional information provided by a Smart Grid improves billing practices further. Therefore, the potential energy savings and carbon reductions of indirect feedback are assumed to be negligible and are not quantified in this study.


8-1
8 SUPPORT NEW UTILITY BUSINESS MODELS Most regulatory bodies and utilities support the goal of increasing reliance on energy efficiency as a resource alternative to generation – or as some refer to it, a virtual power plant. Across the country, regulatory commissions and utilities are exploring innovative business models and cost recovery mechanisms to incentivize greater investment in demand-side resources such as energy efficiency, demand response, and dynamic pricing programs. However, utility system planners and operators, who bear the principal burden of ensuring the reliability of electricity service, must be able to count on demand-side resources as predictable, reliable, and quantifiable sources of negawatts and negawatt hours before investments in energy efficiency and demand response programs can be increased significantly. Moreover, with significant incentive dollars at stake, the industry will need rigorous methods to reliably track and measure the savings impact of demand-side programs to pass the scrutiny of regulators.
A Smart Grid can play a critical role in increasing the reliability and predictability of demand-side resources, and quantifying their savings impact, through superior measurement & verification (M&V) capabilities. M&V will be a critical requirement for considering demand-side resources such as energy efficiency as a fifth fuel.28 Figure 8-1 summarizes the main mechanisms for realizing energy savings and reductions in carbon emissions due to the Smart Grid goal of Supporting New Business Models.
Smart Grid Goal: Support New Business Models Mechanisms for Energy Savings and Reductions in Carbon Emissions
♦ Accelerated Deployment of Energy Efficiency and Demand Response through Superior Measurement and Verification Capabilities
♦ Accelerated Innovation in Devices through Open Standards
Figure 8-1 Support New Business Models – Energy Savings & CO2 Reduction Mechanisms
Accelerated Deployment of Energy Efficiency and Demand Response through Superior Measurement and Verification Capabilities
The advanced metering and communications infrastructure of a Smart Grid will support the measurement, storage, and retrieval of data to readily verify energy savings and demand reductions. This relative ease of M&V, in turn, will give utility planners more confidence to incorporate energy efficiency and demand response into integrated resource plans and facilitate 28 Jim Rogers, the CEO of Duke Energy, coined the term 5th Fuel for energy efficiency resources. The environmental community has taken this concept one step further. They refer to energy efficiency as the 1st Fuel in order to reference the loading order priority of energy efficiency measures.

8-2
greater utility use and reliance upon demand-side resources. Through its enhanced M&V capabilities, a Smart Grid will support emerging business models that increase the cost-effectiveness of energy efficiency programs for utilities. This, in-turn, has the potential to accelerate deployment of energy efficiency programs beyond current levels.
A Smart Grid with advanced metering infrastructure could provide interval metering used to approximate or simulate sub-metering, i.e., measurement of energy consumption at the end-use level. Consider the example of a utility program offering a rebate for an energy-efficient refrigerator. Today, the energy savings associated with that appliance would likely be deemed or calculated ex ante for evaluation purposes. Typically, such ex ante energy savings assumptions are discounted due to their inherent uncertainty, since they cannot be measured at the end use level. A Smart Grid infrastructure, however, could allow the utility to sub-meter the energy consumption of refrigeration for households that participate in the refrigerator rebate program. By being able to measure and compare refrigeration consumption of program participants ex ante and ex post, the utility can reduce the uncertainty of, and more precisely gauge, the program’s energy savings impact. Assuming that the program proves cost-effective in yielding energy savings, the utility would be encouraged to expand the program and pursue it more aggressively, resulting in incremental energy savings attributable to a Smart Grid.
To quantify the energy savings potential of enhanced M&V capability in the reference year of 2030, we first reference the preliminary results of a study on the potential of energy efficiency in the U.S. commissioned by EPRI and the Edison Electric Institute. This study, the final version of which will be released in 2008, employed a micro-economic equipment stock turnover model to estimate the potential for energy savings from programs through 2030.29 The preliminary results of this study, which uses the EIA Annual Energy Outlook 2007 Reference Case as a baseline forecast, yields an achievable potential range of 7 to 11% in 2030, equivalent to 355 to 560 billion kWh of avoided energy consumption, as illustrated in Figure 8-2.
Figure 8-2
29 Electric Power Research Institute and Edison Electric Institute. “Energy Efficiency: How Much Can We Count On?” Presented at Edison Foundation Conference, “Keeping the Lights On, Our National Challenge”. New York, New York. April 21, 2008. Preliminary results of Reference Case achievable potentials based on AEO 2007 Reference Case. Energy efficiency potential represents the impact of programs, whether implemented by utilities, government agencies, or third parties.

8-3
Estimate of U.S. Energy Efficiency Achievable Potential through 203030
In the EPRI-EEI potential study, the achievable potential is characterized as a range bounded by realistic achievable potential (7% reduction in baseline electricity consumption) and maximum achievable potential (11% reduction in baseline electricity consumption). In both cases, energy efficiency potential assumes program-induced adoption of energy efficiency products or services that are commercially available and pass a standard economic cost-effectiveness screening test.31 The difference between realistic achievable and maximum achievable lies in the assumptions of program funding, design, market delivery, and implementation, which result in different levels of energy efficiency market penetration.
Conceptually, the maximum achievable potential takes the results of the most successful programs on record – programs that were well-funded and embodied best practices in program design, market delivery, and implementation – and extrapolates those results (i.e. program-induced market penetration levels) across the country. By contrast, the realistic achievable discounts maximum achievable results by taking into account program budgetary constraints and learning curves to overcome towards the attainment of best practices.
Insofar as more precise and reliable M&V, as enabled by a Smart Grid, reduces the uncertainty of program impact and encourages greater program investment – as previously postulated – its impact can contribute towards bridging the gap between realistic achievable and maximum achievable potential. Moreover, a Smart Grid infrastructure would automate aspects of M&V and thereby reduce M&V costs. Since M&V costs are typically included in a utility’s administrative costs to implement energy efficiency programs, this automation capability would render programs more cost-effective. The link between enhanced M&V and greater realization of energy efficiency is reinforced under the assumption that new business models may emerge that allow utilities to recover costs for energy efficiency in a manner competitive with cost recovery for generation resources, thereby providing greater incentives for verifiable energy efficiency.
Under the analysis summarized in Table 8-1, we have accounted for the impact of enhanced M&V capability enabled by a Smart Grid with an attribution range of 5 to 20% of the difference between the maximum and realistic achievable potentials in 2030 estimated in the EPRI-EEI U.S. potential study preliminary results. This range is predicated on the notion that maximum achievable potential depends on the alignment of numerous factors to produce ideal program conditions, with M&V but one of those factors along with regulatory mechanisms and utility business model, consumer education, externalities such as climate policy. shows that the annual energy savings potential across all three sectors ranges from 10 to 41 billion kWh for the reference year of 2030, depending on the level of market penetration. These values correspond to a 0.2 to 0.9% reduction in forecasted retail sales of electricity in 2030.
30 Ibid. 31 Program-induced effects above and beyond the impact of codes & standards or market-driven (naturally-occurring) energy efficiency. The economic screen applied was the participant test, which weighs the benefits of a measure’s bill savings against its incremental cost over the lifetime of the measure on a net present value basis, discounted at 5%.

8-4
Table 8-1 Impact of Enhanced Energy Efficiency M&V (2030)
Energy Savings Corresponding to Enhanced M&V Capability Maximum Achievable Potential, 2030i
560 billion kWh Realistic Achievable Potential, 2030i
355 billion kWh Δ (Maximum – Realistic) in Achievable Potential, 2030i
205 billion kWh Potential for Peak Demand Reduction due to Smart Gridii
5% attribution 10.2 billion kWh 10% attribution 20.5 billion kWh 20% attribution 41.0 billion kWh
i. Electric Power Research Institute and Edison Electric Institute. “Energy Efficiency: How Much Can We Count On?” Presented at Edison Foundation Conference, “Keeping the Lights On, Our National Challenge”. New York, New York. April 21, 2008. Preliminary results of Reference Case achievable potentials based on AEO 2007 Reference Case.
Accelerated Innovation in Devices through Open Standards
A Smart Grid will promote open standards and interoperability among the components of the communications and control infrastructure as well as among the smart and efficient end-use devices connected to the grid. This promulgation of open standards will likely encourage firms to invest more capital in smart and efficient end-use devices and supporting infrastructure components because the barrier of closed, proprietary systems that lock out new entrants will have been removed. The result will be a higher degree of technological innovation in energy efficient devices and supporting control components, thus yielding energy savings and corresponding carbon reductions. This is analogous to the network effect in Information Technology which has shown that open standards (such as the Universal Serial Bus interface for hardware and Java for software development) have accelerated the rate of innovation and development.

9-1
9 SMART GRID MECHANISMS FACILITATING CARBON EMISSIONS REDUCTIONS INDEPENDENT OF ENERGY SAVINGS
Two mechanisms enabled by a Smart Grid can reduce CO2 reductions independent of energy savings, as shown in Figure 3-1: (a) greater integration of renewable generation resources and (b) greater deployment of plug-in hybrid electric vehicles (PHEVs). Both of these mechanisms, while inducing energy savings, do have an impact on reducing emissions, insofar as (a) renewables, particularly intermittent renewables such as wind and solar, displace fossil-burning energy sources and reduce the overall carbon-intensity of the generation mix, and (b) PHEVs avoid emissions from conventional internal combustion engines in the transportation sector, resulting in a net reduction of CO2 emissions through reduced tailpipe emissions.
Integration of Intermittent Renewables
A Smart Grid facilitates more seamless integration of renewable resources and other distributed energy resources including energy storage due to its advanced control and communications capabilities. Some of the current challenges of grid integration relate to the inherently less controllable nature of certain important renewables such as wind power and solar photovoltaics, which intermittently feed energy to the grid. Deployment of a Smart Grid infrastructure combined with electric energy storage and discharge options will help reduce the variability in renewable power sources by decoupling generation from demand. This will increase resource dispatchability and allow intermittent renewable resources to operate during periods of maximum efficiency. With an increased share of renewables such as solar and wind in the overall supply mix, utilities will reduce their carbon emissions and will be better situated to meet their respective states’ renewable portfolio standard (RPS) mandates. In addition, customers will have access to a greater share of green power from the utility. The control capabilities of a Smart Grid will also increase the ease in which customers can integrate their personal renewable generation sources (e.g., rooftop photovoltaic systems) into the grid for participation in net metering programs. Therefore, a Smart Grid offers marginal benefits to renewables integration because of its communications and control improvements. Moreover, the actual interconnection technology will be improved, reducing energy losses.
The EIA Annual Energy Outlook for 2008 (AEO 2008) Reference Case estimates 55 additional GW of renewable generation capacity by 2030.32 EPRI’s updated Prism analysis for 2008 estimates a potential of 100 GW of additional renewable generation capacity by 2030, based on compliance with existing state renewable portfolio standards (RPS).33 At an average capacity factor of 61%, based on the 50/50 mix of wind and biomass applied by the EIA in its modeling, this equates to 534 TWh of additional electricity generation from renewables in 2030. If we
32 U.S. Energy Information Administration. Annual Energy Outlook, 2008. 33 The Power to Reduce CO2 Emissions: The Full Portfolio. EPRI, Palo Alto, CA: 2008.

9-2
attribute half of that renewable consumption to wind, this amounts to 267 TWh in 2030. The resolution of the wind intermittency issue is inherently assumed for such a realization of wind penetration. According to a previous EPRI article on the subject: “Two inherent barriers remain, however, to the large-scale integration of wind energy into utility networks: the remoteness of many windy areas, and natural fluctuations in the wind resource in even the best locations.”34
There are two aspects to resolving the intermittency issue. One is the development of more powerful and accurate wind energy forecasting systems, both regional- and plant-specific, to allow more precise estimates of same-day and next-day hourly fluctuations in wind speed and resultant energy generation potential. The second aspect is utilizing real-time and forecasted wind information to better integrate wind with the dispatch of other generation and demand-side options to provide frequency control and system stability. Inasmuch as a Smart Grid would provide the capability to dispatch ancillary services to balance intermittent wind resources, it is reasonable to attribute a portion of wind resource penetration to the emergence of a Smart Grid infrastructure.
Table 9-1 outlines the calculation steps of a first-order approximation of CO2 reduction attributable to Smart Grid enablement of intermittent wind to the level developed in the EPRI Prism analysis. The range of attribution selected for Smart Grid impact on resolving the wind intermittency issue – an aforementioned barrier to more widespread adoption of wind – is 25 to 50%. The remainder may be attributable to the development of more powerful wind energy forecasting and other technological and market developments in harnessing wind energy cost-effectively. On this basis, the energy generated by incremental wind resources attributable to Smart Grid development is 33.4 to 66.8 billion kWh in 2030.
To convert this into CO2 figures we first assume that this marginal wind-generated energy, but for the establishment of a Smart Grid, would have been generated from the average U.S. generation mix. For 2006, the most recent year of documented emissions data, the CO2 intensity of the U.S. electricity sector was 0.64 million metric tons of CO2 per billion kWh sold, as detailed in Chapter 4. Applying this ratio yields an annual impact of 21.4 to 42.8 million metric tons of CO2 avoided. However, since the generation mix in 2030 will differ in CO2 intensity compared to 2006, we applied Prism assumptions on the relative market shares of nuclear, coal, natural gas, hydro, and renewables, as well as assumed improvements in coal heat rate and the emergence of carbon capture and storage technology to develop an estimated CO2 intensity for the U.S. electricity sector in 2030 of 0.56 million metric tons of CO2 per billion kWh sold.35 Using this more realistic intensity, the incremental impact of a Smart Grid on enabling greater wind integration is 18.7 to 37.4 million metric tons of avoided CO2 emissions in 2030.
34 EPRI. “Renewables: A Promising Coalition of Many.” EPRI Journal. Summer 2007. Palo Alto, CA. 35 (a) EPRI Prism 2030 generation mix: Coal w/o Carbon Capture & Storage (CCS) 39%; Advanced Coal w/CCS 13%; Natural Gas 5%; Nuclear 29%; Hydro 5%; Non-Hydro Renewables 9%. (b) 3% heat rate improvement for 130 GWe of existing coal fleet. (c) Improvement in new coal plant efficiency to 46% by 2020 and 49% by 2030. (d) CCS technology captures 90% of CO2 from CCS plants. Assumptions a-d result in estimated 2030 CO2 intensity.
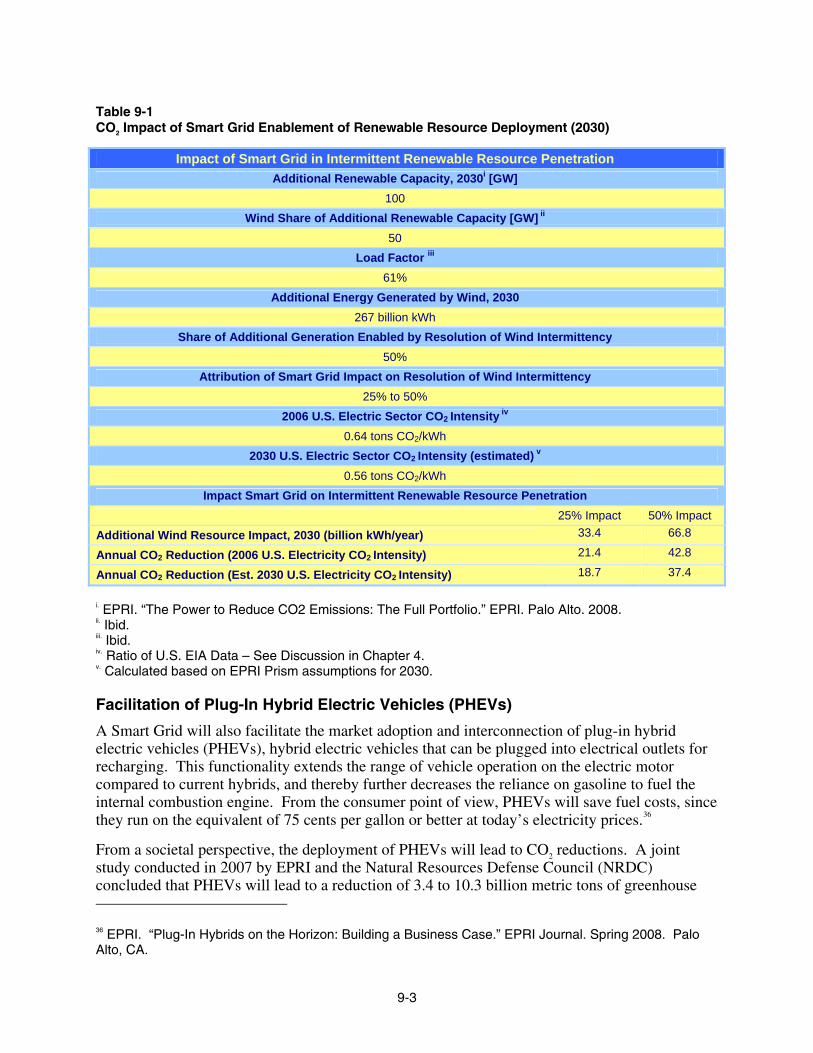
9-3
Table 9-1 CO2 Impact of Smart Grid Enablement of Renewable Resource Deployment (2030)
Impact of Smart Grid in Intermittent Renewable Resource Penetration Additional Renewable Capacity, 2030i [GW]
100 Wind Share of Additional Renewable Capacity [GW] ii
50 Load Factor iii
61% Additional Energy Generated by Wind, 2030
267 billion kWh Share of Additional Generation Enabled by Resolution of Wind Intermittency
50% Attribution of Smart Grid Impact on Resolution of Wind Intermittency
25% to 50% 2006 U.S. Electric Sector CO2 Intensity iv
0.64 tons CO2/kWh 2030 U.S. Electric Sector CO2 Intensity (estimated) v
0.56 tons CO2/kWh Impact Smart Grid on Intermittent Renewable Resource Penetration
25% Impact 50% Impact Additional Wind Resource Impact, 2030 (billion kWh/year) 33.4 66.8
Annual CO2 Reduction (2006 U.S. Electricity CO2 Intensity) 21.4 42.8
Annual CO2 Reduction (Est. 2030 U.S. Electricity CO2 Intensity) 18.7 37.4
i. EPRI. “The Power to Reduce CO2 Emissions: The Full Portfolio.” EPRI. Palo Alto. 2008. ii. Ibid. iii. Ibid. iv. Ratio of U.S. EIA Data – See Discussion in Chapter 4. v. Calculated based on EPRI Prism assumptions for 2030.
Facilitation of Plug-In Hybrid Electric Vehicles (PHEVs)
A Smart Grid will also facilitate the market adoption and interconnection of plug-in hybrid electric vehicles (PHEVs), hybrid electric vehicles that can be plugged into electrical outlets for recharging. This functionality extends the range of vehicle operation on the electric motor compared to current hybrids, and thereby further decreases the reliance on gasoline to fuel the internal combustion engine. From the consumer point of view, PHEVs will save fuel costs, since they run on the equivalent of 75 cents per gallon or better at today’s electricity prices.36
From a societal perspective, the deployment of PHEVs will lead to CO2 reductions. A joint study conducted in 2007 by EPRI and the Natural Resources Defense Council (NRDC) concluded that PHEVs will lead to a reduction of 3.4 to 10.3 billion metric tons of greenhouse 36 EPRI. “Plug-In Hybrids on the Horizon: Building a Business Case.” EPRI Journal. Spring 2008. Palo Alto, CA.

9-4
gases by 2050, as a function of PHEV fleet penetration and the carbon-intensity of the electricity generation mix.37 In the reference year of 2030, this EPRI study indicates that PHEVs will result in annual greenhouse gas reductions of 100 to 300 million metric tons of CO2 per year, based on a range of projected PHEV market share.38
Smart Grid development underpins widespread market deployment of PHEVs. From a utility perspective, the ability to charge PHEVs overnight provides operational benefits through improved system load factor and utilization of base load resources. However, consumer charging behavior is a matter of speculation since PHEVs are only expected to enter the North American market in the 2009-2010 time frame. Widespread consumer charging of PHEVs during peak periods in the day, for example, could increase peak load and increase utilities’ operational costs. The development of a Smart Grid is therefore vitally important to utilities, since it entails the intelligence to send signals to consumers on when to charge their vehicles or provide differentiated rates to encourage off-peak charging.
Smart Grid infrastructure can also facilitate new business models that encourage PHEV adoption. One example that has been theorized is the concept of battery leasing, in which a lessor (the vehicle manufacturer or a third party) would own the batteries of a PHEV. Since battery cost constitutes much of the incremental cost of PHEVs compared to conventional vehicles, the capital cost to consumers of PHEVs would be reduced, which would stimulate PHEV sales and market penetration. A Smart Grid infrastructure would recognize the charging “signature” of a PHEV and attribute a differentiated rate for PHEV kilowatt-hour sales. This special rate would provide a margin beyond the standard utility rate to serve as a stream of lease payments to the lessor to cover battery costs over time. The economic viability of such a model is yet to be determined, but the technical possibility underscores how a Smart Grid can facilitate PHEV market penetration.
Alternatively, PHEVs can potentially be used to store electrical energy in their onboard batteries for peak-shaving or power-quality applications, offering potentially powerful synergies to complement the electric power grid. With parallel advances in smart vehicles and the Smart Grid, PHEVs may become an integral part of the distribution system itself, providing storage, emergency supply, and grid stability.
With these considerations in mind, it is reasonable to attribute some share of projected PHEV CO2 reduction impact to the development of a Smart Grid. For the purposes of this study, an attribution range of 10% to 20% is applied based on EPRI judgment. On this basis, the CO2 reduction impact of PHEVs that can be attributed to a Smart Grid is 10 to 60 million metric tons of CO2 in 2030.
37 EPRI. “Environmental Assessment of Plug-In Hybrid Electric Vehicles – Volume 1: Nationwide Greenhouse Gas Emissions.” 1015325. Palo Alto, CA. 2007. 38 EPRI. “Plug-In Hybrids on the Horizon: Building a Business Case.” EPRI Journal. Spring 2008. Palo Alto, CA.

10-1
10 ALL PATHS LEAD TO CARBON REDUCTION To this point, the Smart Grid-enabled mechanisms discussed in Chapters 4 through 8 have been quantified on the basis of energy savings impact. Every kilowatt hour of electricity saved represents some measure of fossil fuels spared from combustion, which carries an associated reduction in air emissions, including nitrogen oxides, sodium dioxide, volatile organic compounds (VOCs), other criteria air pollutants, and most significantly, greenhouse gases such as carbon dioxide (CO2). The amount of CO2 offset per kilowatt hour of energy saved depends on the composition of the generation supply mix.
For reference, in 2006, total U.S. greenhouse gas emissions were equivalent to 7,076 million metric tons of carbon dioxide (conventionally expressed as Teragrams, or Tg, of CO2 Eq.). Of this total, 2,344 Tg were attributable to CO2 emissions from the electric power sector, as illustrated in Figure 10-1 from the U.S. EIA.39
Figure 10-1 Emission of Greenhouse Gases in the United States, 2006 (U.S. EIA)
39 Emissions of Greenhouse Gases in the United States 2006. U.S. DOE/EIA-0573 (2006) Energy Information Administration, Office of Integrated Analysis and Forecasting, U.S. Department of Energy, Washington, DC: November 2007.

10-2
In order to quantify reductions in carbon dioxide emissions associated with a Smart Grid’s mechanisms for energy savings, we applied the average ratio between electricity sales and carbon emissions due to fossil-fuel generation, in aggregate in the U.S. In 2006, retail electricity sales were 3,670 billion kWh 40 and, as mentioned in the previous paragraph and illustrated in Figure 10-1 by the US EIA, CO2 emissions due to electricity generation in 2006 were 2,344 Tg CO2. On this basis, we calculate that for every 1 billion kWh of energy saved, the equivalent of 0.64 Tg of CO2 in greenhouse gas emissions are avoided. This is based on a contemporary U.S. generation mix, as shown in Figure 10-2.
Figure 10-2 U.S. Electricity Generation Mix, 2007 (U.S. EIA)
However, this generation mix is expected to change by 2030, the reference year for this analysis. Figure 10-3 illustrates the EIA projection of U.S. generation mix in 2030 according to the 2008 Annual Energy Outlook.
Figure 10-3 U.S. Electricity Generation Mix, 2030 (U.S. EIA, AEO 2008)
40 Electric Power Annual 2006, Energy Information Administration, Office of Energy Statistics from the U.S. Government, U.S. Department of Energy, Washington, DC: October 2007.

10-3
The EPRI Prism analysis assumes more aggressive implementations of renewables, nuclear, and advanced coal with greater efficiency (i.e. lower heat rate) and carbon capture and storage by 2030, leading to the generation mix depicted in Figure 10-4.
Figure 10-4 EPRI Prism Projected 2030 U.S. Generation Mix41
By virtue of these assumptions, the U.S. generation mix in 2030 in the EPRI Prism view will be less carbon-intensive than the present day, estimated to a first order approximation as 0.56 million metric tons of CO2 per billion kWh sold.42,43
Table 10-1 summarizes the energy savings potentials and corresponding values of avoided CO2
emissions for each of the seven selected mechanisms in the target year of 2030. Low-end and high-end values are included to show the ranges of savings.
41 The Power to Reduce CO2 Emissions: The Full Portfolio. EPRI, Palo Alto, CA: 2008. 42 EPRI Prism 2030 generation mix: Coal w/o Carbon Capture & Storage (CCS) 39%; Advanced Coal w/CCS 13%; Natural Gas 5%; Nuclear 29%; Hydro 5%; Non-Hydro Renewables 9%. Assumptions a-d result in estimated 2030 CO2 intensity. 43 Starting from present-day CO2 intensity (~0.64 Tg CO2e): (a) apply 3% heat rate improvement to Coal w/o CCS (39% of 2030 generation mix); (b) apply 90% capture rate of CO2 in Coal w/CCS plants (13% of generation). 0.64 * (1 – ((0.39*0.03)+(0.13*0.90))) ~ 0.56 Tg CO2e.

10-4
Table 10-1 Smart Grid Energy Savings and Avoided CO2 Emissions Summary (2030)
Energy Savings, 2030 (billion kWh)
Avoided CO2 Emissions, 2030 (Tg CO2) Emissions-Reduction Mechanism
Enabled by Smart Grid Low High Low High
1 Continuous Commissioning of Large Commercial Buildings 2 9 1 5
2 Reduced Line Losses (Voltage Control) 4 28 2 16
3 Energy Savings Corresponding to Peak Load Management 0 4 0 2
4 Direct Feedback on Energy Usage 40 121 22 68
5 Accelerated Deployment of Energy Efficiency Programs 10 41 6 23
6 Greater Integration of Renewables -- -- 19 37
7 Facilitation of Plug-in Hybrid Electric Vehicles (PHEVs) -- -- 10 60
Total 56 203 60 211
All of the mechanisms combined have the potential to yield energy savings of 56-203 billion kWh and to reduce annual carbon emissions by 60-211 million metric tons (Tg) CO2. On this basis, the environmental value of a U.S. Smart Grid is equivalent to converting 14 to 50 million cars into zero-emission vehicles each year.44
44 Based on an average mid-size sized car driven 12,000 miles per year. Average emissions rate ~ 200 g CO2 per km driven ~ 0.71 lbs CO2 per mile driven (World Resources Institute. “Car Companies and Climate Change: Measuring the Carbon Intensity of Sales and Profits.” Figure 5: Average CO2 Emissions Rates by Vehicle Type, 2002). ~ 8,513 lbs CO2 per car, or ~ 4.25 tons CO2 per car.

11-1
11 CONCLUSION Attaining reductions in greenhouse gas emissions through energy efficiency, greater utilization of renewable resources, and adoption of PHEVs are part of an integrated approach to mitigate global climate change. Energy efficiency mechanisms are potentially the most cost-effective, near-term options to reduce carbon emissions relative to carbon capture and storage, forestation, fuel switching (e.g., with nuclear or renewable resources), or other abatement alternatives.45 Moreover, energy-efficient technologies and practices reduce greenhouse gas emissions not only through energy savings but also through the deferral of new generation. During the intervening period in which new generation is deferred by energy efficiency, technological advancements on the supply-side are projected that will make new power plants less carbon-intensive and more efficient, including advanced high-efficiency coal plants, carbon capture and storage (CCS) technology, advanced light water nuclear reactors, and increased contribution of renewables46. In this sense, insofar as energy efficiency measures defer new generation, they buy time for advancements to potentially bring incrementally cleaner and more efficient generation online, thereby providing a bridge between the present and a carbon-constrained future.
A Smart Grid is key enabler of mechanisms to reduce carbon emissions, both directly through integration of more renewable energy and facilitation of PHEV adoption, and indirectly through energy efficiency. This study explains and estimates how the mechanisms enabled by a Smart Grid can avoid the equivalent of 60 to 211 million metric tons of CO2 per year in 2030.
A Smart Grid will enable tools for everyone—from consumers to energy service providers to regulators—to help bring energy savings and greenhouse gas reduction goals closer to fruition to benefit society.
45 In this context, fuel switching encompasses the replacement of fossil-fuel-fired power generation with nuclear energy, advanced coal with carbon capture, and/or renewables. It also includes replacing fossil-fuel-fired end-use devices (including process equipment, vehicles, etc.) with cleaner technology alternatives (such as electric-driven equipment, plug-in hybrid electric vehicles, etc.). 46 EPRI Prism analysis assumes that, with sufficient investment in R&D: (a) advanced coal generation will lead to new plant efficiencies of 46% by 2020 (up from 40% projected by EIA) and 49% by 2030; (b) CCS will be widely available and deployed after 2020; (c) 64 GWe of new nuclear can be brought online by 2030; (d) 100 GWe of renewables


A-1
A APPENDIX: SUMMARY OF SMART GRID BENEFITS A Smart Grid has the potential to benefit the environment, consumers, utilities, and the nation as a whole in numerous ways, as summarized by Figure A-1. The benefits include the mechanisms for energy savings and carbon emission reductions discussed in this paper, plus other dividends.
Figure A-1 Summary of Smart Grid Potential Benefits for the Environment, Consumers, Utilities, and the Nation as a Whole
Figure A-1 11-1 Summary of Potential Smart Grid Benefits
Improved communications Better customer service More service options Elimination of meter reading errors Increased power reliability Improved power quality Reduced service interruptions Shorter outage durations Cost management Automatic notification (demand response, maintenance, other) Greater flexibility and choice in energy markets Easier purchase of green power Environmental stewardship Energy knowledge and empowerment Facilitated deployment of on-site generation Utility-monitored equipment management, diagnostics, & repair Smart user-friendly devices Interoperability of system controls Internet-enabled Improved device functionality through innovation and dynamic controls: ♦ Improved efficiency ♦ Increased productivity ♦ Higher product quality ♦ Improved comfort, health & safety ♦ Better indoor air quality ♦ Waste minimization & management
Consumers Utilities
Improved communications Increased customer service Enhanced distribution management Greater load profiling capability Enhanced peak load management Relief during capacity constraints Reduced transmission congestion and line losses Delayed need for new generation Increased power quality and reliability; grid stabilization Intelligence for outage crew dispatch; reduced service interruptions Power theft detection Advanced asset management Automated meter reading Measurement and verification Real-time exchange of end-use operational data Direct control of end-use devices Dynamic pricing, auto DR Facilitated billing, change of service, outage communication Management, diagnostics, and repair of consumer equipment Cost control and recovery mechanisms Ease of compliance with national programs (EPAct, NAPEE) Easier integration of plug-in hybrid electric vehicles Ability to adapt to future requirements
The Environment
Smart Grid Benefits
Grid interconnection of renewables (photovoltaics, solar thermal, wind, geothermal, biofuels, etc.) Reduced resource depletion; increased sustainability Lower emissions of CO2 and other air pollutants: mitigation of climate change; improved air quality Waste minimization through improved end-use devices and processes
Improved grid reliability Lower dependence on foreign fuel; enhanced national security Reduced resource depletion; increased sustainability Deferred need for new generation Lower emissions of CO2 and other air pollutants; improved air quality Economic development Ease of compliance with national (EPAct, NAPEE) and international agreements (Kyoto Protocol)
The Nation


Electric Power Research Institute 3420 Hillview Avenue, Palo Alto, California 94304-1338 • PO Box 10412, Palo Alto, California 94303-0813 • USA
800.313.3774 • 650.855.2121 • [email protected] • www.epri.com
Export Control Restrictions
Access to and use of EPRI Intellectual Property is granted with the specific understanding and requirement that responsibility for ensuring full compliance with all applicable U.S. and foreign export laws and regulations is being undertaken by you and your company. This includes an obligation to ensure that any individual receiving access hereunder who is not a U.S. citizen or permanent U.S. resident is permitted access under applicable U.S. and foreign export laws and regulations. In the event you are uncertain whether you or your company may lawfully obtain access to this EPRI Intellectual Property, you acknowledge that it is your obligation to consult with your company’s legal counsel to determine whether this access is lawful. Although EPRI may make available on a case-by-case basis an informal assessment of the applicable U.S. export classification for specific EPRI Intellectual Property, you and your company acknowledge that this assessment is solely for informational purposes and not for reliance purposes. You and your company acknowledge that it is still the obligation of you and your company to make your own assessment of the applicable U.S. export classification and ensure compliance accordingly. You and your company understand and acknowledge your obligations to make a prompt report to EPRI and the appropriate authorities regarding any access to or use of EPRI Intellectual Property hereunder that may be in violation of applicable U.S. or foreign export laws or regulations.
The Electric Power Research Institute (EPRI)
The Electric Power Research Institute (EPRI), with major locations in Palo Alto, California; Charlotte, North Carolina; and Knoxville, Tennessee, was established in 1973 as an independent, nonprofit center for public interest energy and environmental research. EPRI brings together members, participants, the Institute's scientists and engineers, and other leading experts to work collaboratively on solutions to the challenges of electric power. These solutions span nearly every area of electricity generation, delivery, and use, including health, safety, and environment. EPRI's members represent over 90% of the electricity generated in the United States. International participation represents nearly 15% of EPRI's total research, development, and demonstration program.
Together…Shaping the Future of Electricity
© 2008 Electric Power Research Institute (EPRI), Inc. All rights reserved. Electric Power Research Institute, EPRI, and TOGETHER…SHAPING THE FUTURE OF ELECTRICITY are registered service marks of the Electric Power Research Institute, Inc.
Printed on recycled paper in the United States of America 1016905