Embed Size (px)
Citation preview

Commissioned by
The Global Illicit Trade Environment Index A report by The Economist Intelligence Unit
OVERALL RESULTS

1© The Economist Intelligence Unit Limited 2018
The Global Illicit Trade Environment Index Overall results
Contents
Contents 1
Acknowledgements 2
Executive Summary 3
Introduction 6
Overall results 8
Category #1: Government policy 11
Category #2: Supply and demand 16
Category #3: Transparency and trade 19
Category #4: Customs environment 23
Concluding remarks 28
Appendix 1: Index results 29
Appendix 2: Index methodology 36
Sponsors 42

2 © The Economist Intelligence Unit Limited 2018
The Global Illicit Trade Environment Index Overall results
Acknowledgements
• Allen Dixon, director, Ideas Matter
• Ali Salman, director of research, Institute for Democracy and Economic Affairs
• Davyth Stewart, co-ordinator, Global Forestry Enforcement and Pollution Crime Unit, Interpol
• David Luna, president and CEO, Luna Global Networks
• Jeremy Nixon, CEO, Ocean Network Express
• Piotr Stryszowski, economist, OECD
• Frank Debets, managing partner, PwC
• Naomi Doak, head of conservation programmes, The Royal Foundation of the Duke and Duchess of Cambridge and Prince Harry
• Candice Welsch, chief, Implementation Support Section, Corruption and Economic Crime Branch, UN Office on Drugs and Crime (UNODC)
• Peggy Chaudhry, associate professor of international business, Villanova University
The Global Illicit Trade Environment Index is based on a similar index that was devised and constructed in 2016 by Chris Clague. The 2018 update and expansion was conducted by Trisha Suresh, Michael Frank, with assistance from Chris Clague. Chris Clague wrote this report, focusing on the overall results, and Scott Aloysius provided research support. It was edited by Amanda Simms.
During research for the construction of the index and in writing this report, The Economist Intelligence Unit interviewed executives and experts from across the world. Their time and insights are greatly appreciated. They are listed below in alphabetic order by affiliation.
• Venda Felbab-Brown, senior fellow, Brookings Institution
• Helen Sworn, founder and international director, Chab Dai
• Raymond Baker, president, Global Financial Integrity
• Mark Shall, director, Global Initiative Against Transnational Organised Crime

3© The Economist Intelligence Unit Limited 2018
The Global Illicit Trade Environment Index Overall results
Executive Summary
Key findings from the index are:
• With a score of 85.6 (out of 100), Finland ranks first in the overall index, besting the United Kingdom by only 0.5 points. The rest of the top 10 is rounded out by a handful of European countries (Sweden, Austria, Netherlands, Denmark and Germany), along with the United States, Australia and New Zealand.
• At the bottom of the overall index is a group of developing economies from all regions of the globe. Libya ranks 84th out of 84 economies, with a score of 8.6, and is joined by Iraq in 83rd place, scoring less than six points better. Faring slightly better, but still poorly, are a group of economies that score in the twenties and thirties in the index: Myanmar (82nd), Laos (81st), Venezuela (80th), Cambodia (79th), Kyrgyzstan (78th), Belize (77th), and Ukraine (76th) and Trinidad and Tobago (75th).
• Regionally, Europe (34 economies in the index), which includes the EU-28 plus six other countries, earns the highest the average score (68.0). The Asia-Pacific (21 economies) comes second at 56.0 and the Americas (19 economies), including the US and Canada, is in third at 54.0. The Middle East and Africa (10 economies) is last among the regions, mainly
Behind most every major headline, every major story in the news, lies another potential headline and another story about some form of illicit trade. From the refugee crises in the Mediterranean and South-east Asia, where the chaos is providing cover for human traffickers, to North Korea, a criminal state that couldn’t survive if it didn’t trade in arms, illicit cigarettes and counterfeit currency. Even the investigation into Russian interference in the 2016 US presidential election has led to indictments on money laundering, which is both a product of illicit trade and a facilitator of it.
To measure how nations are addressing these and other issues related to illicit trade, the Transnational Alliance to Combat Illicit Trade (TRACIT) has commissioned the Economist Intelligence Unit to produce the Global Illicit Trade Environment Index. The global index expands upon an Asia-specific version, originally created by The Economist Intelligence Unit in 2016 to score 17 economies in Asia on the extent to which they enabled or prevented illicit trade. This year’s updated and expanded version now includes 84 economies, providing a global perspective and new insights on the trade’s societal and economic impacts.

4 © The Economist Intelligence Unit Limited 2018
The Global Illicit Trade Environment Index Overall results
As we noted in our 2016 paper, however, and emphasise again in this year’s edition, there is an international community of people—observers, experts, private sector executives and government official— who have identified the many ways in which illicit trade, in all it various forms, can be combatted. The solutions they propose range from the quotidian to the more extreme. Few, if any, are unrealistic.
What the index, this paper and all the other papers published alongside it as part of the larger project, proposes is that economies that are laggards on the issue can start small and build towards a better environment for preventing illicit trade. And the economies that are leaders should lead.
due to low scores on the “supply and demand” and the “transparency and trade” indicators.
• Among the four categories in the index, the highest average score (69.0) across all 84 economies is in “customs environment,” which measures how effectively an economy’s customs service manages its dual mandate to facilitate licit trade while also preventing illicit trade.
• The lowest average score (50.0) is in the “supply and demand” category, which measures the domestic environment that encourages or discourages the supply of and demand for illicit goods.
A close look at the global environment that enables illicit trade can prove a somewhat dispiriting exercise. The average overall score in the Global Illicit Trade Environment is a shade under 60.0. Where economies aren’t under-resourced in customs or law enforcement, they may otherwise be indifferent or actively neglect illicit practices in order to continue reaping the economic benefits of being a global financial centre (like the UK) or a regional logistics hub (like Singapore, Dubai and Panama) or one of the world’s factories (like China and Vietnam) or a main source of narcotics (like Colombia). Or they may just be corrupt; corruption is far more pervasive than people appreciate and it is by no means limited to the developing world, as investigations in the US and elsewhere have recently shown.
5© The Economist Intelligence Unit Limited 2018
The Global Illicit Trade Environment Index Overall results
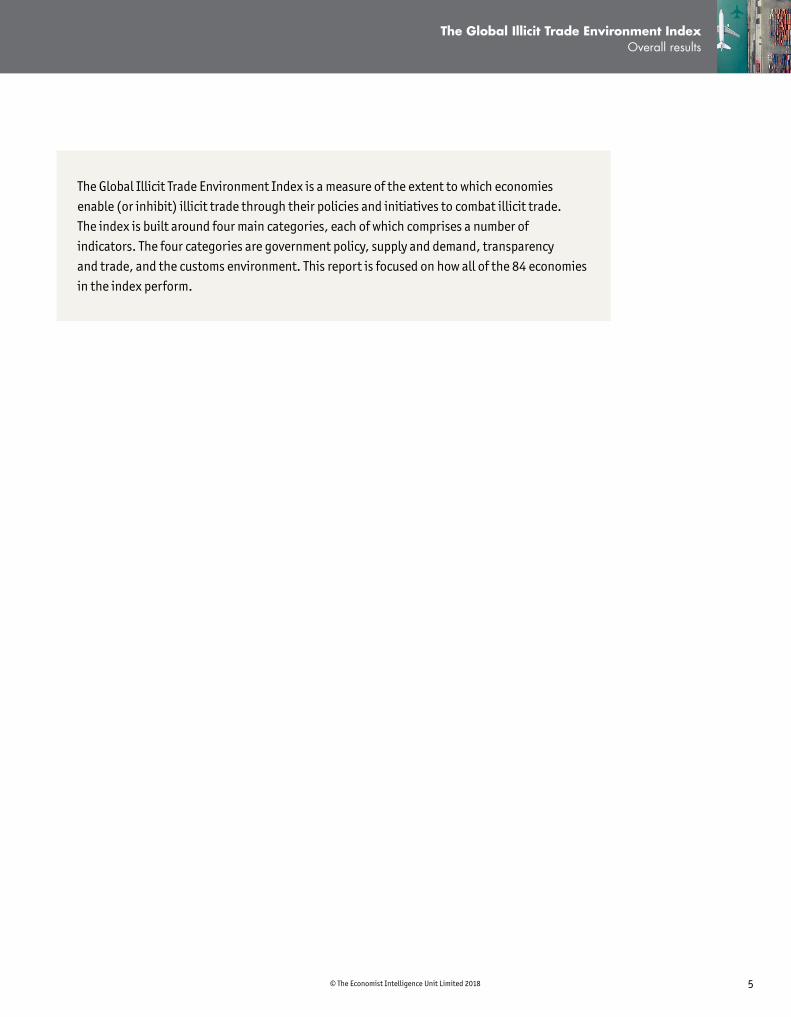
The Global Illicit Trade Environment Index is a measure of the extent to which economies enable (or inhibit) illicit trade through their policies and initiatives to combat illicit trade. The index is built around four main categories, each of which comprises a number of indicators. The four categories are government policy, supply and demand, transparency and trade, and the customs environment. This report is focused on how all of the 84 economies in the index perform.
6 © The Economist Intelligence Unit Limited 2018
The Global Illicit Trade Environment Index Overall results
1 https://www.brookings.edu/articles/north-koreas-activities-in-southeast-asia-and-the-implications-for-the-region/2 https://edition.cnn.com/2018/02/22/politics/manafort-gates-new-indictment/index.html. For a fuller analysis of the issue of money laundering and illicit financial flows, see Secrecy
World: Inside the Panama Papers Investigation of Illicit Money Networks and the Global Elite by Jake Bernstein. 3 https://www.fuelfreedom.org/oil-and-terrorism/4 https://www.theguardian.com/commentisfree/2015/nov/27/isis-cigarette-smuggling-isis-middle-east 5 http://www.unifab.com/images/Rapport-A-Terrorisme-2015_GB.pdf
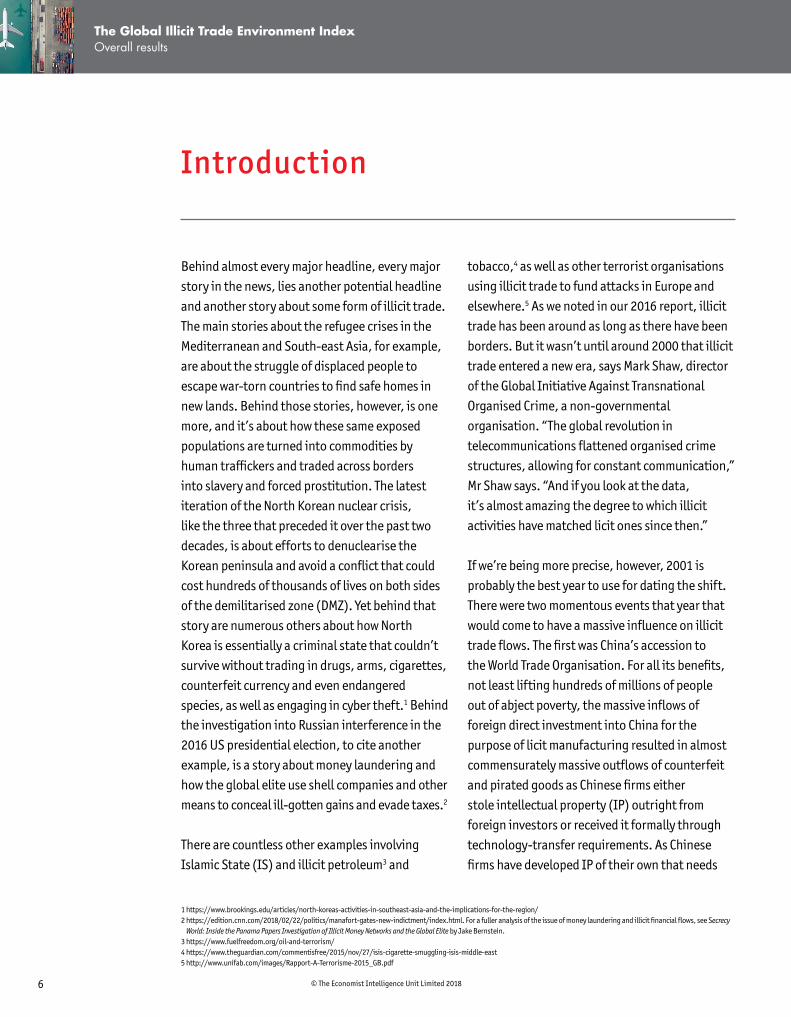
Introduction
tobacco,4 as well as other terrorist organisations using illicit trade to fund attacks in Europe and elsewhere.5 As we noted in our 2016 report, illicit trade has been around as long as there have been borders. But it wasn’t until around 2000 that illicit trade entered a new era, says Mark Shaw, director of the Global Initiative Against Transnational Organised Crime, a non-governmental organisation. “The global revolution in telecommunications flattened organised crime structures, allowing for constant communication,” Mr Shaw says. “And if you look at the data, it’s almost amazing the degree to which illicit activities have matched licit ones since then.”
If we’re being more precise, however, 2001 is probably the best year to use for dating the shift. There were two momentous events that year that would come to have a massive influence on illicit trade flows. The first was China’s accession to the World Trade Organisation. For all its benefits, not least lifting hundreds of millions of people out of abject poverty, the massive inflows of foreign direct investment into China for the purpose of licit manufacturing resulted in almost commensurately massive outflows of counterfeit and pirated goods as Chinese firms either stole intellectual property (IP) outright from foreign investors or received it formally through technology-transfer requirements. As Chinese firms have developed IP of their own that needs
Behind almost every major headline, every major story in the news, lies another potential headline and another story about some form of illicit trade. The main stories about the refugee crises in the Mediterranean and South-east Asia, for example, are about the struggle of displaced people to escape war-torn countries to find safe homes in new lands. Behind those stories, however, is one more, and it’s about how these same exposed populations are turned into commodities by human traffickers and traded across borders into slavery and forced prostitution. The latest iteration of the North Korean nuclear crisis, like the three that preceded it over the past two decades, is about efforts to denuclearise the Korean peninsula and avoid a conflict that could cost hundreds of thousands of lives on both sides of the demilitarised zone (DMZ). Yet behind that story are numerous others about how North Korea is essentially a criminal state that couldn’t survive without trading in drugs, arms, cigarettes, counterfeit currency and even endangered species, as well as engaging in cyber theft.1 Behind the investigation into Russian interference in the 2016 US presidential election, to cite another example, is a story about money laundering and how the global elite use shell companies and other means to conceal ill-gotten gains and evade taxes.2
There are countless other examples involving Islamic State (IS) and illicit petroleum3 and

7© The Economist Intelligence Unit Limited 2018
The Global Illicit Trade Environment Index Overall results
conservation programmes at the Royal Foundation of the Duke and Duchess of Cambridge and Prince Harry, also points out that many forms of illicit trade are low-risk while offering high rewards. “There are types of illicit trade that are a high-priority,” says Ms Doak, “like drugs and human trafficking, but something like wildlife trafficking doesn’t receive the same level of commitment from customs and law enforcement.” As a result, it mostly goes overlooked and traffickers are given something approaching free rein to conduct their activities.
The situation is far from hopeless, however. On the contrary, among the experts and officials who spend the most time thinking about illicit trade, there is an agreed set of approaches to combating it. To measure how nations are addressing the issue of illicit trade, the Transnational Alliance to Combat Illicit Trade (TRACIT) has commissioned The Economist Intelligence Unit to produce the Global Illicit Trade Environment Index. The global index expands upon an Asia-specific version, originally created by The Economist Intelligence Unit in 2016 to score 17 economies in Asia on the extent to which they enabled or prevented illicit trade. The Asian index generated much-needed attention on the issue of illicit trade within the region. Building upon the success of the Asia index, the global index now includes 84 economies, providing a global perspective and new insights on the social and economic impacts of illicit trade.
protecting, China’s government has taken steps in recent years to strengthen IP laws and crack down on IP-infringement. And although these are steps in the right direction, the country nevertheless remains a major source of the counterfeit goods being traded around the world today.
The other major event in 2001 was the September 11th terrorist attacks on New York and Washington, DC. Prior to the attacks, terrorist organisations like al-Qaeda relied on state sponsorship, charitable giving and other types of financial donations to fund their activities. Not long after the attacks, however, the US and other nations cracked down on these practices, starving the organisations of most of their funding. This forced them to look elsewhere, says David Luna, a former US State Department official and president and CEO of Luna Global Networks, a consultancy. “They [terrorist organisations] were forced to find other sources of funding,” Mr Luna says, “and that took two forms, engaging in illicit trade directly and/or controlling territories where they could tax both licit and illicit trade.” In terms of illicit trade, as long as they could profit, the groups were indifferent to the types of markets they entered. Drugs, arms, human trafficking, illicit tobacco, counterfeits, oil—they did, and continue to, trade in them all.
Yet, even if IS and other terrorist organisations are defeated, and China was to become a champion of IP-protection overnight, illicit trade is unlikely to ever be eliminated. Illicit trade follows its licit counterpart, and as long as there is the latter, there will be the former. Naomi Doak, head of

8 © The Economist Intelligence Unit Limited 2018
The Global Illicit Trade Environment Index Overall results
6 For a full description of the methodology, please see the appendix of this report.
Overall results
With a score of 85.6 (out of 100), Finland ranks first in the overall index, besting the UK by only 0.5 points. The rest of the top ten is rounded out by a handful of European countries (Sweden, Austria, the Netherlands, Denmark and Germany), along with the US, Australia and New Zealand. The obvious thread that ties these ten economies together is that they are all highly developed, but, beyond that, the reasons they land at the top of the index vary. Finland scores well on government policy, where it also ranks first, and supply and demand, where it comes in 5th, but is in the teens when it comes to the other two categories. Austria, meanwhile, scores in the top ten on three of the four indicators, but lags the others on the customs environment category, mainly as the level of automation it employs is relatively low.
At the bottom of the overall index is a group of developing economies from all regions of the globe. Libya ranks 84th out of 84 economies, with a score of 8.6, and is joined by Iraq in 83rd place, scoring less than six points better. Both of these economies do not have much in the way of a functioning government at the moment, and they both receive the lowest possible scores on indicators ranging from IP-protection, corruption and law enforcement techniques to international reporting on various forms of illicit trade and levels of automation at customs. Faring slightly better, but still poorly, are a group of economies
It is important to note that the Global Illicit Trade Environment Index does not score an economy’s performance or effectiveness in combating illicit trade. Rather, the index evaluates 84 economies on their structural capability to protect against illicit trade. It is focused on the laws, regulations, systems and effectiveness of governance that contribute to the political and regulatory environment that indicates an economy’s potential to combat illicit trade of different kinds.
The index has four categories and is based on a review of relevant literature and consultations with external advisers, both in 2016 and again in 2018.6 The first of the four categories in the index is “government policy” and it measures the availability of policy and legal approaches for monitoring and preventing illicit trade. The second is “supply and demand”, a measure of the domestic environment that encourages or discourages the supply of and demand for illicit goods. The third category, “transparency and trade”, assesses economies on their transparency as regards illicit trade and the degree to which they exercise governance over their free-trade zones (FTZs) and transhipments. The fourth and final category, “customs environment”, measures how effectively an economy’s customs service manages its dual mandate to facilitate licit trade while also preventing illicit trade.

9© The Economist Intelligence Unit Limited 2018
The Global Illicit Trade Environment Index Overall results
the Americas (19 economies), including the US and Canada, is in third at 54.0. The Middle East and Africa (ten economies)7 is last among the regions, mainly due to low scores for the supply and demand and the transparency and trade categories, averaging 44.0 for both.
Europe’s place atop the regional rankings is the result of its performance in two of the four categories of the index. In the customs environment category, it receives an average score of 79.0, 15 points above the next closest region, on the strength of its customs clearance and inspections times and the number of
that score in the twenties and thirties in the index: Myanmar (82nd), Laos (81st), Venezuela (80th), Cambodia (79th), Kyrgyzstan (78th), Belize (77th), and Ukraine (76th) and Trinidad and Tobago (75th). Each of these countries at the bottom is deficient in their own ways when it comes to illicit trade, but they do share one common trait: the low quality of their state institutions.
Regionally, Europe (34 economies in the index), which includes the EU-28 plus six other countries, earns the highest average score (68.0). Asia-Pacific (21 economies) comes second at 56.0 and
7 Africa is used in a broad sense for the purposes of this paper. The index does not cover economies at the heart of the continent, only North African economies and South Africa.
100 - 67 66 - 34 33- 0
Country scores highest to lowestOverall scores

10 © The Economist Intelligence Unit Limited 2018
The Global Illicit Trade Environment Index Overall results
coming after Europe in both instances. It does do worse than the Middle East and Africa in the supply and demand category, mainly because of the quality of the state institutions in the region and labour market regulations, which, outside of the US, Canada and Guatemala, are more restrictive than the index average when it comes to hiring and firing workers. countries with existing Authorized Economic
Operator (AEO) programmes and customs recordals, a legal measure that allows IP owners to register their IP with the local customs agency and empowers that agency to interdict shipments potentially containing IP-infringing goods without a specific request from the IP owner.
Asia-Pacific’s performance in the index as a region is also owed to the customs environment category, where it scores highly on the customs clearance and inspection times indicator and AEO programmes—all but four of the 21 economies in the region either have an AEO programme ready to launch or already in place. It does falter, however, on a number of other indicators. More than half the economies in the region, for example, are rated “high” or “very high” on the corruption indicator and it has by far the lowest average regional score when it comes to the commitment to illicit trade-related treaties, with the Philippines, Singapore, Thailand and Taiwan among the worst performers, having only ratified, at most, seven or eight treaties out of the 14 covered by the index, depending on the economy.
The Americas region, meanwhile, has the second strongest customs environment and second strongest government policy environment,
Americas Asia-Pacific
Europe Middle East & Africa
54.0 56.0 68.050.0
Regional average scores, overall

11© The Economist Intelligence Unit Limited 2018
The Global Illicit Trade Environment Index Overall results
8 John W Kingdon, Agendas, Alternatives, and Public Policies, New York, 2003
Category #1: Government policy
Category rankings
Finland tops the ranking in this category; Europe (72.0) as a region also scores far better than the three other regions covered by the index, with Asia-Pacific having an average score of 54.0, the Americas 59.0 and the Middle East and Africa 50.0. Like the rest of Europe, Finland’s performance in this category was bolstered by two indicators, in particular. The first is commitment to illicit-trade related treaties. This indicator scores economies based on how many of the 14 key treaties they have ratified, ranging from the UN Convention Against Illicit Traffic in Narcotic Substances and Pyschotropic Substances to the Convention on International Trade in Endangered Species of Wild Fauna and Flora. Finland has ratified all 14 treaties and most countries in Europe have ratified at least 12, the exceptions being Ireland, Ukraine, Belarus and Russia. No economies in Asia-Pacific have ratified all 14, and more than half have ratified ten or fewer.
Europe also outperforms the three other regions on the indicator measuring law enforcement techniques, which addresses the extent to which an economy has specific legislation empowering authorities to use three special investigative techniques: (1) controlled deliveries, (2) intercepting communications and (3) undercover
This category of the index measures the availability of policy and legal approaches to monitoring and preventing illicit trade. It measures the extent to which an economy has entered into 14 conventions related to illicit trade; its compliance with Financial Action Task Force (FATF) money laundering provisions; its stance on IP protection; its approach towards corruption; law enforcement techniques in an economy; the extent of interagency collaboration; and its level of cyber-security preparedness.
To a large extent, all categories in this index are related to government policy, defined as a set of processes including setting the agenda, specification of alternatives from which a choice is to be made, a legislative vote or executive decision among those alternatives and, finally, implementation.8 The government policy category itself, however, is comprised of indicators that are, for the most part, separate from the specific, trade-related indicators of the customs environment and transparency and trade categories and the indicators in the supply and demand category. In the case of the latter, there are national public policy considerations involved and the impact on illicit trade is not necessarily a primary concern for policymakers, such as with tax policy and labour market regulations, which have broader societal implications even if they do have spillover effects on illicit trade.

12 © The Economist Intelligence Unit Limited 2018
The Global Illicit Trade Environment Index Overall results
9 For example, see John Micklethwait and Adrian Wooldridge, The Fourth Revolution: The Global Race to Reinvent the State, 2014
(39th), South Korea (40th) and Taiwan (45th). Seven economies in Asia-Pacific rank below 70. As a region, Asia-Pacific scores well on the law enforcement techniques indicator already discussed above, as well as interagency collaboration, a measure of the extent to which law enforcement and customs authorities co-operate on efforts to counter illicit trade. Notably, in the area of interagency collaboration, Singapore, an economy with a reputation for the quality of its bureaucracy,9 is not among the 12 Asia-Pacific economies that receive the highest score on the indicator, mainly because co-operation between Singapore Customs and the Singapore Police Force is more ad hoc than formal.
In the Americas, which comes second among the four regions on government policy, Canada is
operations. All but four economies in the European region have legislation covering all three techniques. The Americas and Asia-Pacific are not far behind Europe in this respect; 14 out of the 21 economies in Asia-Pacific have legislation for all three and 15 out of the 19 in the Americas do. In the Middle East and Africa, seven out of the ten economies also have all legislation for all three, but the region’s score was dragged down by two virtually lawless countries, Libya and Iraq, which do not have legislation for any of the three techniques.
Regionally, the top-performing economy in the Asia-Pacific region in this category is Australia, which ranks 3rd overall and is followed closely by New Zealand in 4th place. After Japan (15th), Hong Kong (18th) and Singapore (22nd), there is a steep drop to the next grouping—Malaysia
FinlandUnited Kingdom
AustraliaNew Zealand
CanadaSweden
NetherlandsGermanyBelgiumAustria
123456789
10
96.3 95.7 90.7 88.9 88.8 88.1 87.0 86.3 85.284.9
Dominican RepublicRussia
UkraineKyrgyzstanPhilippines
CambodiaMyanmar
LaosLibya
Iraq
75767778798081828384
38.1 37.9 35.3 34.7 32.3 27.5 22.3 18.610.97.5
Americas Asia-Pacific
EuropeMiddle East & Africa
59.0 54.0 72.050.0
Top 10 economies, bottom 10; regional average scores
13© The Economist Intelligence Unit Limited 2018
The Global Illicit Trade Environment Index Overall results
the top-performer and ranks 5th overall in the category. It receives top scores on four of the seven indicators, including levels of corruption (low) and protection of intellectual property (high). The US, ranked 12th in the category, scores well on a number of the same indicators as Canada, but has ratified only eight of the 14 illicit trade-related treaties, putting it on par with economies like Thailand and the Philippines and even behind Vietnam and Pakistan. Among the Latin American economies in the index, Uruguay and Chile rank just outside the top 20, Chile because of its low score on cyber-security preparedness, a measure of a government’s commitment to the five main pillars of cyber-security, and Uruguay because, like Singapore, its interagency collaboration was also deemed to be ad hoc.
Lastly, there is the Middle East and Africa. Six out of the ten economies fall in the bottom half of the index, with Iraq and Libya at the very bottom, as they are in almost all categories and indicators. Israel is the highest-ranking economy in the region, coming in 25th. Its ranking, like a number of other Middle East and African economies, could be improved if it ratified more illicit trade-related treaties and reduced corruption; the region’s average score of 36.0 on the corruption indicator is the lowest among Europe, the Asia-Pacific and the Americas.
14 © The Economist Intelligence Unit Limited 2018
The Global Illicit Trade Environment Index Overall results
10 http://worldcustomsjournal.org/Archives/Volume%207%2C%20Number%202%20(Sep%202013)/03%20McLinden%20and%20Durrani.pdf 11 http://wedocs.unep.org/bitstream/handle/20.500.11822/8030/Green%20carbon%20Black%20Trade_%20Illegal%20logging.pdf?sequence=5&isAllowed=y
Government policy and corruption
No countries are completely free of corruption, however. Only eight of the 84 receive the top score for this indicator, an Economist Intelligence Unit measure of how pervasive corruption is among public officials that ranges from “rare” to “the norm”. With the exception of Singapore and New Zealand, the economies where corruption is deemed rare all are in Europe. There are 38 countries in the index where corruption is “often encountered” or is the norm.
When it comes to corruption and illicit trade, the first image that comes to mind for most people is of a customs official accepting a bribe as a shipment of contraband passes through a port uninspected.10 That image is not wrong, but it is too narrow, which is why the corruption indicator in the index is in this category rather than customs environment. Candice Welsch, chief, Implementation Support Section in the Corruption and Economic Crime Branch of the UN Office on Drugs and Crime says: “Corruption is important at the borders, but there’s also corruption behind borders that essentially prevents people from doing their jobs, whether it’s conducting investigations or leaking information on a patrol, which happens with wildlife trafficking.”
It also happens with the production of illicit timber, albeit in slightly different ways. The UN Environment Programme estimated in 2012 the value of illegal logging and “forest crime” to be US$30bn-100bn annually, accounting for 10-30% of the total global trade in raw logs and milled wood products.11 For illegal logging and trade in illicit timber, much of the behind-the-border corruption is centered around the licensing process. To be able to log a forestry concession, a logging company must first obtain a licence to extract timber from the relevant local authorities responsible for forestry management. This is where corruption comes in, according to Davyth Stewart, co-ordinator of the Global Forestry Enforcement and Pollution Crime Unit at Interpol. “It [the licensing process] is where questions start arising,” Mr Stewart says. “Is there any corruption or bribe-paying involved in obtaining the licence? Was fraud committed that would allow for the submission of false management plans that misdeclare the real situation in the forest?” A ”yes” answer to any of these questions is likely to mean that there is illegal logging occurring in the territory.

15© The Economist Intelligence Unit Limited 2018
The Global Illicit Trade Environment Index Overall results
12 https://www.brookings.edu/research/cyber-theft-of-competitive-data-asking-the-right-questions/ 13 https://www.csis.org/analysis/how-much-have-chinese-actually-taken14 https://www.wired.com/beyond-the-beyond/2018/01/estonian-cyber-security/
Cyber-security and intellectual property
Before the spread of the internet, where illicit trade and the protection of intellectual property (IP) intersected, the main objective was seizing physical IP-infringing goods—handbags, apparel and the like. Although physical IP-infringing goods remain a significant problem, cyber theft of patents and other forms of industrial IP, also known as Cyber Theft of Competitive Data,12 have been growing in recent years. The issue gained increased attention earlier this year when the US administration threatened China with tariffs and other penalties in response to years of alleged industrial espionage, the cost of which one expert estimates to amount to US$20bn-30bn annually, and as much as US$600bn over the past two decades.13
Although protection against industrial espionage begins at the firm-level, the overall cyber-security environment an economy creates within its borders is also instrumental in prevention. No region in the index performs particularly well on the cyber-security preparedness indicator, however, and the overall average score across all economies is just 55.3 (out of 100). Singapore tops the rankings, followed by the US and, somewhat surprisingly, Malaysia, which comes in 3rd. The small nation of Estonia, which has developed a robust state and non-state cyber-security apparatus in the face of numerous cyberattacks from Russia and now advises other nations on the matter, ranks 4th in the indicator, one its best performances in the overall index.14
Although all economies need to have robust cyber-security measures in place, whether it’s to protect IP or guard critical infrastructure, when it comes to industrial espionage there are really only four main players, says Allen Dixon, director of IDEAS Matter, an industry consortium focused on IP. On one side, there are the targets, US and European companies with valuable IP and industrial trade secrets deemed to have “economic value”. On the other side are the perpetrators, Russian and Chinese hackers who may or may not be aligned with their respective states. “I know of a single European industrial products firm that says it receives 50 attempted hacks a day from Russia and China,” says Mr Dixon. And the hackers are not always after IP for its “economic value”, there are political objectives involved too. “There seems to be an element of blackmail,” says Mr Dixon, “as well as [the states] saying, in effect, ‘you play nice with us or we’ll steal your crown jewels’.”

16 © The Economist Intelligence Unit Limited 2018
The Global Illicit Trade Environment Index Overall results
Category #2: Supply and demand
effective state institutions, with well trained and motivated bureaucracies. And third, they tend to either have low corporate taxes or employers who provide relatively high social security contributions, or, in some instances, both.
New Zealand tops the supply and demand category, followed in order by Singapore, UAE, Hong Kong and Finland. On a regional basis, Asia-Pacific and Europe are in a virtual tie, with average scores of 54.0 and 55.0, respectively. Asia-Pacific as a whole scores best on the tax and social security burden indicator, with most of the 21 countries ranking in the top half of the index, save India and China, which rank towards the very bottom. Europe, for its part, does best on the “quality of state institutions” indicator, as well as perception of organised crime, a measure of the extent to which businesses believe mafia-oriented racketeering and extortion impose costs on their activities.
The Middle East and Africa comes 3rd among the four regions, with an average score in the category of 44.0. Because of the natural resource wealth that some economies in the region enjoy, such as Saudi Arabia, the UAE, and Iraq, the region scores well on tax and social security burdens. The region scores poorly on labour market regulations, a measure of the degree of restrictiveness on hiring and firing; Iraq, Libya,
This category measures the domestic environment that encourages or discourages the supply of and demand for illicit goods, including the level of corporate taxation and social security burdens, the quality of state institutions, labour market regulations, and perceptions of the extent to which organised crime imposes costs on business.
The debate over whether supply or demand is the main driver of illicit trade—particularly, but not only, for narcotics—is a contentious one. Economies like the US, most prominently, favour policy approaches targeted at reducing the supply, leading to various interventions beyond its borders. On the demand side, the issue is just as thorny, albeit without the geopolitical implications. Proponents of demand-side solutions to illicit trade, whether it is narcotics, counterfeits or trafficking in endangered species, tend to argue that education and treatment for addiction are among the real solutions.
Category rankings
The economies that perform best in this category tend to fit a similar profile. First, most of them are small. With the exception of the US, the UK and Canada, the top ten is made up of economies with populations under 10m. Second, they have

17© The Economist Intelligence Unit Limited 2018
The Global Illicit Trade Environment Index Overall results
inclusion of the US and Canada in the regional grouping, the Americas performance would be far worse. Outside of those two economies, only Chile registers strong scores. Otherwise, most of the economies in the Americas region, which includes Central and Latin America and the Caribbean, are largely laggards, particularly on the quality of state institutions indicator.
Morocco, Saudi Arabia and Tunisia all receive the lowest score on this indicator, which was compiled from The Economist Intelligence Unit’s Business Environment Ranking and Risk Briefing. Stricter labour market regulations have been shown to drive a larger portion of the workforce into the underground, or “shadow” economy, including into activities related to illicit trade.15
The Americas region trails the Middle East and Africa and is last among all the regions in this category, with an average score of 42.0. As a region, it doesn’t excel in any of the four indicators in supply and demand and is the worst-performing region in the perceptions of organised crime and quality of state institutions indicators, even under-performing the Middle East and Africa in the latter category, albeit by only a single point. Overall, were it not for the
15 Friedrich Schneider, The Shadow Economy, 2013
New ZealandSingapore
United Arab EmiratesHong Kong
FinlandDenmark
United KingdomLuxembourg
United StatesAustria
123456789
10
BrazilBosnia
PakistanItaly
UkraineGuatemala
MyanmarIraq
VenezuelaLibya
75767778798081828384
29.2 27.9 26.9 23.8 22.2 21.2 18.48.8 8.56.3
Americas Asia-Pacific
EuropeMiddle East & Africa
42.0 54.0 55.0 44.0
90.3 89.9 82.0 81.4 81.3 79.9 79.6 74.8 74.272.5
Top 10 economies, bottom 10; regional average scores

18 © The Economist Intelligence Unit Limited 2018
The Global Illicit Trade Environment Index Overall results
16 https://www.theguardian.com/world/2015/aug/18/isis-beheads-archaeologist-syria 17 https://www.washingtonpost.com/news/checkpoint/wp/2017/05/02/libya-has-become-a-hub-for-online-arms-trading-report-says/?utm_term=.be3a00c31f58. For more details,
please see the briefing paper on illicit trade and North Africa, available at illicittradeindex.eiu.com
Quality of state institutions
Anarchy never prevails for long, if at all. When and where state institutions are weak or altogether absent, some type of organisation will inevitably step in to fill at least part of the void. In a number of countries covered by the index where such conditions prevail, the organisations that have stepped in are either criminal or terrorist in nature. Rare, if not non-existent, are the cases of a benevolent or even benign non-state actors taking control of an otherwise lawless territory, be it within a country or of the country itself. This has significant implications for the global supply of a wide range of illicit goods, including the production and shipment of narcotics in South-east and Latin America and all types of counterfeits in the Middle East.
Nine economies out of 84 in the index receive the lowest possible score on the quality of state institutions indicator, which means that there are nine economies in the index where the state is almost, if not entirely, ineffective, to the extent that it is even present at all. Iraq and Libya are the most prominent examples. Both could at best be classified as “weak states” and are arguably closer to collapse than they are to functioning on a meaningful level. In Iraq, this gave rise to Islamic State (IS), a terrorist organisation that, among a litany of horrid acts, has engaged in various types of illicit trade, including human trafficking, smuggling illicit cigarettes, oil and fuel theft, and even the theft and sale of Iraqi and Syrian antiquities.16 IS, and groups like it, don’t have as strong a presence in Libya, so the sources of illicit trade are somewhat more diffuse, but there are a number of armed groups nominally affiliated with the state that pursue their own economic interests, including through illicit activities, especially trade in small arms.17
For the most part, however, terrorist organisations and other non-state actors exercising control over territories, whether in the Middle East or elsewhere, have learned through failure that illicit trade is better left to the criminals and that taxing it is easier. “Very rarely are they [terrorist organisations] able to establish a new economy,” says Vanda Felbab-Brown, a senior fellow at the Brookings Institution, a think-tank, and an expert on terrorist organisations and illicit trade. “In some instances, they’ll get greedy and foolish and eliminate the independent traffickers,” Ms Felbab-Brown says, “but ultimately they figure out that taxation is easier [than establishing illicit supply chains].”

19© The Economist Intelligence Unit Limited 2018
The Global Illicit Trade Environment Index Overall results
18 That only five economies in the index have fully accepted Annex D provides those economies with a significant bump in the overall index results. However, the fact that 79 economies haven’t accepted it should be read as an indictment of those economies rather than the Annex itself.
19 http://www.wcoomd.org/-/media/wco/public/global/pdf/topics/facilitation/instruments-and-tools/conventions/kyoto-convention/revised-kyoto-convention/body_gen-annex-and-specific-annexes.pdf?la=en
Category #3: Transparency and trade
ranks in the middle or lower tiers in the three other categories. It’s at the top here mainly because it is one of the five economies in the index that has accepted Annex D of the RKC without reservations,18 as well as its level of its FTZ governance and international reporting on trafficking in both humans and drugs.
No region in the index performs particularly well in this category. The average score is just 53.0, only slightly better than the average in the supply and demand category. In large part, this is due to the small number of countries that have accepted Annex D of the RKC. Besides the four other economies, in addition to Kazakhstan, that have accepted Annex D without reservations, there are eight others that accepted with varying reservations, including China, the US and Japan. That leaves 72 economies in the index that have so far failed to officially commit to such recommended practices as customs having the “right to carry out checks at any time on the goods stored in the free zone.”19
Europe scores best out of the four regions, with an average score of 60.0. It’s strongest on the FTZ governance indicator, a custom measure The Economist Intelligence Unit created for the index that assesses economies on a scale of zero to two, two being the highest score. All but two economies in Europe—Bulgaria and Serbia—receive a score
This category measures an economy’s transparency as regards illicit trade and the degree to which it exercises governance over its FTZs and transhipments. Indicators include: quality of consignment tracking and tracing services; the adoption of Annex D of the Revised Kyoto Convention (RKC), which seeks to ensure standardised customs procedures in customs warehouses and FTZs; the extent of monitoring and oversight at FTZs; and the extent to which governments report their efforts and share information to fight illicit trade.
Transparency within and between governments, and between the public and private sector, is vital to combat illicit trade. It’s only through transparency—the sharing of data, documents and methods—that individual states and the international community at large can better grasp and address the problem.
The US comes first in the transparency and trade category, scoring nearly five points better than Hong Kong, which is in second place. After Hong Kong, there is a somewhat odd mix of economies, starting with South Korea in 3rd place, Kazakhstan in 4th and Japan in 5th. The rest of the top ten is rounded out by European economies (Sweden, Austria, Germany and Belgium) and Australia, which ranks 10th. The transparency and trade category is an outlier for Kazakhstan, which

20 © The Economist Intelligence Unit Limited 2018
The Global Illicit Trade Environment Index Overall results
20 For more on FTZs, please see our case studies of five specific zones available at illicitradeindex.eiu.com21 Specifically, Articles 7 and 19 of Law No. 54/2014/QH13
zone to have a customs office, but according to local experts interviewed during construction of the index, the level of governance is so notoriously weak that it does not pose an impediment to illicit trade, which resulted in a downgrade to its score.
The Americas, which has an average score of 44.0 in the category, suffers like the other regions from having few economies that have not accepted any part of Annex D of the RKC. In this case, there is only one, the US, and even it accepted with reservations, keeping it from a full score on the indicator. The region also does poorly on the provision of track and trace services, an indicator that draws on the World Bank Logistics Performance Index and included because tracking and tracing consignments make trade in illicit goods more difficult. After stripping out the US and Canada, which both rank in the top, the
of two. This indicates that not only are there customs officials and other authorities present in the region’s FTZs with the authority to inspect goods in transit, but also that customs and those authorities actually do exercise monitoring and oversight of the zones. That is not always the case; a number of economies grant customs the authority, but customs does not use it to carry out meaningful inspections in the zones.20
In Asia, where FTZs have played a special role in the development of many of the region’s economies, and most famously in China, governance is less consistent. Although 13 of the 21 economies receive a score of two, there are four—Armenia, Cambodia, Kyrgyzstan and Malaysia—that receive a one, and four more receive a zero: Laos, Myanmar, Singapore and Vietnam. Vietnam, for example, has a law in place21 that requires every
United StatesHong Kong
South KoreaKazakhstan
JapanSwedenAustria
GermanyBelgium
Australia
123456789
10
85.1 80.3 79.6 77.2 76.6 75.0 74.7 73.5 72.972.0
KyrgyzstanLaos
ArmeniaJamaicaVietnamPanamaMorocco
MyanmarBelizeLibya
75767778798081828384
28.4 27.5 26.0 25.8 24.5 23.4 22.713.312.9 1.2
Americas Asia-Pacific
EuropeMiddle East & Africa
44.0 53.0 60.044.0
Top 10 economies, bottom 10; regional average scores

21© The Economist Intelligence Unit Limited 2018
The Global Illicit Trade Environment Index Overall results
average score for the other economies in the region is 2.8 out of a possible 5.0.
The Americas region’s score is also hurt by the FTZ governance indicator (as is Asia-Pacific’s). Two economies, Panama and Belize, receive a score of zero here. In Belize, the Commercial Free Zone Management Agency monitors and administers the free zones, and customs officials are at least authorised to carry out inspections within the zones, but research showed the authorities to be underfunded and lax, particularly in the Corozal Free Zone, resulting in rampant smuggling. Panama and its notorious Colon Free Zone is much the same, having little in the way of enforcement and effective controls.
The Middle East and Africa likewise struggles on the track and trade services indicator, but its average score in the category is also brought down by a key measure of transparency: international reporting. This is a composite indicator comprised of three sub-scores—reporting human trafficking, trade-related IP infringement and drug seizures. Seven out of the ten economies in the Middle East and Africa covered by the index do not publish any data on trade-related IP infringement; even in Israel, the most advanced economy in the region, customs officials were not sure if such data existed. Reporting on drug seizures and human trafficking is better, but there are still gaps in the region, with Libya, Iraq, Tunisia and Algeria all falling short in one or both of these areas.

22 © The Economist Intelligence Unit Limited 2018
The Global Illicit Trade Environment Index Overall results
22 https://www.scientificamerican.com/article/china-says-its-gender-imbalance-most-serious-in-the-world/23 http://www.scmp.com/magazines/post-magazine/long-reads/article/2142658/too-many-men-china-and-india-battle-consequences
International reporting: human trafficking
Stories about human trafficking tend to focus on its more salacious aspects,for instance, trafficking for forced prostitution, and as heinous as that is, it nevertheless represents a smaller fraction of human trafficking than is often appreciated. A much larger problem is trafficking for purposes of slavery, including child labour, and for forced marriage, particularly in Asia. There’s a reason they receive less attention, says Helen Sworn, director and founder of Chab Dai, a Cambodia-based non-governmental organisation focused on human trafficking issues—“Sex trafficking is a more compelling story than slavery on fishing boats. It’s far more morally repugnant.”
Six of the 84 economies in the index receive a score of zero (out of a possible two) on this indicator and 13 more receive a score of one. Among those that score zero, meaning they do not meet the minimum standards in the US Trafficking Victims Protection Act and are not making significant efforts to do so, are economies like Russia, Venezuela and China.
China’s score on this indicator is important, as is India’s, although the latter performs well in this category. Both economies have serious gender imbalances in their 1bn-plus populations. In China and India, and other countries in Asia and elsewhere, this is a result of cultural biases towards having boys.22 In China, however, the bias has been exacerbated by the government’s long-standing “one child” policy, resulting in 118 boys being born for every 100 girls and a current population of as many as 70m “surplus males” who are unlikely to be able to find partners.24
A host of problems related to social stability arise from the problem of a population of unattached men of this size, including increased criminality. Often overlooked, however, is the impact it has on the demand for human trafficking, and whether and to what extent governments are complicit in satisfying that demand, mostly by actively looking the other way in the face of evidence. “They [China] are bringing women in from Cambodia, Myanmar, Vietnam and Laos,” says Ms Sworn, “and they [the women] are taken to very rural areas, maybe three to four days travel from major cities, and are married to older men, many of whom have mental or physical disabilities.” The Chinese government has been careful about discussing the domestic and geopolitical implications of its gender imbalances, but to its credit it has made some overtures to countries on the repatriation of women trafficked for forced marriages, including Cambodia, with which it has signed a Memorandum of Understanding on the matter.23

23© The Economist Intelligence Unit Limited 2018
The Global Illicit Trade Environment Index Overall results
Category #4: Customs environment
can employ for enforcement at the border by registering their IP with the local customs agency, empowering the agency to interdict shipments suspected of containing IP-infringing goods with a specific request from the IP owner. Twenty-one countries, including Hong Kong, Vietnam and Canada, have a system in place, but these were determined to be largely ineffective, which in most cases means that although customs has the authority to interdict such shipments, they rarely do so of their own accord. Finally, 14 economies do not have a recordal in place at all; Singapore, Malaysia, Brazil and Uruguay are among this group.
The second reason for the good performance in this category is the fact that a large number of economies in the index register fast times in evaluations of their customs clearance and inspections processes, including border and documentary compliance. The fastest, where clearance and inspection takes just two hours, are all in Europe; the average time for the 42 economies in the top-half of the category is just under 24 hours. There is a wide-range of times among economies in the bottom half of the index, however, from Armenia at 84 hours to Iraq at 896 and Venezuela at a tooth-lengthening 2,146.
This category measures how effectively an economy’s customs service manages its dual mandate to facilitate licit trade while also preventing illicit trade. It consists of five indicators: percentage of shipments physically inspected; the time taken for customs clearance and inspection, the extent of automation of border procedures, the presence of AEO programmes and the presence of customs recordal systems.
Customs is almost, by definition, assumed to be the locus of illicit trade and efforts to combat it. And in many respects, it is. It is through and around customs that illicit goods enter a country, at least when they do so through normal trade channels. It also a point of contention for policymakers, law enforcement and the private sector, as they each have competing and conflicting interests with regard to the balance between trade facilitation and monitoring.
The top ranked country in the category is South Korea, but it is far from alone. Thirty-six economies in the index achieve a score of 80.0 or above, and across all 84 economies, the average score is 69.0, the highest among the four categories. There are a number of reasons for the high-levels of performance on customs environment. First, 49 economies have an effective customs recordal in place, a customs recordal being a legal measure that IP owners

24 © The Economist Intelligence Unit Limited 2018
The Global Illicit Trade Environment Index Overall results
South KoreaNetherlands
United StatesIreland
SpainSlovenia
DenmarkEstonia
GermanySlovakia
123456789
10
92.2 90.2 89.2 88.5 88.1 87.9 87.7 87.587.487.3
BelizeBosnia
CambodiaMyanmar
Trinidad and TobagoUkraine
VenezuelaLaosIraq
Libya
75767778798081828384
35.7 35.7 34.8 33.8 30.2 27.4 24.5 21.9 15.813.1
Americas Asia-Pacific
EuropeMiddle East & Africa
64.0 63.0 79.060.0
Top 10 economies, bottom 10; regional average scores

25© The Economist Intelligence Unit Limited 2018
The Global Illicit Trade Environment Index Overall results
24 http://tfig.unece.org/contents/wco-safe.htm 25 http://www.wcoomd.org/en/topics/facilitation/instrument-and-tools/tools/~/media/4448CE5B00DB422FA89A29AA447A4F22.ashx
Authorized Economic Operator indicator
The third reason for the high average score in the “customs environment” category is the number of economies with Authorized Economic Operator (AEO) programmes, a system that offers certification for preferential customs processing to firms that meet the requirements, including supply-chain security standards. AEOs were established in 2005 under the World Customs Organisation Framework of Standards to Secure and Facilitate Trade, otherwise known by the acronym SAFE.24 To be certified as an AEO, companies must undergo an audit. Depending on the economy, the audit covers compliance records for exports and imports, any criminal records for the company and its officers, tax compliance and fiscal solvency, as well as its overall business portfolio.25
The benefits of an AEO for combating illicit trade are clear. Firms that pass the audit are deemed safe and their shipments through customs thus in less need of the authorities’ attention than firms that are not authorised. That frees up the time of customs officers to focus more on high-risk shipments and other traders that raise red flags. The firms that make it through the process, for their part, receive not only the promise of expedited shipments but also, in many economies, a dedicated account manager within the customs agency who serves as the first point of call should they run into issues with customs or the local Ministry of Health, for example.
So why are there 22 economies in the index which either don’t have a programme in place yet or no plans to launch one? Part of the answer relates to the scale of the programme and availability of resources, says Frank Debets, managing partner for customs and international trade with PwC’s world trade management services practice. “In some countries, the local of Ministry of Trade is concerned about offering [AEO certification] to importers,” Mr Debets explains, “because they wonder if they have the right people in place to police it. If they don’t, then the AEO system can become a kind of free-for-all and more of a problem than if they didn’t institute it in the first place.”

26 © The Economist Intelligence Unit Limited 2018
The Global Illicit Trade Environment Index Overall results
Put another way, AEO programmes can be doomed by their success. For an economy initiating an AEO programme, conducting audits and offering dedicated customs account managers is fine when there are just a small number of firms applying and gaining certification. The calculus changes when you have 2,000 or 10,000 AEOs, says Mr Debets. Once a programme reaches that point, it becomes meaningless for both sides—the government can’t manage it and, as a result, having a customs official spread too thin to provide actual assistance does nothing for the AEOs.
That does not mean the programmes should be abandoned. Instead, they should be bolstered. Auditing and registering trusted firms, while time-consuming, is one of the better means available to customs authorities for managing their dual mandate, hence the inclusion of this indicator in the index.
Authorized Economic Operator programme (score 1)
Authorized Economic Operator programme (score 0)
RANK COUNTRY SCORE/100 DATA 0-2 RANK COUNTRY SCORE/100 DATA 0-2
=72 Belarus 0.0 0=72 Bosnia 0.0 0=72 Iraq 0.0 0=72 Kyrgyzstan 0.0 0=72 Laos 0.0 0=72 Libya 0.0 0=72 Myanmar 0.0 0=72 Pakistan 0.0 0=72 Paraguay 0.0 0=72 Saudi Arabia 0.0 0=72 Trinidad and Tobago 0.0 0=72 Ukraine 0.0 0=72 Venezuela 0.0 0
=63 Algeria 50.0 1=63 Armenia 50.0 1=63 Belize 50.0 1=63 Cambodia 50.0 1=63 Chile 50.0 1=63 Kazakhstan 50.0 1=63 Montenegro 50.0 1=63 Philippines 50.0 1=63 United Arab Emirates 50.0 1
27© The Economist Intelligence Unit Limited 2018
The Global Illicit Trade Environment Index Overall results
suggesting low or very low levels of automation at the border.
The ten economies in the Middle East and Africa grouping average 60.0 in the “customs environment” category. Six of the ten actually perform quite well on the automation indicator, although Algeria, Iraq and Libya are among the small number of economies in the overall index that employ negligible or no automation at customs. Only four of the ten offer customs recordals that are effective—Israel, Saudi Arabia, Turkey and the UAE—and only five have AEO programmes in place: Israel, Morocco, South Africa, Tunisia and Turkey.
Regionally, Europe has the strongest customs environment, with an average score of 79.0; 24 of the 34 European economies score above 81.0 in the category. However, as we note in a separate paper published on the Europe results of the index,26 economies at the region’s geographic periphery can make the region as a whole vulnerable to illicit trade flows. In the case of the customs environment, those economies include Ukraine and Belarus, both of which employ relatively low levels of automation in their customs processes and do not have AEO programmes in place.
The Americas follow Europe. It has an average score of 64.0 in the category. It does well on the percentage of shipments physically inspected and AEO indicators, but lags the other regions on customs recordals; seven out of the 19 economies covered by the index don’t offer a recordal, versus Europe, where all economies have one, and Asia where only five of 21 don’t have the system in place.
The Asia-Pacific region, which at 63.0 trails the Americas by about one point, is dragged down by relatively low levels of automation, an indicator based on part of the OECD Trade Facilitation Indicators and that evaluates economies on their electronic exchange of data, automated border procedures and use of risk management. Although Singapore and South Korea receive the highest possible scores on the indicator, and a number of economies fall on the upper end of the scale, eight economies, including Malaysia, Indonesia and Myanmar, receive scores equivalent to half or less,
26 Available at illicittradeindex.eiu.com

28 © The Economist Intelligence Unit Limited 2018
The Global Illicit Trade Environment Index Overall results
Concluding remarks
so be it. And if more of the world’s population finds it easier to purchase small arms, counterfeit handbags or highly addictive narcotics because of globalisation, well so be that, too.
That sort of fatalism isn’t necessary, however. It’s the result of bad governance and the mere hint of the sentiment should be disturbing. As we noted in our 2016 paper, and emphasise again in this year’s edition, there is an international community of people—observers, experts, private-sector executives and government officials— who have identified the many ways in which illicit trade, in all it various forms, can be combated. The solutions they propose range from the quotidian to the more extreme. Few, if any, are unrealistic.
What the index, this paper and all the other papers published alongside it as part of the larger project, proposes is that economies that are laggards on the issue can start small and build towards a better environment for preventing illicit trade. And the economies that are leaders should lead.
A close look at the global environment that enables illicit trade can prove a somewhat dispiriting exercise. The average overall score in the Global Illicit Trade Environment is a shade under 60.0 out of 100. Where economies aren’t under-resourced in customs or law enforcement, they may otherwise be indifferent or actively neglect illicit practices in order to continue reaping the economic benefits of being a global financial centre (like the UK) or a regional logistics hub (like Singapore, Dubai and Panama) or one of the world’s factories (like China and Vietnam) or a main source of narcotics (like Colombia). Or they may just be corrupt; corruption is far more pervasive than people appreciate and it is by no means limited to the developing world, as investigations in the US and elsewhere have recently shown.
In the face of a problem that seems so widespread and seemingly overwhelming, the easiest option is of course to throw up our collective hands and write off illicit trade as an insidious and unfortunate by-product of the greater good of global economic integration, a trend that, for all its faults, has in fact lifted hundreds of millions of people out of poverty over the past three decades. If more people are trafficked for human slavery and forced prostitution, so be it; people are being lifted out of poverty. If more of the world’s flora and fauna become endangered,

29© The Economist Intelligence Unit Limited 2018
The Global Illicit Trade Environment Index Overall results
Appendix 1: Index results
1-22
43-63 64-84
23-42RANK COUNTRY SCORE/ 100
RANK COUNTRY SCORE/ 100 RANK COUNTRY SCORE/ 100
RANK COUNTRY SCORE/ 100
43 Colombia 61.644 China 60.945 Romania 60.846 Costa Rica 60.647 Malaysia 60.348 Thailand 59.849 India 58.950 Saudi Arabia 58.851 Mexico 58.652 Bulgaria 57.753 Tunisia 56.054 Panama 55.055 Kazakhstan 54.856 Peru 54.857 Serbia 52.258 Algeria 51.559 Brazil 50.660 Ecuador 50.161 Armenia 49.762 Russia 49.163 Montenegro 49.0
64 Philippines 48.565 Morocco 48.066 Vietnam 47.567 Guatemala 46.068 Indonesia 45.269 Jamaica 43.770 Paraguay 43.371 Dominican Republic 42.772 Pakistan 41.973 Belarus 41.574 Bosnia 40.975 Trinidad and Tobago 38.076 Ukraine 37.877 Belize 34.778 Kyrgyzstan 33.579 Cambodia 30.680 Venezuela 28.181 Laos 26.882 Myanmar 22.683 Iraq 14.484 Libya 8.6
23 Czech Republic 71.424 Estonia 71.125 Singapore 71.126 Lithuania 70.827 Latvia 69.928 Taiwan 69.729 Slovakia 69.630 Chile 69.131 Hungary 68.532 Portugal 68.433 Poland 68.334 United Arab Emirates 67.835 Cyprus 66.936 Croatia 65.837 Italy 64.438 Argentina 64.039 Uruguay 63.040 Turkey 62.341 Greece 61.742 South Africa 61.7
1 Finland 85.62 United Kingdom 85.13 United States 82.54 New Zealand 82.35 Australia 81.06 Sweden 80.97 Austria 80.58 Netherlands 80.09 Denmark 79.310 Germany 78.911 Belgium 78.612 Hong Kong 78.413 Luxembourg 78.314 Japan 78.215 Canada 77.416 Ireland 76.517 South Korea 75.418 Spain 74.119 France 73.820 Malta 73.121 Israel 72.622 Slovenia 71.6

30 © The Economist Intelligence Unit Limited 2018
The Global Illicit Trade Environment Index Overall results
Americas Asia-Pacific RANK COUNTRY SCORE/ 100 RANK COUNTRY SCORE/ 100
1 United States 82.52 Canada 77.43 Chile 69.14 Argentina 64.05 Uruguay 63.06 Colombia 61.67 Costa Rica 60.68 Mexico 58.69 Panama 55.010 Peru 54.811 Brazil 50.612 Ecuador 50.113 Guatemala 46.014 Jamaica 43.715 Paraguay 43.316 Dominican Republic 42.717 Trinidad and Tobago 38.018 Belize 34.719 Venezuela 28.1
1 New Zealand 82.32 Australia 81.03 Hong Kong 78.44 Japan 78.25 South Korea 75.46 Singapore 71.17 Taiwan 69.78 China 60.99 Malaysia 60.310 Thailand 59.811 India 58.912 Kazakhstan 54.813 Armenia 49.714 Philippines 48.515 Vietnam 47.516 Indonesia 45.217 Pakistan 41.918 Kyrgyzstan 33.519 Cambodia 30.620 Laos 26.821 Myanmar 22.6

31© The Economist Intelligence Unit Limited 2018
The Global Illicit Trade Environment Index Overall results
Middle East & Africa Europe RANK COUNTRY SCORE/ 100RANK COUNTRY SCORE/ 100
1 Israel 72.62 United Arab Emirates 67.83 Turkey 62.34 South Africa 61.75 Saudi Arabia 58.86 Tunisia 56.07 Algeria 51.58 Morocco 48.09 Iraq 14.410 Libya 8.6
1 Finland 85.62 United Kingdom 85.13 Sweden 80.94 Austria 80.55 Netherlands 80.06 Denmark 79.37 Germany 78.98 Belgium 78.69 Luxembourg 78.310 Ireland 76.511 Spain 74.112 France 73.813 Malta 73.114 Slovenia 71.615 Czech Republic 71.416 Estonia 71.117 Lithuania 70.818 Latvia 69.919 Slovakia 69.620 Hungary 68.521 Portugal 68.422 Poland 68.323 Cyprus 66.924 Croatia 65.825 Italy 64.426 Greece 61.727 Romania 60.828 Bulgaria 57.729 Serbia 52.230 Russia 49.131 Montenegro 49.032 Belarus 41.533 Bosnia 40.934 Ukraine 37.8

32 © The Economist Intelligence Unit Limited 2018
The Global Illicit Trade Environment Index Overall results
Government policy Government policy continuedRANK COUNTRY SCORE/ 100 RANK COUNTRY SCORE/ 100
1 Finland 96.32 United Kingdom 95.73 Australia 90.74 New Zealand 88.95 Canada 88.86 Sweden 88.17 Netherlands 87.08 Germany 86.39 Belgium 85.210 Austria 84.911 France 81.412 United States 81.113 Denmark 80.214 Malta 79.415 Japan 79.016 Ireland 78.817 Slovenia 78.818 Hong Kong 78.719 Luxembourg 78.220 Spain 76.921 Uruguay 75.922 Singapore 75.923 Chile 74.224 Cyprus 74.225 Israel 73.626 Croatia 73.427 Hungary 73.128 Lithuania 72.529 Estonia 72.230 Latvia 72.131 Poland 71.832 Czech Republic 71.133 Italy 70.434 Costa Rica 70.335 United Arab Emirates 70.336 Colombia 69.437 South Africa 69.238 Slovakia 69.239 Malaysia 69.140 South Korea 67.641 Argentina 67.042 Saudi Arabia 66.6
43 Portugal 63.744 Greece 62.845 Taiwan 62.746 Romania 62.647 Bulgaria 62.548 Mexico 62.249 Brazil 61.450 Montenegro 59.351 India 56.952 Panama 56.653 Peru 56.454 Ecuador 55.755 Guatemala 54.856 Armenia 54.357 Turkey 54.058 China 53.959 Serbia 53.660 Thailand 52.661 Bosnia 52.362 Tunisia 49.763 Jamaica 48.364 Morocco 48.365 Belarus 47.766 Pakistan 47.267 Kazakhstan 47.168 Algeria 46.069 Belize 44.270 Paraguay 44.071 Indonesia 42.772 Trinidad and Tobago 42.373 Vietnam 41.174 Venezuela 38.175 Dominican Republic 38.176 Russia 37.977 Ukraine 35.378 Kyrgyzstan 34.779 Philippines 32.380 Cambodia 27.581 Myanmar 22.382 Laos 18.683 Libya 10.984 Iraq 7.5

33© The Economist Intelligence Unit Limited 2018
The Global Illicit Trade Environment Index Overall results
Supply and demand Supply and demand continuedRANK COUNTRY SCORE/ 100 RANK COUNTRY SCORE/ 100
1 New Zealand 90.32 Singapore 89.93 United Arab Emirates 82.04 Hong Kong 81.45 Finland 81.36 Denmark 79.97 United Kingdom 79.68 Luxembourg 74.89 United States 74.210 Austria 72.511 Canada 72.412 Malta 71.813 Israel 71.514 Sweden 69.115 Japan 68.816 Australia 68.117 Chile 67.818 Netherlands 67.719 Taiwan 66.720 Malaysia 65.921 Slovakia 64.422 Ireland 64.423 South Korea 64.224 Belgium 63.025 Germany 60.926 Czech Republic 59.827 Estonia 59.628 Spain 58.229 Portugal 57.930 Latvia 56.431 Thailand 56.332 Lithuania 55.233 Poland 54.634 Cyprus 54.535 Kazakhstan 54.536 Panama 53.937 Hungary 52.938 Vietnam 52.439 Slovenia 52.340 Uruguay 52.241 Turkey 52.042 Russia 51.7
43 Algeria 51.744 Armenia 49.545 Costa Rica 48.846 France 48.047 Laos 46.748 Romania 46.249 China 46.150 Saudi Arabia 45.851 South Africa 45.252 Bulgaria 44.853 Croatia 43.954 Argentina 42.955 Philippines 42.356 Serbia 41.457 Montenegro 41.058 Tunisia 40.559 Morocco 40.060 India 39.961 Paraguay 39.862 Jamaica 39.163 Indonesia 38.564 Mexico 38.565 Belize 38.466 Belarus 36.667 Trinidad and Tobago 36.468 Greece 36.069 Colombia 34.470 Ecuador 34.171 Kyrgyzstan 33.472 Cambodia 31.373 Dominican Republic 30.174 Peru 29.975 Brazil 29.276 Bosnia 27.977 Pakistan 26.978 Italy 23.879 Ukraine 22.280 Guatemala 21.281 Myanmar 18.482 Iraq 8.883 Venezuela 8.584 Libya 6.3

34 © The Economist Intelligence Unit Limited 2018
The Global Illicit Trade Environment Index Overall results
Transparency and trade Transparency and trade continuedRANK COUNTRY SCORE/ 100 RANK COUNTRY SCORE/ 100
1 United States 85.12 Hong Kong 80.33 South Korea 79.64 Kazakhstan 77.25 Japan 76.66 Sweden 75.07 Austria 74.78 Germany 73.59 Belgium 72.910 Australia 72.011 United Kingdom 71.712 Luxembourg 71.613 Ukraine 71.114 Finland 70.515 France 70.216 Ireland 69.717 Algeria 69.718 Canada 68.819 China 68.120 Italy 68.021 Czech Republic 67.822 Spain 67.623 Netherlands 67.224 Philippines 67.125 Denmark 66.426 Lithuania 65.727 Portugal 65.228 Greece 64.529 Taiwan 64.430 Estonia 60.031 Latvia 59.732 Hungary 59.433 Croatia 58.834 Israel 58.835 India 58.536 Chile 58.337 Slovenia 57.7=38 New Zealand 56.8=38 Turkey 56.840 Thailand 56.841 Poland 55.242 Argentina 55.1
43 Saudi Arabia 54.944 Tunisia 54.645 Indonesia 54.146 Slovakia 53.247 Malta 53.248 South Africa 51.349 Romania 50.850 Pakistan 50.451 Uruguay 49.552 Mexico 49.453 Ecuador 49.454 Cyprus 47.955 Malaysia 47.756 Colombia 45.657 Singapore 45.658 United Arab Emirates 43.759 Brazil 42.860 Paraguay 42.261 Trinidad and Tobago 41.962 Peru 40.863 Bosnia 40.664 Guatemala 39.365 Belarus 39.166 Russia 38.967 Costa Rica 38.568 Bulgaria 37.869 Montenegro 35.770 Venezuela 34.671 Dominican Republic 34.172 Serbia 33.073 Iraq 30.474 Cambodia 30.175 Kyrgyzstan 28.476 Laos 27.577 Armenia 26.078 Jamaica 25.879 Vietnam 24.580 Panama 23.481 Morocco 22.782 Myanmar 13.383 Belize 12.984 Libya 1.2

35© The Economist Intelligence Unit Limited 2018
The Global Illicit Trade Environment Index Overall results
Customs environment Customs environment continuedRANK COUNTRY SCORE/ 100 RANK COUNTRY SCORE/ 100
1 South Korea 92.22 Netherlands 90.23 United States 89.24 Ireland 88.55 Spain 88.16 Slovenia 87.97 Denmark 87.78 Estonia 87.59 Germany 87.410 Slovakia 87.311 New Zealand 87.112 Luxembourg 86.613 France 86.514 Turkey 86.515 Belgium 86.516 Finland 86.217 Taiwan 86.218 Latvia 85.919 Portugal 85.820 Japan 85.721 Italy 85.522 United Kingdom 85.423 Colombia 85.324 Austria 85.325 Sweden 85.126 Australia 84.927 Lithuania 84.928 Poland 84.629 Czech Republic 83.930 Argentina 83.731 Peru 83.632 Israel 83.333 Hungary 81.634 Cyprus 81.635 Malta 81.136 Panama 78.737 Greece 78.738 Croatia 78.339 Tunisia 78.340 Romania 78.041 Bulgaria 77.242 India 77.1
43 Mexico 76.944 China 76.745 Thailand 75.146 Morocco 74.347 Costa Rica 74.348 Serbia 74.249 Hong Kong 74.050 South Africa 72.651 Canada 72.252 United Arab Emirates 72.053 Chile 71.554 Vietnam 71.255 Russia 70.956 Singapore 69.857 Dominican Republic 66.358 Uruguay 64.359 Armenia 62.460 Philippines 61.461 Saudi Arabia 61.362 Guatemala 59.063 Brazil 58.864 Ecuador 55.565 Jamaica 55.166 Malaysia 53.567 Montenegro 51.868 Kazakhstan 48.069 Indonesia 46.970 Paraguay 46.271 Algeria 44.472 Pakistan 39.573 Belarus 38.674 Kyrgyzstan 35.975 Belize 35.776 Bosnia 35.777 Cambodia 34.878 Myanmar 33.879 Trinidad and Tobago 30.280 Ukraine 27.481 Venezuela 24.582 Laos 21.983 Iraq 15.884 Libya 13.1
36 © The Economist Intelligence Unit Limited 2018
The Global Illicit Trade Environment Index Overall results
27 http://www.oecd.org/gov/risk/oecdtaskforceoncounteringillicittrade.htm
Appendix 2: Index methodology
We constructed the Index in consultation with an expert advisory panel:
• Julio Bacio Terracino – deputy head of division at OECD Public Sector Integrity Division, Public Governance Directorate
• Michael Levi – professor of criminology at Cardiff University (UK)
• John M. Sellar – independent anti-smuggling, fraud, and organised crime consultant
This index follows the illicit trade framework from the OECD Task Force on Countering Illicit Trade (TF-CIT).27 According to the OECD, illicit trade refers to “trafficking and illegal trades in drugs, arms, persons, toxic waste, natural resources, counterfeit consumer goods, and wildlife.” Framework examples transcend industry and geography, including illicit trade’s negative impact on health, environment, human vulnerability, terrorism, and government.
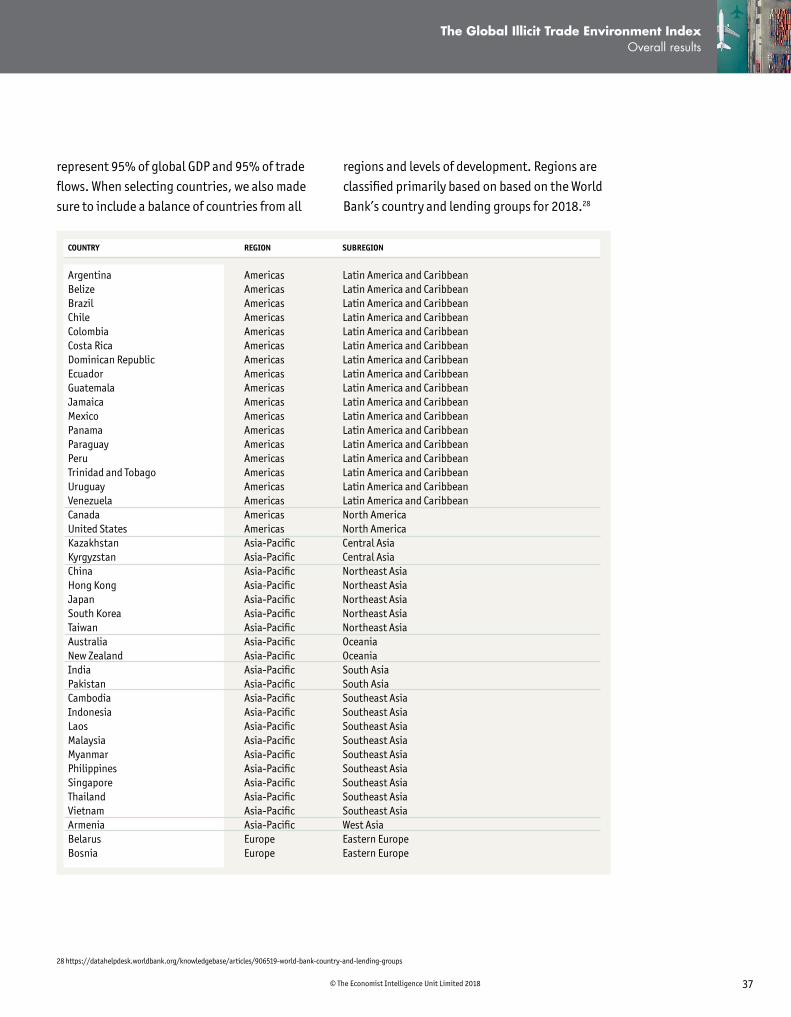
Country selection
We selected 84 countries to ensure a representative sample of countries in global supply chains, with particular consideration for illicit trade flows. The selected countries
The Global Illicit Trade Environment Index measures the extent to which a country enables illicit trade, either through action or inaction. Based on the findings from an extensive literature, and input from a panel of illicit trade experts, we built the Index around four main categories, each with four to seven indicators. Those categories are:
• Government policy measures the extent to which countries have comprehensive laws targeting illicit trade. The category focuses on legal authority at relevant stakeholders, and considers intellectual property protection, cyber security and money laundering laws.
• Transparency and trade measures the extent to which the government makes itself publicly accountable in its efforts to combat illicit trade. The category also considers best practices in trade governance.
• Supply and demand considers the institutional and economic levers that can stem or amplify illicit trade flows.
• Customs environment measures how effectively a country’s customs service manages its dual mandate of trade facilitation while preventing illicit trade.
37© The Economist Intelligence Unit Limited 2018
The Global Illicit Trade Environment Index Overall results
regions and levels of development. Regions are classified primarily based on based on the World Bank’s country and lending groups for 2018.28
represent 95% of global GDP and 95% of trade flows. When selecting countries, we also made sure to include a balance of countries from all
COUNTRY REGION SUBREGION
Argentina Americas Latin America and CaribbeanBelize Americas Latin America and CaribbeanBrazil Americas Latin America and CaribbeanChile Americas Latin America and CaribbeanColombia Americas Latin America and CaribbeanCosta Rica Americas Latin America and CaribbeanDominican Republic Americas Latin America and CaribbeanEcuador Americas Latin America and CaribbeanGuatemala Americas Latin America and CaribbeanJamaica Americas Latin America and CaribbeanMexico Americas Latin America and CaribbeanPanama Americas Latin America and CaribbeanParaguay Americas Latin America and CaribbeanPeru Americas Latin America and CaribbeanTrinidad and Tobago Americas Latin America and CaribbeanUruguay Americas Latin America and CaribbeanVenezuela Americas Latin America and CaribbeanCanada Americas North AmericaUnited States Americas North AmericaKazakhstan Asia-Pacific Central AsiaKyrgyzstan Asia-Pacific Central AsiaChina Asia-Pacific Northeast AsiaHong Kong Asia-Pacific Northeast AsiaJapan Asia-Pacific Northeast AsiaSouth Korea Asia-Pacific Northeast AsiaTaiwan Asia-Pacific Northeast AsiaAustralia Asia-Pacific OceaniaNew Zealand Asia-Pacific OceaniaIndia Asia-Pacific South AsiaPakistan Asia-Pacific South AsiaCambodia Asia-Pacific Southeast AsiaIndonesia Asia-Pacific Southeast AsiaLaos Asia-Pacific Southeast AsiaMalaysia Asia-Pacific Southeast AsiaMyanmar Asia-Pacific Southeast AsiaPhilippines Asia-Pacific Southeast AsiaSingapore Asia-Pacific Southeast AsiaThailand Asia-Pacific Southeast AsiaVietnam Asia-Pacific Southeast AsiaArmenia Asia-Pacific West AsiaBelarus Europe Eastern EuropeBosnia Europe Eastern Europe
28 https://datahelpdesk.worldbank.org/knowledgebase/articles/906519-world-bank-country-and-lending-groups

38 © The Economist Intelligence Unit Limited 2018
The Global Illicit Trade Environment Index Overall results
COUNTRY REGION SUBREGION
Bulgaria Europe Eastern EuropeCroatia Europe Eastern EuropeCzech Republic Europe Eastern EuropeEstonia Europe Eastern EuropeHungary Europe Eastern EuropeLatvia Europe Eastern EuropeLithuania Europe Eastern EuropeMontenegro Europe Eastern EuropePoland Europe Eastern EuropeRomania Europe Eastern EuropeRussia Europe Eastern EuropeSerbia Europe Eastern EuropeSlovakia Europe Eastern EuropeSlovenia Europe Eastern EuropeUkraine Europe Eastern EuropeDenmark Europe Northern EuropeFinland Europe Northern EuropeSweden Europe Northern EuropeAustria Europe Western EuropeBelgium Europe Western EuropeCyprus Europe Western EuropeFrance Europe Western EuropeGermany Europe Western EuropeGreece Europe Western EuropeIreland Europe Western EuropeItaly Europe Western EuropeLuxembourg Europe Western EuropeMalta Europe Western EuropeNetherlands Europe Western EuropePortugal Europe Western EuropeSpain Europe Western EuropeUnited Kingdom Europe Western EuropeAlgeria Middle East & Africa AfricaLibya Middle East & Africa AfricaMorocco Middle East & Africa AfricaSouth Africa Middle East & Africa AfricaTunisia Middle East & Africa AfricaIraq Middle East & Africa Middle EastIsrael Middle East & Africa Middle EastSaudi Arabia Middle East & Africa Middle EastTurkey Middle East & Africa Middle EastUnited Arab Emirates Middle East & Africa Middle East

39© The Economist Intelligence Unit Limited 2018
The Global Illicit Trade Environment Index Overall results
as well as to construct aggregate scores for each country–the project team normalised collected data on a scale of zero to 100 using a min-max calculation. While both scores and rankings are relative assessments, scores have more absolute weight as they better capture the distribution of actual outcomes.
Other indicators were normalised as a two, three or four-point rating. For example, “4.5) Customs recordal system” was normalised so that countries without such systems scored 0, countries with partially effective systems scored 50, and countries with effective systems scored 100.
While using normalised values (that is, a score of 0–100) allows for direct comparability with other normalised indicator scores in the 2018 Global Index, we cannot directly compare performance of countries in the 2016 APAC Index and this Index. This is because (a) normalised scores change based on performance of other countries in the sample, and (b) some indicator scoring frameworks and data sources have changed.
Indicators
Our research team collected data for the Index from December 2017 to February 2018. In addition to scores from The Economist Intelligence Unit, the Index uses publicly available data from international organisations, as well as qualitative analysis based on desk-based research and interviews with in-country experts.
Indicators by type
The Index includes 14 quantitative indicators and six qualitative indicators. There are four broad categories of indicators:
• EIU country scores. Our country analysts are expert economists who regularly track the business environment and operational risk for their country of study. Analysts score countries based on answers to a set of specific questions for each topic, ensuring comparability across all 84 countries.
• International institution scores. We draw on existing indices or benchmarking exercises from highly reputable international sources, such as the World Bank’s Logistics Performance Index and the Organization for Economic Cooperation and Development’s Trade Facilitation Indicators.
• Participation/availability scores. Countries receive scores for adoption of illicit trade-related international conventions and participation in trade services, such as Authorized Economic Operator (“trusted trade”) programmes.
• Survey of experts. Ten indicators are scored based on qualitative desk-based research and interviews with in-country illicit trade experts.
Indicator normalisation
In order to compare data points across countries–
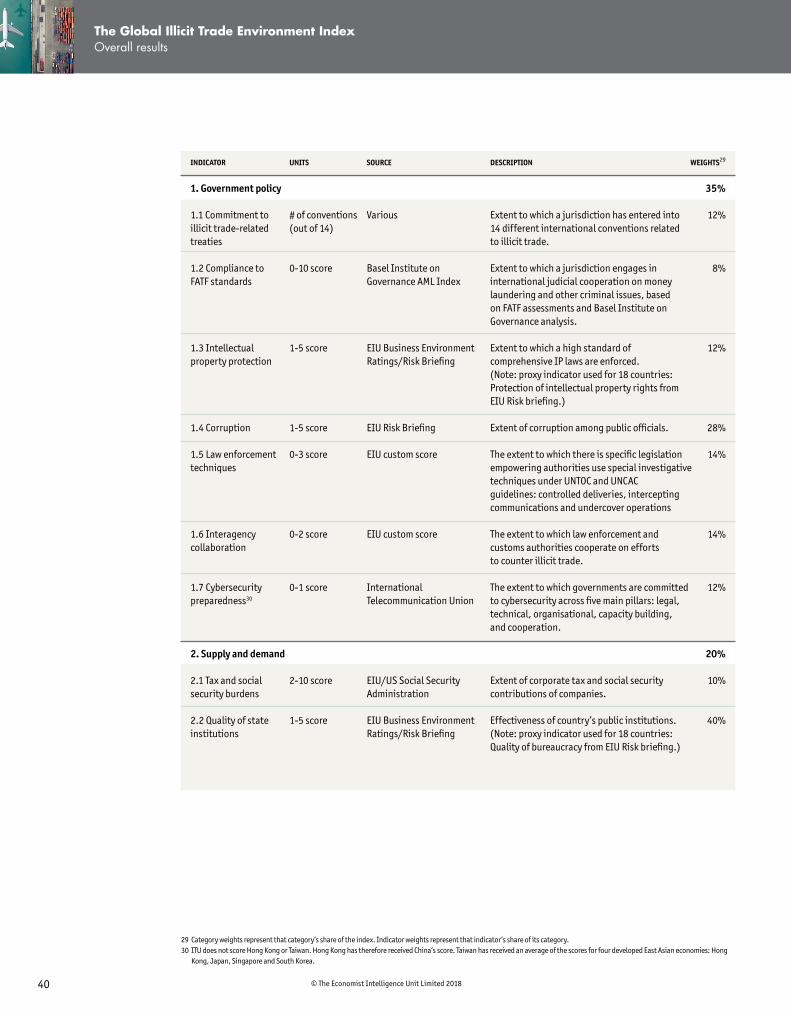
40 © The Economist Intelligence Unit Limited 2018
The Global Illicit Trade Environment Index Overall results
29 Category weights represent that category’s share of the index. Indicator weights represent that indicator’s share of its category.30 ITU does not score Hong Kong or Taiwan. Hong Kong has therefore received China’s score. Taiwan has received an average of the scores for four developed East Asian economies: Hong
Kong, Japan, Singapore and South Korea.
INDICATOR
1. Government policy
1.1 Commitment to illicit trade-related treaties
1.2 Compliance to FATF standards
1.3 Intellectual property protection
1.4 Corruption
1.5 Law enforcement techniques
1.6 Interagency collaboration
1.7 Cybersecurity preparedness30
2. Supply and demand 2.1 Tax and social security burdens
2.2 Quality of state institutions
UNITS
# of conventions (out of 14)
0-10 score
1-5 score
1-5 score
0-3 score
0-2 score
0-1 score
2-10 score
1-5 score
SOURCE
Various
Basel Institute on Governance AML Index
EIU Business Environment Ratings/Risk Briefing
EIU Risk Briefing
EIU custom score
EIU custom score
International Telecommunication Union
EIU/US Social Security Administration
EIU Business Environment Ratings/Risk Briefing
DESCRIPTION
Extent to which a jurisdiction has entered into 14 different international conventions related to illicit trade.
Extent to which a jurisdiction engages in international judicial cooperation on money laundering and other criminal issues, based on FATF assessments and Basel Institute on Governance analysis.
Extent to which a high standard of comprehensive IP laws are enforced. (Note: proxy indicator used for 18 countries: Protection of intellectual property rights from EIU Risk briefing.)
Extent of corruption among public officials.
The extent to which there is specific legislation empowering authorities use special investigative techniques under UNTOC and UNCAC guidelines: controlled deliveries, intercepting communications and undercover operations
The extent to which law enforcement and customs authorities cooperate on efforts to counter illicit trade.
The extent to which governments are committed to cybersecurity across five main pillars: legal, technical, organisational, capacity building, and cooperation.
Extent of corporate tax and social security contributions of companies.
Effectiveness of country’s public institutions. (Note: proxy indicator used for 18 countries: Quality of bureaucracy from EIU Risk briefing.)
WEIGHTS29
35%
12%
8%
12%
28%
14%
14%
12%
20%
10%
40%

41© The Economist Intelligence Unit Limited 2018
The Global Illicit Trade Environment Index Overall results
31 WEF does not rate five of the countries in the index: Belarus, Belize, Iraq, Libya and Myanmar. For these countries, EIU country analysts applied WEF’s scoring framework to assign a custom score.
32 World Bank LPI does not score Belize for Track and Trace Services. We have assigned Belize an average of Costa Rica, Guatemala and Panama.33 World Bank LPI does not score Armenia or Belize for physical inspection of shipments. For Armenia, we have assigned an average of CIS lower middle income economies (Georgia,
Kyrgyzstan, Moldova, Ukraine, and Uzbekistan). For Belize, we have assigned an average of Costa Rica, Guatemala and Panama.34 OECD’s Trade Facilitation Indicators do not include scores for Iraq or Libya. We have assigned both countries the lowest score based on our research.
2.3 Labour market regulations
2.4 Perception of organised crime31
3.1 Track and trace services32
3.2 Adoption of Annex D of Revised Kyoto Convention
3.3 FTZ governance
3.4 International reporting
4.1 Percentage of shipments physically inspected33
4.2 Customs clearance and inspection
4.3 Automation34
4.4 Authorized Economic Operator programme
4.5 Customs recordal system
3. Transparency and trade
4. Customs environment
1-5 score
0-7 score
0-5 score
0-4 score
0-2 score
0-6 score
% of shipments
# of hours
0-2 score
0-2 score
0-2 score
EIU Business Environment Ratings/Risk Briefing
World Economic Forum/EIU
World Bank LPI
World Customs Organization
EIU custom score
EIU custom score
World Bank LPI
World Bank Doing Business
OECD Trade Facilitation Indicators
World Customs Organisation
EIU custom score
Our restrictiveness of labour laws rating scores countries between 1 and 5 on the degree of restrictiveness on hiring and firing, with 1 being “very high” and 5 being “very low”. (Note: proxy indicator used for 18 countries: Restrictiveness of labour laws from EIU Risk briefing.)
Perception of the extent to which organised crime (mafia-oriented racketeering, extortion) imposes costs on business.
Ability to track and trace consignments.
Adoption of Annex D of Revised Kyoto Convention.
Extent to which countries establish customs offices and authorise inspections of goods in transit in all FTZs.
The extent to which the government reports on its efforts to counter human trafficking, IP infringement, and drug trafficking.
Percentage of shipments physically inspected.
Number of hours, on average, for customs clearance and inspection.
Assessment of electronic exchange of data, automated border procedures, and use of risk management.
Assessment of operational or planned AEO programmes.
Assessment of existence and effectiveness of customs recordal systems.
15%
35%
20%
35%
25%
25%
15%
25%
10%
10%
32%
28%
20%

42 © The Economist Intelligence Unit Limited 2018
The Global Illicit Trade Environment Index Overall results
TRACIT project sponsors and contributors
• Marazzi and Associati
• Naftna Industrija Srbije (NIS)
• National Petrochemical Industrial Company (Saudi Arabia)
• Pernod Ricard
• Philip Morris International
• Programme for the Endorsement of Forest Certification (PEFC)
• Procter & Gamble
• Richemont
• Unilever
• Universal Music
• AmCham Costa Rica
• Association of Industries of the Dominican Republic (AIRD)
• Authentix
• Brand Protection Group (Brazil)
• British American Tobacco
• Business Council for International Understanding
• Coca Cola Serbia Montenegro
• Crime Stoppers International
• Diageo
• Eurocham Myanmar
• Ideas Matter
• Japan Tobacco International
Companies and relevant organisations have helped us develop this work by sponsoring our research and collaboration with the EIU.

LONDON 20 Cabot Square London E14 4QW United Kingdom Tel: (44.20) 7576 8000 Fax: (44.20) 7576 8500 E-mail: [email protected]
NEW YORK 750 Third Avenue 5th Floor New York, NY 10017, US Tel: (1.212) 554 0600 Fax: (1.212) 586 0248 E-mail: [email protected] HONG KONG 1301 Cityplaza Four 12 Taikoo Wan Rd Taikoo Shing Hong Kong Tel: (852) 2585 3888 Fax: (852) 2802 7638 E-mail: [email protected]
SINGAPORE 8 Cross Street #23-01 PWC Building Singapore 048424 Tel: (65) 6534 5177 Fax: (65) 6428 2630 E-mail: [email protected]
GENEVA Rue de l’Athénée 32 1206 Geneva Switzerland Tel: (41) 22 566 2470 Fax: (41) 22 346 9347 E-mail: [email protected]
Whilst every effort has been taken to verify the accuracy of this information, neither The Economist Intelligence Unit Ltd. nor the sponsor of this report can accept any responsibility or liability for reliance by any person on this report or any of the information, opinions or conclusions set out herein.