Embed Size (px)
Citation preview

INTERNATIONAL TELECOMMUNICATION UNION
The Future of Voice Document: FoV/02 January 2007
New Initiatives Programme
The Future of Communications in Next Generation Networks
THE UNSUSTAINABILITY OF ACCESS COMPETITION
Copyright © ITU 15-16 January 2007

II
Acknowledgements This background paper was prepared by James Alleman and Paul Rappoport ([email protected] and [email protected]); University of Colorado – Boulder and CITI, Columbia University and Temple University and CITI, Columbia University, United States of America; respectively, to be presented for comments at the ITU New Initiatives Programme workshop on “The Future of Voice” to be held on 15-16 January 3007 at the ITU Headquarters, Geneva. The opinions expressed in this study are those of the authors and do not necessarily reflect the views of the International Telecommunication Union, its membership, or the Governments.
This paper, alongside other background material relevant to the debate on the future of voice and prepared under ITU New Initiatives Programme, can be found at http://www.itu.int/spu/voice. The Future of Voice project is managed by Jaroslaw Ponder <[email protected]>, under the direction of Dr. Tim Kelly <[email protected]>.
I
TABLE OF CONTENTS page
1 Chapter One: Overview................................................................................................................ 1 1.1 Convergence ............................................................................................................ 1 1.2 Consumer focus ....................................................................................................... 1 1.3 Organization of paper .............................................................................................. 1
2 Chapter 2: Future demand and the market for communications .................................................. 2 2.1 The Derived Demand for Communications............................................................. 2 2.2 Expenditure Share.................................................................................................... 2 2.3 International Comparisons....................................................................................... 4 2.4 Music Downloads .................................................................................................... 5 2.5 Best Practice VoIP................................................................................................... 6 2.6 IPTV ........................................................................................................................ 7 2.7 Demand.................................................................................................................... 8 2.8 Substitution.............................................................................................................. 9 2.9 VoIP....................................................................................................................... 10 2.10 Mobile Telephony.................................................................................................. 10 2.11 Competition ........................................................................................................... 10 2.12 International Comparisons..................................................................................... 11 2.13 Elasticities and Regulation .................................................................................... 12
3 Chapter 3: Policy Framework: Competition and Regulation .................................................... 13 3.1 The last mile/kilometer issue ................................................................................. 14 3.2 A note on investment. ............................................................................................ 14 3.3 The last kilometer issue – reprise .......................................................................... 15 3.4 No Competition in Access ..................................................................................... 16 3.5 Sunk Costs ............................................................................................................. 17 3.6 Regulatory Distortion ............................................................................................ 17 3.7 Intermediate/Interconnection: Pricing .................................................................. 18
4 Chapter 4: Conclusion/Future Research/ Recommendations ..................................................... 18 4.1 The Policymakers’ Dilemma ................................................................................. 18 4.2 Conclusion ............................................................................................................. 19
5 References ................................................................................................................................... 19
TABLES page Table 2.1: Expenditure Shares on Communications ................................................................................5 Table 2.2: ICT Expenditure Share 2003 – 2004 for Selected Countries ..................................................5 Table 2.3: Demand for Triple-Play Services ............................................................................................9 Table 2.4: U.S. E-Commerce (Sales and in millions of USD) ...............................................................10 Table 2.5: Price of Broadband Service...................................................................................................11 Table 2.6: Personal Computers and Broadband Access .........................................................................12 Table 3.1: Wireless Penetration..............................................................................................................16 Table 3.2: VoIP Subscriber in Europe (end of 2005) .............................................................................17
II
FIGURES
page
Figure 2.1: Share of Expenditures for Telecom (US Housholds)............................................................. 3 Figure 2.2: Expenditure Share of Local, LD and Wireless Communications (US Households).............. 3 Figure 2.3: Entertainment Share (United States Households) .................................................................. 4 Figure 2.4: Internet Share of Music Channels .......................................................................................... 6 Figure 2.5: IPTV Subscribers ................................................................................................................. 11
1
1 CHAPTER ONE: OVERVIEW The demand for net generation networks (NGN) for communications has mostly focused on the trend in technology and the efficiencies of moving to networks driven by IP protocols. In this paper, recognizing that communications is a derived demand, we look at the demand for telecommunications services and then overlay these forecasts on the existing information and communications technology (ICT) infrastructure.
We define communications in the broadest sense; the demand is derived and consumers and businesses are mostly indifferent to the technology so long as it functions. From this perspective, the suppliers of communication services, the telephone companies, cable companies, broadband providers, wireless providers, and more recently the video providers care about delivery protocols and investment requirements since these have a direct impact on the profits of the companies.
If the platform is indifferent, then what drives consumer choice is the importance of the availability and characteristics of the alternative communications services, along with price and quality constraints. The regulator, on the other hand, is influenced by both the demand and supply-side considerations. Approaching the development of NGN from the demand-side allows us to add to the assessment of ICT and to consider additional directions or insights that might assist regulators and policy makers. The hope is that they will be better able to evaluate policy options in a broader, gestalt manner; separate from the pleading of the vested interests of a specific sector or technology.
The paper will also address pricing issues associated with bundling of services (triple- and quadruple-play) and the large sunk costs associated with these infrastructure investments.
1.1 Convergence The issue of convergence in the telecommunications industry has been discussed for sometime. Many definition exist (Bauer 2006), but for our purposes we will not deal with the technology or the protocols in general except to note the following: Future communication networks will be radically different from those existing today. They will be broadband platforms on which applications will provide services to consumers and businesses. These networks of networks will look very different from today’s service specific platforms and, hence, the regulatory and policy issues will be complex and challenging. Unresolved questions include: (1) secure interoperability between and among networks, (2) the pricing of both the wholesale and retail services, (3) degree of competition, (4) the level and quality of innovation and investment, (5) open or closed architecture, and many more that we cannot even anticipate. Approaching the NGN from the demand side does not eliminate these issues, but, we feel, provides clearer insight how to address many of these issues.
1.2 Consumer focus We focus on the consumers rather than the technologies. We first note that what consumers demand is for communications: one-way (video, traffic reports, location, etc,), two-way (traditional voice, e-mail, etc.), symmetrical (traditional voice calls, e-mails, etc) or asymmetrical (file downloads, movies, etc.). The communications may be fixed, mobile, interactive, or unidirectional. With the technology and the move to IP protocol, all of these features can be handled in a few devices and networks – maybe only one. The full integration and convergence of the networks is only beginning to emerge. A recent discussion in Businessweek (2006) underscores this rush to convergence: “The future of wireless is to become the focal point for the fusion of consumer electronics, entertainment and telecommunications. The way the complex systems of technology will deliver the future will be a shift in both technology and the way it is applied.”
1.3 Organization of paper This paper is organized as follows: The next section describes and briefly characterizes the demand for information and communications technology (ICT) services, which as indicated above, we treat as a derived demand. The paper provides a backdrop for assessing the forecast of market trends, and their implications for the regulator. The third section briefly addresses some of the policy issues to place them in the context
2
of the pricing issues of a converged ICT sector. We develop a guideline for regulators and policy makers. The role of sunk costs is also addressed in this section. The final section concludes with recommendations and suggestions for future research.
2 CHAPTER 2: FUTURE DEMAND AND THE MARKET FOR COMMUNICATIONS
2.1 The Derived Demand for Communications This section looks at the derived demand for communication services and poses the following question: is there a point where the growth in ICT products and services runs into a wall – that wall being an income constraint. If there is a budget constraint, then real revenue growth in ICT services can only occur when (1) prices (or costs) fall or when (2) there is an increase in the percentage of a household’s income devoted to these services. Real revenue growth is not the same thing as product and service substitution such as the substitution of MP3 music files for music CDs. Clearly the magnitude of own and cross-price elasticities need to be considered when assessing the future of ICT. This point of view stands in stark contrast to those who see demand ever increasing due to the convergence of communication, entertainment and data services. If there is a binding budget constraint, the opportunities for revenue growth to pay for deployment of advanced networks are likely to depend less on consumer demand and more on regulatory edict.
Over the last few years there has clearly been an explosion of wireless subscribers. There are now more wireless subscribers than landline subscribers. There has been exponential growth in the internet both in terms of users and usage. These trends have led to optimistic extrapolations of increased demand for services that can be provided over multiple platforms. The technology required to deliver these services is available. But if the demand for these services is a derived demand, then the factors that stimulate demand require scrutiny. Foremost among these is a consumer’s ability and willingness to pay for these services. In the end, it comes down to price. Not simply the price of these new services, but that price relative to the price of food, health care, shelter and transportation.
This section is organized as follows. First we examine the share of income devoted to communications and entertainment. We then examine the evidence on the demand for advanced products and services. We then focus on the competitive environment. Finally, we suggest policy implications.
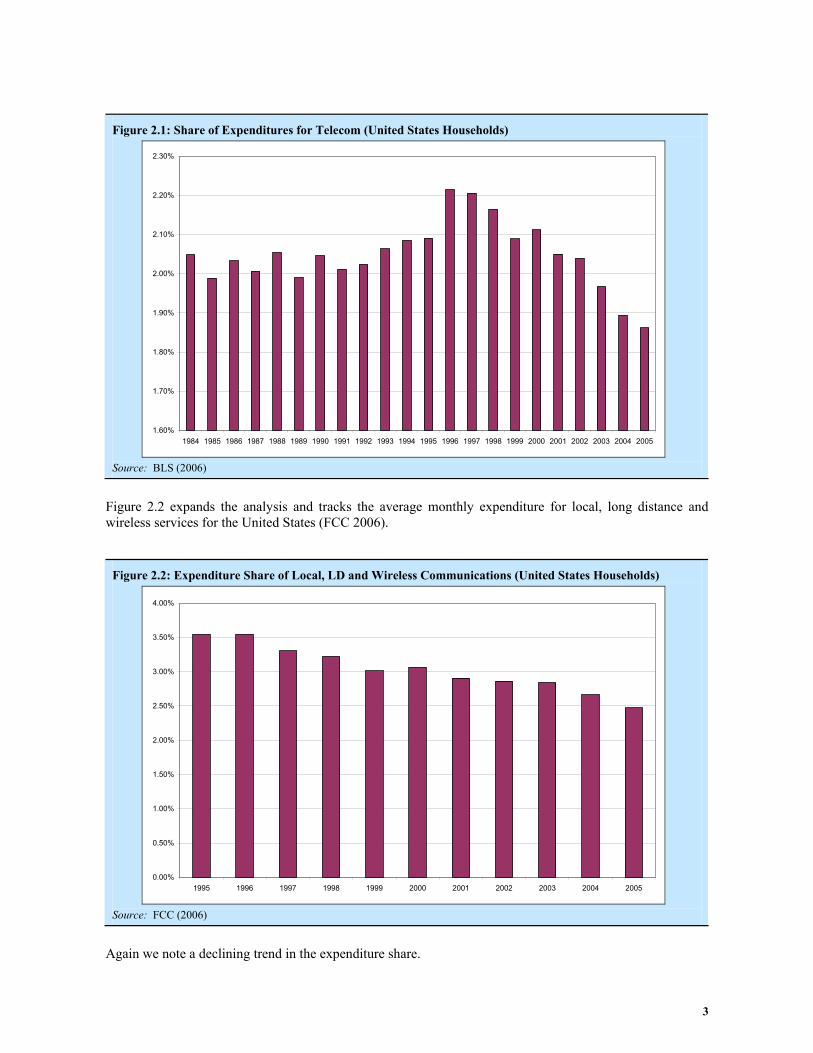
2.2 Expenditure Share To put this discussion in perspective, consider the share of income spent on telecommunications. Figure 2.1 displays the share of expenditure devoted to traditional telecommunications from 1981 through 2005 for the United States1. The data suggests a declining share after 2000. This decline appears to be a function of lower long distance prices and declines in second line penetrations.
1 Includes local and long distance expenditures only. Figures derived from BLS (2006) Consumer Expenditure data
3
Figure 2.1: Share of Expenditures for Telecom (United States Households)
1.60%
1.70%
1.80%
1.90%
2.00%
2.10%
2.20%
2.30%
1984 1985 1986 1987 1988 1989 1990 1991 1992 1993 1994 1995 1996 1997 1998 1999 2000 2001 2002 2003 2004 2005
Source: BLS (2006)
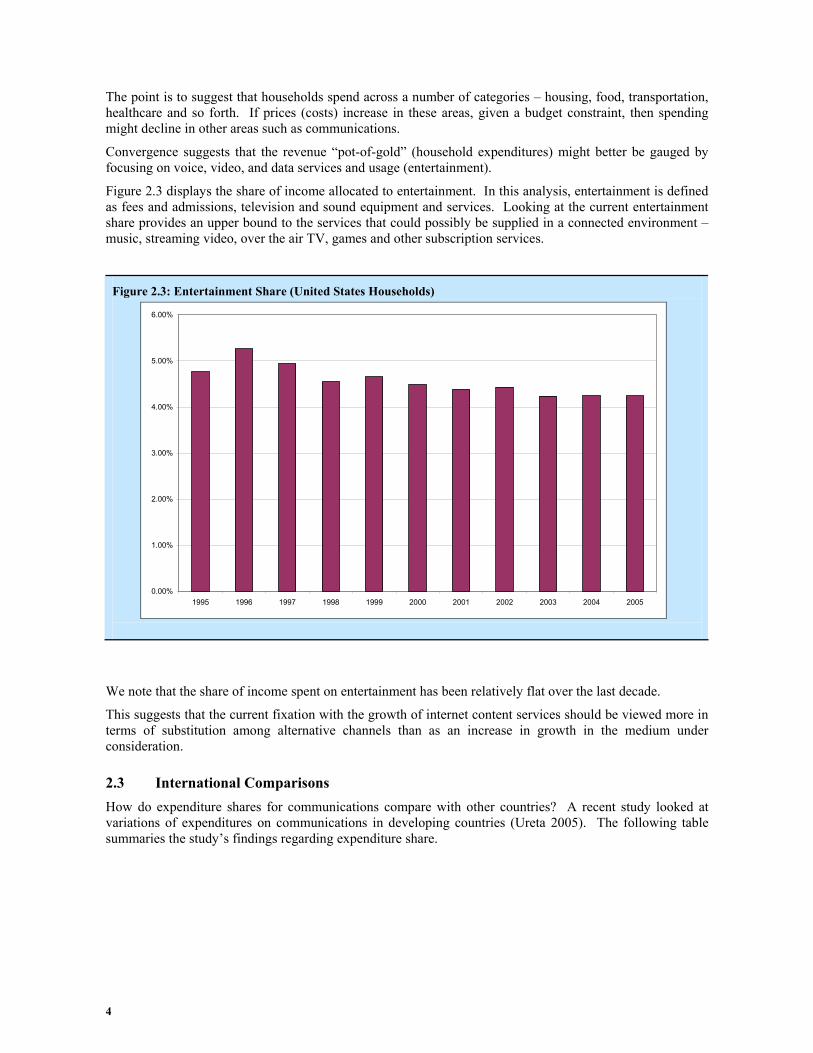
Figure 2.2 expands the analysis and tracks the average monthly expenditure for local, long distance and wireless services for the United States (FCC 2006).
Figure 2.2: Expenditure Share of Local, LD and Wireless Communications (United States Households)
0.00%
0.50%
1.00%
1.50%
2.00%
2.50%
3.00%
3.50%
4.00%
1995 1996 1997 1998 1999 2000 2001 2002 2003 2004 2005
Source: FCC (2006)
Again we note a declining trend in the expenditure share.
4
The point is to suggest that households spend across a number of categories – housing, food, transportation, healthcare and so forth. If prices (costs) increase in these areas, given a budget constraint, then spending might decline in other areas such as communications.
Convergence suggests that the revenue “pot-of-gold” (household expenditures) might better be gauged by focusing on voice, video, and data services and usage (entertainment).
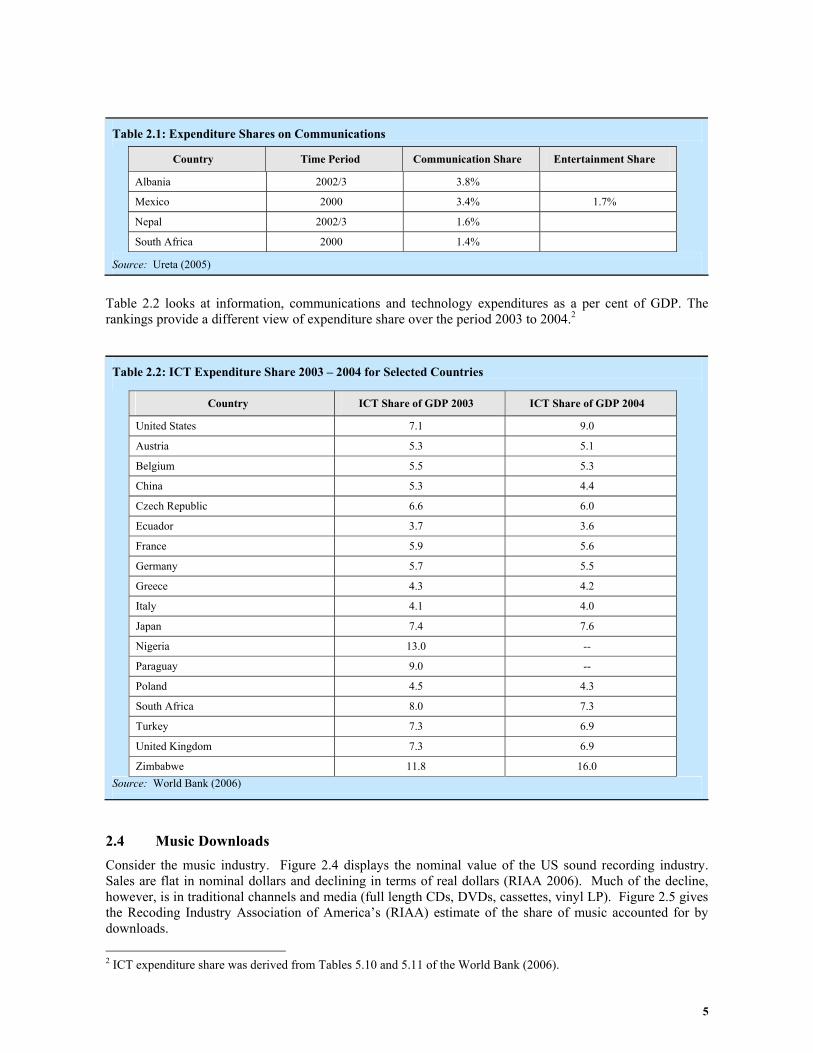
Figure 2.3 displays the share of income allocated to entertainment. In this analysis, entertainment is defined as fees and admissions, television and sound equipment and services. Looking at the current entertainment share provides an upper bound to the services that could possibly be supplied in a connected environment – music, streaming video, over the air TV, games and other subscription services.
Figure 2.3: Entertainment Share (United States Households)
0.00%
1.00%
2.00%
3.00%
4.00%
5.00%
6.00%
1995 1996 1997 1998 1999 2000 2001 2002 2003 2004 2005
We note that the share of income spent on entertainment has been relatively flat over the last decade.
This suggests that the current fixation with the growth of internet content services should be viewed more in terms of substitution among alternative channels than as an increase in growth in the medium under consideration.
2.3 International Comparisons How do expenditure shares for communications compare with other countries? A recent study looked at variations of expenditures on communications in developing countries (Ureta 2005). The following table summaries the study’s findings regarding expenditure share.
5
Table 2.1: Expenditure Shares on Communications
Country Time Period Communication Share Entertainment Share
Albania 2002/3 3.8%
Mexico 2000 3.4% 1.7%
Nepal 2002/3 1.6%
South Africa 2000 1.4%
Source: Ureta (2005)
Table 2.2 looks at information, communications and technology expenditures as a per cent of GDP. The rankings provide a different view of expenditure share over the period 2003 to 2004.2
Table 2.2: ICT Expenditure Share 2003 – 2004 for Selected Countries
Country ICT Share of GDP 2003 ICT Share of GDP 2004
United States 7.1 9.0
Austria 5.3 5.1
Belgium 5.5 5.3
China 5.3 4.4
Czech Republic 6.6 6.0
Ecuador 3.7 3.6
France 5.9 5.6
Germany 5.7 5.5
Greece 4.3 4.2
Italy 4.1 4.0
Japan 7.4 7.6
Nigeria 13.0 --
Paraguay 9.0 --
Poland 4.5 4.3
South Africa 8.0 7.3
Turkey 7.3 6.9
United Kingdom 7.3 6.9
Zimbabwe 11.8 16.0 Source: World Bank (2006)
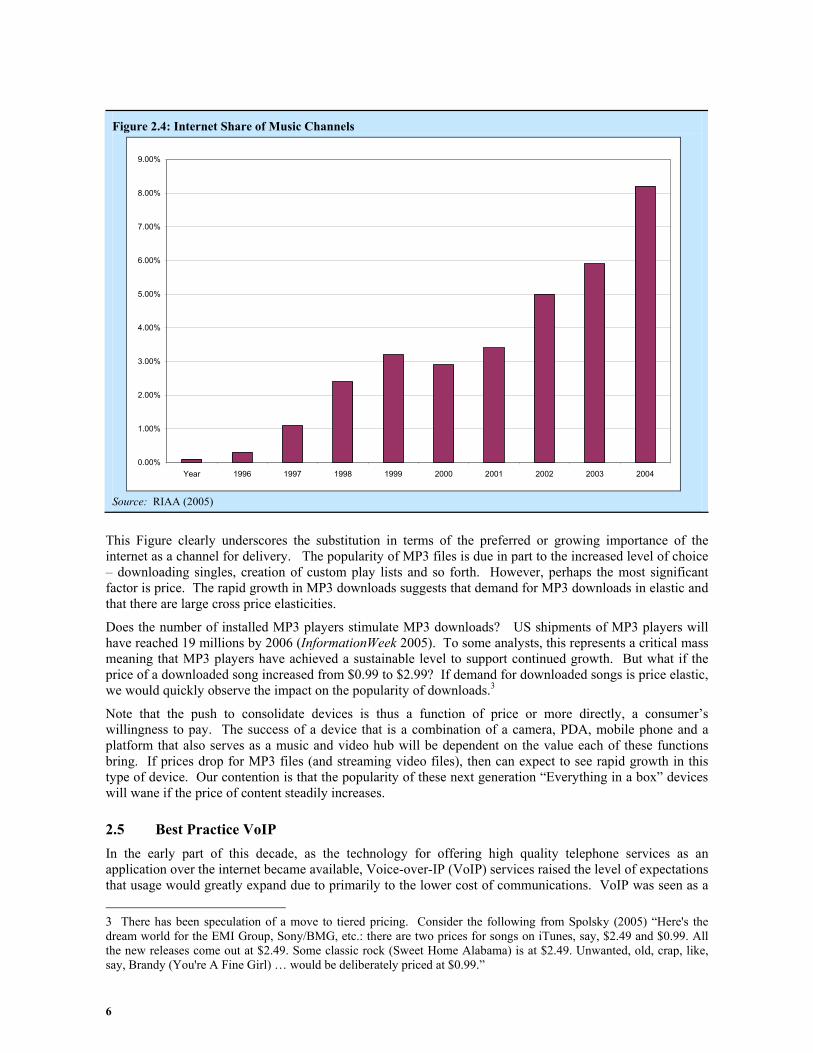
2.4 Music Downloads Consider the music industry. Figure 2.4 displays the nominal value of the US sound recording industry. Sales are flat in nominal dollars and declining in terms of real dollars (RIAA 2006). Much of the decline, however, is in traditional channels and media (full length CDs, DVDs, cassettes, vinyl LP). Figure 2.5 gives the Recoding Industry Association of America’s (RIAA) estimate of the share of music accounted for by downloads. 2 ICT expenditure share was derived from Tables 5.10 and 5.11 of the World Bank (2006).
6
Figure 2.4: Internet Share of Music Channels
0.00%
1.00%
2.00%
3.00%
4.00%
5.00%
6.00%
7.00%
8.00%
9.00%
Year 1996 1997 1998 1999 2000 2001 2002 2003 2004
Source: RIAA (2005)
This Figure clearly underscores the substitution in terms of the preferred or growing importance of the internet as a channel for delivery. The popularity of MP3 files is due in part to the increased level of choice – downloading singles, creation of custom play lists and so forth. However, perhaps the most significant factor is price. The rapid growth in MP3 downloads suggests that demand for MP3 downloads in elastic and that there are large cross price elasticities.
Does the number of installed MP3 players stimulate MP3 downloads? US shipments of MP3 players will have reached 19 millions by 2006 (InformationWeek 2005). To some analysts, this represents a critical mass meaning that MP3 players have achieved a sustainable level to support continued growth. But what if the price of a downloaded song increased from $0.99 to $2.99? If demand for downloaded songs is price elastic, we would quickly observe the impact on the popularity of downloads.3
Note that the push to consolidate devices is thus a function of price or more directly, a consumer’s willingness to pay. The success of a device that is a combination of a camera, PDA, mobile phone and a platform that also serves as a music and video hub will be dependent on the value each of these functions bring. If prices drop for MP3 files (and streaming video files), then can expect to see rapid growth in this type of device. Our contention is that the popularity of these next generation “Everything in a box” devices will wane if the price of content steadily increases.
2.5 Best Practice VoIP In the early part of this decade, as the technology for offering high quality telephone services as an application over the internet became available, Voice-over-IP (VoIP) services raised the level of expectations that usage would greatly expand due to primarily to the lower cost of communications. VoIP was seen as a 3 There has been speculation of a move to tiered pricing. Consider the following from Spolsky (2005) “Here's the dream world for the EMI Group, Sony/BMG, etc.: there are two prices for songs on iTunes, say, $2.49 and $0.99. All the new releases come out at $2.49. Some classic rock (Sweet Home Alabama) is at $2.49. Unwanted, old, crap, like, say, Brandy (You're A Fine Girl) … would be deliberately priced at $0.99.”
7
threat to the incumbent telephone operators. However, none of the pure VoIP companies has yet to turn a profit. The expected savings disappeared as long distance rates declined and as incumbent phone companies countered with flat rate unlimited calling plans. Quality of service continues to plague best practice VoIP providers.
The market for best practice4 VoIP in the United States was over estimated.5 In a 2006 Computerworld survey, “… respondents ranked VoIP third among the technologies that didn’t live up to their expectations in 2005”. (Computer World 2006)
Whereas best practice VoIP providers have not seen significant growth in subscribers, Cable VoIP growth has been substantial and has accounted for the continued decline in overall access lines – along with mobile services. In this case, the subscriber, in most cases, already has the broadband service and the VoIP is an inexpensive add on or as part of a triple play – cable television, broadband data, and VoIP services – moving from the incumbernt telephone company to the cable provider There are significant regulatory issues associated with VoIP. The most significant debate centers on the notion of ‘net neutrality’. Net neutrality embodies the notion that broadband customers should be able to subscribe to any service with no intervention by broadband providers. That is to say that customers would not have to pay more for higher quality of service (higher priority, faster service) when they visit content-rich web site such as Movie Link or Google. Without net neutrality, users who want higher priority delivery of packets would pay a premium. Facility-based providers (telephone companies and cable companies) would have a real competitive advantage over best practice VoIP providers such as Vonage since they could require additional fees from these providers. Indeed, in the United States, some telephone companies did not allowed VoIP calls on their network, although they later reversed this position under regulatoy pressusre. Pricing of priority services is just another possibility of limiting VoIP takeup.
With respect to pricing of VoIP services, the telephone companies have been lowering their flat rate usage packages so that the differential between their prices and the prices of companies such as Vonage have diminished. When prices decline and demand is inelastic, overall revenue declines. At current prices of $25, the demand for best practice VoIP is inelastic.6
2.6 IPTV The term IPTV covers a number of services, from streaming video to your multimedia personal computer to the provision of video services over fiber to the household. As with VoIP, IPTV was seen as an application that was expected to stimulate demand for bandwidth, and thus the demand for increased investment in networks and infrastructure.
For the most part in the US, IPTV is seen as the provision of video services by Verizon through its FIOS service. FIOS provides the ability for Verizon to offer voice, data and video services. The market for FIOS services is not surprisingly a function of willingness and ability to pay. An open question is the reasonableness of the assumptions underlying Verizon’s push into fiber. According to some analysts Verizon’s estimates of customers signing on to their services is overly optimistic. The reason – as with many services in the ICT space, competition tends to depress prices and lower prices lead to lower than expected revenues.7
These net generation applications provide some useful insights into the nature of demand. First, competition tends to lower prices. Second, in the case of IPTV, payback periods for the investment in infrastructure are longer than assumed. “Past a certain point, the ‘build it and they will come’ strategy is not acceptable without subscribers paying a monthly fee that supports further investment in the outside plant.” Broadbandproerties.com (2006, p. 56) The danger for the telephone companies such as Verizon is the cable
4 Best practice refers to services that have no quality of service guarantees. These are services provided over the public internet. These services are distinguished from IP-based voice services offered by cable companies over their private networks. 5 IDC (2006) forecast saw VoIP growing to 44 million households by 2010. 6 See Rappoport, Taylor, Kridel and Alleman (2004), Table 1. 7 See for example the financial assessment in the September 2006 issue of Broadband Properties (2006).
8
company’s ability to readily cut prices.8 Third, in the VoIP market, facility-based players have significant technical and market advantages over non-facility based providers such as Vonage.
For these and other next generation services, price matters.
2.7 Demand How do these charts compare with forecasts that suggest increased demand for voice, video and data services and hence the increased demand for products that enable on to use these services anywhere and anytime?
We offer these observations:
First, the demand for advanced services coupled with broadband access is currently elastic. We should expect downward prices as these markets become more competitive. At some point demand will become inelastic with a concomitant decline in revenue.
Second, there appears to be a movement towards bundling for price rather than bundling for quality thus reinforcing this downward pressure on price.9
Estimates of demand have been seriously overestimated.
What is the range of demand elasticities? • Estimated elasticities for VoIP services are -1.0 at a price of $30 and -0.7 at a price of $25. • For local and long distance services demand elasticities have been estimated in the range of -.2 to -
.55.4 • Estimated elasticities for broadband access range from -0.8 to -1.5 (Rappoport et al. 2003). • For mobile internet access estimated elasticities range from -1.0 and -2.0 (Rappoport et al.
2004). • For IPTV, estimated elasticities are -1.02 for video only (Rappoport et al. 2004). Elasticities for
IPTV seen as the triple-play are displayed in Table 2. 1 below.
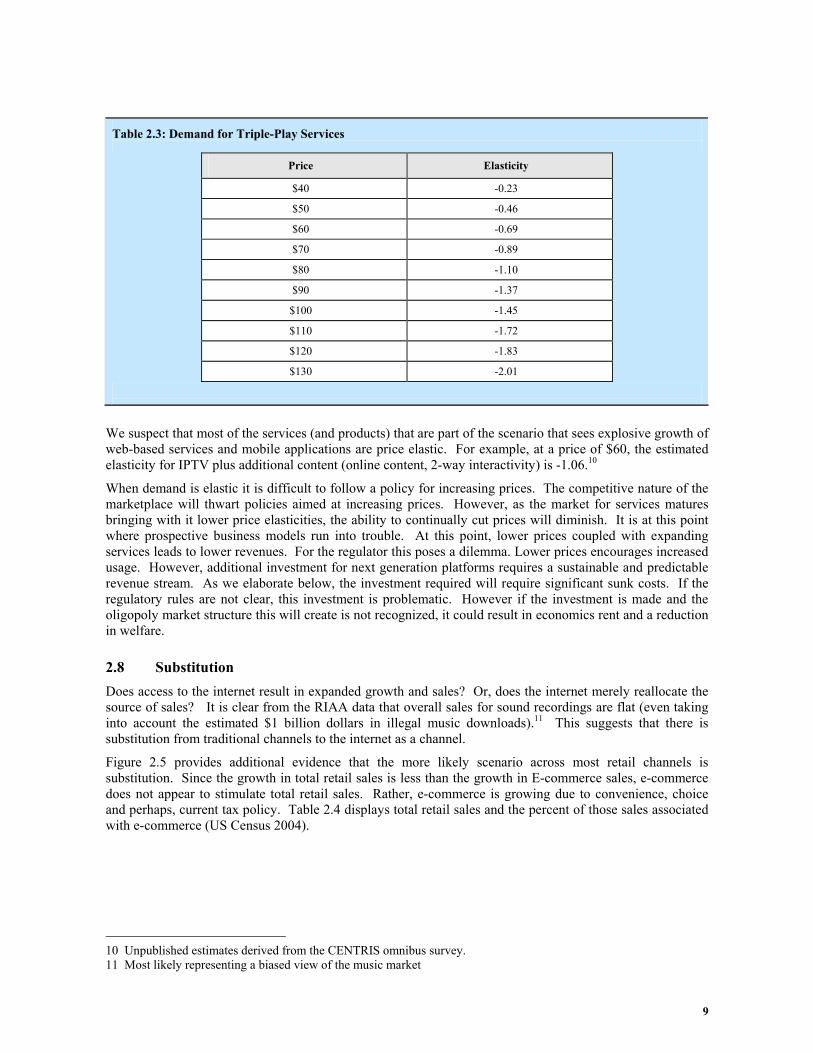
The following table displays the estimated elasticity for triple-play services at various prices (Rappoport et al. 2006). The table underscores the notion that the demand for the triple-play is clearly a function of a household’s willingness to pay (price). The price elasticity of demand for a triple-play bundle is around -1.1 at a price of $80 (Rappoport et al. 2004).
8 Case in point is Cox Communication’s triple-play offer in Omaha of $69 per month for voice, video and data. 9 Bundling for price implies that the price of the bundle is less that the sum of the individual components of the bundle. If the willingness-to-pay for the bundle is greater than the individual prices of the components, then the bundle “adds” value – or quality.
9
Table 2.3: Demand for Triple-Play Services
Price Elasticity
$40 -0.23
$50 -0.46
$60 -0.69
$70 -0.89
$80 -1.10
$90 -1.37
$100 -1.45
$110 -1.72
$120 -1.83
$130 -2.01
We suspect that most of the services (and products) that are part of the scenario that sees explosive growth of web-based services and mobile applications are price elastic. For example, at a price of $60, the estimated elasticity for IPTV plus additional content (online content, 2-way interactivity) is -1.06.10
When demand is elastic it is difficult to follow a policy for increasing prices. The competitive nature of the marketplace will thwart policies aimed at increasing prices. However, as the market for services matures bringing with it lower price elasticities, the ability to continually cut prices will diminish. It is at this point where prospective business models run into trouble. At this point, lower prices coupled with expanding services leads to lower revenues. For the regulator this poses a dilemma. Lower prices encourages increased usage. However, additional investment for next generation platforms requires a sustainable and predictable revenue stream. As we elaborate below, the investment required will require significant sunk costs. If the regulatory rules are not clear, this investment is problematic. However if the investment is made and the oligopoly market structure this will create is not recognized, it could result in economics rent and a reduction in welfare.
2.8 Substitution Does access to the internet result in expanded growth and sales? Or, does the internet merely reallocate the source of sales? It is clear from the RIAA data that overall sales for sound recordings are flat (even taking into account the estimated $1 billion dollars in illegal music downloads).11 This suggests that there is substitution from traditional channels to the internet as a channel.
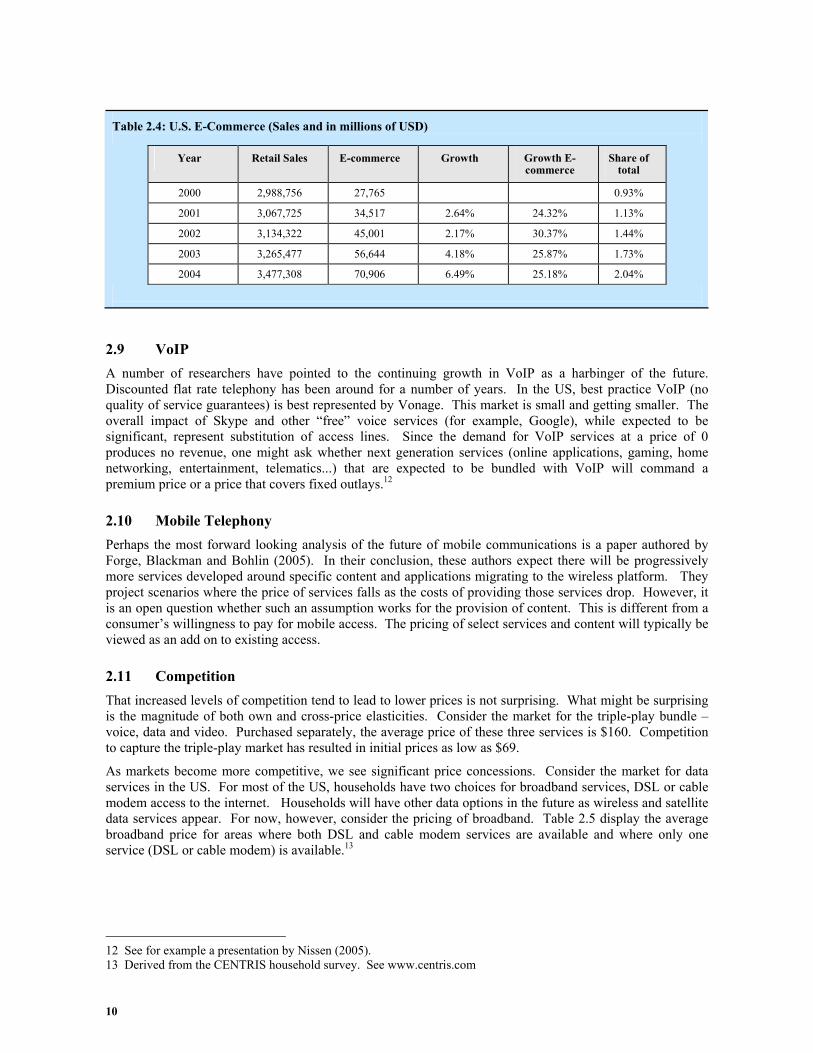
Figure 2.5 provides additional evidence that the more likely scenario across most retail channels is substitution. Since the growth in total retail sales is less than the growth in E-commerce sales, e-commerce does not appear to stimulate total retail sales. Rather, e-commerce is growing due to convenience, choice and perhaps, current tax policy. Table 2.4 displays total retail sales and the percent of those sales associated with e-commerce (US Census 2004).
10 Unpublished estimates derived from the CENTRIS omnibus survey. 11 Most likely representing a biased view of the music market
10
Table 2.4: U.S. E-Commerce (Sales and in millions of USD)
Year Retail Sales E-commerce Growth Growth E-commerce
Share of total
2000 2,988,756 27,765 0.93%
2001 3,067,725 34,517 2.64% 24.32% 1.13%
2002 3,134,322 45,001 2.17% 30.37% 1.44%
2003 3,265,477 56,644 4.18% 25.87% 1.73%
2004 3,477,308 70,906 6.49% 25.18% 2.04%
2.9 VoIP A number of researchers have pointed to the continuing growth in VoIP as a harbinger of the future. Discounted flat rate telephony has been around for a number of years. In the US, best practice VoIP (no quality of service guarantees) is best represented by Vonage. This market is small and getting smaller. The overall impact of Skype and other “free” voice services (for example, Google), while expected to be significant, represent substitution of access lines. Since the demand for VoIP services at a price of 0 produces no revenue, one might ask whether next generation services (online applications, gaming, home networking, entertainment, telematics...) that are expected to be bundled with VoIP will command a premium price or a price that covers fixed outlays.12
2.10 Mobile Telephony Perhaps the most forward looking analysis of the future of mobile communications is a paper authored by Forge, Blackman and Bohlin (2005). In their conclusion, these authors expect there will be progressively more services developed around specific content and applications migrating to the wireless platform. They project scenarios where the price of services falls as the costs of providing those services drop. However, it is an open question whether such an assumption works for the provision of content. This is different from a consumer’s willingness to pay for mobile access. The pricing of select services and content will typically be viewed as an add on to existing access.
2.11 Competition That increased levels of competition tend to lead to lower prices is not surprising. What might be surprising is the magnitude of both own and cross-price elasticities. Consider the market for the triple-play bundle – voice, data and video. Purchased separately, the average price of these three services is $160. Competition to capture the triple-play market has resulted in initial prices as low as $69.
As markets become more competitive, we see significant price concessions. Consider the market for data services in the US. For most of the US, households have two choices for broadband services, DSL or cable modem access to the internet. Households will have other data options in the future as wireless and satellite data services appear. For now, however, consider the pricing of broadband. Table 2.5 display the average broadband price for areas where both DSL and cable modem services are available and where only one service (DSL or cable modem) is available.13
12 See for example a presentation by Nissen (2005). 13 Derived from the CENTRIS household survey. See www.centris.com
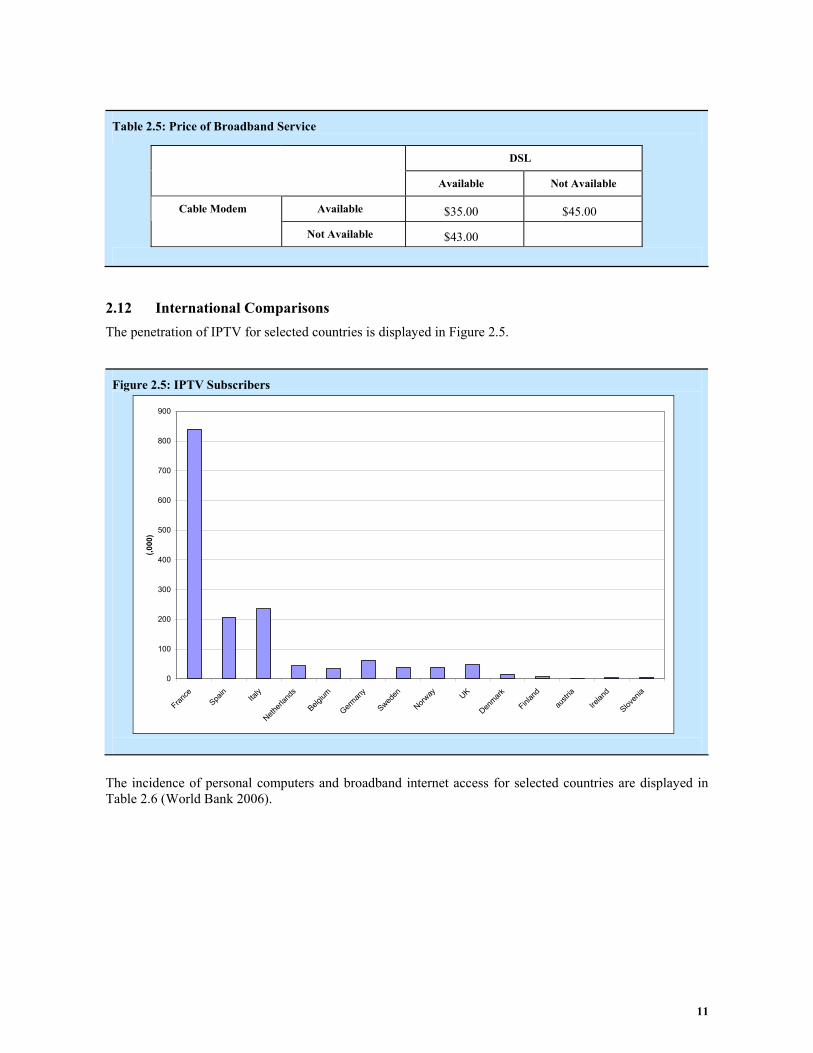
11
Table 2.5: Price of Broadband Service
DSL
Available Not Available
Available $35.00 $45.00 Cable Modem
Not Available $43.00
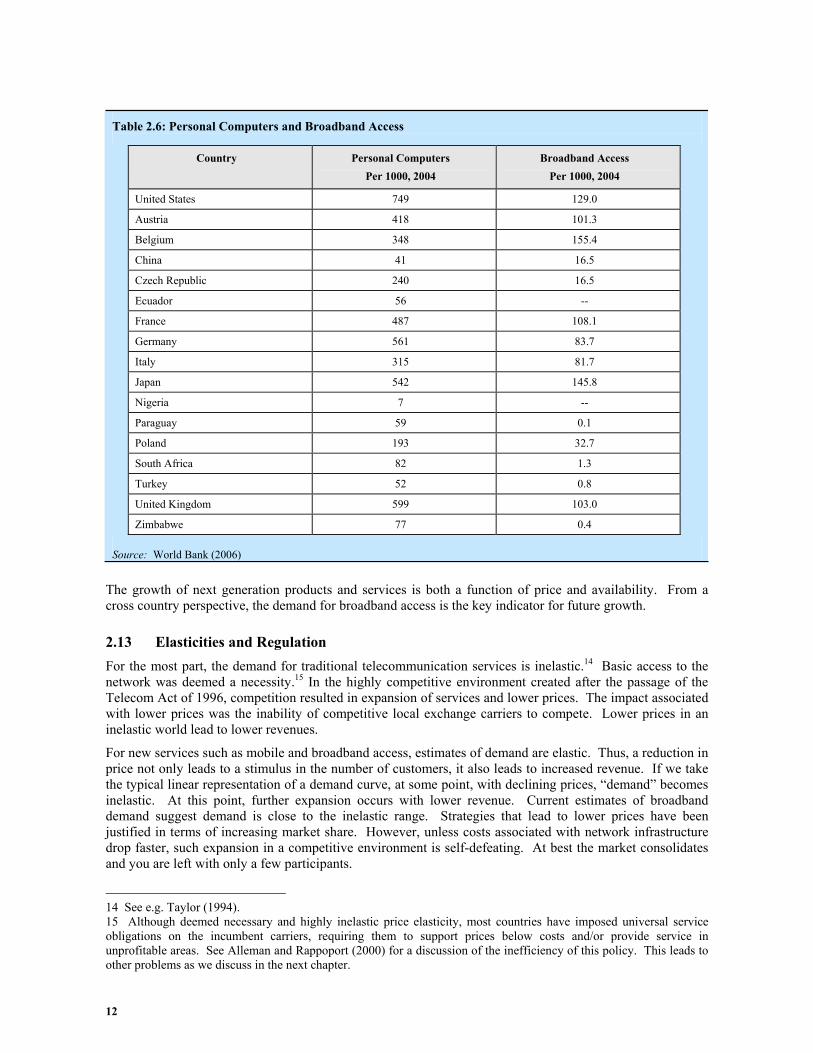
2.12 International Comparisons The penetration of IPTV for selected countries is displayed in Figure 2.5.
Figure 2.5: IPTV Subscribers
0
100
200
300
400
500
600
700
800
900
France
Spain
Italy
Netherl
ands
Belgium
German
y
Sweden
Norway UK
Denmark
Finlan
d
austr
ia
Irelan
d
Sloven
ia
(,000
)
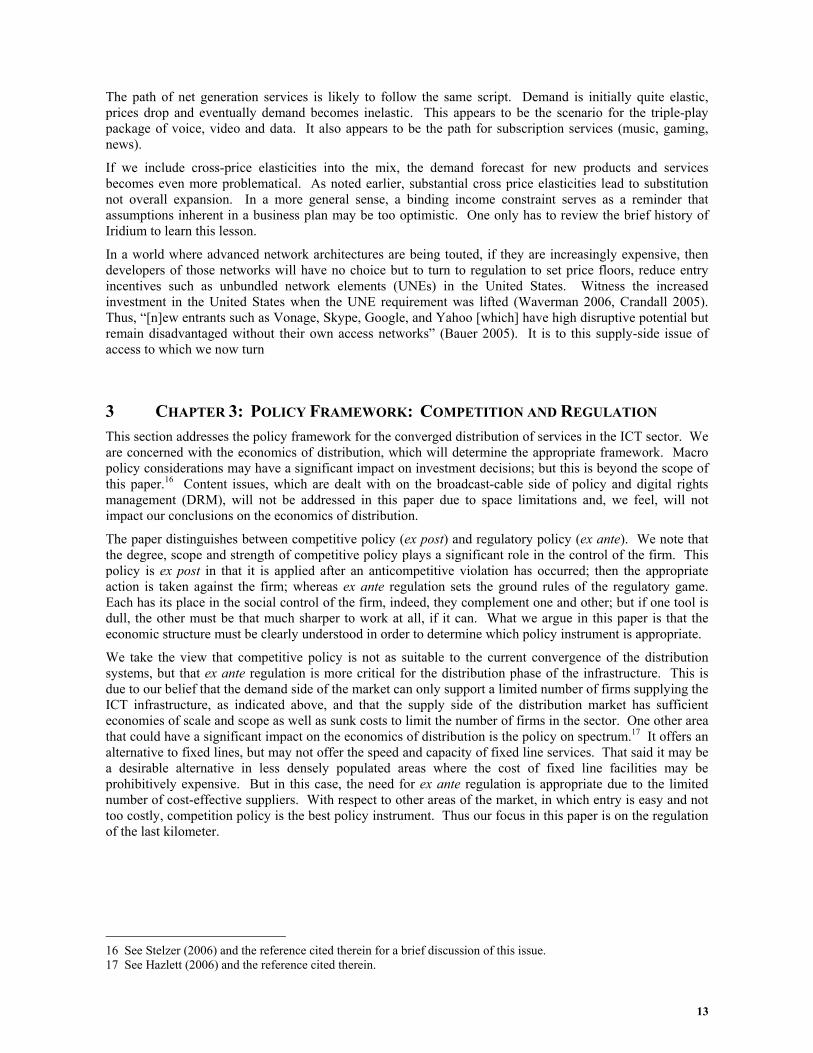
The incidence of personal computers and broadband internet access for selected countries are displayed in Table 2.6 (World Bank 2006).
12
Table 2.6: Personal Computers and Broadband Access
Country Personal Computers Per 1000, 2004
Broadband Access Per 1000, 2004
United States 749 129.0
Austria 418 101.3
Belgium 348 155.4
China 41 16.5
Czech Republic 240 16.5
Ecuador 56 --
France 487 108.1
Germany 561 83.7
Italy 315 81.7
Japan 542 145.8
Nigeria 7 --
Paraguay 59 0.1
Poland 193 32.7
South Africa 82 1.3
Turkey 52 0.8
United Kingdom 599 103.0
Zimbabwe 77 0.4 Source: World Bank (2006)
The growth of next generation products and services is both a function of price and availability. From a cross country perspective, the demand for broadband access is the key indicator for future growth.
2.13 Elasticities and Regulation For the most part, the demand for traditional telecommunication services is inelastic.14 Basic access to the network was deemed a necessity.15 In the highly competitive environment created after the passage of the Telecom Act of 1996, competition resulted in expansion of services and lower prices. The impact associated with lower prices was the inability of competitive local exchange carriers to compete. Lower prices in an inelastic world lead to lower revenues.
For new services such as mobile and broadband access, estimates of demand are elastic. Thus, a reduction in price not only leads to a stimulus in the number of customers, it also leads to increased revenue. If we take the typical linear representation of a demand curve, at some point, with declining prices, “demand” becomes inelastic. At this point, further expansion occurs with lower revenue. Current estimates of broadband demand suggest demand is close to the inelastic range. Strategies that lead to lower prices have been justified in terms of increasing market share. However, unless costs associated with network infrastructure drop faster, such expansion in a competitive environment is self-defeating. At best the market consolidates and you are left with only a few participants.
14 See e.g. Taylor (1994). 15 Although deemed necessary and highly inelastic price elasticity, most countries have imposed universal service obligations on the incumbent carriers, requiring them to support prices below costs and/or provide service in unprofitable areas. See Alleman and Rappoport (2000) for a discussion of the inefficiency of this policy. This leads to other problems as we discuss in the next chapter.
13
The path of net generation services is likely to follow the same script. Demand is initially quite elastic, prices drop and eventually demand becomes inelastic. This appears to be the scenario for the triple-play package of voice, video and data. It also appears to be the path for subscription services (music, gaming, news).
If we include cross-price elasticities into the mix, the demand forecast for new products and services becomes even more problematical. As noted earlier, substantial cross price elasticities lead to substitution not overall expansion. In a more general sense, a binding income constraint serves as a reminder that assumptions inherent in a business plan may be too optimistic. One only has to review the brief history of Iridium to learn this lesson.
In a world where advanced network architectures are being touted, if they are increasingly expensive, then developers of those networks will have no choice but to turn to regulation to set price floors, reduce entry incentives such as unbundled network elements (UNEs) in the United States. Witness the increased investment in the United States when the UNE requirement was lifted (Waverman 2006, Crandall 2005). Thus, “[n]ew entrants such as Vonage, Skype, Google, and Yahoo [which] have high disruptive potential but remain disadvantaged without their own access networks” (Bauer 2005). It is to this supply-side issue of access to which we now turn
3 CHAPTER 3: POLICY FRAMEWORK: COMPETITION AND REGULATION This section addresses the policy framework for the converged distribution of services in the ICT sector. We are concerned with the economics of distribution, which will determine the appropriate framework. Macro policy considerations may have a significant impact on investment decisions; but this is beyond the scope of this paper.16 Content issues, which are dealt with on the broadcast-cable side of policy and digital rights management (DRM), will not be addressed in this paper due to space limitations and, we feel, will not impact our conclusions on the economics of distribution.
The paper distinguishes between competitive policy (ex post) and regulatory policy (ex ante). We note that the degree, scope and strength of competitive policy plays a significant role in the control of the firm. This policy is ex post in that it is applied after an anticompetitive violation has occurred; then the appropriate action is taken against the firm; whereas ex ante regulation sets the ground rules of the regulatory game. Each has its place in the social control of the firm, indeed, they complement one and other; but if one tool is dull, the other must be that much sharper to work at all, if it can. What we argue in this paper is that the economic structure must be clearly understood in order to determine which policy instrument is appropriate.
We take the view that competitive policy is not as suitable to the current convergence of the distribution systems, but that ex ante regulation is more critical for the distribution phase of the infrastructure. This is due to our belief that the demand side of the market can only support a limited number of firms supplying the ICT infrastructure, as indicated above, and that the supply side of the distribution market has sufficient economies of scale and scope as well as sunk costs to limit the number of firms in the sector. One other area that could have a significant impact on the economics of distribution is the policy on spectrum.17 It offers an alternative to fixed lines, but may not offer the speed and capacity of fixed line services. That said it may be a desirable alternative in less densely populated areas where the cost of fixed line facilities may be prohibitively expensive. But in this case, the need for ex ante regulation is appropriate due to the limited number of cost-effective suppliers. With respect to other areas of the market, in which entry is easy and not too costly, competition policy is the best policy instrument. Thus our focus in this paper is on the regulation of the last kilometer.
16 See Stelzer (2006) and the reference cited therein for a brief discussion of this issue. 17 See Hazlett (2006) and the reference cited therein.
14
3.1 The last mile/kilometer issue Many alternatives to the last mile/kilometer18 are on the horizon: mobile TV, satellites, power line telecommunications, fixed wireless, etc., but they serve niche markets or in many cases, are owned by the incumbents (Noam 2006). While many intermediate firms provide a variety of services, the last kilometer is needed to deliver them and here the alternatives are few. This is due to the sunk costs, economies of scale and scope of the provision of the last kilometer. The sunk cost associated with the provision of the termination packet to the customers is critical to both the number of players in the market and appropriate prices for this service. Once the end-user has selected a carrier, the market power is enhanced vis-à-vis the supplier of services of all kinds (Noam 2006). Hence the “net-neutrality” issue in the United States, where the internet firms are demanding regulation of the last kilometer to ensure access and no inappropriate price discrimination.19 As Noam (2006) states so well:
Now, the internet’s advocates seek a large set of supportive governmental policies. And in particular, they seek governmental protections from the powers of the telecom and cable companies’ powers over pricing, quality, discrimination, access, content, favoritism for own subsidiaries, and so on. They seek an opening of incumbent networks through unbundled network elements and rebundled platforms, line-sharing of frequencies over local networks, etc. And who should institute these protections? The same derided, old-fashioned telecom regulators. They [the internet community] just reflect the discovery of the reality of the market power inherent in last-mile delivery networks, and its implication for regulatory rules and institutions. For a while, hope ran high that competition would open wide the delivery network environment. One decade and one burst bubble later, the reality looks different. Last-mile delivery has either remained dominated by an incumbent telecom company or by a small oligopoly. The reasons are not those of conspiracy or of co-optation of regulators, but of economies of scale and sunk cost. In competition, prices are pushed onwards to marginal costs, which are too low for most firms to survive; … (p. 70)
3.2 A note on investment. Obviously, investment is a requirement for growth and development. Indeed investment in the ICT can prove to be particularly rewarding20. But oft times investment is promoted for investment’s sake, rather than its efficacy. Recall that over investment can be just as deleterious as under investment. Witness the melt down of the ICT sector in the financial markets in the spring of 2000, particularly in the United States.21 In that case, the policymakers were even more indirect by linking competition to investment and encouraging competition even when it was not appropriate. The increased investment occurred; however, with disastrous results – a plethora of overcapacity and useless investment. The loss in market capitalization in the US was approximately five trillion (with a “t”) dollars. The policymakers failed to understand the economic structure of the market (Alleman and Rappoport 2005).
This is why it is critical to have a clear understanding of the economics of distribution. If the last kilometer has sunk costs, economies of scale and scope; new entrants of the same type cannot be facilities-based. The “ladder of investment” will not be climbed (Cave 2005). Witness the old AT&T (prior to its acquisition by SBC, which changed its name to AT&T) which exited the residential market when access charges increased, rather than build facilities. MCI –WorldCom followed a similar abandonment of the residential market for the same reasons (Waverman 2006 p. 165).
18 In the United States the “last mile” indicates that final connection into the subscriber’s home or business. In the interest of promotion of the metric system, we will refer to this as the last kilometer. 19 Price discrimination, although sounding pejorative, may be Pareto improving. Each case has to be examined in context. See, for example, Varian (2005). 20 See Alleman, et al. (1992) and Stelzer (2006) and references cited therein for the impact of telecommunications investment on economic growth and development in the telecommunications sector and Jorgenson and Stiroh (1999) for the impact of the ICT sector on productivity. 21 See Crandall (2005) and Waverman (2006) for a discussion of productivity and the deleterious impact of regulated prices on telecommunications investment
15
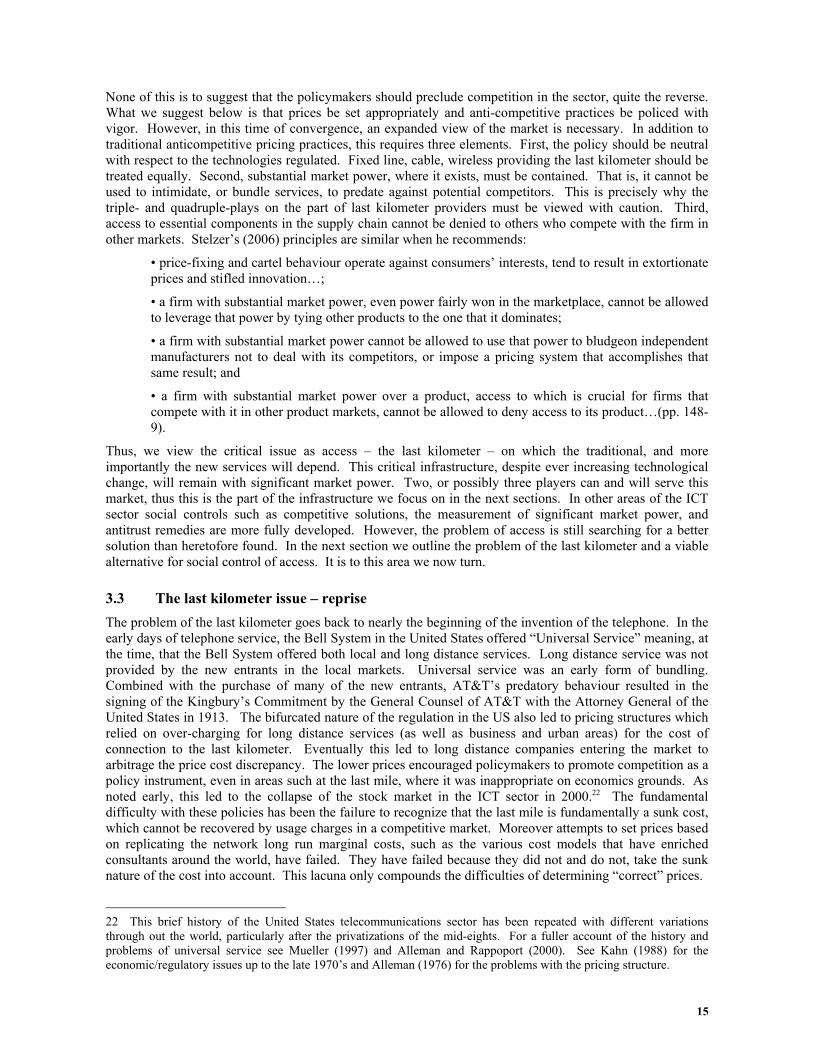
None of this is to suggest that the policymakers should preclude competition in the sector, quite the reverse. What we suggest below is that prices be set appropriately and anti-competitive practices be policed with vigor. However, in this time of convergence, an expanded view of the market is necessary. In addition to traditional anticompetitive pricing practices, this requires three elements. First, the policy should be neutral with respect to the technologies regulated. Fixed line, cable, wireless providing the last kilometer should be treated equally. Second, substantial market power, where it exists, must be contained. That is, it cannot be used to intimidate, or bundle services, to predate against potential competitors. This is precisely why the triple- and quadruple-plays on the part of last kilometer providers must be viewed with caution. Third, access to essential components in the supply chain cannot be denied to others who compete with the firm in other markets. Stelzer’s (2006) principles are similar when he recommends:
• price-fixing and cartel behaviour operate against consumers’ interests, tend to result in extortionate prices and stifled innovation…;
• a firm with substantial market power, even power fairly won in the marketplace, cannot be allowed to leverage that power by tying other products to the one that it dominates;
• a firm with substantial market power cannot be allowed to use that power to bludgeon independent manufacturers not to deal with its competitors, or impose a pricing system that accomplishes that same result; and
• a firm with substantial market power over a product, access to which is crucial for firms that compete with it in other product markets, cannot be allowed to deny access to its product…(pp. 148-9).
Thus, we view the critical issue as access – the last kilometer – on which the traditional, and more importantly the new services will depend. This critical infrastructure, despite ever increasing technological change, will remain with significant market power. Two, or possibly three players can and will serve this market, thus this is the part of the infrastructure we focus on in the next sections. In other areas of the ICT sector social controls such as competitive solutions, the measurement of significant market power, and antitrust remedies are more fully developed. However, the problem of access is still searching for a better solution than heretofore found. In the next section we outline the problem of the last kilometer and a viable alternative for social control of access. It is to this area we now turn.
3.3 The last kilometer issue – reprise The problem of the last kilometer goes back to nearly the beginning of the invention of the telephone. In the early days of telephone service, the Bell System in the United States offered “Universal Service” meaning, at the time, that the Bell System offered both local and long distance services. Long distance service was not provided by the new entrants in the local markets. Universal service was an early form of bundling. Combined with the purchase of many of the new entrants, AT&T’s predatory behaviour resulted in the signing of the Kingbury’s Commitment by the General Counsel of AT&T with the Attorney General of the United States in 1913. The bifurcated nature of the regulation in the US also led to pricing structures which relied on over-charging for long distance services (as well as business and urban areas) for the cost of connection to the last kilometer. Eventually this led to long distance companies entering the market to arbitrage the price cost discrepancy. The lower prices encouraged policymakers to promote competition as a policy instrument, even in areas such at the last mile, where it was inappropriate on economics grounds. As noted early, this led to the collapse of the stock market in the ICT sector in 2000.22 The fundamental difficulty with these policies has been the failure to recognize that the last mile is fundamentally a sunk cost, which cannot be recovered by usage charges in a competitive market. Moreover attempts to set prices based on replicating the network long run marginal costs, such as the various cost models that have enriched consultants around the world, have failed. They have failed because they did not and do not, take the sunk nature of the cost into account. This lacuna only compounds the difficulties of determining “correct” prices.
22 This brief history of the United States telecommunications sector has been repeated with different variations through out the world, particularly after the privatizations of the mid-eights. For a fuller account of the history and problems of universal service see Mueller (1997) and Alleman and Rappoport (2000). See Kahn (1988) for the economic/regulatory issues up to the late 1970’s and Alleman (1976) for the problems with the pricing structure.
16
The cable policy has been different in its approach. The industry built its infrastructure to provide cable television service (hence, CATV) – a unidirectional, analog service. More recently it has upgraded to two-way and digital. The industry could afford to do this since, at least in the US, it was not price regulated.23 Thus, in many countries, the two networks were building in parallel, but with totally different services and features. This has changed with the digitalization of both networks. Were we to start over today, we are convinced only one system would be in place. But history is path dependent, thus we have two potential competitors to provide the last kilometer for voice.
3.4 No Competition in Access The economist draws a clear distinction between competition and monopoly with various shades of gray in between. Many policymakers are not as clear. They presumed that a duopoly (two sellers), such as we just described, will lead to the desirable results of perfect competition. We, and virtually all economists, do not agree. Duopolies require as much regulatory attention as monopolies. With two firms it is easy, in one form or another, to obtain economic rents; exclude others from the market and reduce the social good.24 Indeed, empirical evidence suggests that at least five firms in a market are required to begin to obtain the benefits of competition (Noam 2002).
But wait! What about wireless networks? Three issues surround wireless: 1) The cost and availability of spectrum. Spectrum cost has proved to be a huge entry barrier, particularly in the manner in which the government sells or leases the spectrum. This leads to the second issue. 2) Only large firms can afford to purchase spectrum and they are usually the fixed-line telephone companies, thus foreclosing a potential competitor for the last mile. 3) And, even if the mobile provider is not the telephone or cable company, that firm ultimately has to interconnect with one of the two firms to reach all the subscribers.
The other wireless providers such as WiFi, WiMax, even satellites serve niche markets and do not appear to have the reach to obtain a nationwide presence.
On the other hand, wireless represents a substitute, not only for fixed-line telephony, but also for VoIP. The decline in fixed access lines is a result, inter alia, of the substitution of mobile services. In addition to removing revenue sources from the fixed-line providers, it reduces the incentive to switch to VoIP services. Moreover, to the extend that the mobile provide has bundles of “free” minutes in its offering, the subscribers have even less incentive to switch to the VoIP.
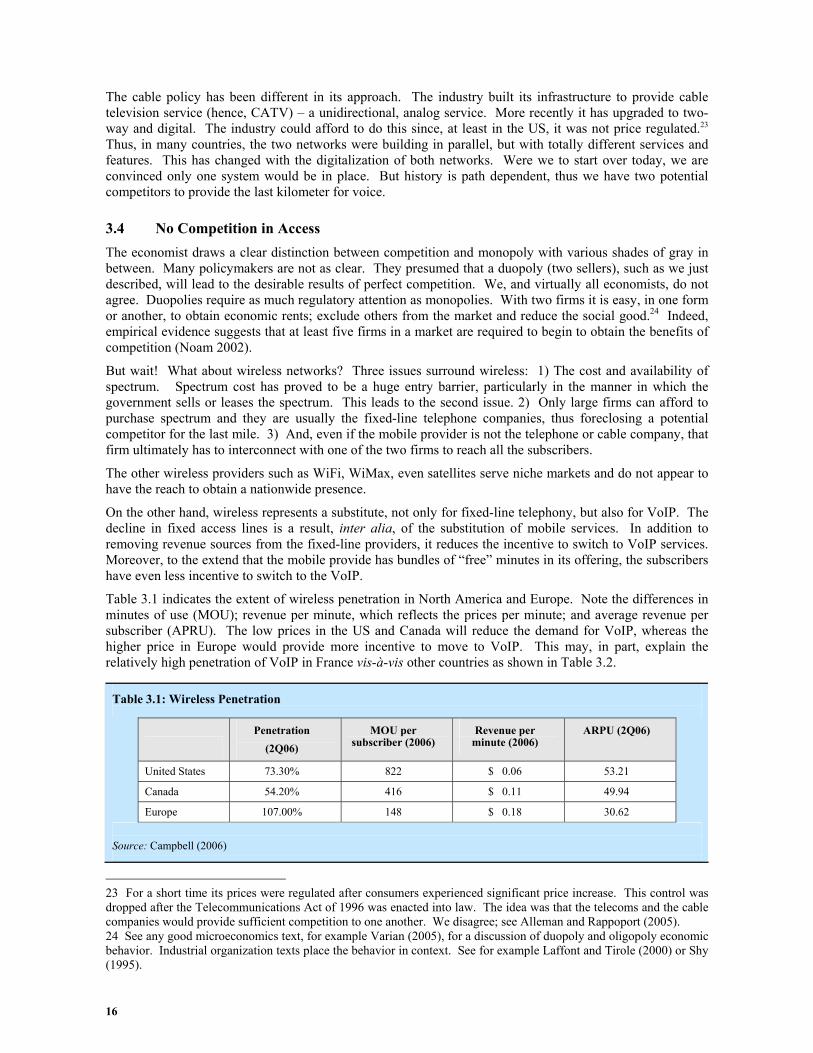
Table 3.1 indicates the extent of wireless penetration in North America and Europe. Note the differences in minutes of use (MOU); revenue per minute, which reflects the prices per minute; and average revenue per subscriber (APRU). The low prices in the US and Canada will reduce the demand for VoIP, whereas the higher price in Europe would provide more incentive to move to VoIP. This may, in part, explain the relatively high penetration of VoIP in France vis-à-vis other countries as shown in Table 3.2.
Table 3.1: Wireless Penetration
Penetration
(2Q06) MOU per
subscriber (2006) Revenue per
minute (2006) ARPU (2Q06)
United States 73.30% 822 $ 0.06 53.21
Canada 54.20% 416 $ 0.11 49.94
Europe 107.00% 148 $ 0.18 30.62 Source: Campbell (2006)
23 For a short time its prices were regulated after consumers experienced significant price increase. This control was dropped after the Telecommunications Act of 1996 was enacted into law. The idea was that the telecoms and the cable companies would provide sufficient competition to one another. We disagree; see Alleman and Rappoport (2005). 24 See any good microeconomics text, for example Varian (2005), for a discussion of duopoly and oligopoly economic behavior. Industrial organization texts place the behavior in context. See for example Laffont and Tirole (2000) or Shy (1995).
17
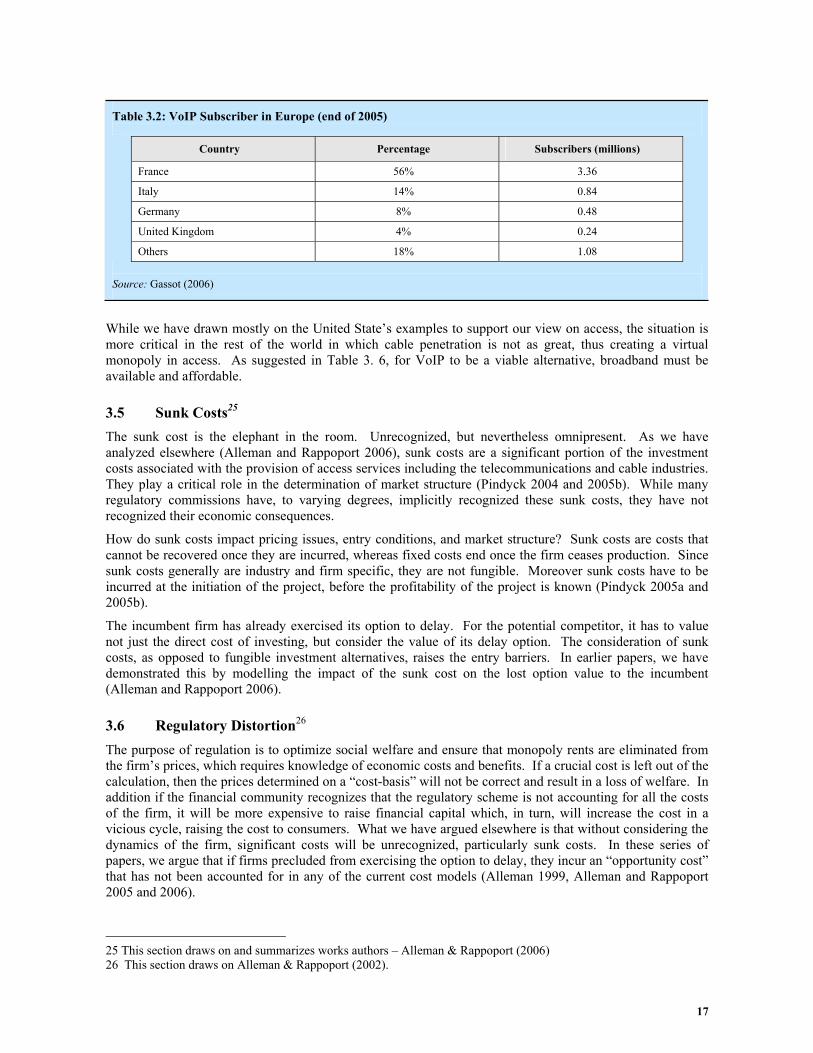
Table 3.2: VoIP Subscriber in Europe (end of 2005)
Source: Gassot (2006)
Country Percentage Subscribers (millions)
France 56% 3.36
Italy 14% 0.84
Germany 8% 0.48
United Kingdom 4% 0.24
Others 18% 1.08
While we have drawn mostly on the United State’s examples to support our view on access, the situation is more critical in the rest of the world in which cable penetration is not as great, thus creating a virtual monopoly in access. As suggested in Table 3. 6, for VoIP to be a viable alternative, broadband must be available and affordable.
3.5 Sunk Costs25 The sunk cost is the elephant in the room. Unrecognized, but nevertheless omnipresent. As we have analyzed elsewhere (Alleman and Rappoport 2006), sunk costs are a significant portion of the investment costs associated with the provision of access services including the telecommunications and cable industries. They play a critical role in the determination of market structure (Pindyck 2004 and 2005b). While many regulatory commissions have, to varying degrees, implicitly recognized these sunk costs, they have not recognized their economic consequences.
How do sunk costs impact pricing issues, entry conditions, and market structure? Sunk costs are costs that cannot be recovered once they are incurred, whereas fixed costs end once the firm ceases production. Since sunk costs generally are industry and firm specific, they are not fungible. Moreover sunk costs have to be incurred at the initiation of the project, before the profitability of the project is known (Pindyck 2005a and 2005b).
The incumbent firm has already exercised its option to delay. For the potential competitor, it has to value not just the direct cost of investing, but consider the value of its delay option. The consideration of sunk costs, as opposed to fungible investment alternatives, raises the entry barriers. In earlier papers, we have demonstrated this by modelling the impact of the sunk cost on the lost option value to the incumbent (Alleman and Rappoport 2006).
3.6 Regulatory Distortion26 The purpose of regulation is to optimize social welfare and ensure that monopoly rents are eliminated from the firm’s prices, which requires knowledge of economic costs and benefits. If a crucial cost is left out of the calculation, then the prices determined on a “cost-basis” will not be correct and result in a loss of welfare. In addition if the financial community recognizes that the regulatory scheme is not accounting for all the costs of the firm, it will be more expensive to raise financial capital which, in turn, will increase the cost in a vicious cycle, raising the cost to consumers. What we have argued elsewhere is that without considering the dynamics of the firm, significant costs will be unrecognized, particularly sunk costs. In these series of papers, we argue that if firms precluded from exercising the option to delay, they incur an “opportunity cost” that has not been accounted for in any of the current cost models (Alleman 1999, Alleman and Rappoport 2005 and 2006).
25 This section draws on and summarizes works authors – Alleman & Rappoport (2006) 26 This section draws on Alleman & Rappoport (2002).
18
3.7 Intermediate/Interconnection: Pricing Having established that the level of intermediate prices is critical for the welfare of the rest of the ICT sector, we outline the consideration of this function. Intermediate or interconnect pricing represents the price of the intermediate good or service needed by a firm to provide its service. In the telecommunications industry, this price is also known as the “access price” and would be the price charged by one service provider, usually the incumbent, for connection to its network in order for the other provider to complete the service for its end-user customers. For example, it would represent the price that long-distance carriers must pay to exchange carriers to complete a call on the public switched telecommunications network (PSTN). Another example would be the connection of a mobile provider to the PSTN.
The problem of intermediate pricing has three major characteristics. The good or service that is needed is an essential facility that is usually provided by a monopoly, (natural or de jure) or oligopoly. The product is an input to a competitive good or service. That is, the intermediate product is provided by the incumbent but needed by the rivals. This, in itself, would be a serious problem, but it is compounded by the fact that the supplier of the intermediate product oft times competes with its customers in the final or downstream market. Thus, the monopoly firm has an incentive to keep the price of the intermediate product higher than its economic cost, in order to increase its revenues. But more important in this context, it increases its rivals’ costs and, hence, their price to the end users. The incumbent can place the rival at a competitive disadvantage.
The pricing methodology should be judged on whether or not it will encourage efficient entry, and avoid inefficient bypass and network duplication. In addition, it should not discourage the incumbent from developing and maintaining the current network. Finally, it should promote a transition to a competitive market (Laffont and Tirole, 1995).
Many commentators have addressed this issue for example Armstrong, Doyle and Vickers (1995) Laffont and Tirole (1995, 1999, 2000) Laffont, Tirole and Rey (1999), Vogelsang (2003) and Nuttall and Vickers, (1996) and the topic deserves a paper by itself; all we wish to add is that the dynamic nature of the marketplace be accounted for in the determination of the intermediate price. Without this consideration, it will not meet the goals of an appropriate price. And the most important dynamic is the consideration of the sunk costs in the provision of the network services.
4 CHAPTER 4: CONCLUSION/FUTURE RESEARCH/ RECOMMENDATIONS
4.1 The Policymakers’ Dilemma While the technologist/policymakers may prefer one market structure outcome over another, what the consumer is interested in is communications – simple, easy-to-use, cost effective and available on demand. These needs are not always satisfied in the current market environment. Currently, they must be satisfied with multiple networks and devices. Business and households now have fixed telephones, mobile phone (many times more than one for a household), a broadband connection which could be satellite, cable, DSL, WiFi, or WiMax, and Blackberries. Are consumers indifferent to technology and the protocols to communicate? Does a consumer’s desire to “communicate” transcend any one platform? Voice is not a unique form of communication; e-mail, facsimiles, video phones, and self-generated content are all means to communicate. For the next generation of consumers, simplicity, availability and access are required. To satisfy these consumers, the diversity of communications has significantly expanded. From this perspective, consumer demand is the driver of change.
The surge in mobile subscribers and the number of households that have internet access should be viewed carefully as at best a trend in unconstrained demand. Low access prices, the availability of content at zero or low prices has fueled this growth. There is substantial evidence that demand for new forms of access and usage are elastic. There is also evidence that cross-price elasticities are substantial. Coupled with the reality of a budget constraint and changes in household demographics, forecasts of continued growth must be tempered by the reality of rising prices for access and content. Otherwise, there is the possibility of over investment and the possibility of financial difficulties for firms that provide infrastructure.
19
Satellite Radio: A Microcosm of the Industry. An analogous example to the fixed line access issue is satellite radio, a subscription service that is a substitute for over-the-air radio. Even with millions of subscribers and hundred’s of million dollars in funding, the two satellite radio providers in the United States – Sirius Satellite Radio and XM Satellite Radio are struggling and contemplating a merger. Although satellite radio is growing faster than any other consumer product except for the iPod, both the supply-side and demand side realities have been recognized (Taub 2007). ‘“When you have two companies in the same industry, we have a similar cost structure. Clearly, a merger makes sense from an investor’s point of view to reduce costs, and to have a better return,’ said David Frear, the chief financial officer for Sirius.” (Taub 2007 p. B1) This case illustrates Shapiro and Varian’s maxim that the “technologies change, the laws of economics do not” (1999 pp. 1-2) and is a microcosm of the conclusion with respect to the ICT sector – limited demand, nearly unitary-elastic demand coupled with large economies to scale and scope, and sunk costs leaves very little room to maneuver in the ICT sector.
4.2 Conclusion Our conclusion based on the demand side and supply side considerations is that dynamics markets must be considered. Demand elasticities must be understood and scale, scope, and sunk cost must be factored into the consideration of the policy alternatives. As we have shown, the relevant demand elasticities are nearly unitary and the last kilometer has significant scale and scope economies, as well as non-trivial sunk costs. Each of these factors alone implies that the market structure will be monopolist or an oligopoly at best. But amplified in combination, Thus the need for clear, certain regulation of this segment of the ICT sector is an absolute necessity. Hence. interconnection prices have to be controlled by the regulatory authority. And must reflect the “correct prices” which account for the opportunity cost of making the sunk investment.
Coupling the demand and supply-side consequences of the economic facts on the ground places policymaker and regulators in a delicate position – they have a precarious balancing act to ensure the wellbeing of the ICT sector. Good luck!
5 REFERENCES Alleman, James (1977) The Pricing Structure of Local Telephone Service, US Department of Commerce, Office of Telecommunications, OT Special Report, 77-121.
Alleman, James. “The Poverty of Cost Models, The Wealth of Real Options”, in Alleman and Noam (eds.), The New Investment Theory of Real Options and Its Implications for Telecommunications Economics, Regulatory Economics Series, Kluwer Academic Publishers, Boston, MA 1999; pp. 159-179.
Alleman, James and Paul Rappoport (2005). “Regulatory Failure: Time for a New Policy Paradigm,” Communications & Strategy, No. 60, 4th. Quarter, pp. 105-123.
Alleman, James and Paul Rappoport (2006) “Optimal Pricing with Sunk Cost and Uncertainty” (co-authored with Paul Rappoport) in The Economics of Online Markets and Information Communications and Technology Networks: Contribution to Economics Series, (eds. Russel Cooper, Ashley Lloyd, Gary Madden and Michael Schipp), Physica-Verlag, Heidelberg (2006), ISSN 1431-1933, pp. 143-155.
Alleman, James and Paul Rappoport (2000). “Universal Service: The Poverty of Policy,” University of Colorado Law Review, volume 71, number 4, fall 2000, pp. 849-878.
Alleman, James, Paul N. Rappoport, Lester Taylor, Milton Mueller, P. Greene, Carl Hunt, Marty Gerarity (1992) “Southern Africa Telecommunications/ Economics Scoping Study, Task II,” U.S. Agency for International Development Contract, October.
Armstrong, Mark, C. Doyle and J. Vickers (1996), “The Access Pricing Problem: A Synthesis,” The Journal of Industrial Economics.
Bauer (2006) Bundling, Differentiation, Alliances and Mergers: Convergence Strategies in U.S. Communication Markets, Communications & Strategy, No. 60, 4th. Quarter, pp, 59-83.
Broadbandproerties.com (2006) September..
20
Businessweek (2006) available at http://app.businessweek.com [23 December 2006]
Bureau of Labor Statistics (BLS) (2006) Consumer Expenditure data available at www.bls.gov/cex/home.htm
Cave, Jonathan (2006) “Market-based alternatives or complements to regulation,” in Richards, Foster, and Kiedrowski, pp. 176–194.
Campbell, Glen (2006). CITI presentation 20 October. Available at http://www.citi.columbia.edu/conferences/transatlantic06/Campbell.pdf [10 January 2007]
Cave, Martin (2005) “Investment Incentives and Local Loop Prices,” mimeo
Computer World (2006). Available at www.computerworld.com/managementtopics/management/story/0,10801,107306,00.html [10 January 2007]
Crandall, Robert W. (2005) Competition and Chaos: U.S. Telecommunications since the 1996 Telecom Act, Brooking Institute Press, Washington, D. C.
Fairbairn, Carolyn (2006) “Serving the public good in the digital age: Implications for UK media regulation” in Richards, Foster, and Kiedrowski, pp. 77–86. Federal Communications Commission (FCC) (2006) “Trends in Telephone Service,” available at www.fcc.gov/wcb/iatd/trends.html [23 December 2006]
Forge, Simon, Colin Blackman and Erik Bohlin (2005) The Demand for Future Mobile Communications Markets and Services in Europe, Technical Report EUR 21673 EN, April. Available at http://fms.jrc.es/documents/FMS%20FINAL%20REPORT.pdf [23 December 2006].
Gassot, Yves (2006). CITI presentation 20 October. Available at http://www.citi.columbia.edu/conferences/transatlantic06/Gassot.pdf [10 January 2007]
Hazlett, Thomas W. (2006) “An economic evaluation of spectrum allocation policy," in Richards, Foster, and Kiedrowski, pp. 249–258.
Hausman, Jerry (1999) “The Effect of Sunk Costs in Telecommunications Regulation,” in Alleman and Noam (eds.), The New Investment Theory of Real Options and Its Implications for Telecommunications Economics, Regulatory Economics Series, Kluwer Academic Publishers, Boston, MA.
Hundt, Reed (2006) “Communications policy, economic policy," in Richards, Foster, and Kiedrowski, pp. 195–201.
IDC (2006) Available at www.idc.com/getdoc.jsp?containerld=prus20211306 [5 January 2007].
InformationWeek (2005) “MP3 Players Reaching 'Critical Mass'”, 13 April. Available at http://informationweek.com/story/showArticle.jhtml?articleID=160900450 [23 December 2006].
Jorgenson, Dale W. and K. J. Stiroh (1999), “Information Technology and Growth,” American Economic Review, Papers and Proceedings, Volume 89, Number 2.
Kahn, Alfred E. (1988) The Economics of Regulation: Principles and Institutions, The Economics of Regulation, 2 volumes, John Wiley, 1970 and 1971. Reprinted by The MIT Press, 1988.
Kridel, Donald, Paul Rappoport and Lester Taylor (2002) “IntraLATA long distance demand: carrier choice, usage demand and price elasticities,” International Journal of Forecasting, pp. 545-559.
Laffont, Jean-Jacque and Jean Tirole. (1994) “Access pricing and competition”, European Economics Review 38, pp. 1673-1710.
Laffont, Jean-Jacque and Jean Tirole. (1995) “Creating Competition through Interconnection: Theory and Practice,” Access and Interconnection Workshop, April, New Zealand (mimeo).
Laffont, Jean-Jacque and Jean Tirole. (2000) Competition in Telecommunications, Cambridge, MA: MIT Press.
21
Laffont, Jean-Jacque and Jean Tirole. (1993) A Theory of Incentives in Procurement and Regulation, Cambridge, Mass, MIT Press.
Laffont, Jean-Jacque, Patrick Rey and Jean Tirole. (1998a) “Network Competition: I. Overview and Nondiscriminatory Pricing.” Rand Journal of Economics, 29.
Laffont, Jean-Jacque, Patrick Rey and Jean Tirole. (1998b) “Network Competition: II. Price Discrimination,” Rand Journal of Economics, 29.
Mayo, Ed and Philip Cullum (2006) “The consumer agenda on regulation," in Richards, Foster, and Kiedrowski, pp. 87–97.
Mitchell, Bridger M. and Ingo Vogelsang (1991) Telecommunications Pricing: Theory and Practice, Cambridge University Press, Cambridge, England,.
Mixon., Franklin G. Jr. and Rand W. Ressler (2000) “A Note on Elasticity and Price Dispersions in the Music Recording Industry, Review of Industrial Organization, Volume 17, Number 4, December.
Mueller, Milton (1997) Universal Service: Interconnection, Competition, and Monopoly in the Making of American Telecommunications. (MIT Press/AEI Series on Telecommunications Deregulation. .
Nissen, Keith (2005) “The Coming Revolution in Voice Communication Services,” In-Stat Available at http://www.instat.com/events/asia/promos/asia_nissen_21367.pdf [30 December 2006]
Noam, Eli. (2002) “How Telecom Is Becoming A Cyclical Industry, And What To Do About It,” The New Telecommunications Industry and Financial Markets: From Utility to Volatility Conference.
Noam, Eli M. (2006) “Why TV regulation will become telecom regulation” in Richards, Foster, and Kiedrowski, pp. 67–72.
Nuttall, Robin and John Vickers, Competition Policy for Regulated Utility Industry in Britain, Applied Economics Discussion Papers, Institute of Economics and Statistics, Oxford No. 178, February, 1996.
Organization for Economics Development (OECD), (2006) “OECD Broadband Statistics to June 2006,” http://www.oecd.org/document/9/0,2340,en_2649_34223_37529673_1_1_1_1,00.html#TimeSeries [10 January 2007].
Pindyck, Robert S. (2004). “Mandatory Unbundling and Irreversible Investment in Telecom Networks,” NBER Working Paper No. 10287
Pindyck, Robert S. (2005a). “Pricing Capital under Mandatory Unbundling and Facilities Sharing.” NBER Working Paper No. 11225
Pindyck, Robert S. (2005b) “Real Options in Antitrust,” presentation to the Real Options Conference, Paris, 24 June.
Rappoport, Paul, James Alleman, and Lester Taylor (2006) “IPTV – Telecom Provision of Video Services: An Econometric Assessment,” Proceedings of Sixteenth Biennial Conference of the ITS, Beijing, 12-16 June.
Rappoport, Paul, Lester Taylor and Donald Kridel, (2003) “Willingness to pay and the demand for broadband services,” in Down to the Wire: Studies in the diffusion and regulation of telecommunication technologies, A. Shampine (ed.), Nova Science Publishers.
RIAA http://www.riaa.com/news/marketingdata/pdf/2005consumerprofile.pdf [28 December 2006]
Richards, Ed; Robin Foster, and Tom Kiedrowski, (eds.) (2006) Communications: The Next Decade, the UK Office of Communications, London, UK, November.
Shapiro, Carl and Hal R. Varian, (1999) Information Rules, A Strategic Guide to Network Economics, Boston, Harvard Business School Press.
Shy, Oz, Industrial Organization: Theory and Applications, MIT Press, Cambridge, MA, 1995.
Spolsky, Joel (2005) “Price as Signal,” Available at http://www.joelonsoftware.com/items/2005/11/18.html [23 December 2006].

22
Stelzer, Irwin (2006) “Creating an environment for rapid innovation,” in Richards, Foster, and Kiedrowski, pp. 143–157.
Taylor, Lester D. (1994), Telecommunications Demand in Theory and Practice, Kluwer Academic Publishers, Dordrecht.
Taub, Eric A. (2007) “Loaded With Personalities, Now Satellite Radio May Try a Merger” New York Times, 1 January, p. B1. Available at http://www.nytimes.com/2007/01/01/technology/01satellite.html?ref=business [1 January 2007]
Ureta, Sebastian (2005) “Variations on expenditure on communications in developing countries”, regulateonling.org, November.
US Census Bureau E-Stats (2006) 25 May. Available at http://www.census.gov/eos/www/papers/2004/2004reportfinal.pdf [23 December 2006].
van Duyn, Aline and Joshua Chaffinand, (2006) “CNBC rolls out video-led website” Financial Times, 4 December, p. 18
van Duyn, Aline and Paul Taylor (2006) “Yahoo, Reuters launch You Witness” Financial Times, 4 December, p. 18
Varian, Hal R. (2005) Intermediate Microeconomics: A Modern Approach (Seventh Edition) W. W. Norton & Company
Vogelsang, Ingo. (2003) “Price Regulation of Access to Telecommunications Networks,” Journal of Economic Literature, Vol. XLI, September pp. 830–862.
Waverman, Leonard (2006) “The challenges of a digital world and the need for a new regulatory paradigm, " in Richards, Foster, and Kiedrowski, pp. 158–175.
World Bank (2006) “Information Technology, " http://web.worldbank.org/WBSITE/EXTERNAL/DATASTATISTICS/0,,contentMDK :20394827~menuPK :1192 [10 January 2007].


![FUTURE [RE]GENERATION](https://img.dokumen.tips/doc/110x75/556105b2d8b42aff3f8b57a7/future-regeneration.jpg)