Embed Size (px)
Citation preview
The Foreign Service and Foreign Trade:
Embassies as Export Promotion Andrew K. Rose* Revised: January 4, 2006
Comments Welcome Abstract As communication costs fall, foreign embassies and consulates have lost much of their role in decision-making and information-gathering. Accordingly, foreign services are increasingly marketing themselves as agents of export promotion. I investigate whether exports are in fact systematically associated with diplomatic representation abroad. I use a recent cross-section of data covering twenty-two large exporters and two-hundred import destinations. Bilateral exports rise by approximately six to ten per cent for each additional consulate abroad, controlling for a host of other features including reverse causality. The effect varies by exporter, and is non-linear; consulates have smaller effects than the creation of an embassy. Keywords: international, import, destination, country, empirical, data, panel, consulate, gravity. Running Title: Foreign Service and Foreign Trade JEL Classification Numbers: F13 Contact: Andrew K. Rose,
Haas School of Business, University of California Berkeley, CA 94720-1900 Tel: (510) 642-6609 Fax: (510) 642-4700 E-mail: [email protected] URL: http://faculty.haas.berkeley.edu/arose
* ANDREW K ROSE is B.T. Rocca Jr. Professor of International Business, Economic Analysis and Policy Group, Haas School of Business at the University of California, Berkeley, NBER Research Associate, and CEPR Research Fellow. I thank Maria Teresa Cometto and Peter Thurlow for pointing out (minor) mistakes in the first draft of the paper, and an anonymous referee for helpful comments, and pointing out more (hopefully still minor) mistakes. The data set, key output, and a current version of the paper are available at my website.
1
1. Introduction
What does the Foreign Service do? More generally, why do countries spend so many
resources on embassies, consulates, and the Foreign Service?
In times gone by, embassies, consulates, and the like – hereafter “foreign missions” –
were important sources of information and were empowered to make significant decisions. But
as communication costs have fallen, much information about foreign countries has become
quickly and cheaply available through alternate sources. Key decisions about foreign affairs are
increasingly made at home and simply communicated abroad. Consular affairs – passports,
visas, and the like – do not seem to justify the expense and prestige of a Foreign Service. In the
age of the internet, is there a raison d’être for the Foreign Service?
One answer increasingly given is that the Foreign Service promotes exports.
Ambassadors, commercial attaches, and other members of the diplomatic corps are said to pay a
key role in developing and maintaining export markets. This short paper asks the question: are
foreign missions in fact systematically linked to exports? To be more concrete, consider the fact
that in 2003, both Brazil and Belgium exported seventeen billion dollars of goods to the United
States, despite the fact that Belgium’s economy is over twice as big as Brazil’s, and both are
approximately the same distance from the United States. Brazil maintains seven consulates (and
an embassy) in the United States, while Belgium only has four consulates (and an embassy). Is
Brazil’s larger network a material advantage to its exporters, and a reason why it maintains its
export presence in the American market?
To answer this question, I link exports from twenty-two important countries to two-
hundred destination countries. I take advantage of the fact that countries have varying number of
foreign missions abroad. Some embassies cover multiple countries, while some countries host
2
an embassy and a number of consulates. For instance, in December 2004 the United States had
an embassy and six consulates in Canada, an embassy in Cape Verde, and no official presence in
the Central African Republic (it is covered from Chad and Cameroon). The Netherlands has
over four-hundred foreign missions, while Sweden has less than a hundred. I use such
differences to ask whether there is a measurable link between the size of the Foreign Service and
exports.
I use annual data averaged over 2002-03, and control for other determinants of trade
through a standard “gravity” model. I estimate my cross-section using least-squares, and show
my results are robust to inclusion of different types of country-specific fixed effect intercepts. I
also account for reverse causality; as instrumental variables I employ variables that are correlated
with the importance of countries (e.g., proven oil reserves) and the desirability of living there as
a Foreign Service officer (e.g., the number of Condé-Nast top 100 destinations in a country).
I find that the presence of foreign missions is indeed positively correlated with exports.
Holding other things constant, I find that each additional consulate is associated with slightly
higher exports; my point estimate is around six to ten per cent. This result is statistically
significant, and economically plausible in magnitude. It varies by exporter, and also seems to be
non-linear; the first foreign mission has a larger effect on exports than successive missions. Still,
the Foreign Service does indeed seem to promote exports at the margin.
2. Motivation
Foreign Services are expensive. For instance, the 2004 fiscal year budget request for the
US Department of State included $4.2 billion for diplomatic and consular programs, and $1.5

3
billion for embassy security, construction and maintenance.1 Foreign Services are also
glamorous. For instance, ambassadors rank eighth in the American protocol precedence list, just
after the Chief Justice of the Supreme Court and former presidents, and just before the Secretary
of State and the President of the UN General Assembly.2 Entry into the Foreign Service is
typically quite competitive, and the diplomatic corps is among the most prestigious parts of the
civil service. This paper asks whether this use of financial and human resources is justified, at
least in part, by export promotion.
It seems clear that the Foreign Services of most countries believe that they are agents of
export promotion. For instance, the US State Department describes itself as attempting to
promote and protect the interests of the United States by (italics added):
• “Promoting peace and stability in regions of vital interest;
• Creating jobs at home by opening markets abroad;
• Helping developing nations establish stable economic environments that provide investment and export opportunities …
The services the Department provides include:
• Protecting and assisting U.S. citizens living or traveling abroad;
• Assisting U.S. businesses in the international marketplace…”3
The US Commercial Service (part of the Department of Commerce which operates out of
American foreign missions) describes its role in a typical trading partner (the UK) as being:
1 http://www.state.gov/secretary/rm/2003/17607.htm. By way of contrast, the budget for the entire Department of Commerce totaled $5.8 billion in 2005; http://www.osec.doc.gov/bmi/budget/05BIB/funding.pdf. The United States is not alone; the British Foreign and Commonwealth Office spent ₤868.9 billion in 2003-04 (http://www.fco.gov.uk/servlet/Front?pagename=OpenMarket/Xcelerate/ShowPage&c=Page&cid=1007029395222), while the Ministry of Foreign Affairs of the Netherlands plans to spend €10.3 billion in 2005 (http://www.minbuza.nl/default.asp?CMS_ITEM=7AEB9D02F1EF43A582F11936DA930A3EX3X56438X84). 2 http://www.hqda.army.mil/protocol/doc/Precedence%20List%20as%20of%2029%20Jun%2004.pdf
4
“…part of a global network of trade specialists dedicated to supporting US commercial interests around the world. We offer a variety of services to US exporters and UK importers and our trade specialists are available to help with your enquiries. If you are a US company, we can assist in promoting your goods and services into the UK market by:
• finding suitable UK business partners
• identifying UK trade opportunities
• advising on the UK market potential for your product
• offering UK market research reports and
• helping to launch your company into one of the biggest markets in the world …”4
Other countries also use their Foreign Services to promote exports. For instance, the role
of the British Foreign and Commonwealth Office is to provide (italics added); “… a range of
essential services to the public – from advising British travellers to issuing UK visas and
promoting trade and investment opportunities overseas.”5 Further, “The UK is the fifth largest
trading nation: our exports are vital to our national prosperity. One in four jobs in the UK is
linked to business overseas. So the FCO has a key role in promoting our companies and
products abroad. Nearly 1,500 FCO staff equivalents are engaged in commercial and investment
work (about 350 UK-based and just over 1,100 locally-engaged).”6
3 http://www.state.gov/r/pa/ei/rls/dos/436.htm 4 http://www.buyusa.gov/uk/en/. Also, see the official American export portal www.export.gov. 5 http://www.fco.gov.uk/servlet/Front?pagename=OpenMarket/Xcelerate/ShowPage&c=Page&cid=1007029390563 6 http://www.fco.gov.uk/servlet/Front?pagename=OpenMarket/Xcelerate/ShowPage&c=Page&cid=1007029391386. Further, “UK Trade & Investment is represented in over 200 FCO posts overseas, providing market information and advice on local issues to companies visiting from the UK. UK Trade & Investment is the Government organisation that supports both companies in the UK trading internationally and overseas enterprises seeking to locate in the UK. UK Trade & Investment has the following targets:
• To develop 5,000 new exporters by 2004, with at least 15% improving their business performance within two years
• To assist 18,000 established exporters into markets new to them
• To assist 50% of established exporters to improve their business performance within two years
UK Trade & Investment has recruited, mainly from the private sector, nine International Trade Directors, one for each English region. The directors and their International Trade Teams have
5
Similarly, the mandate of the Canadian Department of Foreign Affairs and
International Trade is to:
• “conduct all diplomatic and consular relations on behalf of Canada;
• conduct all official communication between the Government of Canada and the government of any other country and between the Government of Canada and any international organization; …
• foster the expansion of Canada's international trade;…”7
This is also true of other large countries. For instance, the German Missions abroad
“can be called Germany's eyes, ears and voice abroad. On instructions from the Federal Foreign Office, they represent our country, defend its interests and protect its citizens in the host country. They negotiate with the government of the host country and promote political relations as well as economic, cultural and scientific cooperation. The essential tasks of the missions include:
• collecting information,
• reporting on issues which are of relevance to the various authorities of the Federation and the Länder,
• helping German citizens in emergencies,
• assisting German companies with their activities in the host country and generally enhancing mutual trade, …”8
been strategically located in the Regional Development Agencies to ensure they play a full role in drawing up regional trade strategies. The first point of contact for inquiries by companies in the UK is their International Trade Advisor, located at their local Business Link.
UK Trade & Investment services include:
• Your Passport to Export Success- UK Trade & Investment’s flagship assessment and skills-based programme that provides new and inexperienced exporters with the training, planning and on-going support they need to succeed overseas.
• Export Explorer, an integrated package of help and advice that enables small and medium size firms to experience new and accessible export markets at minimal cost…
Teams of commercial officers at British Diplomatic posts overseas work to understand the local business environment and match opportunities to the capabilities of UK firms. Help for existing exporters takes a variety of forms aimed at meeting a wide range of customer needs. It ranges from the straightforward provision of information, through detailed advice in response to specific enquiries, to lobbying overseas on behalf of UK companies.”6
7 http://www.dfait-maeci.gc.ca/department/mandate-en.asp. Further, International Trade Canada provides “Help from our officers located in more than 140 cities worldwide to assess your export potential, identify key foreign contacts, and obtain relevant advice and intelligence.” (http://www.itcan-cican.gc.ca/cdn_bus-en.asp) 8 http://www.auswaertiges-amt.de/www/en/aamt/aufgaben/aufgaben_av_html
6
Similarly, the Australian Department of Foreign Affairs and Trade describes their own
objectives as:
“The department’s aim is to advance the interests of Australia and Australians internationally. This aim is the driving force behind our work and underpins all the department’s goals, priorities, values and culture.
The department’s goals are to:
• enhance Australia’s security
• contribute to growth in Australia’s economy, employment and standard of living…”9
The relevant question is not whether Foreign Services believe they are in the business of
export promotion (at least in part), but whether they are effective at it. I now investigate that
issue.
3. Methodology
I am interested in estimating the effect of a country’s Foreign Service on its exports,
allowing for other determinants of trade. To accomplish the latter, I use a conventional bilateral
“gravity” model of trade, which links exports positively to economic mass (proxied by
population and income), and negatively to economic distance. The gravity model has a long
history in international and regional economics; Anderson and van Wincoop (2003) provide a
good recent treatment. The gravity model takes into account more traditional economic reasons
for international trade; I ask below whether there is any room left over in the residual for the
presence and number of foreign missions.
I estimate the following cross-sectional equation:
9 http://www.dfat.gov.au/dept/whatwedo.html
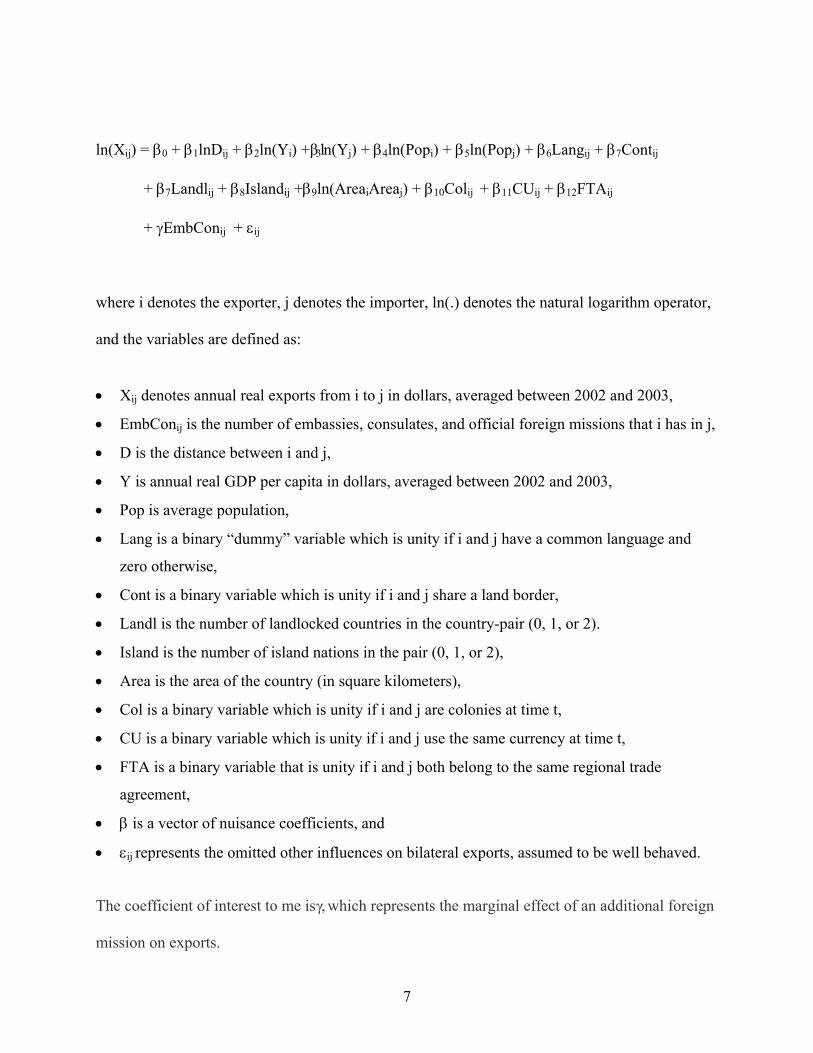
7
ln(Xij) = β0 + β1lnDij + β2ln(Yi) + β3ln(Yj) + β4ln(Popi) + β5ln(Popj) + β6Langij + β7Contij
+ β7Landlij + β8Islandij +β9ln(AreaiAreaj) + β10Colij + β11CUij + β12FTAij
+ γEmbConij + εij
where i denotes the exporter, j denotes the importer, ln(.) denotes the natural logarithm operator,
and the variables are defined as:
• Xij denotes annual real exports from i to j in dollars, averaged between 2002 and 2003,
• EmbConij is the number of embassies, consulates, and official foreign missions that i has in j,
• D is the distance between i and j,
• Y is annual real GDP per capita in dollars, averaged between 2002 and 2003,
• Pop is average population,
• Lang is a binary “dummy” variable which is unity if i and j have a common language and
zero otherwise,
• Cont is a binary variable which is unity if i and j share a land border,
• Landl is the number of landlocked countries in the country-pair (0, 1, or 2).
• Island is the number of island nations in the pair (0, 1, or 2),
• Area is the area of the country (in square kilometers),
• Col is a binary variable which is unity if i and j are colonies at time t,
• CU is a binary variable which is unity if i and j use the same currency at time t,
• FTA is a binary variable that is unity if i and j both belong to the same regional trade
agreement,
• β is a vector of nuisance coefficients, and
• εij represents the omitted other influences on bilateral exports, assumed to be well behaved.
The coefficient of interest to me is γ, which represents the marginal effect of an additional foreign
mission on exports.
8
I estimate this equation in a number of different ways. I begin with conventional OLS,
using a robust covariance estimator to handle heteroskedasticity. I also account for the panel
nature of the data set by allowing for exporter fixed effect intercepts, importer fixed effects, or
both. Heavy trade may induce countries to set up more consulates, so that there may be reverse
causality from exports to foreign missions. Accordingly, I also estimate the equation with
instrumental variables.
I use a two-pronged strategy to choose my instrumental variables. First, I use variables
that measure the potential geo-political importance of a country. The relevant variables I
consider include: a) proven oil reserves (in bbl); b) proven gas reserves (in cu m); and c) military
spending (in $). The preferences of the diplomatic corps may also help determine the location
and number of foreign missions. Accordingly, I also use variables that measure the desirability
of residing in a particular country. The relevant variables I consider in this category include the
number (in an import destination country) of: a) Condé-Nast top 100 destinations; b) Zagat
surveys; c) Ritz hotels; d) Four Seasons hotels; e) Luxury hotels (Westin, Sheraton, St. Regis,
and W hotels, all owned by Starwood hotels); f) Baedeker guides; g) Blue guides; h) Lonely
Planet guides; i) Michelin guides; j) Economist city guides; k) whether the country experiences
monsoonal rains; and l) the number of Google hits for the search ‘ +“Travel Destination” +“city”
+”x” ’ where x is the name of the capital city.10
The series for the regressand comes from the August 2004 “Direction of Trade” (DoT)
CD-ROM data set developed by the International Monetary Fund (IMF). It records bilateral
merchandise exports in $ between IMF trading entities; I average 2002 and 2003 exports
10 I have experimented with other climatic dummy variables without success.
9
(deflating 2003 exports by the relevant American CPI inflation rate.11 I include data for 22 large
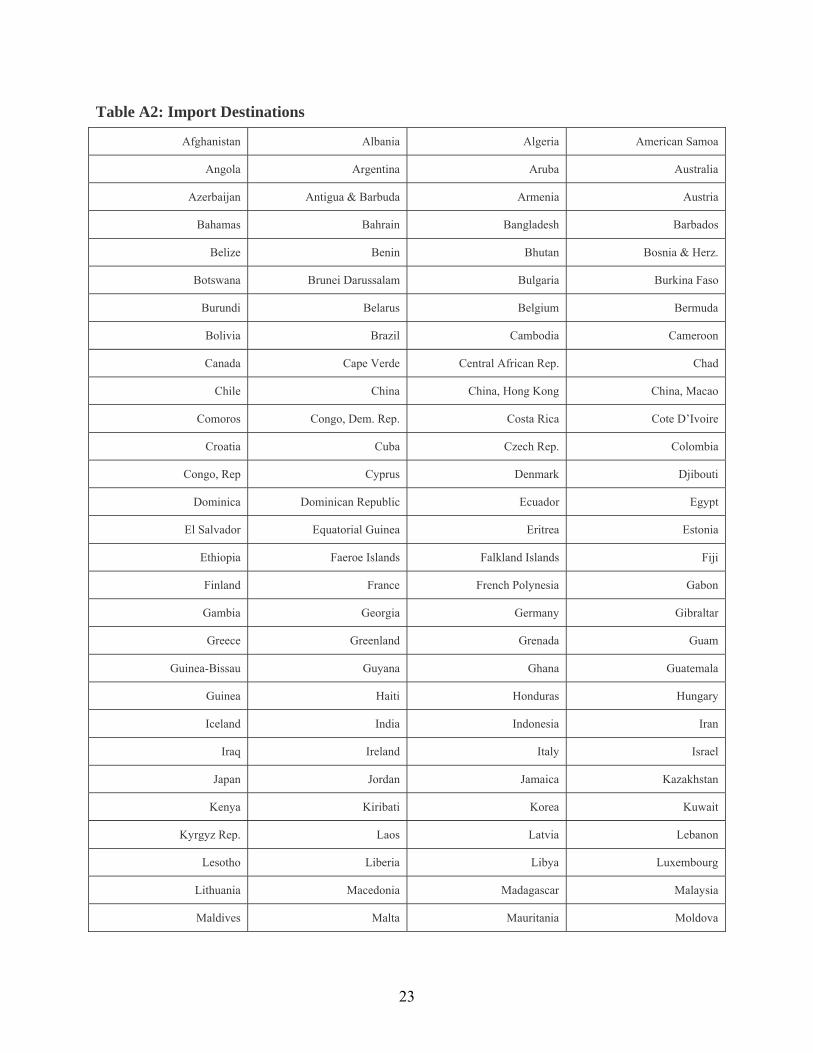
exporters (listed in Appendix Table A1) and 200 destination countries that the IMF includes
(listed in Appendix Table A2). (Not all the trading entities are “countries” in the traditional
sense of the word; for instance, most countries have consulates in Hong Kong, SAR China. I use
the word simply for convenience.)12
I gather data on the location of foreign missions from the export countries’ Foreign
Services. (I count an embassy and a separate chancery or consulate in the same city as a single
foreign mission; I also exclude honorary consulates.13) Unfortunately, it is only possible to
identify the exact number of individuals in a given embassy/consulate that are actively engaged
in export promotion for a small number of countries.14 Since there is no easy way to measure the
importance of different foreign missions, I am forced to treat them all as equal.15
Population and real GDP data per capita (in constant 1995 American dollars) have been
obtained from the online version of the World Bank’s World Development Indicators; holes were
filled with data from the online CIA World Factbook. 16 I also exploit the Factbook for a number
of country-specific variables. These include: latitude and longitude, land area, landlocked and
11 The 2002 CPI, as recorded in the 2004 Economic Report of the President Table B60 was 179.9; the 2003 CPI was 184. 12 I exclude a number of small entities because of data difficulties, including: Andorra, East Timor, Marshall Islands, Micronesia, Monaco, Palestine, Puerto Rico, San Marino, and the Vatican. I also exclude international organizations, and Taiwan, province of China. 13 The Netherlands is treated differently, for data availability reasons. The Netherlands states on its website (http://www.minbuza.nl/default.asp?CMS_ITEM=837443D4B4F640FEA322D347FD3BDA01X3X36627X13) that it has 110 embassies, 27 consulates-general, 15 permanent missions, and some 360 consulates headed by unpaid honorary consuls. I have been unable to determine which of the 52 consulates-general (http://www.minbuza.nl/default.asp?CMS_ITEM=MBZ456668) and numerous consulates (http://www.minbuza.nl/default.asp?CMS_ITEM=MBZ456418) are honorary. I err on the side of inclusiveness and include them all. I also exclude French “agence consulaires’ and American “consular agents.” 14 Belgium, Canada, the UK, and the USA provide this information for my sample. 15 Over 40% of potential exporter-destination pairs do not have any foreign missions. Thus, the 22 exporters I consider simply do not maintain foreign missions in a significant fraction of (mostly small) foreign countries. At the other end of the spectrum, Mexico maintains an embassy and 42 consulates inside the United States, while the Netherlands and Switzerland each maintain 27 foreign missions to the USA. 16 Available at http://www.odci.gov/cia/publications/factbook/index.html
10
island status, physically contiguous neighbors, language, colonizers, climate, and dates of
independence. I use these to create great-circle distance and the other controls. I add
information on whether the pair of countries was involved in a currency union, using Glick-Rose
(2002). I obtain data from the World Trade Organization to create an indicator of regional trade
agreements, and include sixteen RTAs, including: ASEAN, EEC/EC/EU; US-Israel FTA;
NAFTA; CARICOM; PATCRA; ANZCERTA; CACM, SPARTECA, Mercosur, Canada-Costa
Rica, US-Jordan, and Japan-Singapore.17 I initially assume that all RTA’s have the same effect
on trade, but check the sensitivity of this assumption.
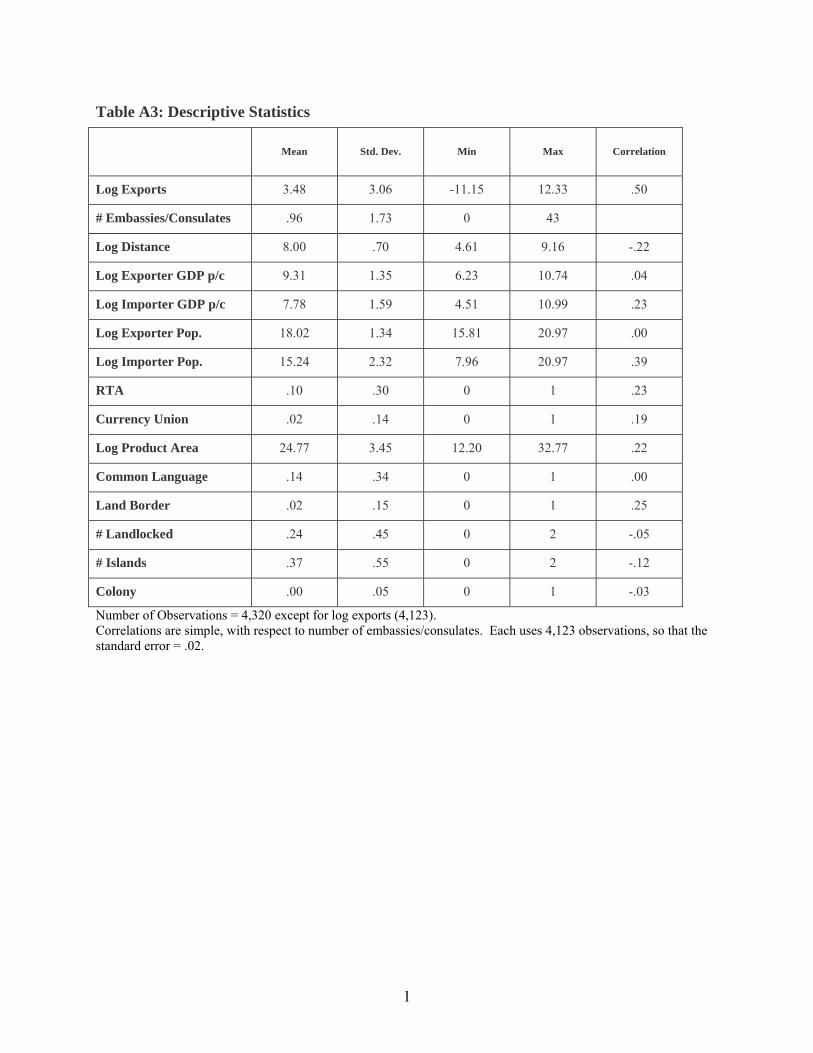
Descriptive statistics are provided in Appendix Table A3. I also tabulate the simple
correlation between the number of foreign missions and the other variables. The strongest
correlation between the number of foreign missions and other regressors (in particular, the log of
importer population) is only .39, indicating that multicollinearity is not likely to be a serious
problem.
4. Results
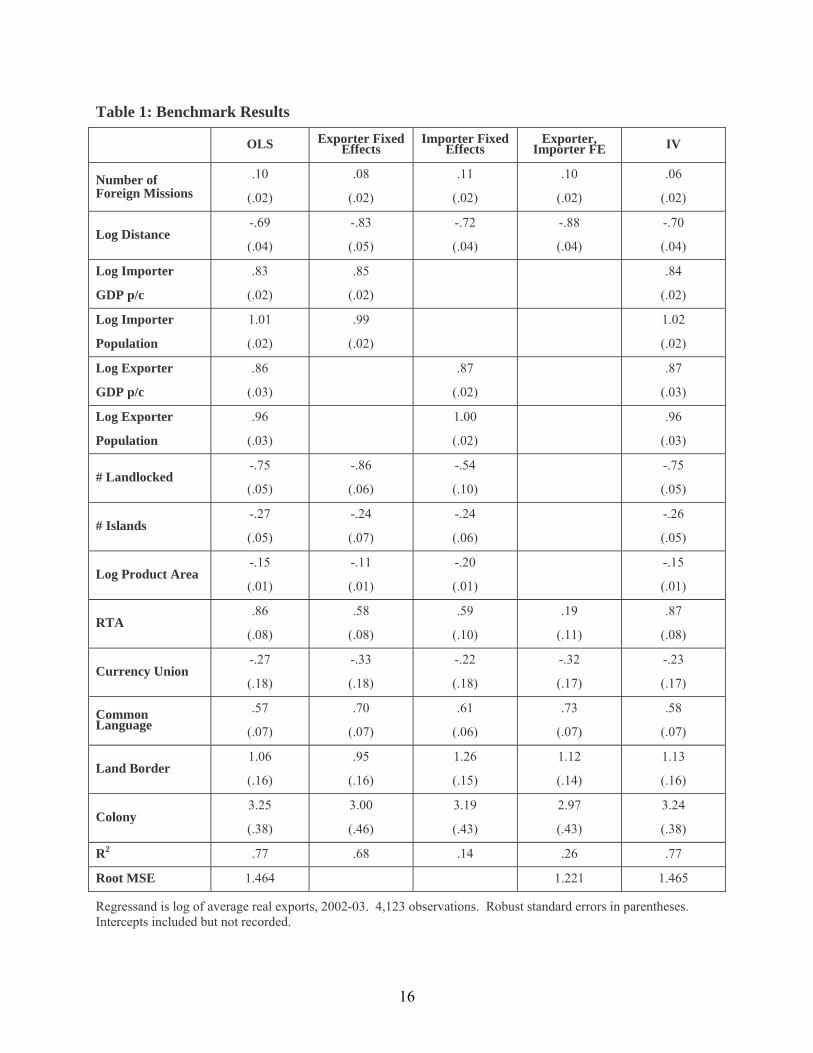
My benchmark results are tabulated in Table 1. This presents coefficients estimated in
five different ways: a) OLS; b)-d) adding exporter fixed effects, importer fixed effects, and both;
and e) using instrumental variables to account for reverse causality between exports and
embassies/consulates. The default instrumental variables I use for the number of
embassies/consulates in an importer include: a) the number of Zagat’s guides in an importer; b)
17 Available at http://www.wto.org/english/tratop_e/region_e/region_e.htm.
11
the number of Condé-Nast Top 100 destinations; c) the number of Lonely Planet guides; d) the
number of Economist city guides/importer; and e) proven oil reserves.
The gravity model of exports that underlies the estimation works well in two senses.
First, the model fits the data well, explaining over three quarters of the variation in bilateral
exports. Second, the coefficients are, on the whole, intuitive in sign and size, and both
economically and statistically significant. For instance, countries export less to destinations that
are further away; the elasticity is about -.75 and highly statistically significant. Richer and larger
exporters and importers do more business, as do countries linked by regional trade agreements, a
land border, or a common language. Landlocked and physically large countries do less trade;
colonies trade more with their colonizers. All this is conventional, reasonable, and bolsters
confidence in the underlying framework.
Above and beyond these effects, there is still a role for the Foreign Service. In particular,
each additional consulate placed abroad is associated with a rise of bilateral exports of between
six and ten per cent. This estimate seems economically plausible, but is small compared to the
effects of e.g., a common language, land border, or regional trade agreement. The effect differs
only a little across estimation techniques. Least squares gives an estimate of about ten per cent
with little variation depending on whether fixed effects are added or not.18 Instrumental
variables delivers a lower estimate, but one that is still statistically significant (the associated t-
statistic is 3.1); I consider this in further detail below.
18 It is not possible to compute sensible Hausman tests and compare the least-squares estimates; the chi-squared test statistics are negative. This is because the variance matrices do not satisfy the (asymptotic) ‘overlap” conditions in the sample. However, the coefficient of interest, γ, is economically and statistically similar when least squares is used for all sets of fixed effects (none/exporter/importer/both).
12
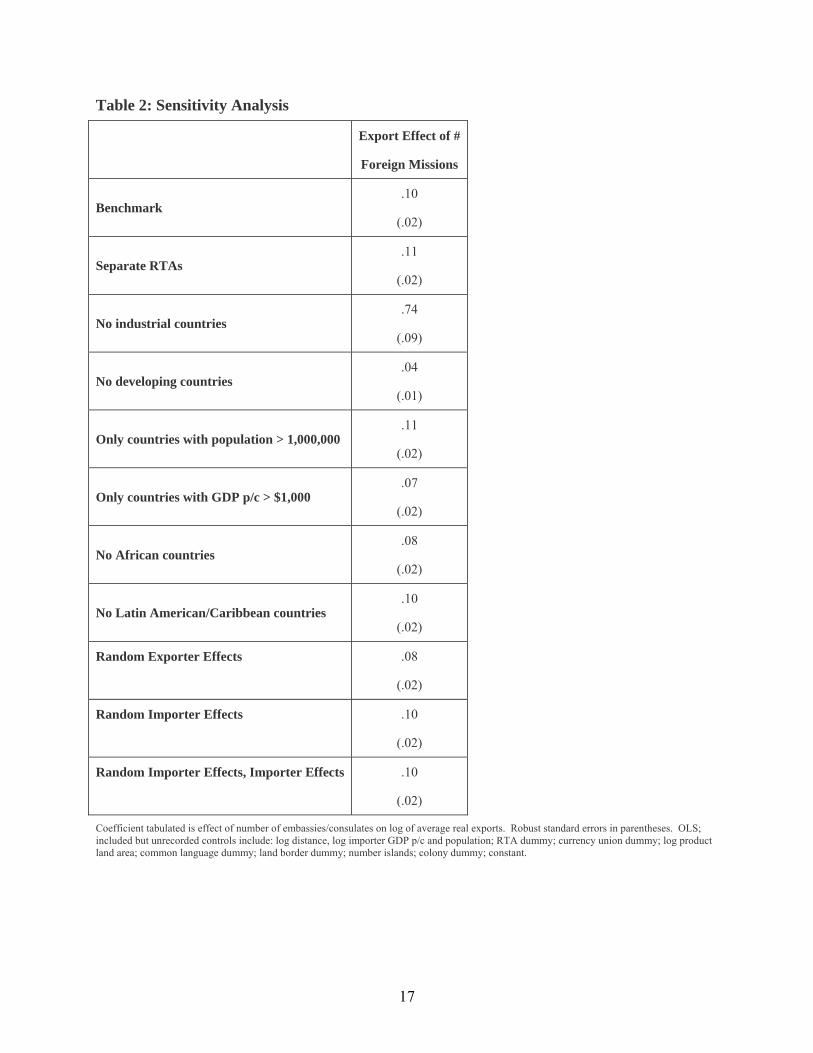
Table 2 provides sensitivity analysis. I tabulate the benchmark pooled OLS result at the
top for convenience, and ten additional perturbations of the basic estimation. First, I loosen the
constraint that all (sixteen) different regional trade agreements have a common effect by
allowing for RTA-specific slopes. Next I drop all industrial countries from the sample, then all
developing countries.19 I then drop all countries with populations of less than one million, then
all countries with annual GDP per capita of less than $1,000. I consider two regional checks,
dropping all African countries, then all countries from Latin America or the Caribbean. Finally I
use random effects (instead of fixed effects) for exporters, importers, and both. None of these
robustness checks has any substantial effect on the slope except the (somewhat contrived)
exercise of dropping all industrial countries. The effect remains positive and statistically
significant throughout, though it is typically modest in size.
Although the point estimates for OLS and IV were similar in Table 1, the issue of reverse
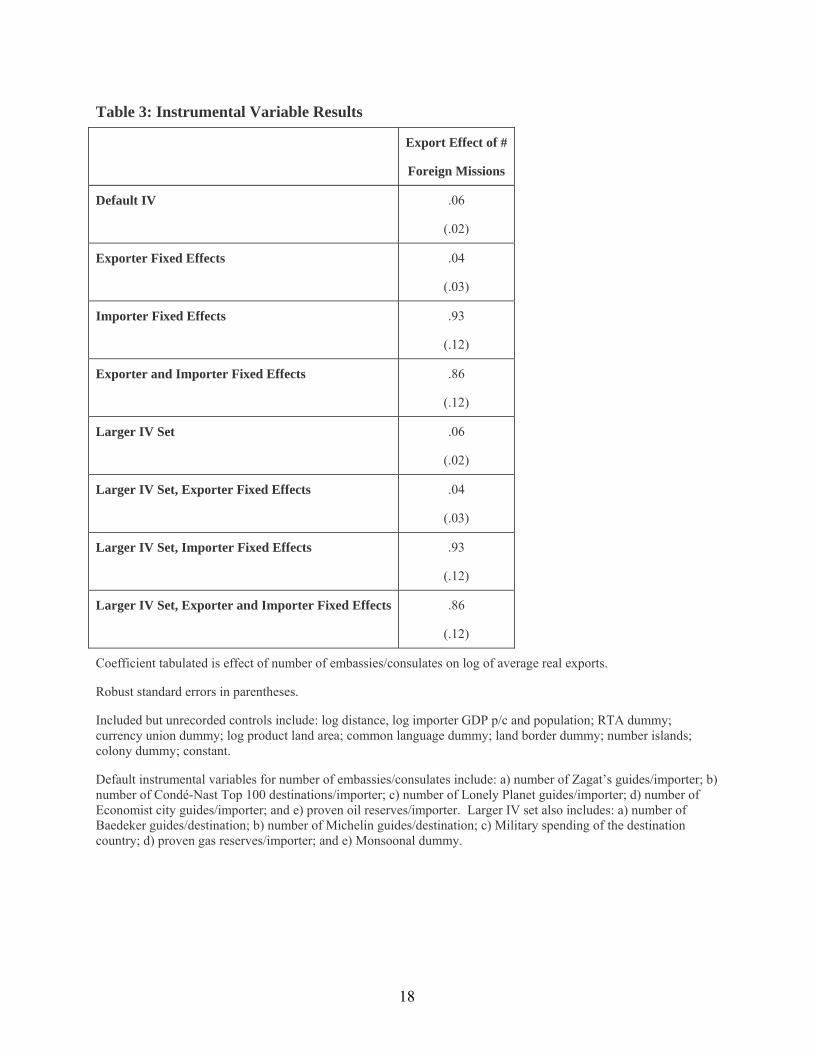
causality is potentially serious and deserves further attention. In Table 3, I provide eight
different sets of instrumental variable estimates. First, I reproduce the IV estimate of γ tabulated
in Table 1. I then add exporter-specific fixed effect intercepts, the importer analogues, and then
both together. In the lower half of the table, I use a larger set of instrumental variables, adding
an additional five to the original set of five IVs; again, I report the results for four different
combinations of fixed effects. I consistently estimate the effect of foreign missions on exports to
be positive. Without any fixed effects the effect is about half that of least squares (five to six per
cent), and statistically distinguishable from zero. It is somewhat smaller and statistically
marginal when I include exporter intercepts. However, the effect is much more significant (in
19 I follow the IMF in equating industrial countries with those whose IFS code is less than two hundred. Thus my sample of industrial countries is: USA; UK; Austria; Belgium; Denmark; France; Germany; Italy; Luxembourg;
13
both the economic and statistical senses) when destination fixed effects are included, with or
without exporter intercepts.20 The exact choice of instrumental variables does not seem to matter
greatly. I conclude that accounting for reverse causality does not destroy my results.21 Rather
than take the IV results with importer fixed effects literally, I take a conservative approach below
and try to interpret the size of the coefficient of interest cautiously.22
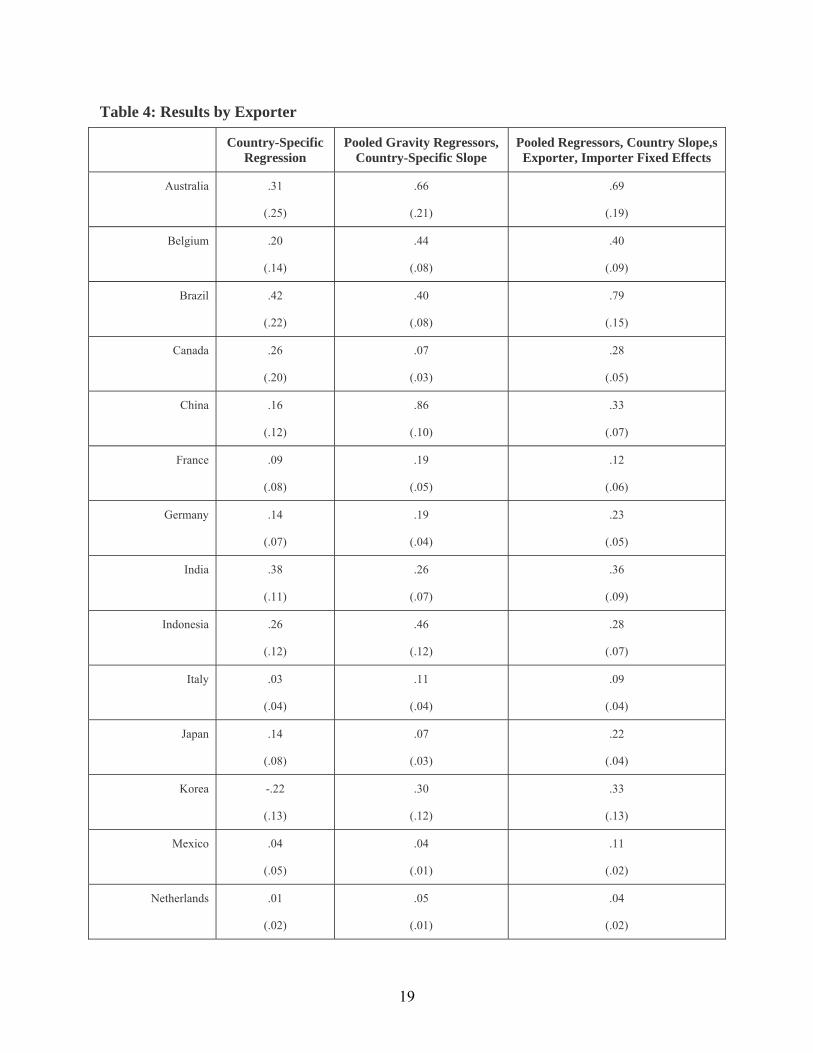
The results in Tables 1-3 pool all the data across both exporters and destination countries.
However, they may disguise cross-country heterogeneity in the effect of foreign missions on
exports. Table 4 takes account of country-specific coefficients in three different ways. At the
left is a set of estimate of γ – the effect of foreign missions on exports – when I estimate the
equation country by country. Most of the effects are positive, and they differ dramatically across
countries. Still, the coefficient is usually estimated without precision. Accordingly, in the
middle column I pool the data again, but allow for country-specific slopes. Thus, the nuisance
coefficients are constrained to be common across countries, but each country is allowed its own
slope for the effect of foreign missions on trade (country-specific γ’s). There is still evidence of
substantial heterogeneity (and indeed the hypothesis of a common γ slope is rejected by the data),
though estimation precision remains typically poor. This is also true of the last column on the
right, which pools nuisance coefficients across countries (as with the middle column), but adds
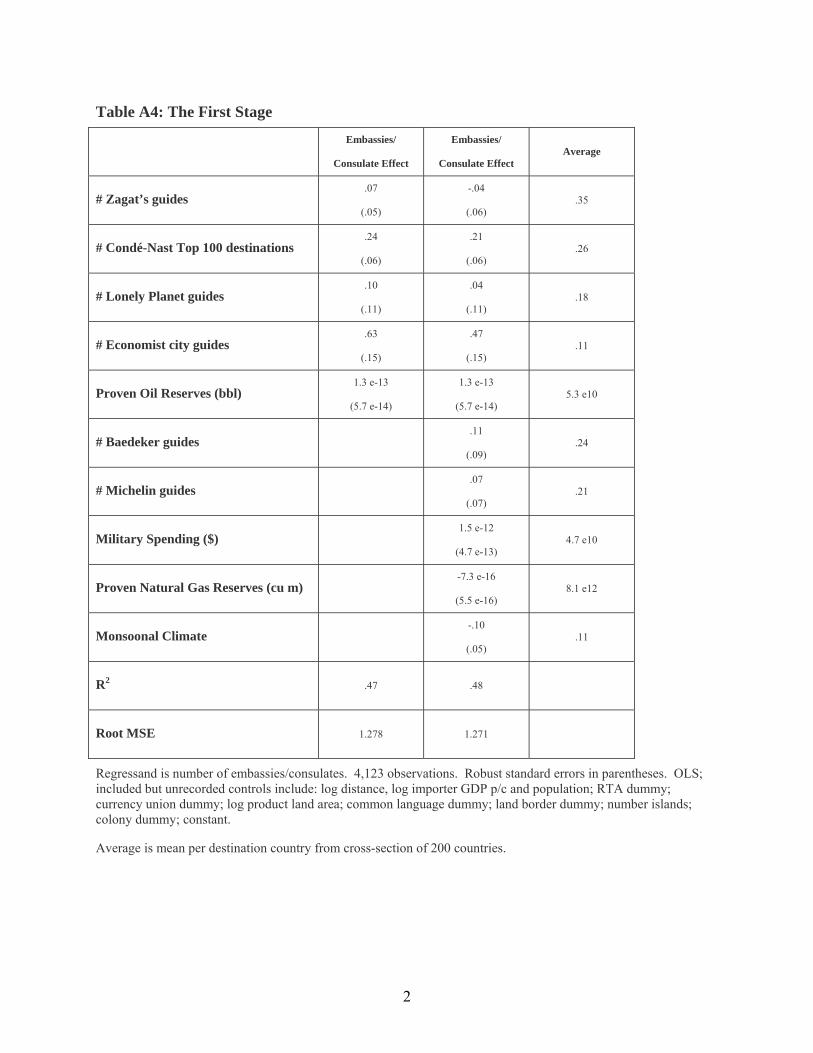
Netherlands; Norway; Sweden; Switzerland; Canada; Japan; Finland; Greece; Iceland; Ireland; Malta; Portugal; Spain; Turkey; Australia; New Zealand; and South Africa. 20 Again, Hausman tests are not possible because of small-sample issues. However, it is clear that adding importer fixed effects makes for an enormous difference in the coefficient of interest, when IV is used as an estimator. 21 In Appendix Table A4 I present the estimates of the first stage estimation (without fixed effects). These show that the most successful plausibly exogenous determinants of the number of foreign missions are: a) the number of top-100 Condé-Nast destinations in a country; b) the number of Economist city-guides; c) proven oil reserves; d) military spending; and e) the presence of a monsoonal climate. 22 This is especially appropriate since my equation is over-identified but does not pass a standard Sargan test of the over-identifying restrictions.

14
exporter- and importer-specific intercepts. The effect of foreign missions on trade seems to vary
considerably across exporters.
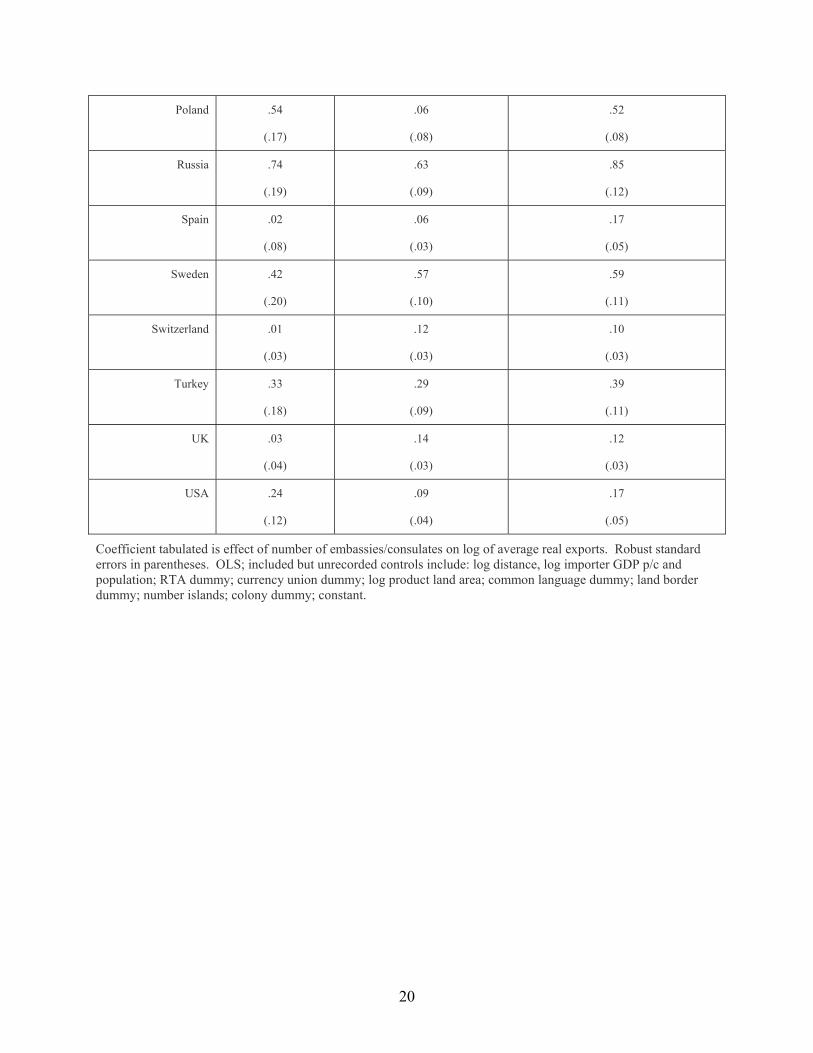
In Table 5 I investigate whether the first foreign mission in a country – almost always the
embassy – has a different effect on exports from additional missions.23 I test for a non-linear
effect of foreign missions on exports in two different ways. First, I include in the equation a
binary dummy variable for the first foreign mission in a country (denoted “Embassy”), as well as
a separate variable for the number of missions after the first, if any (denoted “Consulates”). I
estimate this equation with pooled OLS, and then successively add exporter-fixed effects,
importer intercepts, and both together. Then I re-estimate the equations in the same four ways,
adding the square of the number of foreign missions after the first (“Square of Consulates”).
The results show strong evidence of a non-linear effect of the number of foreign missions
on exports. The establishment of a first foreign mission is associated with a substantial effect on
trade. While the exact estimate of γ varies somewhat depending on which econometric
specification is preferred, the creation of an embassy is associated with at least an increase in
exports of [exp(.79)-1≈] 120 per cent. Some of this is undoubtedly the result of reverse
causality, but the size of the effect is striking.24 Additional consulates, by way of comparison,
have a much smaller export effect, on the order of five to eleven per cent. Even this effect seems
to fall as consulates are added, as shown by the fact that the square of the number of consulates is
significantly negative. Succinctly, the effect of the first foreign mission on exports is large, but
the effect from additional consulates seems to diminish rapidly.
23 While some countries (e.g., Indonesia) have consulates (e.g., in Ecuador) where there is no embassy, this is rare.
15
5. Conclusion
In this short paper, I ask a simple question: is the presence of foreign missions
systematically linked to a country’s exports? Using a bilateral gravity model of trade, the answer
is positive; holding other factors constant, exports seems to rise between six and ten per cent for
each additional consulate.
I find evidence that the creation of the embassy has a substantially larger impact on
exports than additional consulates. This non-linearity, along with the cross-country
heterogeneity, and reverse causality I have found are all technical issues that merit further
research. There is also an interesting economic issue that I have not attempted to address.
Embassies, consulates and the like purport to do a host of functions; this paper has considered
only one. Are the benefits of any trade creation sufficient to justify any reasonable fraction of
the costs of the Foreign Service? I leave such question for others to address in future research.
24 Accounting for reverse causality in the location of embassies (as opposed to the number of foreign missions) would be a worthwhile exercise.
16
Table 1: Benchmark Results
OLS Exporter Fixed Effects
Importer Fixed Effects
Exporter, Importer FE IV
Number of Foreign Missions
.10
(.02)
.08
(.02)
.11
(.02)
.10
(.02)
.06
(.02)
Log Distance -.69
(.04)
-.83
(.05)
-.72
(.04)
-.88
(.04)
-.70
(.04)
Log Importer
GDP p/c
.83
(.02)
.85
(.02)
.84
(.02)
Log Importer
Population
1.01
(.02)
.99
(.02)
1.02
(.02)
Log Exporter
GDP p/c
.86
(.03)
.87
(.02)
.87
(.03)
Log Exporter
Population
.96
(.03)
1.00
(.02)
.96
(.03)
# Landlocked -.75
(.05)
-.86
(.06)
-.54
(.10)
-.75
(.05)
# Islands -.27
(.05)
-.24
(.07)
-.24
(.06)
-.26
(.05)
Log Product Area -.15
(.01)
-.11
(.01)
-.20
(.01)
-.15
(.01)
RTA .86
(.08)
.58
(.08)
.59
(.10)
.19
(.11)
.87
(.08)
Currency Union -.27
(.18)
-.33
(.18)
-.22
(.18)
-.32
(.17)
-.23
(.17)
Common Language
.57
(.07)
.70
(.07)
.61
(.06)
.73
(.07)
.58
(.07)
Land Border 1.06
(.16)
.95
(.16)
1.26
(.15)
1.12
(.14)
1.13
(.16)
Colony 3.25
(.38)
3.00
(.46)
3.19
(.43)
2.97
(.43)
3.24
(.38)
R2 .77 .68 .14 .26 .77
Root MSE 1.464 1.221 1.465
Regressand is log of average real exports, 2002-03. 4,123 observations. Robust standard errors in parentheses. Intercepts included but not recorded.
17
Table 2: Sensitivity Analysis
Export Effect of #
Foreign Missions
Benchmark .10
(.02)
Separate RTAs .11
(.02)
No industrial countries .74
(.09)
No developing countries .04
(.01)
Only countries with population > 1,000,000 .11
(.02)
Only countries with GDP p/c > $1,000 .07
(.02)
No African countries .08
(.02)
No Latin American/Caribbean countries .10
(.02)
Random Exporter Effects .08
(.02)
Random Importer Effects .10
(.02)
Random Importer Effects, Importer Effects .10
(.02)
Coefficient tabulated is effect of number of embassies/consulates on log of average real exports. Robust standard errors in parentheses. OLS; included but unrecorded controls include: log distance, log importer GDP p/c and population; RTA dummy; currency union dummy; log product land area; common language dummy; land border dummy; number islands; colony dummy; constant.
18
Table 3: Instrumental Variable Results
Export Effect of #
Foreign Missions
Default IV .06
(.02)
Exporter Fixed Effects .04
(.03)
Importer Fixed Effects .93
(.12)
Exporter and Importer Fixed Effects .86
(.12)
Larger IV Set .06
(.02)
Larger IV Set, Exporter Fixed Effects .04
(.03)
Larger IV Set, Importer Fixed Effects .93
(.12)
Larger IV Set, Exporter and Importer Fixed Effects .86
(.12)
Coefficient tabulated is effect of number of embassies/consulates on log of average real exports.
Robust standard errors in parentheses.
Included but unrecorded controls include: log distance, log importer GDP p/c and population; RTA dummy; currency union dummy; log product land area; common language dummy; land border dummy; number islands; colony dummy; constant.
Default instrumental variables for number of embassies/consulates include: a) number of Zagat’s guides/importer; b) number of Condé-Nast Top 100 destinations/importer; c) number of Lonely Planet guides/importer; d) number of Economist city guides/importer; and e) proven oil reserves/importer. Larger IV set also includes: a) number of Baedeker guides/destination; b) number of Michelin guides/destination; c) Military spending of the destination country; d) proven gas reserves/importer; and e) Monsoonal dummy.
19
Table 4: Results by Exporter
Country-Specific Regression
Pooled Gravity Regressors, Country-Specific Slope
Pooled Regressors, Country Slope,s Exporter, Importer Fixed Effects
Australia .31
(.25)
.66
(.21)
.69
(.19)
Belgium .20
(.14)
.44
(.08)
.40
(.09)
Brazil .42
(.22)
.40
(.08)
.79
(.15)
Canada .26
(.20)
.07
(.03)
.28
(.05)
China .16
(.12)
.86
(.10)
.33
(.07)
France .09
(.08)
.19
(.05)
.12
(.06)
Germany .14
(.07)
.19
(.04)
.23
(.05)
India .38
(.11)
.26
(.07)
.36
(.09)
Indonesia .26
(.12)
.46
(.12)
.28
(.07)
Italy .03
(.04)
.11
(.04)
.09
(.04)
Japan .14
(.08)
.07
(.03)
.22
(.04)
Korea -.22
(.13)
.30
(.12)
.33
(.13)
Mexico .04
(.05)
.04
(.01)
.11
(.02)
Netherlands .01
(.02)
.05
(.01)
.04
(.02)
20
Poland .54
(.17)
.06
(.08)
.52
(.08)
Russia .74
(.19)
.63
(.09)
.85
(.12)
Spain .02
(.08)
.06
(.03)
.17
(.05)
Sweden .42
(.20)
.57
(.10)
.59
(.11)
Switzerland .01
(.03)
.12
(.03)
.10
(.03)
Turkey .33
(.18)
.29
(.09)
.39
(.11)
UK .03
(.04)
.14
(.03)
.12
(.03)
USA .24
(.12)
.09
(.04)
.17
(.05)
Coefficient tabulated is effect of number of embassies/consulates on log of average real exports. Robust standard errors in parentheses. OLS; included but unrecorded controls include: log distance, log importer GDP p/c and population; RTA dummy; currency union dummy; log product land area; common language dummy; land border dummy; number islands; colony dummy; constant.
21
Table 5: Separate Embassy and Consulate Effects
Embassy Consulates Square of Consulates
Default 1.03
(.07)
.06
(.01)
Exporter Fixed Effects .98
(.06)
.05
(.02)
Importer Fixed Effects .78
(.06)
.05
(.02)
Exporter and Importer Fixed Effects .78
(.06)
.06
(.02)
Default 1.03
(.07)
.11
(.02)
-.003
(.001)
Exporter Fixed Effects .99
(.06)
.09
(.03)
-.002
(.001)
Importer Fixed Effects .78
(.06)
.11
(.03)
-.003
(.001)
Exporter and Importer Fixed Effects .78
(.06)
.10
(.03)
-.002
(.001)
Coefficient tabulated is effect of embassies/consulates on log of average real exports. Robust standard errors in parentheses. OLS; included but unrecorded controls include: log distance, log importer GDP p/c and population; RTA dummy; currency union dummy; log product land area; common language dummy; land border dummy; number islands; colony dummy; constant.
22
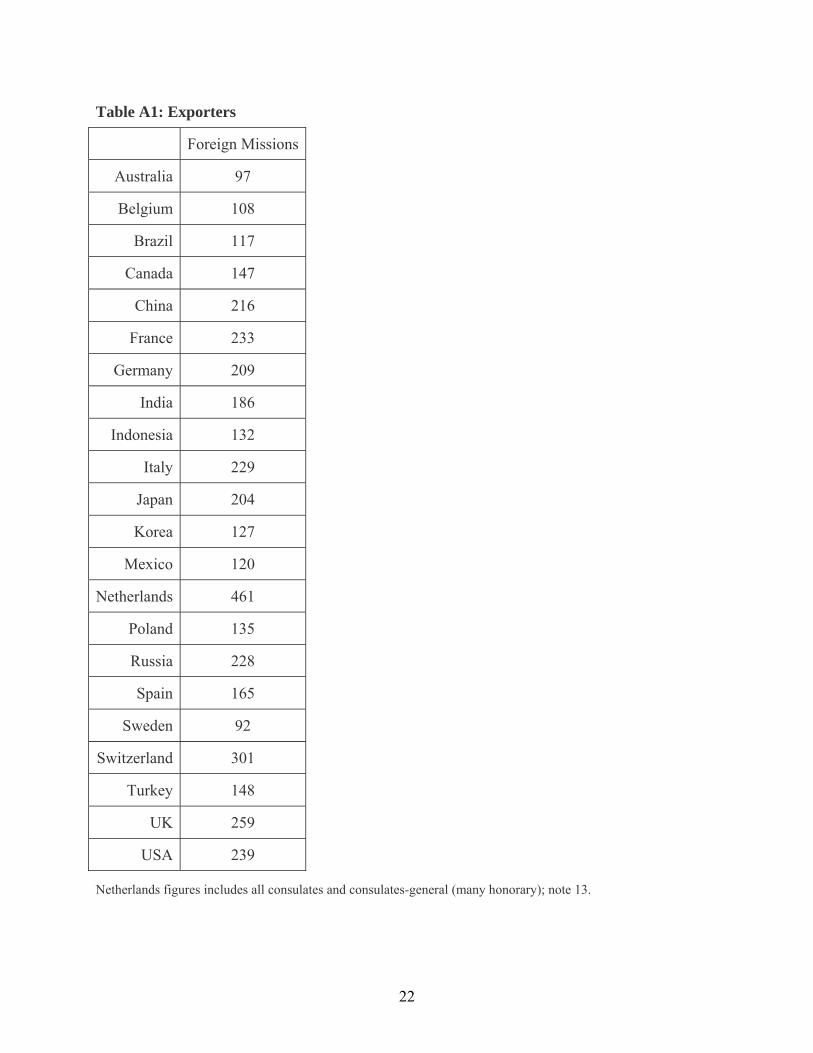
Table A1: Exporters
Foreign Missions
Australia 97
Belgium 108
Brazil 117
Canada 147
China 216
France 233
Germany 209
India 186
Indonesia 132
Italy 229
Japan 204
Korea 127
Mexico 120
Netherlands 461
Poland 135
Russia 228
Spain 165
Sweden 92
Switzerland 301
Turkey 148
UK 259
USA 239
Netherlands figures includes all consulates and consulates-general (many honorary); note 13.
23
Table A2: Import Destinations
Afghanistan Albania Algeria American Samoa
Angola Argentina Aruba Australia
Azerbaijan Antigua & Barbuda Armenia Austria
Bahamas Bahrain Bangladesh Barbados
Belize Benin Bhutan Bosnia & Herz.
Botswana Brunei Darussalam Bulgaria Burkina Faso
Burundi Belarus Belgium Bermuda
Bolivia Brazil Cambodia Cameroon
Canada Cape Verde Central African Rep. Chad
Chile China China, Hong Kong China, Macao
Comoros Congo, Dem. Rep. Costa Rica Cote D’Ivoire
Croatia Cuba Czech Rep. Colombia
Congo, Rep Cyprus Denmark Djibouti
Dominica Dominican Republic Ecuador Egypt
El Salvador Equatorial Guinea Eritrea Estonia
Ethiopia Faeroe Islands Falkland Islands Fiji
Finland France French Polynesia Gabon
Gambia Georgia Germany Gibraltar
Greece Greenland Grenada Guam
Guinea-Bissau Guyana Ghana Guatemala
Guinea Haiti Honduras Hungary
Iceland India Indonesia Iran
Iraq Ireland Italy Israel
Japan Jordan Jamaica Kazakhstan
Kenya Kiribati Korea Kuwait
Kyrgyz Rep. Laos Latvia Lebanon
Lesotho Liberia Libya Luxembourg
Lithuania Macedonia Madagascar Malaysia
Maldives Malta Mauritania Moldova
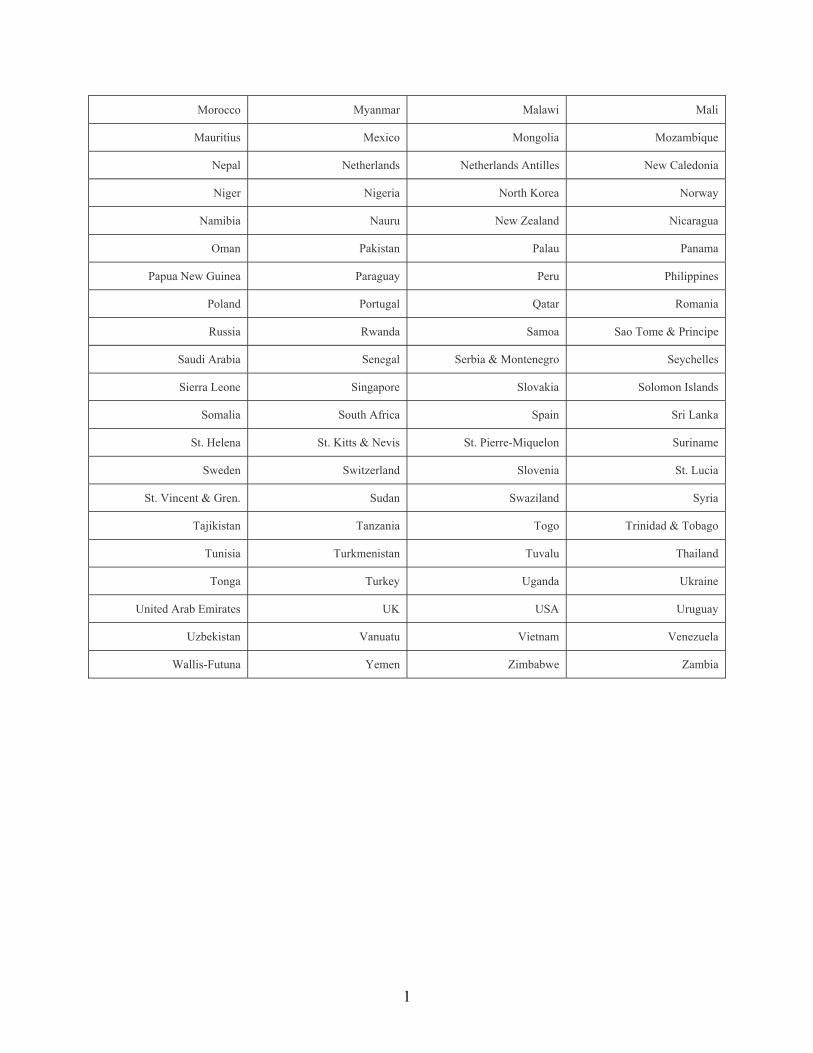
1
Morocco Myanmar Malawi Mali
Mauritius Mexico Mongolia Mozambique
Nepal Netherlands Netherlands Antilles New Caledonia
Niger Nigeria North Korea Norway
Namibia Nauru New Zealand Nicaragua
Oman Pakistan Palau Panama
Papua New Guinea Paraguay Peru Philippines
Poland Portugal Qatar Romania
Russia Rwanda Samoa Sao Tome & Principe
Saudi Arabia Senegal Serbia & Montenegro Seychelles
Sierra Leone Singapore Slovakia Solomon Islands
Somalia South Africa Spain Sri Lanka
St. Helena St. Kitts & Nevis St. Pierre-Miquelon Suriname
Sweden Switzerland Slovenia St. Lucia
St. Vincent & Gren. Sudan Swaziland Syria
Tajikistan Tanzania Togo Trinidad & Tobago
Tunisia Turkmenistan Tuvalu Thailand
Tonga Turkey Uganda Ukraine
United Arab Emirates UK USA Uruguay
Uzbekistan Vanuatu Vietnam Venezuela
Wallis-Futuna Yemen Zimbabwe Zambia
1
Table A3: Descriptive Statistics
Mean Std. Dev. Min Max Correlation
Log Exports 3.48 3.06 -11.15 12.33 .50
# Embassies/Consulates .96 1.73 0 43
Log Distance 8.00 .70 4.61 9.16 -.22
Log Exporter GDP p/c 9.31 1.35 6.23 10.74 .04
Log Importer GDP p/c 7.78 1.59 4.51 10.99 .23
Log Exporter Pop. 18.02 1.34 15.81 20.97 .00
Log Importer Pop. 15.24 2.32 7.96 20.97 .39
RTA .10 .30 0 1 .23
Currency Union .02 .14 0 1 .19
Log Product Area 24.77 3.45 12.20 32.77 .22
Common Language .14 .34 0 1 .00
Land Border .02 .15 0 1 .25
# Landlocked .24 .45 0 2 -.05
# Islands .37 .55 0 2 -.12
Colony .00 .05 0 1 -.03
Number of Observations = 4,320 except for log exports (4,123). Correlations are simple, with respect to number of embassies/consulates. Each uses 4,123 observations, so that the standard error = .02.
2
Table A4: The First Stage
Embassies/
Consulate Effect
Embassies/
Consulate Effect Average
# Zagat’s guides .07
(.05)
-.04
(.06) .35
# Condé-Nast Top 100 destinations .24
(.06)
.21
(.06) .26
# Lonely Planet guides .10
(.11)
.04
(.11) .18
# Economist city guides .63
(.15)
.47
(.15) .11
Proven Oil Reserves (bbl) 1.3 e-13
(5.7 e-14)
1.3 e-13
(5.7 e-14) 5.3 e10
# Baedeker guides .11
(.09) .24
# Michelin guides .07
(.07) .21
Military Spending ($) 1.5 e-12
(4.7 e-13) 4.7 e10
Proven Natural Gas Reserves (cu m) -7.3 e-16
(5.5 e-16) 8.1 e12
Monsoonal Climate -.10
(.05) .11
R2 .47 .48
Root MSE 1.278 1.271
Regressand is number of embassies/consulates. 4,123 observations. Robust standard errors in parentheses. OLS; included but unrecorded controls include: log distance, log importer GDP p/c and population; RTA dummy; currency union dummy; log product land area; common language dummy; land border dummy; number islands; colony dummy; constant.
Average is mean per destination country from cross-section of 200 countries.

3
REFERENCES Anderson, J. and E. van Wincoop (2003) “Gravity with Gravitas: A Solution to the Border
Puzzle” American Economic Review 93-1, 170-192. Glick, R. and A.K. Rose (2002) “Does a Currency Union affect Trade? The Time-Series
Evidence” European Economic Review 46-6, 1125-1151.