Embed Size (px)
Citation preview
_____________________________________________________________________________________________________ *Corresponding author: Email: [email protected];
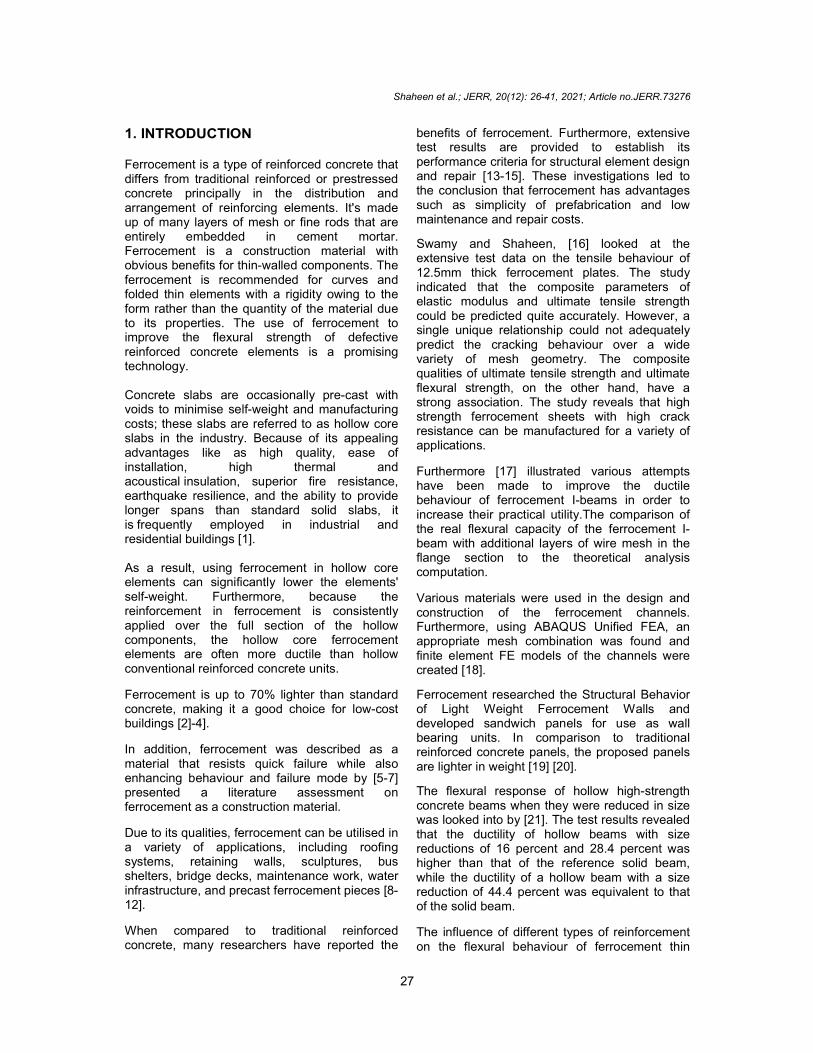
Journal of Engineering Research and Reports
20(12): 26-41, 2021; Article no.JERR.73276 ISSN: 2582-2926
The Flexural Behavior of Ferrocement Composite Hollow-Cored Sections
Yousry B. I. Shaheen1, Zeinab A. Etman1,2 and Aya M. Elrefy2*
1Department of Civil Engineering, Faculty of Engineering, Menoufia University, Egypt.
2Department of Civil Engineering, Higher Institute of Engineering and Technology, Menoufia, Egypt.
Authors’ contributions
This work was carried out in collaboration among all authors. All authors read and approved the final manuscript.
Article Information
DOI: 10.9734/JERR/2021/v20i1217418
Editor(s): (1) Dr. P. Elangovan, SRM TRP Engineering College, India.
Reviewers: (1) Noah Pierre Marcel anicet, University of Douala, Cameroon.
(2) Yan Han, North China University of Technology, China. Complete Peer review History: https://www.sdiarticle4.com/review-history/73276
Received 22 June 2021 Accepted 28 August 2021 Published 30 August 2021
ABSTRACT
This study will study the influence of several types of metal and non-metal mesh reinforcement materials on the flexural behavior of reinforced concrete hollow-cored sections as a viable alternative to traditional reinforced concrete sections. Compared with the traditional reinforced concrete part, the weight of the test part is lighter. In order to strengthen these hollow-cored sections, three types of steel mesh, Welded wire mesh, expanded steel wire mesh and tenax mesh with various layers are used. An intensive experiment plan was carried out on the test samples. Ten slabs with dimensions of 500 mm*2000 mm*120 mm were cast and tested until they failed under flexural load. Record and observe the deformation characteristics and cracking behavior of each sample during the loading process. According to the results, high ultimate load and serviceability load, crack resistance control, high ductility and strong energy absorption characteristics have been obtained. This has the chance to be a true construction benefit to developed and poor countries. The use of double-layer of expanded steel mesh as the additional reinforcement of the main steel can achieve the best performance of the reinforced concrete hollow-cored section.
Keywords: Hollow core slab; ferrocement; composite materials; expanded; welded; tenax.
Original Research Article
Shaheen et al.; JERR, 20(12): 26-41, 2021; Article no.JERR.73276
27
1. INTRODUCTION Ferrocement is a type of reinforced concrete that differs from traditional reinforced or prestressed concrete principally in the distribution and arrangement of reinforcing elements. It's made up of many layers of mesh or fine rods that are entirely embedded in cement mortar. Ferrocement is a construction material with obvious benefits for thin-walled components. The ferrocement is recommended for curves and folded thin elements with a rigidity owing to the form rather than the quantity of the material due to its properties. The use of ferrocement to improve the flexural strength of defective reinforced concrete elements is a promising technology. Concrete slabs are occasionally pre-cast with voids to minimise self-weight and manufacturing costs; these slabs are referred to as hollow core slabs in the industry. Because of its appealing advantages like as high quality, ease of installation, high thermal and acoustical insulation, superior fire resistance, earthquake resilience, and the ability to provide longer spans than standard solid slabs, it is frequently employed in industrial and residential buildings [1]. As a result, using ferrocement in hollow core elements can significantly lower the elements' self-weight. Furthermore, because the reinforcement in ferrocement is consistently applied over the full section of the hollow components, the hollow core ferrocement elements are often more ductile than hollow conventional reinforced concrete units.
Ferrocement is up to 70% lighter than standard concrete, making it a good choice for low-cost buildings [2]-4].
In addition, ferrocement was described as a material that resists quick failure while also enhancing behaviour and failure mode by [5-7] presented a literature assessment on ferrocement as a construction material.
Due to its qualities, ferrocement can be utilised in a variety of applications, including roofing systems, retaining walls, sculptures, bus shelters, bridge decks, maintenance work, water infrastructure, and precast ferrocement pieces [8-12].
When compared to traditional reinforced concrete, many researchers have reported the
benefits of ferrocement. Furthermore, extensive test results are provided to establish its performance criteria for structural element design and repair [13-15]. These investigations led to the conclusion that ferrocement has advantages such as simplicity of prefabrication and low maintenance and repair costs.
Swamy and Shaheen, [16] looked at the extensive test data on the tensile behaviour of 12.5mm thick ferrocement plates. The study indicated that the composite parameters of elastic modulus and ultimate tensile strength could be predicted quite accurately. However, a single unique relationship could not adequately predict the cracking behaviour over a wide variety of mesh geometry. The composite qualities of ultimate tensile strength and ultimate flexural strength, on the other hand, have a strong association. The study reveals that high strength ferrocement sheets with high crack resistance can be manufactured for a variety of applications.
Furthermore [17] illustrated various attempts have been made to improve the ductile behaviour of ferrocement I-beams in order to increase their practical utility.The comparison of the real flexural capacity of the ferrocement I-beam with additional layers of wire mesh in the flange section to the theoretical analysis computation.
Various materials were used in the design and construction of the ferrocement channels. Furthermore, using ABAQUS Unified FEA, an appropriate mesh combination was found and finite element FE models of the channels were created [18].
Ferrocement researched the Structural Behavior of Light Weight Ferrocement Walls and developed sandwich panels for use as wall bearing units. In comparison to traditional reinforced concrete panels, the proposed panels are lighter in weight [19] [20].
The flexural response of hollow high-strength concrete beams when they were reduced in size was looked into by [21]. The test results revealed that the ductility of hollow beams with size reductions of 16 percent and 28.4 percent was higher than that of the reference solid beam, while the ductility of a hollow beam with a size reduction of 44.4 percent was equivalent to that of the solid beam.
The influence of different types of reinforcement on the flexural behaviour of ferrocement thin
Shaheen et al.; JERR, 20(12): 26-41, 2021; Article no.JERR.73276
28
hollow core slabs with embedded PVC pipes was studied utilising an experimental inquiry [22]. The slab reinforced with simply macro steel fibres had the maximum flexural strength, whereas the slab reinforced with steel bars had the highest rigidity and the lowest deflection of all the slabs tested.
An experimental Study on the Flexural Behavior of Hollow Core Concrete Slabs was conducted by [23]. The study indicates that the traditional flexural capacity equation for solid concrete slabs may accurately predict the flexural capacity of hollow core concrete slabs by± 19 percent. Hollow core concrete slabs also have much superior load-deflection behavior and serviceability than traditional solid concrete slabs.
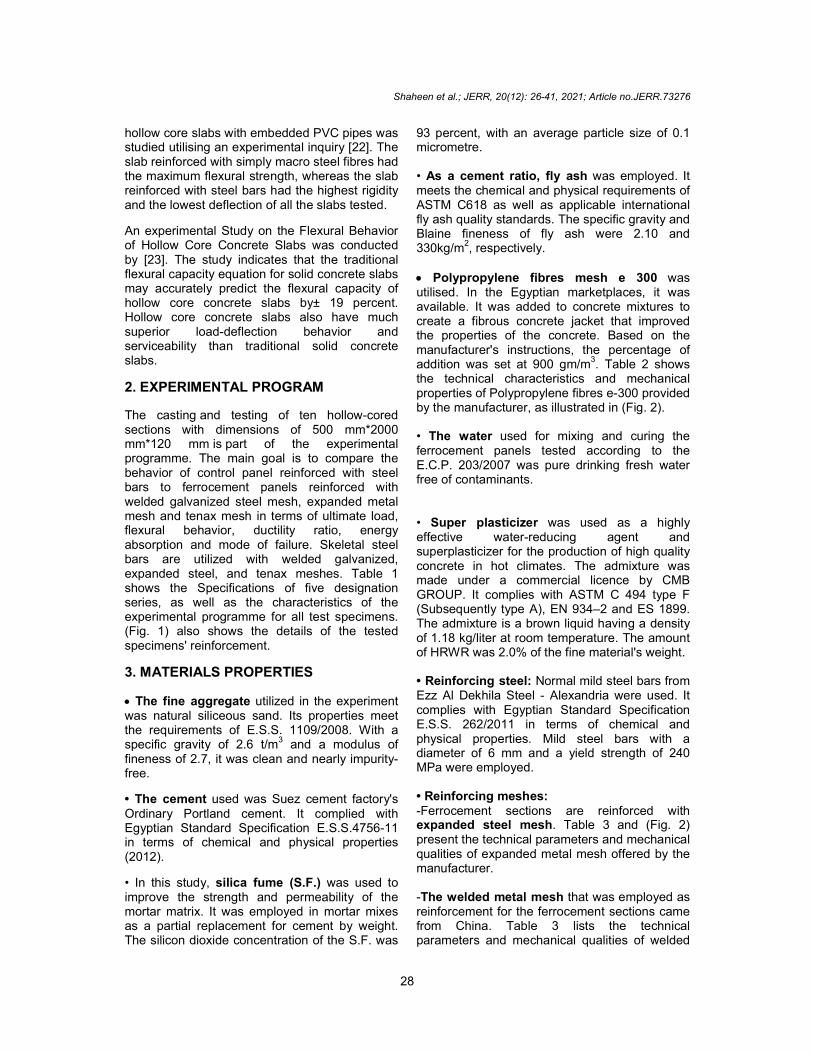
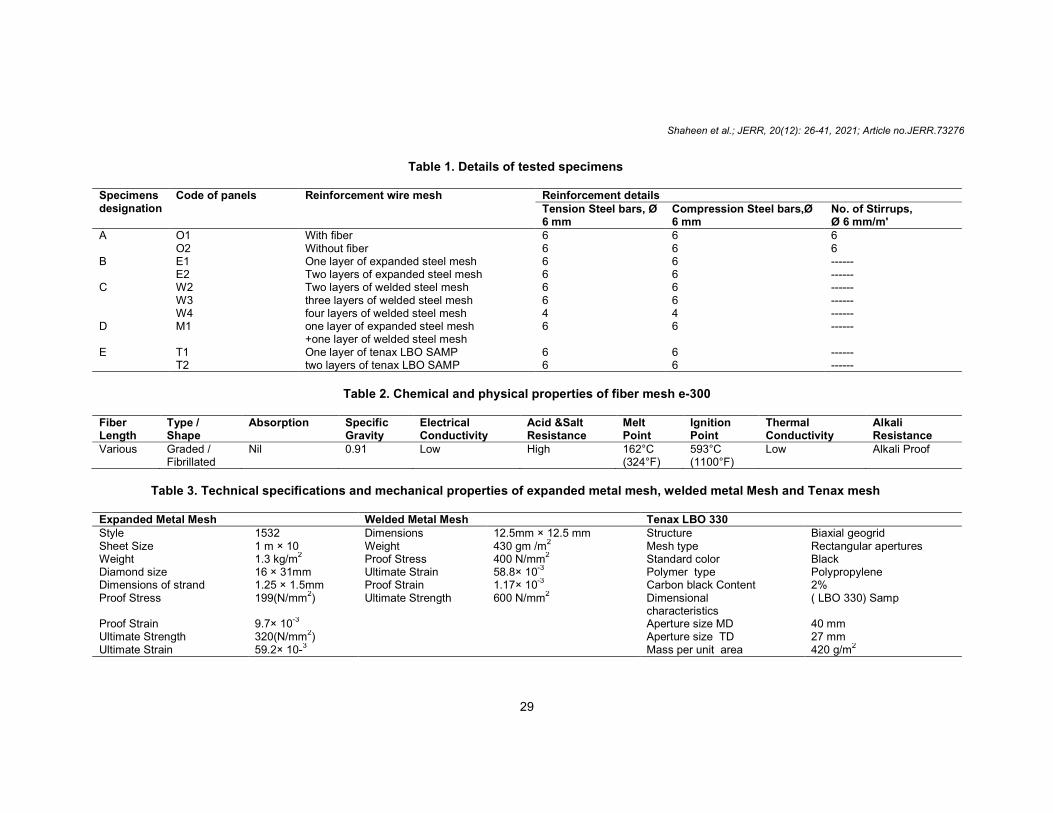
2. EXPERIMENTAL PROGRAM The casting and testing of ten hollow-cored sections with dimensions of 500 mm*2000 mm*120 mm is part of the experimental programme. The main goal is to compare the behavior of control panel reinforced with steel bars to ferrocement panels reinforced with welded galvanized steel mesh, expanded metal mesh and tenax mesh in terms of ultimate load, flexural behavior, ductility ratio, energy absorption and mode of failure. Skeletal steel bars are utilized with welded galvanized, expanded steel, and tenax meshes. Table 1 shows the Specifications of five designation series, as well as the characteristics of the experimental programme for all test specimens. (Fig. 1) also shows the details of the tested specimens' reinforcement.
3. MATERIALS PROPERTIES
The fine aggregate utilized in the experiment was natural siliceous sand. Its properties meet the requirements of E.S.S. 1109/2008. With a specific gravity of 2.6 t/m3 and a modulus of fineness of 2.7, it was clean and nearly impurity-free.
• The cement used was Suez cement factory's Ordinary Portland cement. It complied with Egyptian Standard Specification E.S.S.4756-11 in terms of chemical and physical properties (2012).
• In this study, silica fume (S.F.) was used to improve the strength and permeability of the mortar matrix. It was employed in mortar mixes as a partial replacement for cement by weight. The silicon dioxide concentration of the S.F. was
93 percent, with an average particle size of 0.1 micrometre. • As a cement ratio, fly ash was employed. It meets the chemical and physical requirements of ASTM C618 as well as applicable international fly ash quality standards. The specific gravity and Blaine fineness of fly ash were 2.10 and 330kg/m
2, respectively.
Polypropylene fibres mesh e 300 was utilised. In the Egyptian marketplaces, it was available. It was added to concrete mixtures to create a fibrous concrete jacket that improved the properties of the concrete. Based on the manufacturer's instructions, the percentage of addition was set at 900 gm/m
3. Table 2 shows
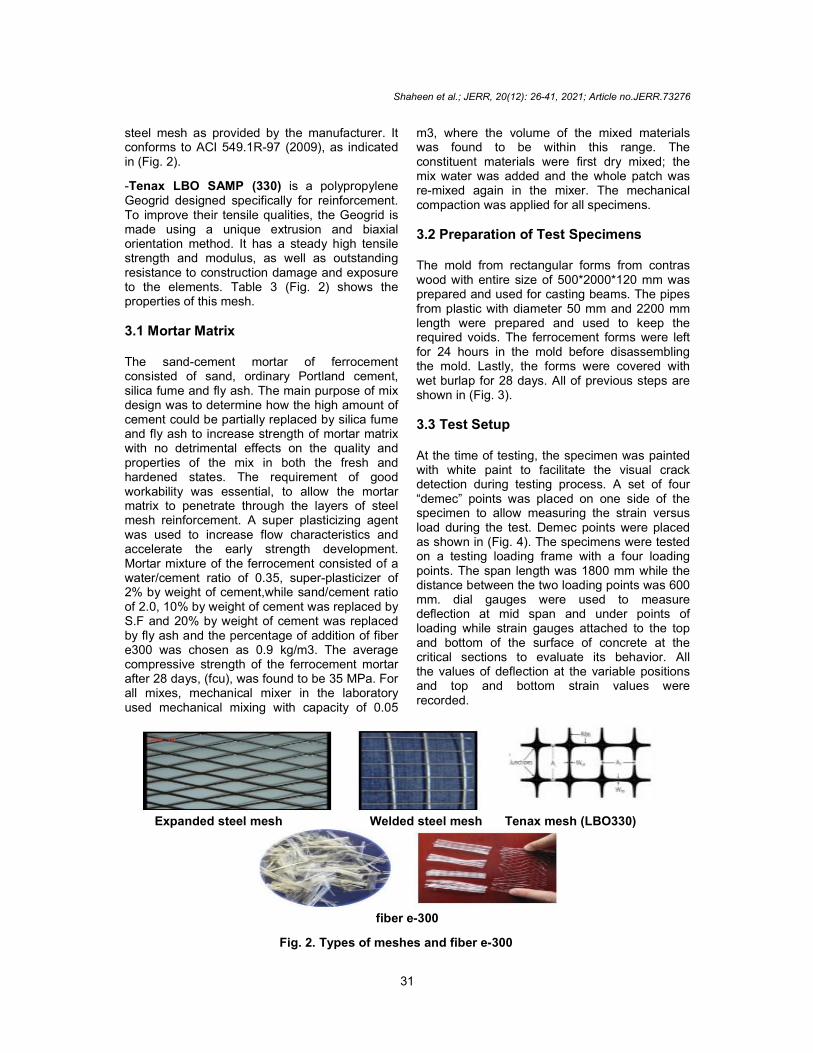
the technical characteristics and mechanical properties of Polypropylene fibres e-300 provided by the manufacturer, as illustrated in (Fig. 2). • The water used for mixing and curing the ferrocement panels tested according to the E.C.P. 203/2007 was pure drinking fresh water free of contaminants. • Super plasticizer was used as a highly effective water-reducing agent and superplasticizer for the production of high quality concrete in hot climates. The admixture was made under a commercial licence by CMB GROUP. It complies with ASTM C 494 type F (Subsequently type A), EN 934–2 and ES 1899. The admixture is a brown liquid having a density of 1.18 kg/liter at room temperature. The amount of HRWR was 2.0% of the fine material's weight. • Reinforcing steel: Normal mild steel bars from Ezz Al Dekhila Steel - Alexandria were used. It complies with Egyptian Standard Specification E.S.S. 262/2011 in terms of chemical and physical properties. Mild steel bars with a diameter of 6 mm and a yield strength of 240 MPa were employed. • Reinforcing meshes: -Ferrocement sections are reinforced with expanded steel mesh. Table 3 and (Fig. 2) present the technical parameters and mechanical qualities of expanded metal mesh offered by the manufacturer. -The welded metal mesh that was employed as reinforcement for the ferrocement sections came from China. Table 3 lists the technical parameters and mechanical qualities of welded
Shaheen et al.; JERR, 20(12): 26-41, 2021; Article no.JERR.73276
29
Table 1. Details of tested specimens
Specimens designation
Code of panels Reinforcement wire mesh Reinforcement details Tension Steel bars, Ø 6 mm
Compression Steel bars,Ø 6 mm
No. of Stirrups, Ø 6 mm/m'
A O1 With fiber 6 6 6 O2 Without fiber 6 6 6
B E1 One layer of expanded steel mesh 6 6 ------ E2 Two layers of expanded steel mesh 6 6 ------
C W2 Two layers of welded steel mesh 6 6 ------ W3 three layers of welded steel mesh 6 6 ------ W4 four layers of welded steel mesh 4 4 ------
D M1 one layer of expanded steel mesh +one layer of welded steel mesh
6 6 ------
E T1 One layer of tenax LBO SAMP 6 6 ------ T2 two layers of tenax LBO SAMP 6 6 ------
Table 2. Chemical and physical properties of fiber mesh e-300
Fiber Length
Type / Shape
Absorption Specific Gravity
Electrical Conductivity
Acid &Salt Resistance
Melt Point
Ignition Point
Thermal Conductivity
Alkali Resistance
Various Graded / Fibrillated
Nil 0.91 Low High 162°C (324°F)
593°C (1100°F)
Low Alkali Proof
Table 3. Technical specifications and mechanical properties of expanded metal mesh, welded metal Mesh and Tenax mesh
Expanded Metal Mesh Welded Metal Mesh Tenax LBO 330 Style 1532 Dimensions 12.5mm × 12.5 mm Structure Biaxial geogrid Sheet Size 1 m × 10 Weight 430 gm /m
2 Mesh type Rectangular apertures
Weight 1.3 kg/m2 Proof Stress 400 N/mm
2 Standard color Black
Diamond size 16 × 31mm Ultimate Strain 58.8× 10⁻³
Polymer type Polypropylene Dimensions of strand 1.25 × 1.5mm Proof Strain 1.17× 10
-3 Carbon black Content 2%
Proof Stress 199(N/mm2) Ultimate Strength 600 N/mm
2 Dimensional
characteristics ( LBO 330) Samp
Proof Strain 9.7× 10⁻³ Aperture size MD 40 mm Ultimate Strength 320(N/mm2) Aperture size TD 27 mm Ultimate Strain 59.2× 10⁻³ Mass per unit area 420 g/m2
Shaheen et al.; JERR, 20(12): 26-41, 2021; Article no.JERR.73276
30
Fig. 1. Details of tested specimens' reinforcement
Shaheen et al.; JERR, 20(12): 26-41, 2021; Article no.JERR.73276
31
steel mesh as provided by the manufacturer. It conforms to ACI 549.1R-97 (2009), as indicated in (Fig. 2).
-Tenax LBO SAMP (330) is a polypropylene Geogrid designed specifically for reinforcement. To improve their tensile qualities, the Geogrid is made using a unique extrusion and biaxial orientation method. It has a steady high tensile strength and modulus, as well as outstanding resistance to construction damage and exposure to the elements. Table 3 (Fig. 2) shows the properties of this mesh. 3.1 Mortar Matrix The sand-cement mortar of ferrocement consisted of sand, ordinary Portland cement, silica fume and fly ash. The main purpose of mix design was to determine how the high amount of cement could be partially replaced by silica fume and fly ash to increase strength of mortar matrix with no detrimental effects on the quality and properties of the mix in both the fresh and hardened states. The requirement of good workability was essential, to allow the mortar matrix to penetrate through the layers of steel mesh reinforcement. A super plasticizing agent was used to increase flow characteristics and accelerate the early strength development. Mortar mixture of the ferrocement consisted of a water/cement ratio of 0.35, super-plasticizer of 2% by weight of cement,while sand/cement ratio of 2.0, 10% by weight of cement was replaced by S.F and 20% by weight of cement was replaced by fly ash and the percentage of addition of fiber e300 was chosen as 0.9 kg/m3 . The average compressive strength of the ferrocement mortar after 28 days, (fcu), was found to be 35 MPa. For all mixes, mechanical mixer in the laboratory used mechanical mixing with capacity of 0.05
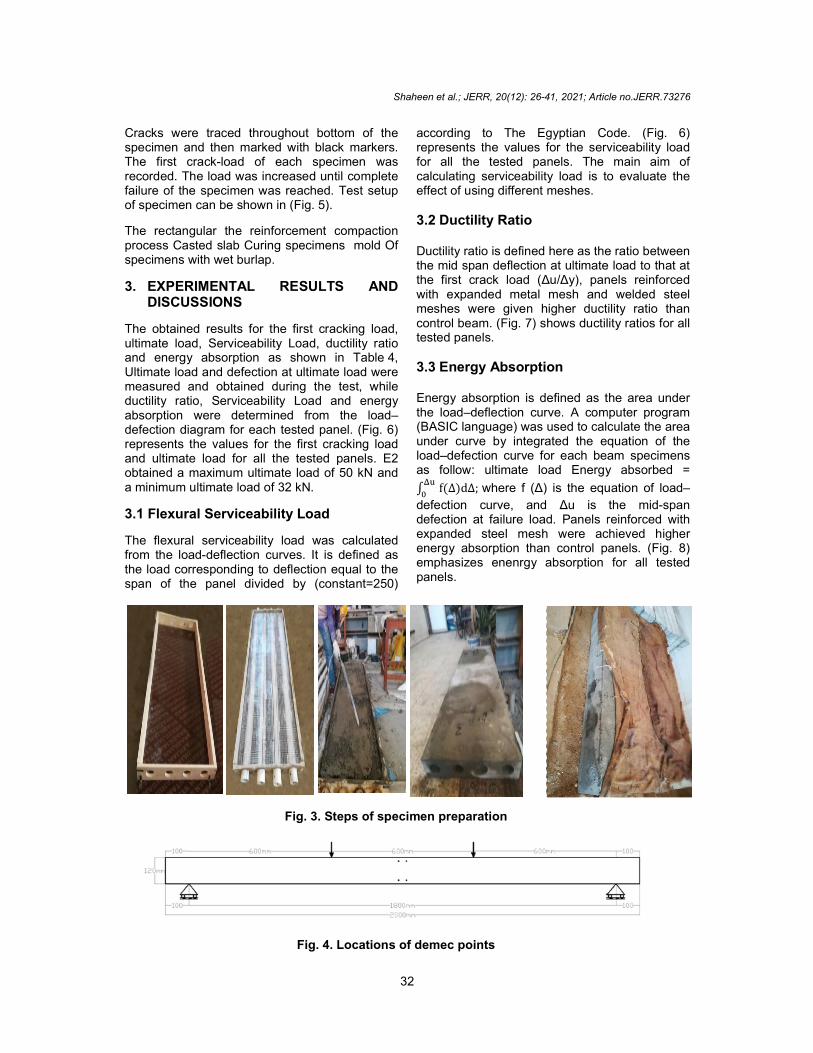
m3, where the volume of the mixed materials was found to be within this range. The constituent materials were first dry mixed; the mix water was added and the whole patch was re-mixed again in the mixer. The mechanical compaction was applied for all specimens. 3.2 Preparation of Test Specimens The mold from rectangular forms from contras wood with entire size of 500*2000*120 mm was prepared and used for casting beams. The pipes from plastic with diameter 50 mm and 2200 mm length were prepared and used to keep the required voids. The ferrocement forms were left for 24 hours in the mold before disassembling the mold. Lastly, the forms were covered with wet burlap for 28 days. All of previous steps are shown in (Fig. 3).
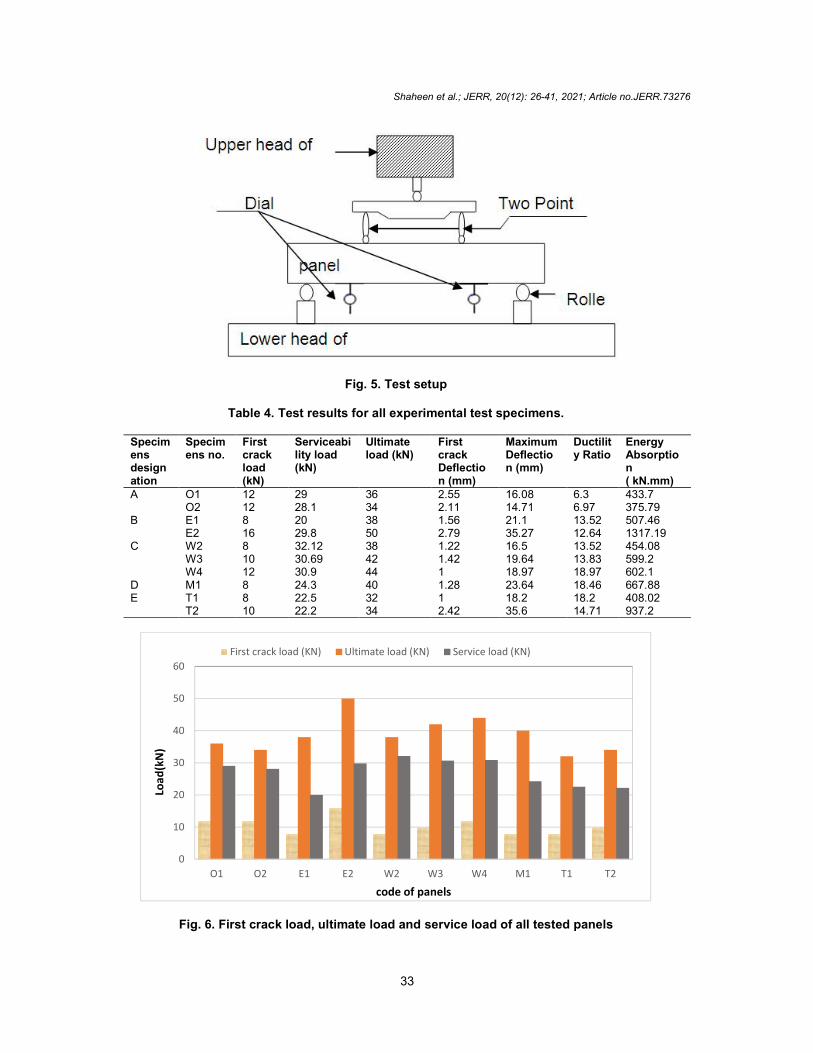
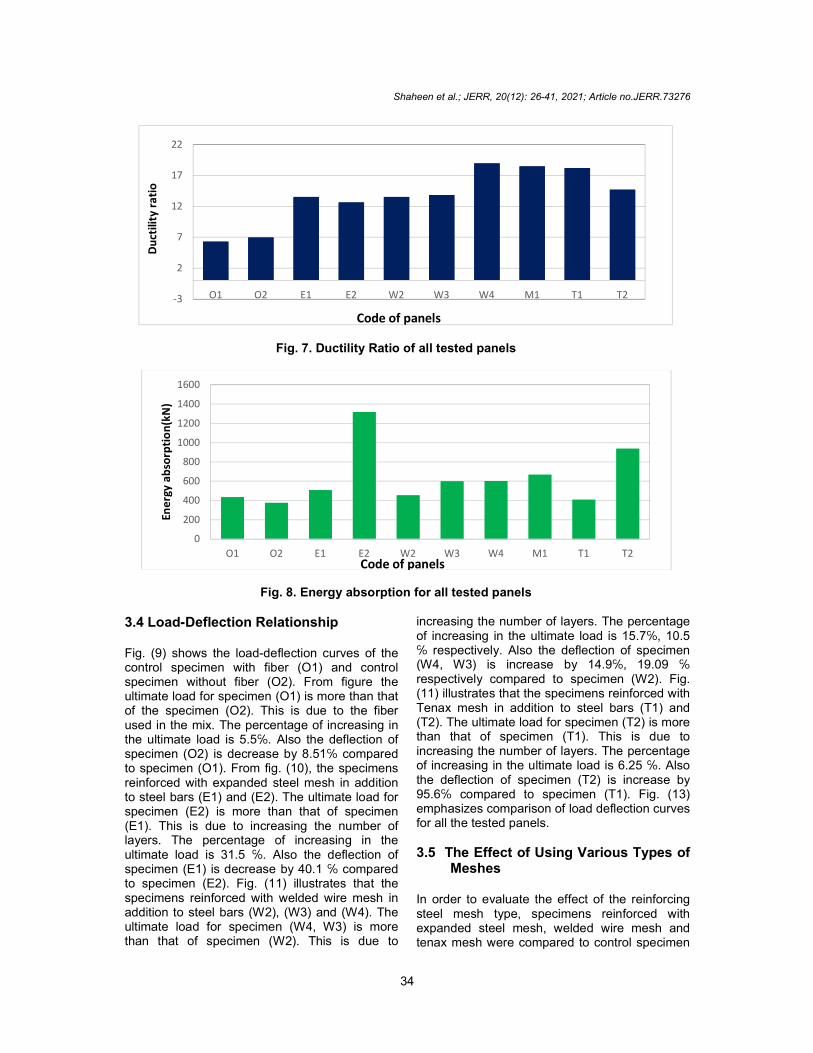
3.3 Test Setup At the time of testing, the specimen was painted with white paint to facilitate the visual crack detection during testing process. A set of four “demec” points was placed on one side of the specimen to allow measuring the strain versus load during the test. Demec points were placed as shown in (Fig. 4). The specimens were tested on a testing loading frame with a four loading points. The span length was 1800 mm while the distance between the two loading points was 600 mm. dial gauges were used to measure deflection at mid span and under points of loading while strain gauges attached to the top and bottom of the surface of concrete at the critical sections to evaluate its behavior. All the values of deflection at the variable positions and top and bottom strain values were recorded.
Expanded steel mesh Welded steel mesh Tenax mesh (LBO330)
fiber e-300
Fig. 2. Types of meshes and fiber e-300
Cracks were traced throughout bottomspecimen and then marked with black markers. The first crack-load of each specimen was recorded. The load was increased until complete failure of the specimen was reached. Test setup of specimen can be shown in (Fig. 5).
The rectangular the reinforcementprocess Casted slab Curing specimensspecimens with wet burlap.
3. EXPERIMENTAL RESULTS AND DISCUSSIONS
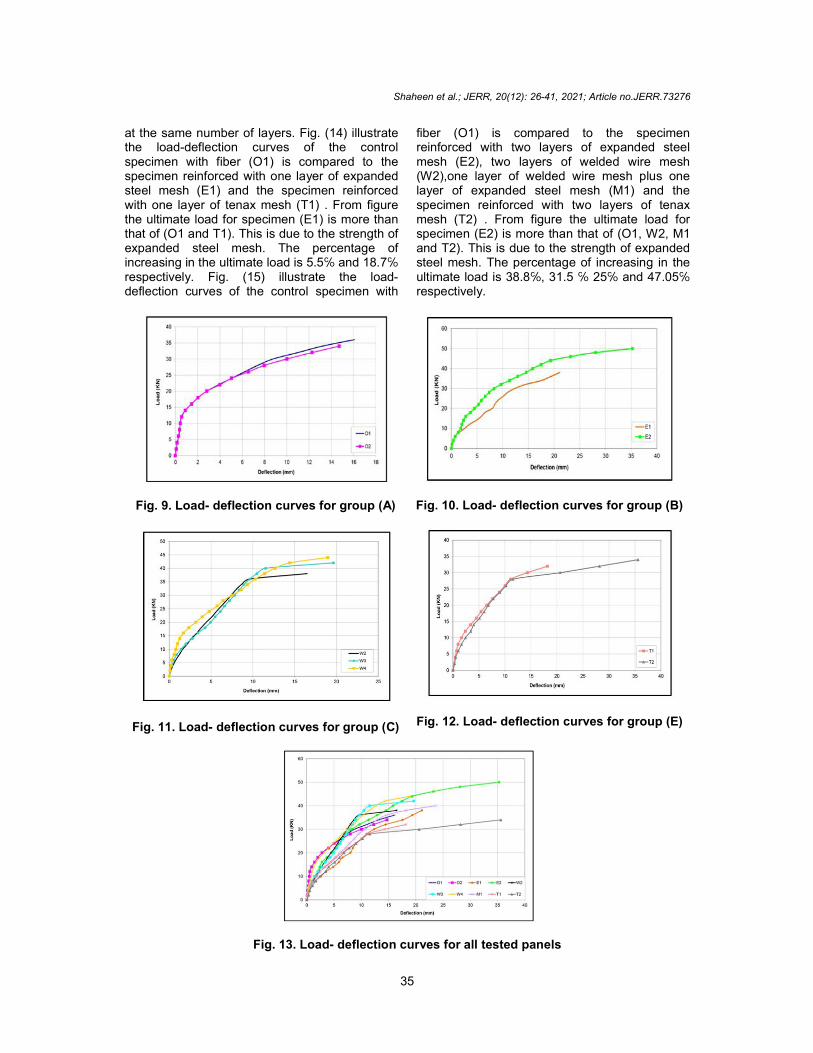
The obtained results for the first cracking load, ultimate load, Serviceability Load, ductility ratio and energy absorption as shown in TableUltimate load and defection at ultimate load were measured and obtained during the test, while ductility ratio, Serviceability Load and energy absorption were determined from the loaddefection diagram for each tested panel.represents the values for the first cracking load and ultimate load for all the tested panels.obtained a maximum ultimate load of 50 kN and a minimum ultimate load of 32 kN. 3.1 Flexural Serviceability Load
The flexural serviceability load was calculated from the load-deflection curves. It is defined as the load corresponding to deflection equal to the span of the panel divided by (constant=250)
Fig. 3.
Fig. 4
Shaheen et al.; JERR, 20(12): 26-41, 2021; Article no.
32
Cracks were traced throughout bottom of the specimen and then marked with black markers.
load of each specimen was recorded. The load was increased until complete failure of the specimen was reached. Test setup of specimen can be shown in (Fig. 5).
reinforcement compaction Curing specimens mold Of
EXPERIMENTAL RESULTS AND
The obtained results for the first cracking load, ultimate load, Serviceability Load, ductility ratio
absorption as shown in Table 4, Ultimate load and defection at ultimate load were measured and obtained during the test, while ductility ratio, Serviceability Load and energy absorption were determined from the load–defection diagram for each tested panel. (Fig. 6) represents the values for the first cracking load and ultimate load for all the tested panels. E2 obtained a maximum ultimate load of 50 kN and
3.1 Flexural Serviceability Load
The flexural serviceability load was calculated deflection curves. It is defined as
the load corresponding to deflection equal to the span of the panel divided by (constant=250)
according to The Egyptian Code. (Fig. 6) represents the values for the serviceability load for all the tested panels. The main aim of calculating serviceability load is to evaluate the effect of using different meshes.
3.2 Ductility Ratio Ductility ratio is defined here as the ratio between the mid span deflection at ultimate load to that at the first crack load (Δu/Δy), panels reinforced with expanded metal mesh and welded steel meshes were given higher ductility ratio than control beam. (Fig. 7) shows ductility ratios for all tested panels.
3.3 Energy Absorption Energy absorption is defined as the area under the load–deflection curve. A computer program (BASIC language) was used to calculate the area under curve by integrated the equation of the load–defection curve for each beam specimens as follow: ultimate load Energy absorbed =
∫ f(Δ)dΔ;��
� where f (Δ) is the equation of load
defection curve, and Δu is the middefection at failure load. Panels reinforced with expanded steel mesh were achieved higher energy absorption than control panels. (Fig. 8) emphasizes enenrgy absorption for all tested panels.
Steps of specimen preparation
Fig. 4. Locations of demec points
; Article no.JERR.73276
according to The Egyptian Code. (Fig. 6) or the serviceability load
for all the tested panels. The main aim of calculating serviceability load is to evaluate the
Ductility ratio is defined here as the ratio between t ultimate load to that at
the first crack load (Δu/Δy), panels reinforced with expanded metal mesh and welded steel meshes were given higher ductility ratio than control beam. (Fig. 7) shows ductility ratios for all
Energy absorption is defined as the area under deflection curve. A computer program
(BASIC language) was used to calculate the area under curve by integrated the equation of the
defection curve for each beam specimens Energy absorbed =
where f (Δ) is the equation of load–
defection curve, and Δu is the mid-span defection at failure load. Panels reinforced with expanded steel mesh were achieved higher energy absorption than control panels. (Fig. 8)
enenrgy absorption for all tested
Shaheen et al.; JERR, 20(12): 26-41, 2021; Article no.JERR.73276
33
Fig. 5. Test setup
Table 4. Test results for all experimental test specimens. Specimens designation
Specimens no.
First crack load (kN)
Serviceability load (kN)
Ultimate load (kN)
First crack Deflection (mm)
Maximum Deflection (mm)
Ductility Ratio
Energy Absorption ( kN.mm)
A O1 12 29 36 2.55 16.08 6.3 433.7 O2 12 28.1 34 2.11 14.71 6.97 375.79
B E1 8 20 38 1.56 21.1 13.52 507.46 E2 16 29.8 50 2.79 35.27 12.64 1317.19
C W2 8 32.12 38 1.22 16.5 13.52 454.08 W3 10 30.69 42 1.42 19.64 13.83 599.2 W4 12 30.9 44 1 18.97 18.97 602.1
D M1 8 24.3 40 1.28 23.64 18.46 667.88 E T1 8 22.5 32 1 18.2 18.2 408.02
T2 10 22.2 34 2.42 35.6 14.71 937.2
Fig. 6. First crack load, ultimate load and service load of all tested panels
0
10
20
30
40
50
60
O1 O2 E1 E2 W2 W3 W4 M1 T1 T2
Load
(kN
)
code of panels
First crack load (KN) Ultimate load (KN) Service load (KN)
Shaheen et al.; JERR, 20(12): 26-41, 2021; Article no.JERR.73276
34
Fig. 7. Ductility Ratio of all tested panels
Fig. 8. Energy absorption for all tested panels
3.4 Load-Deflection Relationship Fig. (9) shows the load-deflection curves of the control specimen with fiber (O1) and control specimen without fiber (O2). From figure the ultimate load for specimen (O1) is more than that of the specimen (O2). This is due to the fiber used in the mix. The percentage of increasing in the ultimate load is 5.5℅. Also the deflection of specimen (O2) is decrease by 8.51℅ compared to specimen (O1). From fig. (10), the specimens reinforced with expanded steel mesh in addition to steel bars (E1) and (E2). The ultimate load for specimen (E2) is more than that of specimen (E1). This is due to increasing the number of layers. The percentage of increasing in the ultimate load is 31.5 ℅. Also the deflection of specimen (E1) is decrease by 40.1 ℅ compared to specimen (E2). Fig. (11) illustrates that the specimens reinforced with welded wire mesh in addition to steel bars (W2), (W3) and (W4). The ultimate load for specimen (W4, W3) is more than that of specimen (W2). This is due to
increasing the number of layers. The percentage of increasing in the ultimate load is 15.7℅, 10.5 ℅ respectively. Also the deflection of specimen (W4, W3) is increase by 14.9℅, 19.09 ℅ respectively compared to specimen (W2). Fig. (11) illustrates that the specimens reinforced with Tenax mesh in addition to steel bars (T1) and (T2). The ultimate load for specimen (T2) is more than that of specimen (T1). This is due to increasing the number of layers. The percentage of increasing in the ultimate load is 6.25 ℅. Also the deflection of specimen (T2) is increase by 95.6℅ compared to specimen (T1). Fig. (13) emphasizes comparison of load deflection curves for all the tested panels.
3.5 The Effect of Using Various Types of Meshes
In order to evaluate the effect of the reinforcing steel mesh type, specimens reinforced with expanded steel mesh, welded wire mesh and tenax mesh were compared to control specimen
-3
2
7
12
17
22
O1 O2 E1 E2 W2 W3 W4 M1 T1 T2
Du
ctili
ty r
atio
Code of panels
0
200
400
600
800
1000
1200
1400
1600
O1 O2 E1 E2 W2 W3 W4 M1 T1 T2
Ener
gy a
bso
rpti
on
(kN
)
Code of panels
Shaheen et al.; JERR, 20(12): 26-41, 2021; Article no.JERR.73276
35
at the same number of layers. Fig. (14) illustrate the load-deflection curves of the control specimen with fiber (O1) is compared to the specimen reinforced with one layer of expanded steel mesh (E1) and the specimen reinforced with one layer of tenax mesh (T1) . From figure the ultimate load for specimen (E1) is more than that of (O1 and T1). This is due to the strength of expanded steel mesh. The percentage of increasing in the ultimate load is 5.5℅ and 18.7℅ respectively. Fig. (15) illustrate the load-deflection curves of the control specimen with
fiber (O1) is compared to the specimen reinforced with two layers of expanded steel mesh (E2), two layers of welded wire mesh (W2),one layer of welded wire mesh plus one layer of expanded steel mesh (M1) and the specimen reinforced with two layers of tenax mesh (T2) . From figure the ultimate load for specimen (E2) is more than that of (O1, W2, M1 and T2). This is due to the strength of expanded steel mesh. The percentage of increasing in the ultimate load is 38.8℅, 31.5 ℅ 25℅ and 47.05℅ respectively.
Fig. 9. Load- deflection curves for group (A)
Fig. 10. Load- deflection curves for group (B)
Fig. 11. Load- deflection curves for group (C)
Fig. 12. Load- deflection curves for group (E)
Fig. 13. Load- deflection curves for all tested panels

3.6 The Effect of Numbers of Layers In order to evaluate the effect numbers of steel wire mesh layers, specimens reinforced with expanded steel mesh, welded wire mesh and tenax mesh were compared to control specimen. Fig.(16) illustrate the load-deflection curves of the control specimen with fiber (O1) is compared to the specimen reinforced with one layer of expanded steel mesh (E1) and the specimen reinforced with two layers of expanded steel mesh (E2) . From figure the ultimate load for specimen (E2) is more than that of (O1 and E1). This is due to the number of layers. The percentage of increasing in the ultimate load is 38.8℅ and 31.5℅ respectively. Fig.(17) illustrate the load-deflection curves of the control specimen with fiber (O1) is compared to the
Fig. 14. Effect of type of reinforcement on
the load–defection for the panels
Fig. 16. Effect of number of layers of expanded steel mesh for the panels
Shaheen et al.; JERR, 20(12): 26-41, 2021; Article no.
36
Layers
In order to evaluate the effect numbers of steel wire mesh layers, specimens reinforced with expanded steel mesh, welded wire mesh and
mesh were compared to control specimen. deflection curves of
the control specimen with fiber (O1) is compared to the specimen reinforced with one layer of expanded steel mesh (E1) and the specimen
expanded steel mesh (E2) . From figure the ultimate load for specimen (E2) is more than that of (O1 and E1). This is due to the number of layers. The percentage of increasing in the ultimate load is
Fig.(17) illustrate deflection curves of the control
specimen with fiber (O1) is compared to the
specimen reinforced with two layers of welded wire mesh (W2), the specimen reinforced with three layers of welded wire mesh (E2) and the specimen reinforced with four layers ofwire mesh (W4) . From figure the ultimate load for specimen (W4) is more than that of (O1, W2 and W3). This is due to the number of layers. The percentage of increasing in the ultimate load is 22.2℅, 15.78℅ and 4.76℅ respectively. Fig.(18) illustrate the load-deflection curves of the control specimen with fiber (O1) is compared to the specimen reinforced with two layers of tenax mesh (T2), the specimen reinforced with one layer of tenax mesh (T1). From figure the ultimate load for specimen (O1) is mthat of (T1, T2). The percentage of increasingin the ultimate load is 12.5℅ and 5.8℅ respectively.
Effect of type of reinforcement on defection for the panels
Fig. 15. Effect of type of reinforcement on the
load–defection for the panels
Effect of number of layers of expanded steel mesh for the panels
Fig. 17. Effect of number of layers of welded
steel mesh for the panels
; Article no.JERR.73276
specimen reinforced with two layers of welded wire mesh (W2), the specimen reinforced with three layers of welded wire mesh (E2) and the
layers of welded wire mesh (W4) . From figure the ultimate load for specimen (W4) is more than that of (O1, W2 and W3). This is due to the number of layers. The percentage of increasing in the ultimate load
℅, 15.78℅ and 4.76℅ respectively. deflection curves of
the control specimen with fiber (O1) is compared to the specimen reinforced with two layers of tenax mesh (T2), the specimen reinforced with one layer of tenax mesh (T1). From figure the ultimate load for specimen (O1) is more than that of (T1, T2). The percentage of increasing
℅ and 5.8℅
Effect of type of reinforcement on the defection for the panels
Effect of number of layers of welded steel mesh for the panels
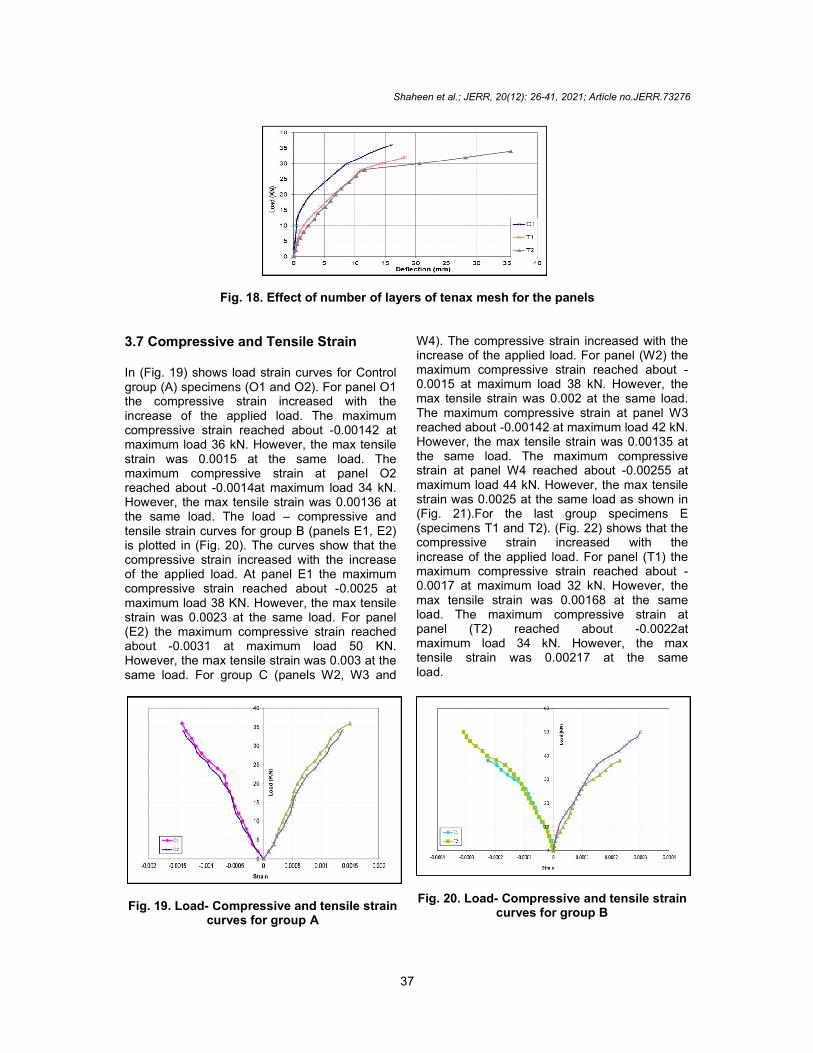
Fig. 18. Effect of number of layers of tenax mesh for the panels
3.7 Compressive and Tensile Strain In (Fig. 19) shows load strain curves for Control group (A) specimens (O1 and O2). For panel O1 the compressive strain increased with the increase of the applied load. The maximum compressive strain reached about maximum load 36 kN. However, the max tensile strain was 0.0015 at the same load. The maximum compressive strain at panel O2 reached about -0.0014at maximum load 34 kN. However, the max tensile strain was 0.00136 at the same load. The load – compressive and tensile strain curves for group B (panels E1, E2) is plotted in (Fig. 20). The curves show that the compressive strain increased with the increase of the applied load. At panel E1 the maximum compressive strain reached about maximum load 38 KN. However, the max tensile strain was 0.0023 at the same load. For panel (E2) the maximum compressive strain reached about -0.0031 at maximum load 50 KN. However, the max tensile strain was 0.003 at the same load. For group C (panels W2, W3 and
Fig. 19. Load- Compressive and tensile strain
curves for group A
Shaheen et al.; JERR, 20(12): 26-41, 2021; Article no.
37
Effect of number of layers of tenax mesh for the panels
Tensile Strain
In (Fig. 19) shows load strain curves for Control group (A) specimens (O1 and O2). For panel O1 the compressive strain increased with the increase of the applied load. The maximum compressive strain reached about -0.00142 at
e max tensile strain was 0.0015 at the same load. The maximum compressive strain at panel O2
0.0014at maximum load 34 kN. However, the max tensile strain was 0.00136 at
compressive and p B (panels E1, E2)
is plotted in (Fig. 20). The curves show that the compressive strain increased with the increase of the applied load. At panel E1 the maximum compressive strain reached about -0.0025 at maximum load 38 KN. However, the max tensile
n was 0.0023 at the same load. For panel (E2) the maximum compressive strain reached
0.0031 at maximum load 50 KN. However, the max tensile strain was 0.003 at the same load. For group C (panels W2, W3 and
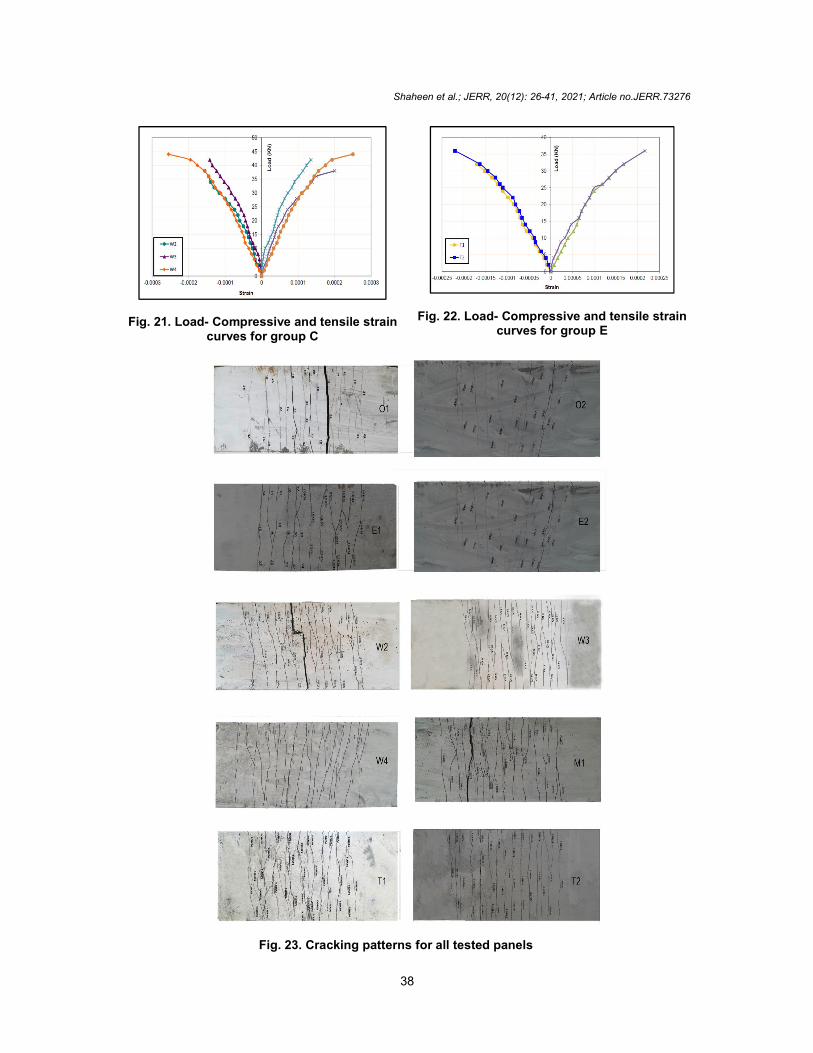
W4). The compressive strain increased with increase of the applied load. For panel (W2) the maximum compressive strain reached about 0.0015 at maximum load 38 kN. However, the max tensile strain was 0.002 at the same load. The maximum compressive strain at panel W3 reached about -0.00142 at maximum load 42 kN. However, the max tensile strain was 0.00135 at the same load. The maximum compressive strain at panel W4 reached about maximum load 44 kN. However, the max tensile strain was 0.0025 at the same load as shown in (Fig. 21).For the last group specimens E (specimens T1 and T2). (Fig. 22) shows that the compressive strain increased with the increase of the applied load. For panel (T1) the maximum compressive strain reached about 0.0017 at maximum load 32 kN. However,max tensile strain was 0.00168 at the same load. The maximum compressive strain at panel (T2) reached about maximum load 34 kN. However, the max tensile strain was 0.00217 at the same load.
Compressive and tensile strain
Fig. 20. Load- Compressive and tensile strain
curves for group B
; Article no.JERR.73276
W4). The compressive strain increased with the increase of the applied load. For panel (W2) the maximum compressive strain reached about -0.0015 at maximum load 38 kN. However, the max tensile strain was 0.002 at the same load. The maximum compressive strain at panel W3
ximum load 42 kN. However, the max tensile strain was 0.00135 at the same load. The maximum compressive strain at panel W4 reached about -0.00255 at maximum load 44 kN. However, the max tensile strain was 0.0025 at the same load as shown in
he last group specimens E (specimens T1 and T2). (Fig. 22) shows that the compressive strain increased with the increase of the applied load. For panel (T1) the maximum compressive strain reached about -0.0017 at maximum load 32 kN. However, the max tensile strain was 0.00168 at the same load. The maximum compressive strain at panel (T2) reached about -0.0022at maximum load 34 kN. However, the max tensile strain was 0.00217 at the same
Compressive and tensile strain curves for group B
Shaheen et al.; JERR, 20(12): 26-41, 2021; Article no.JERR.73276
38
Fig. 21. Load- Compressive and tensile strain curves for group C
Fig. 22. Load- Compressive and tensile strain curves for group E
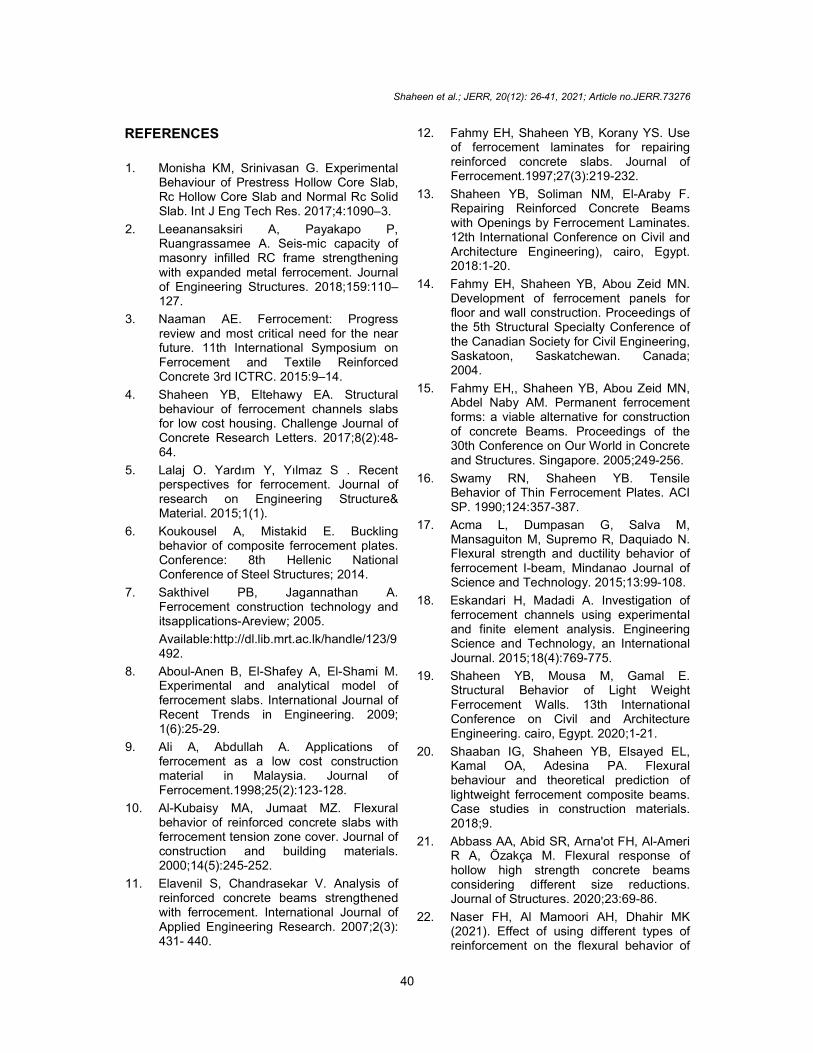
Fig. 23. Cracking patterns for all tested panels

Shaheen et al.; JERR, 20(12): 26-41, 2021; Article no.JERR.73276
39
3.8 Cracking Patterns and Mode of Failure
Cracks were traced and marked throughout the side of the specimen. The first crack-load of each specimen, crack propagation, and failure mode were recorded. Flexural cracks developed near the mid-span of the specimen. With the increase of the load, the cracks propagated vertically and new flexural cracks were developed rapidly. The cracks started to propagate wider when the specimens approached their failure load. As the load increased, more cracks started to develop and the crack at mid span started to propagate vertically towards the top surface of the specimen, while most of the developed cracks did not continue propagating. This could be attributed to the effect of steel mesh in controlling the crack width. The cracks for all tested panels can be shown in (Fig. 23).
4. CONCLUSIONS Based on the experimentally-available results, the following conclusions are drawn: Ultimate load for hollow-cored sections
reinforced with expanded hexagonal steel mesh exhibited much higher responses than those reinforced with welded square steel mesh and tenax mesh. This increase is due to the difference in the ultimate stresses of the two types of steel meshes.
Increasing the number of the steel mesh layers in the ferrocement forms increases the first crack load, service load, ultimate load, and energy absorption of the sections. The specimen reinforced with two layers of expanded steel mesh increase the ultimate load by (31.5%) compared to that reinforced with one layer of expanded steel mesh. Also the specimen reinforced with four layers of welded wire mesh increase the ultimate load by (15.7% and 4.7%) compared to that reinforced with two layers of welded wire mesh and three layers of welded wire mesh, respectively.
Type of mesh has significant effect on the studied structural indicators to different degrees. The different studied structural indicators showed improvement over those of control sections. Using two layers of expanded steel mesh increased the ultimate load by percentage (38.8%)
compared to control panel, while using two, three and four layers of welded wire mesh increase the ultimate load by percentage (5.5%, 16.6% and 22.2%) compared to control panel.
Energy absorption values of studied ferrocement hollow-cored sections were, generally, higher than that of the control specimen. The highest energy absorption property was shared between specimens made of two layers of expanded steel mesh (E2) and two layers of tenax mesh (T2) and the lowest was found mostly with hollow-cored sections made of one layer of welded wire mesh (W1) and one layer of tenax (T1).
Ductility ratio of studied ferrocement hollow-cored sections was, generally, higher than that of the control specimen. The highest Ductility ratio property was shared between specimen made of four layers of welded wire mesh (W4) and specimen reinforced with one layer of expanded steel mesh and one layer of welded wire mesh (M1).
The best behavior of ferrocement hollow-cored panels was that of reinforced with two layers of expanded metal mesh which increased the ultimate moment and improve the energy absorption than using other types of meshes.
Out of the point of this research, using ferrocement hollow-cored panels with different types and reinforced with several layers of mesh reinforcement may be have true construction merits for using in a variety of applications.
DISCLAIMER The products used for this research are commonly and predominantly use products in our area of research and country. There is absolutely no conflict of interest between the authors and producers of the products because we do not intend to use these products as an avenue for any litigation but for the advancement of knowledge. Also, the research was not funded by the producing company rather it was funded by personal efforts of the authors.
COMPETING INTERESTS Authors have declared that no competing interests exist.
Shaheen et al.; JERR, 20(12): 26-41, 2021; Article no.JERR.73276
40
REFERENCES
1. Monisha KM, Srinivasan G. Experimental Behaviour of Prestress Hollow Core Slab, Rc Hollow Core Slab and Normal Rc Solid Slab. Int J Eng Tech Res. 2017;4:1090–3.
2. Leeanansaksiri A, Payakapo P, Ruangrassamee A. Seis-mic capacity of masonry infilled RC frame strengthening with expanded metal ferrocement. Journal of Engineering Structures. 2018;159:110– 127.
3. Naaman AE. Ferrocement: Progress review and most critical need for the near future. 11th International Symposium on Ferrocement and Textile Reinforced Concrete 3rd ICTRC. 2015:9–14.
4. Shaheen YB, Eltehawy EA. Structural behaviour of ferrocement channels slabs for low cost housing. Challenge Journal of Concrete Research Letters. 2017;8(2):48-64.
5. Lalaj O. Yardım Y, Yılmaz S . Recent perspectives for ferrocement. Journal of research on Engineering Structure& Material. 2015;1(1).
6. Koukousel A, Mistakid E. Buckling behavior of composite ferrocement plates. Conference: 8th Hellenic National Conference of Steel Structures; 2014.
7. Sakthivel PB, Jagannathan A. Ferrocement construction technology and itsapplications-Areview; 2005.
Available:http://dl.lib.mrt.ac.lk/handle/123/9492.
8. Aboul-Anen B, El-Shafey A, El-Shami M. Experimental and analytical model of ferrocement slabs. International Journal of Recent Trends in Engineering. 2009; 1(6):25-29.
9. Ali A, Abdullah A. Applications of ferrocement as a low cost construction material in Malaysia. Journal of Ferrocement.1998;25(2):123-128.
10. Al-Kubaisy MA, Jumaat MZ. Flexural behavior of reinforced concrete slabs with ferrocement tension zone cover. Journal of construction and building materials. 2000;14(5):245-252.
11. Elavenil S, Chandrasekar V. Analysis of reinforced concrete beams strengthened with ferrocement. International Journal of Applied Engineering Research. 2007;2(3): 431- 440.
12. Fahmy EH, Shaheen YB, Korany YS. Use of ferrocement laminates for repairing reinforced concrete slabs. Journal of Ferrocement.1997;27(3):219-232.
13. Shaheen YB, Soliman NM, El-Araby F. Repairing Reinforced Concrete Beams with Openings by Ferrocement Laminates. 12th International Conference on Civil and Architecture Engineering), cairo, Egypt. 2018:1-20.
14. Fahmy EH, Shaheen YB, Abou Zeid MN. Development of ferrocement panels for floor and wall construction. Proceedings of the 5th Structural Specialty Conference of the Canadian Society for Civil Engineering, Saskatoon, Saskatchewan. Canada; 2004.
15. Fahmy EH,, Shaheen YB, Abou Zeid MN, Abdel Naby AM. Permanent ferrocement forms: a viable alternative for construction of concrete Beams. Proceedings of the 30th Conference on Our World in Concrete and Structures. Singapore. 2005;249-256.
16. Swamy RN, Shaheen YB. Tensile Behavior of Thin Ferrocement Plates. ACI SP. 1990;124:357-387.
17. Acma L, Dumpasan G, Salva M, Mansaguiton M, Supremo R, Daquiado N. Flexural strength and ductility behavior of ferrocement I-beam, Mindanao Journal of Science and Technology. 2015;13:99-108.
18. Eskandari H, Madadi A. Investigation of ferrocement channels using experimental and finite element analysis. Engineering Science and Technology, an International Journal. 2015;18(4):769-775.
19. Shaheen YB, Mousa M, Gamal E. Structural Behavior of Light Weight Ferrocement Walls. 13th International Conference on Civil and Architecture Engineering. cairo, Egypt. 2020;1-21.
20. Shaaban IG, Shaheen YB, Elsayed EL, Kamal OA, Adesina PA. Flexural behaviour and theoretical prediction of lightweight ferrocement composite beams. Case studies in construction materials. 2018;9.
21. Abbass AA, Abid SR, Arna'ot FH, Al-Ameri R A, Özakça M. Flexural response of hollow high strength concrete beams considering different size reductions. Journal of Structures. 2020;23:69-86.
22. Naser FH, Al Mamoori AH, Dhahir MK (2021). Effect of using different types of reinforcement on the flexural behavior of
Shaheen et al.; JERR, 20(12): 26-41, 2021; Article no.JERR.73276
41
ferrocement hollow core slabs embedding PVC pipes. Ain Shams Engineering Journal. 2021;12(1):303-315.
23. Prakashan LV, George J, Edayadiyil JB,
George JM. Experimental Study on the Flexural Behavior of Hollow Core Concrete Slabs. Journal of Applied Mechanics and Materials. 2016;857:107-112.
© 2021 Shaheen et al.; This is an Open Access article distributed under the terms of the Creative Commons Attribution License (http://creativecommons.org/licenses/by/4.0), which permits unrestricted use, distribution, and reproduction in any medium, provided the original work is properly cited.
Peer-review history: The peer review history for this paper can be accessed here:
https://www.sdiarticle4.com/review-history/73276