Embed Size (px)
Citation preview
Journal of Arid Environments (2002) 50: 135–152doi:10.1006/jare.2001.0854, available online at http://www.idealibrary.com on
The feeding ecology of the aardvark Orycteropus afer
W. A. Taylor, P. A. Lindsey & J. D. Skinner
Wildlife Unit, Faculty of Veterinary Science, Private Bag X04,Onderstepoort, 0110, South Africa
(Received 15 September 2000, accepted 1 May 2001)
Thirteen aardvarks (Orycteropus afer) were radio tagged at Tussen die RiviereNature Reserve in the Nama Karoo between 1996 and 1998. Faecal contentswere analysed and four habituated aardvarks closely followed to investigatefeeding ecology. The diet of the aardvark consisted entirely of ants andtermites, with ants predominating in all seasons and years. Anoplolepis custod-iens was the most important prey species in all months, followed by Triner-vitermes trinervoides. Termites were fed on more often in winter than summer ata time when ant numbers were generally reduced and the aardvarks may havebeen experiencing difficulty in meeting their nutritional requirements rela-tive to summer. Predation from epigeal mounds took place at this time,coinciding with the presence of alates.
( 2002 Academic Press
Keywords: aardvark; Orycteropus afer; Nama Karoo; feeding; ants; termites;Anoplolepis; Trinervitermes
Introduction
There are at least 216 ant/termite-eating mammalian species, the second most importantclass of animals to feed on them (Redford, 1983). Most mammals that eat largequantities of ants also eat termites, being specialized not on prey of a particulartaxonomy, but of a certain type: small, fairly homogeneous, social arthropods (Redford,1983).
The aardvark Orycteropus afer is a large myrmecophagous mammal (40–60 kg) thatis distributed locally throughout sub-Saharan Africa (Skinner & Smithers, 1990).It is the only member of the order Tubulidentata and, as a solitary and nocturnalanimal, has been little studied. In southern Africa aardvarks feed primarily onants, but termites also constitute an important part of their diet (Smithers,1971; Smithers & Wilson, 1979; Melton, 1976; Melton & Daniels, 1986; Willis et al.,1992). Most accounts of aardvarks’ diet are based on limited stomach or faecal contents,while other information is anecdotal. The most extensive study to date was that of Williset al. (1992), which included 10 summer and 10 winter faecal samples. No studies havehad access to habituated wild aardvarks, and previously it has not been possible toobserve their feeding behaviour closely under natural conditions. In view of theseshortcomings, the objective of the present study was to improve knowledge of aardvarkfeeding ecology.
0140}1963/02/010135#18 $35.00/0 ( 2002 Academic Press
136 W. A. TAYLOR ET AL.
Materials and methods
Study site
The study was carried out at Tussen die Riviere Nature Reserve (TdR) (30330@S,26307@E) in the Eastern Mixed Nama Karoo (Hoffman, 1996), part of the NamaKaroo Biome, between June 1996 and December 1998. With a total area of 22,000 ha,TdR has an average annual rainfall of 400 mm falling mostly in summer (Nov.}Mar.).Summer temperatures exceed 303C, while in winter (May}Jul.) temperatures oftendecline below 03C at night.The vegetation of TdR comprises three major communities (Werger, 1973):
(1) Riverine communities. Mostly made up of the Acacia karoo–Celtis africanacommunity on the levees of fine alluvial sand. Usually three-layered consisting ofa tree layer, an open 2–4-m tall shrub layer, and a field layer up to 0)6 m consistingof grasses, herbs and small shrubs.
(2) Communities of the flats and gently sloping grassland. These are usually two-layered, with the most important being the grass and dwarf shrub layer between0)15 and 0)6m high.
(3) The communities of the steep slopes. This is the richest community bothfloristically and structurally, consisting of three or four layers. These are: a sparselayer of creeping and rosette plants up to 0)05 m; a grass and small shrub layer upto 0)8 m; a tall shrub layer between 1 and 4m; and sometimes an open tree layerup to 6 m high.
Study animals
One of the aims of the study was to habituate aardvarks in order to make feedingobservations. To achieve this, aardvarks were radio tagged to enable location andfollowing at night. Thirteen aardvarks were captured in cage traps set outside burrowentrances and immobilised using a combination of ketamine hydrochloride (Anaket-V,Centaur, Bayer A.H., Isando), medetomidine hydrochloride (Domitor, Novartis A.H.,Isando) and halothane (Fluothane, Zeneca) (Nel et al., 2000). Telonics' radio transmit-ters were implanted intra-abdominally (Telonics, Telemetry-Electronic Consultants,932 E. Impala Avenue, Mesa Arizona 85204-6699). Four aardvarks were habituated(two in 1996 and two in 1998) by following them on foot for periods of 3 h every night.This process took up to 3 months for each animal. Once tame, these aardvarks could beapproached at any time and observed from a distance of 1m. Nine aardvarks remainedunhabituated despite months of attempted following. Telemetry also enabled the deter-mination of home ranges, which made it possible to identify the source of faeces fromunhabituated aardvarks.
Faecal analysis
The heads of adult ants and termites remain intact while passing through the aardvarkGIT and can be extracted and identified from faeces. Generally faecal analysis only givesan approximate indication of dietary composition. Differential digestibility of dif-ferent food stuffs results in absolute proportions of residues in the faeces which maydiffer from the proportions in which the food stuffs were ingested (Putman,1984). Few foods have constant digestibility, as is the case with the insect exoskeletonwhich varies between taxa and between developmental stages. Adult ants and termites,however, have a strong cuticle which is sclerotised on the head (Rockstein, 1978).
FEEDING ECOLOGY OF THE AARDVARK 137
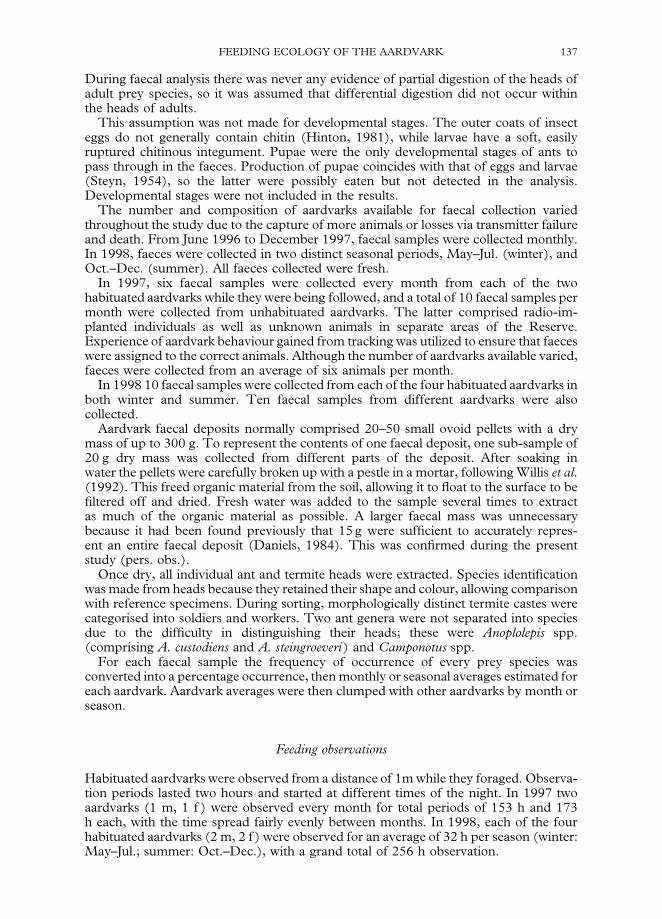
During faecal analysis there was never any evidence of partial digestion of the heads ofadult prey species, so it was assumed that differential digestion did not occur withinthe heads of adults.
This assumption was not made for developmental stages. The outer coats of insecteggs do not generally contain chitin (Hinton, 1981), while larvae have a soft, easilyruptured chitinous integument. Pupae were the only developmental stages of ants topass through in the faeces. Production of pupae coincides with that of eggs and larvae(Steyn, 1954), so the latter were possibly eaten but not detected in the analysis.Developmental stages were not included in the results.
The number and composition of aardvarks available for faecal collection variedthroughout the study due to the capture of more animals or losses via transmitter failureand death. From June 1996 to December 1997, faecal samples were collected monthly.In 1998, faeces were collected in two distinct seasonal periods, May–Jul. (winter), andOct.–Dec. (summer). All faeces collected were fresh.
In 1997, six faecal samples were collected every month from each of the twohabituated aardvarks while they were being followed, and a total of 10 faecal samples permonth were collected from unhabituated aardvarks. The latter comprised radio-im-planted individuals as well as unknown animals in separate areas of the Reserve.Experience of aardvark behaviour gained from tracking was utilized to ensure that faeceswere assigned to the correct animals. Although the number of aardvarks available varied,faeces were collected from an average of six animals per month.
In 1998 10 faecal samples were collected from each of the four habituated aardvarks inboth winter and summer. Ten faecal samples from different aardvarks were alsocollected.
Aardvark faecal deposits normally comprised 20–50 small ovoid pellets with a drymass of up to 300 g. To represent the contents of one faecal deposit, one sub-sample of20 g dry mass was collected from different parts of the deposit. After soaking inwater the pellets were carefully broken up with a pestle in a mortar, following Willis et al.(1992). This freed organic material from the soil, allowing it to float to the surface to befiltered off and dried. Fresh water was added to the sample several times to extractas much of the organic material as possible. A larger faecal mass was unnecessarybecause it had been found previously that 15 g were sufficient to accurately repres-ent an entire faecal deposit (Daniels, 1984). This was confirmed during the presentstudy (pers. obs.).
Once dry, all individual ant and termite heads were extracted. Species identificationwas made from heads because they retained their shape and colour, allowing comparisonwith reference specimens. During sorting, morphologically distinct termite castes werecategorised into soldiers and workers. Two ant genera were not separated into speciesdue to the difficulty in distinguishing their heads; these were Anoplolepis spp.(comprising A. custodiens and A. steingroeveri) and Camponotus spp.
For each faecal sample the frequency of occurrence of every prey species wasconverted into a percentage occurrence, then monthly or seasonal averages estimated foreach aardvark. Aardvark averages were then clumped with other aardvarks by month orseason.
Feeding observations
Habituated aardvarks were observed from a distance of 1m while they foraged. Observa-tion periods lasted two hours and started at different times of the night. In 1997 twoaardvarks (1 m, 1 f ) were observed every month for total periods of 153 h and 173h each, with the time spread fairly evenly between months. In 1998, each of the fourhabituated aardvarks (2 m, 2 f ) were observed for an average of 32 h per season (winter:May–Jul.; summer: Oct.–Dec.), with a grand total of 256 h observation.
138 W. A. TAYLOR ET AL.
The following were recorded during each 2 h observation period:
(1) Prey species identification;(2) Feed bout lengths (s). In 1997 the time was recorded from when aardvarks
started digging into an ant nest, to when it stopped inserting its snout into the dig.In 1998 it was recorded as the length of time the aardvark collected food,indicated by movement of the hyomandibular apparatus. This differencewas not important.
(3) Depth of food digs (cm).
Whenever an aardvark fed from an epigeal mound of Trinervitermes trinervoides, thefollowing information was recorded:
(1) Mound height: small (20 cm, medium 20–40 cm, and large '40 cm. Theheight of a mound was used as an index of population size since the twomeasurements are highly correlated (Adam, 1993);
(2) Whether or not the mound had been previously excavated;(3) The side of the mound opened up (north, south, etc.).
Calorific values of ants and termites
Calorific values of six prey species eaten in large numbers were determined usinga CP400 Mini Calorimeter (Cambridge Instruments). Soldiers, workers and alates ofT. trinervoides were tested separately to compare calorific values between castes, whileA. custodiens were collected in both summer and winter to compare seasons.
Estimation of densities of termite mounds
One hectare sampling grids were temporarily marked out at 10 sites within knownaardvark home ranges. Within each grid the number of epigeal T. trinervoides moundswere counted and categorized by height and whether or not they had been previouslyexcavated.
Prey choice and prey value
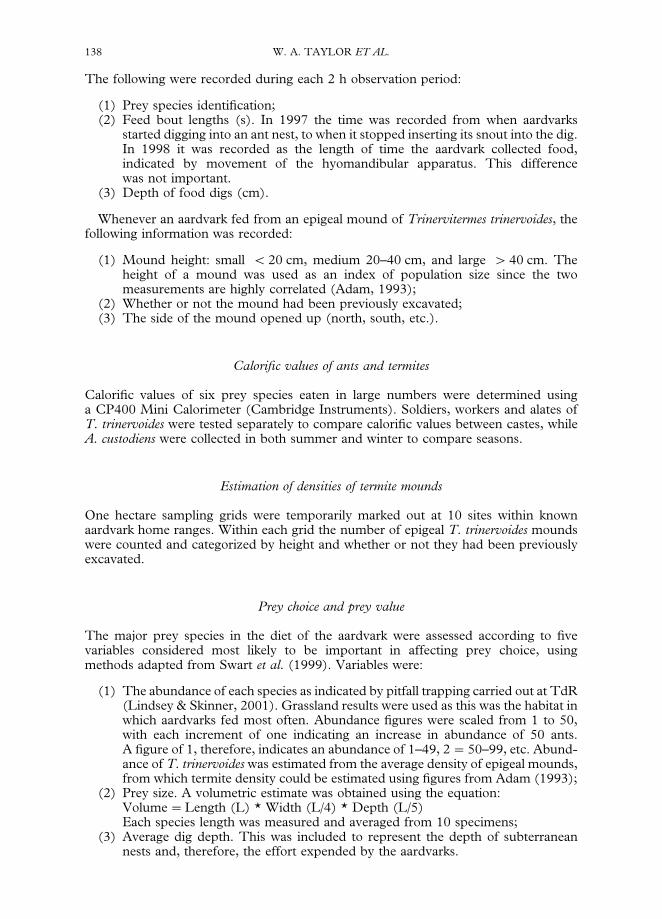
The major prey species in the diet of the aardvark were assessed according to fivevariables considered most likely to be important in affecting prey choice, usingmethods adapted from Swart et al. (1999). Variables were:
(1) The abundance of each species as indicated by pitfall trapping carried out at TdR(Lindsey & Skinner, 2001). Grassland results were used as this was the habitat inwhich aardvarks fed most often. Abundance figures were scaled from 1 to 50,with each increment of one indicating an increase in abundance of 50 ants.A figure of 1, therefore, indicates an abundance of 1–49, 2"50–99, etc. Abund-ance of T. trinervoides was estimated from the average density of epigeal mounds,from which termite density could be estimated using figures from Adam (1993);
(2) Prey size. A volumetric estimate was obtained using the equation:Volume"Length (L) * Width (L/4) * Depth (L/5)Each species length was measured and averaged from 10 specimens;
(3) Average dig depth. This was included to represent the depth of subterraneannests and, therefore, the effort expended by the aardvarks.
FEEDING ECOLOGY OF THE AARDVARK 139
(4) Aggressiveness. A figure of 1–5 (1 low, 5 high) was given to each species torepresent the defensive capabilities in the event of an attack on the nest by anaardvark. These figures were based upon observations made at feeding sites.
(5) Mobility. Values 1-5 as for aggression and based on observation.
These parameters were combined to generate a figure for prey value, using thefollowing equation:
Prey value"(Abundance * Size)/(Depth * Defence * Mobility)
Statistical analyses
Parametric tests were preferred, but when data were not normally distributed, ran-domization testing (5000 permutations) was carried out. The software used for therandomization tests came from Manly (1991), converted from FORTRAN intoQ-basic.
Analyses of seasonal variations in faecal prey species and their respective numericalcontribution to the diet of the aardvarks were carried out using the software packagePRIMER (Clarke & Warwick, 1994). This multivariate method bases its comparison oftwo or more samples on the extent to which these samples share particular species atcomparable levels of abundance (Clarke & Warwick, 1994). Analysis of similarity(ANOSIM) is a test built on a simple non-parametric permutation procedure, applied toa (rank) similarity matrix underlying the clustering of samples (Clarke & Warwick,1994). It was used on the frequency data of ants and termites in the faeces. For eachseason, 12 faecal sub-samples were randomly selected from six different aardvarks(two per aardvark) for the ANOSIM.
For analysis of mound predation by habituated aardvarks, s2 tests were used. Circularstatistics were used to test the orientation of digs into epigeal mounds. In the calculationof prey values it was assumed that each parameter was important to the aardvarks interms of prey selection. This assumption was tested with the use of backwards stepwiseregression.
Results
Faecal analysis
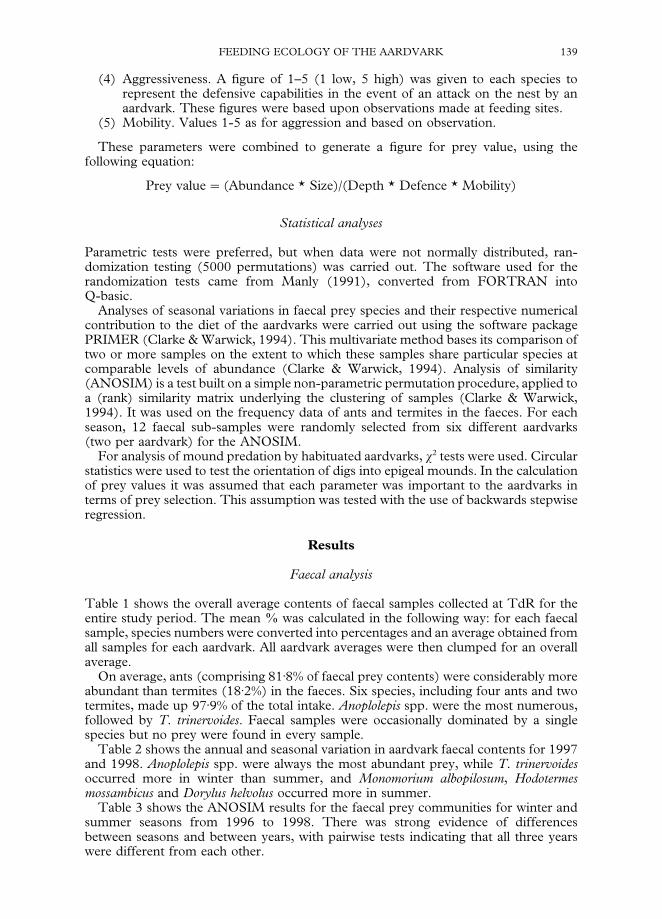
Table 1 shows the overall average contents of faecal samples collected at TdR for theentire study period. The mean % was calculated in the following way: for each faecalsample, species numbers were converted into percentages and an average obtained fromall samples for each aardvark. All aardvark averages were then clumped for an overallaverage.
On average, ants (comprising 81)8% of faecal prey contents) were considerably moreabundant than termites (18)2%) in the faeces. Six species, including four ants and twotermites, made up 97)9% of the total intake. Anoplolepis spp. were the most numerous,followed by T. trinervoides. Faecal samples were occasionally dominated by a singlespecies but no prey were found in every sample.
Table 2 shows the annual and seasonal variation in aardvark faecal contents for 1997and 1998. Anoplolepis spp. were always the most abundant prey, while T. trinervoidesoccurred more in winter than summer, and Monomorium albopilosum, Hodotermesmossambicus and Dorylus helvolus occurred more in summer.
Table 3 shows the ANOSIM results for the faecal prey communities for winter andsummer seasons from 1996 to 1998. There was strong evidence of differencesbetween seasons and between years, with pairwise tests indicating that all three yearswere different from each other.
Table 1. The overall contents of aardvark faecal samples at TdR from 1996to1998 (standard deviation in parentheses). Mean % were calculated from 12individual aardvarks and a total of 350 faecal samples. They were calculated in thefollowing way: for each faecal sample, species numbers were converted into percent-ages and an average obtained from all samples for each aardvark. These were thenclumped with other aardvark averages to give the overall average. % occurrence is the
percentage of faecal samples in which a prey species was found
Mean % Range % Occurrence IV
Anoplolepis spp. 68)4 (27)1) 0–100)0 95)8 65)50Monomorium albopilosum 7)4 (11)8) 0–92)2 78)6 5)81Dorylus helvolus 2)8 (11)1) 0–90)3 23)9 0)67Messor capensis 1)1 (3)3) 0–35)3 55)1 0)61Formicidae sp. 1 0)4 (1)3) 0–11)6 17)7 0)07Crematogaster spp. 0)4 (3)3) 0–50)4 8)5 0)03Camponotus spp. 0)3 (1)2) 0–16)4 27)4 0)08Other species 0)3 (1)7) 0–27)7 15)5 0)05Solenopsis punctaticeps 0)3 (2)7) 0–34)2 4)5 0)01Monomorium havilandi 0)1 (0)4) 0–3)4 46)6 0)05Pheidole spp. 0)1 (0)1) 0–1)1 7)5 0)01Formicidae sp. 2 0)1 (0)5) 0–4)3 7)0 0)01Formicidae sp. 3 0)1 (0)4) 0–6)9 6)7 0)01Trinervitermes trinervoides 15)3 (22)3) 0–98)9 82)5 12)63Hodotermes mossambicus 2)9 (10)6) 0–100)0 44)4 1)29
Importance value (IV)"(Mean % * % Occurrence)/100.
140 W. A. TAYLOR ET AL.
Table 4 shows average monthly variation in aardvark faecal contents for one year. Inevery month Anoplolepis spp. were the most abundant prey, followed by T. trinervoidesand M. albopilosum. Within all species there was considerable variation between monthsbut there were no apparent seasonal patterns.
Seasonal differences in the predation of A. custodians and T. trinervoides weretested statistically. May, June and July data were clumped as winter, while November,December and January data made up summer. Average percentages from nine aar-dvarks were used. For Anoplolepis spp. there was no seasonal difference (t"0)84,df."16, p"0)41), while for T. trinervoides there was evidence for a seasonal dif-ference (albeit not at the 0)05% level) (t"2)02, df."16, p"0)06). In winter aardvarksate more T. trinervoides than summer.
In 1997 T. trinervoides comprised an average of 64% soldiers and 36% workers in thefaeces. Worker numbers increased in winter then decreased again in the followingsummer. January and December had the lowest proportions of workers (25% and 24%respectively) while the winter months May to July had an average of 39%. October wasthe only month when workers outnumbered soldiers (54% workers).
Soldiers occurred in the faeces in larger numbers than expected (s2"3184, df."1,
p(0)001). Expected values were calculated by multiplying the percentage of a casteavailable (25% soldiers, 75% workers) (Adam, 1993) by the total number of soldiers andworkers in the faeces.
Feeding observations
At TdR aardvarks fed at night and exclusively from ant and termite nests. Ground feedsfor ants were mostly 5–30 cm deep, while digs as deep as 2 m were observed for the
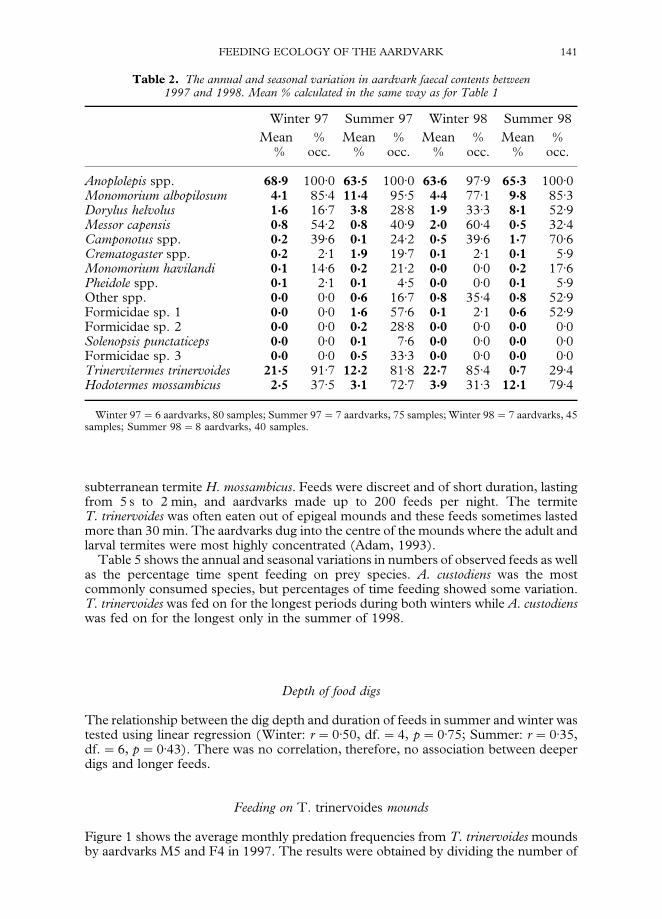
Table 2. The annual and seasonal variation in aardvark faecal contents between1997 and 1998. Mean % calculated in the same way as for Table 1
Winter 97 Summer 97 Winter 98 Summer 98Mean % Mean % Mean % Mean %
% occ. % occ. % occ. % occ.
Anoplolepis spp. 68'9 100)0 63'5 100)0 63'6 97)9 65'3 100)0Monomorium albopilosum 4'1 85)4 11'4 95)5 4'4 77)1 9'8 85)3Dorylus helvolus 1'6 16)7 3'8 28)8 1'9 33)3 8'1 52)9Messor capensis 0'8 54)2 0'8 40)9 2'0 60)4 0'5 32)4Camponotus spp. 0'2 39)6 0'1 24)2 0'5 39)6 1'7 70)6Crematogaster spp. 0'2 2)1 1'9 19)7 0'1 2)1 0'1 5)9Monomorium havilandi 0'1 14)6 0'2 21)2 0'0 0)0 0'2 17)6Pheidole spp. 0'1 2)1 0'1 4)5 0'0 0)0 0'1 5)9Other spp. 0'0 0)0 0'6 16)7 0'8 35)4 0'8 52)9Formicidae sp. 1 0'0 0)0 1'6 57)6 0'1 2)1 0'6 52)9Formicidae sp. 2 0'0 0)0 0'2 28)8 0'0 0)0 0'0 0)0Solenopsis punctaticeps 0'0 0)0 0'1 7)6 0'0 0)0 0'0 0)0Formicidae sp. 3 0'0 0)0 0'5 33)3 0'0 0)0 0'0 0)0Trinervitermes trinervoides 21'5 91)7 12'2 81)8 22'7 85)4 0'7 29)4Hodotermes mossambicus 2'5 37)5 3'1 72)7 3'9 31)3 12'1 79)4
Winter 97"6 aardvarks, 80 samples; Summer 97"7 aardvarks, 75 samples; Winter 98"7 aardvarks, 45samples; Summer 98"8 aardvarks, 40 samples.
FEEDING ECOLOGY OF THE AARDVARK 141
subterranean termite H. mossambicus. Feeds were discreet and of short duration, lastingfrom 5 s to 2 min, and aardvarks made up to 200 feeds per night. The termiteT. trinervoides was often eaten out of epigeal mounds and these feeds sometimes lastedmore than 30 min. The aardvarks dug into the centre of the mounds where the adult andlarval termites were most highly concentrated (Adam, 1993).
Table 5 shows the annual and seasonal variations in numbers of observed feeds as wellas the percentage time spent feeding on prey species. A. custodiens was the mostcommonly consumed species, but percentages of time feeding showed some variation.T. trinervoides was fed on for the longest periods during both winters while A. custodienswas fed on for the longest only in the summer of 1998.
Depth of food digs
The relationship between the dig depth and duration of feeds in summer and winter wastested using linear regression (Winter: r"0)50, df."4, p"0)75; Summer: r"0)35,df."6, p"0)43). There was no correlation, therefore, no association between deeperdigs and longer feeds.
Feeding on T. trinervoides mounds
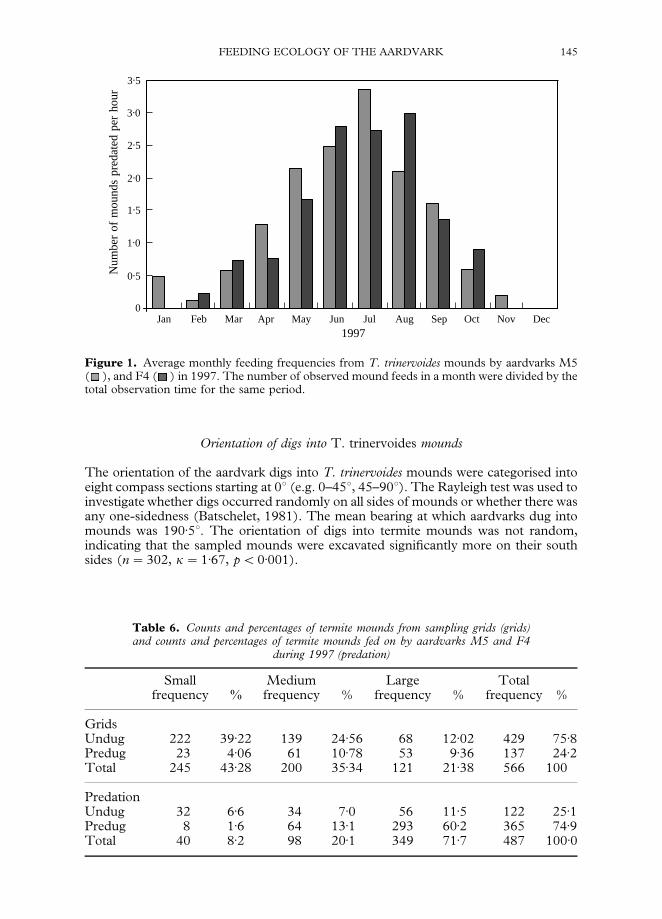
Figure 1 shows the average monthly predation frequencies from T. trinervoides moundsby aardvarks M5 and F4 in 1997. The results were obtained by dividing the number of
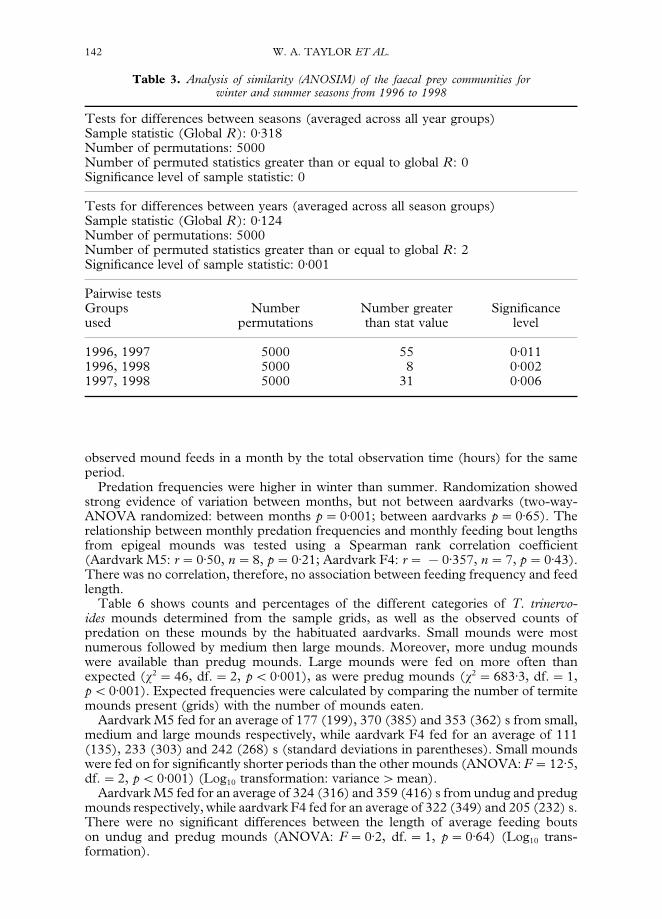
Table 3. Analysis of similarity (ANOSIM) of the faecal prey communities forwinter and summer seasons from 1996 to 1998
Tests for differences between seasons (averaged across all year groups)Sample statistic (Global R): 0)318Number of permutations: 5000Number of permuted statistics greater than or equal to global R: 0Significance level of sample statistic: 0
Tests for differences between years (averaged across all season groups)Sample statistic (Global R): 0)124Number of permutations: 5000Number of permuted statistics greater than or equal to global R: 2Significance level of sample statistic: 0)001
Pairwise testsGroups Number Number greater Significanceused permutations than stat value level
1996, 1997 5000 55 0)0111996, 1998 5000 8 0)0021997, 1998 5000 31 0)006
142 W. A. TAYLOR ET AL.
observed mound feeds in a month by the total observation time (hours) for the sameperiod.
Predation frequencies were higher in winter than summer. Randomization showedstrong evidence of variation between months, but not between aardvarks (two-way-ANOVA randomized: between months p"0)001; between aardvarks p"0)65). Therelationship between monthly predation frequencies and monthly feeding bout lengthsfrom epigeal mounds was tested using a Spearman rank correlation coefficient(Aardvark M5: r"0)50, n"8, p"0)21; Aardvark F4: r"!0)357, n"7, p"0)43).There was no correlation, therefore, no association between feeding frequency and feedlength.
Table 6 shows counts and percentages of the different categories of T. trinervo-ides mounds determined from the sample grids, as well as the observed counts ofpredation on these mounds by the habituated aardvarks. Small mounds were mostnumerous followed by medium then large mounds. Moreover, more undug moundswere available than predug mounds. Large mounds were fed on more often thanexpected (s2
"46, df."2, p(0)001), as were predug mounds (s2"683)3, df."1,
p(0)001). Expected frequencies were calculated by comparing the number of termitemounds present (grids) with the number of mounds eaten.
Aardvark M5 fed for an average of 177 (199), 370 (385) and 353 (362) s from small,medium and large mounds respectively, while aardvark F4 fed for an average of 111(135), 233 (303) and 242 (268) s (standard deviations in parentheses). Small moundswere fed on for significantly shorter periods than the other mounds (ANOVA: F"12)5,df."2, p(0)001) (Log10 transformation: variance'mean).
Aardvark M5 fed for an average of 324 (316) and 359 (416) s from undug and predugmounds respectively, while aardvark F4 fed for an average of 322 (349) and 205 (232) s.There were no significant differences between the length of average feeding boutson undug and predug mounds (ANOVA: F"0)2, df."1, p"0)64) (Log10 trans-formation).
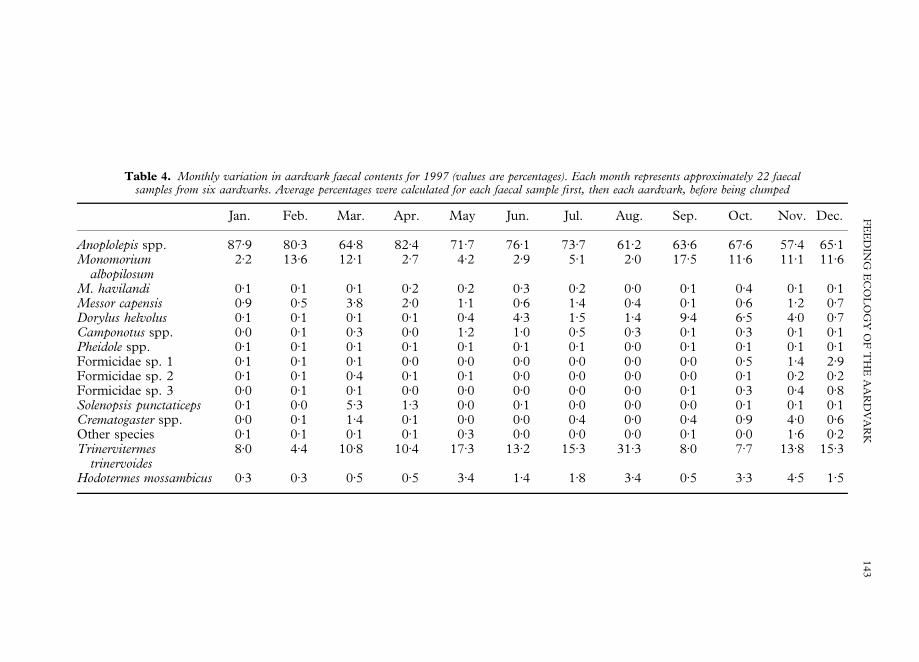
Table 4. Monthly variation in aardvark faecal contents for 1997 (values are percentages). Each month represents approximately 22 faecalsamples from six aardvarks. Average percentages were calculated for each faecal sample first, then each aardvark, before being clumped
Jan. Feb. Mar. Apr. May Jun. Jul. Aug. Sep. Oct. Nov. Dec.
Anoplolepis spp. 87)9 80)3 64)8 82)4 71)7 76)1 73)7 61)2 63)6 67)6 57)4 65)1Monomorium
albopilosum2)2 13)6 12)1 2)7 4)2 2)9 5)1 2)0 17)5 11)6 11)1 11)6
M. havilandi 0)1 0)1 0)1 0)2 0)2 0)3 0)2 0)0 0)1 0)4 0)1 0)1Messor capensis 0)9 0)5 3)8 2)0 1)1 0)6 1)4 0)4 0)1 0)6 1)2 0)7Dorylus helvolus 0)1 0)1 0)1 0)1 0)4 4)3 1)5 1)4 9)4 6)5 4)0 0)7Camponotus spp. 0)0 0)1 0)3 0)0 1)2 1)0 0)5 0)3 0)1 0)3 0)1 0)1Pheidole spp. 0)1 0)1 0)1 0)1 0)1 0)1 0)1 0)0 0)1 0)1 0)1 0)1Formicidae sp. 1 0)1 0)1 0)1 0)0 0)0 0)0 0)0 0)0 0)0 0)5 1)4 2)9Formicidae sp. 2 0)1 0)1 0)4 0)1 0)1 0)0 0)0 0)0 0)0 0)1 0)2 0)2Formicidae sp. 3 0)0 0)1 0)1 0)0 0)0 0)0 0)0 0)0 0)1 0)3 0)4 0)8Solenopsis punctaticeps 0)1 0)0 5)3 1)3 0)0 0)1 0)0 0)0 0)0 0)1 0)1 0)1Crematogaster spp. 0)0 0)1 1)4 0)1 0)0 0)0 0)4 0)0 0)4 0)9 4)0 0)6Other species 0)1 0)1 0)1 0)1 0)3 0)0 0)0 0)0 0)1 0)0 1)6 0)2Trinervitermes
trinervoides8)0 4)4 10)8 10)4 17)3 13)2 15)3 31)3 8)0 7)7 13)8 15)3
Hodotermes mossambicus 0)3 0)3 0)5 0)5 3)4 1)4 1)8 3)4 0)5 3)3 4)5 1)5
FE
ED
ING
EC
OL
OG
YO
FT
HE
AA
RD
VA
RK
143
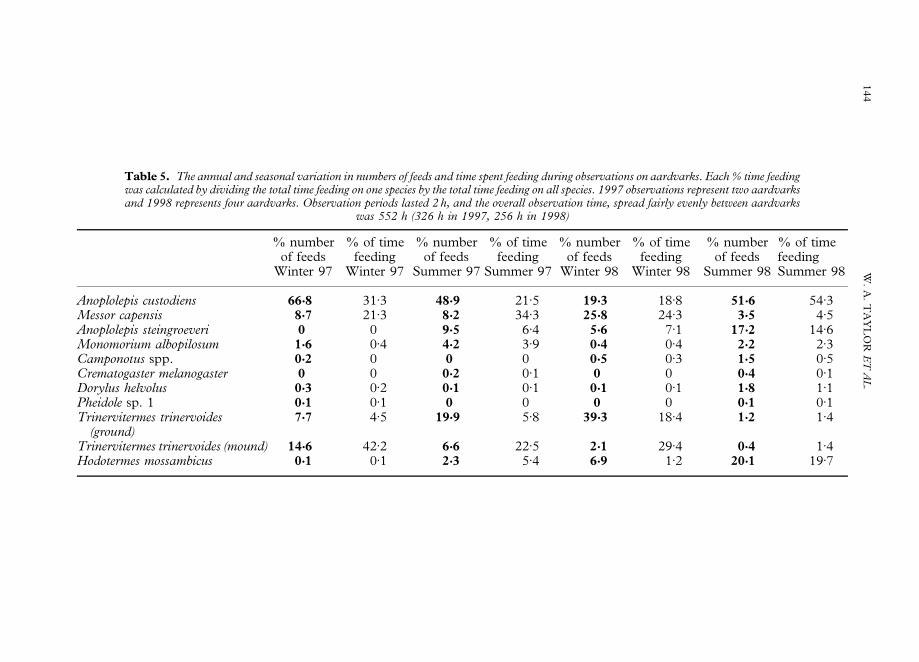
Table 5. The annual and seasonal variation in numbers of feeds and time spent feeding during observations on aardvarks. Each % time feedingwas calculated by dividing the total time feeding on one species by the total time feeding on all species. 1997 observations represent two aardvarksand 1998 represents four aardvarks. Observation periods lasted 2 h, and the overall observation time, spread fairly evenly between aardvarks
was 552 h (326 h in 1997, 256 h in 1998)
% number % of time % number % of time % number % of time % number % of timeof feeds feeding of feeds feeding of feeds feeding of feeds feeding
Winter 97 Winter 97 Summer 97 Summer 97 Winter 98 Winter 98 Summer 98 Summer 98
Anoplolepis custodiens 66'8 31)3 48'9 21)5 19'3 18)8 51'6 54)3Messor capensis 8'7 21)3 8'2 34)3 25'8 24)3 3'5 4)5Anoplolepis steingroeveri 0 0 9'5 6)4 5'6 7)1 17'2 14)6Monomorium albopilosum 1'6 0)4 4'2 3)9 0'4 0)4 2'2 2)3Camponotus spp. 0'2 0 0 0 0'5 0)3 1'5 0)5Crematogaster melanogaster 0 0 0'2 0)1 0 0 0'4 0)1Dorylus helvolus 0'3 0)2 0'1 0)1 0'1 0)1 1'8 1)1Pheidole sp. 1 0'1 0)1 0 0 0 0 0'1 0)1Trinervitermes trinervoides
(ground)7'7 4)5 19'9 5)8 39'3 18)4 1'2 1)4
Trinervitermes trinervoides (mound) 14'6 42)2 6'6 22)5 2'1 29)4 0'4 1)4Hodotermes mossambicus 0'1 0)1 2'3 5)4 6'9 1)2 20'1 19)7
144W
.A
.T
AY
LO
RE
TA
L.
0
0.5
1.0
1.5
2.0
2.5
3.0
3.5
Jan Feb Mar Apr May Jun Jul Aug Sep Oct Nov Dec1997
Num
ber
of m
ound
s pr
edat
ed p
er h
our
Figure 1. Average monthly feeding frequencies from T. trinervoides mounds by aardvarks M5( ), and F4 ( ) in 1997. The number of observed mound feeds in a month were divided by thetotal observation time for the same period.
FEEDING ECOLOGY OF THE AARDVARK 145
Orientation of digs into T. trinervoides mounds
The orientation of the aardvark digs into T. trinervoides mounds were categorised intoeight compass sections starting at 03 (e.g. 0–453, 45–903). The Rayleigh test was used toinvestigate whether digs occurred randomly on all sides of mounds or whether there wasany one-sidedness (Batschelet, 1981). The mean bearing at which aardvarks dug intomounds was 190)53. The orientation of digs into termite mounds was not random,indicating that the sampled mounds were excavated significantly more on their southsides (n"302, i"1)67, p(0)001).
Table 6. Counts and percentages of termite mounds from sampling grids (grids)and counts and percentages of termite mounds fed on by aardvarks M5 and F4
during 1997 (predation)
Small Medium Large Totalfrequency % frequency % frequency % frequency %
GridsUndug 222 39)22 139 24)56 68 12)02 429 75)8Predug 23 4)06 61 10)78 53 9)36 137 24)2Total 245 43)28 200 35)34 121 21)38 566 100
PredationUndug 32 6)6 34 7)0 56 11)5 122 25)1Predug 8 1)6 64 13)1 293 60)2 365 74)9Total 40 8)2 98 20)1 349 71)7 487 100)0
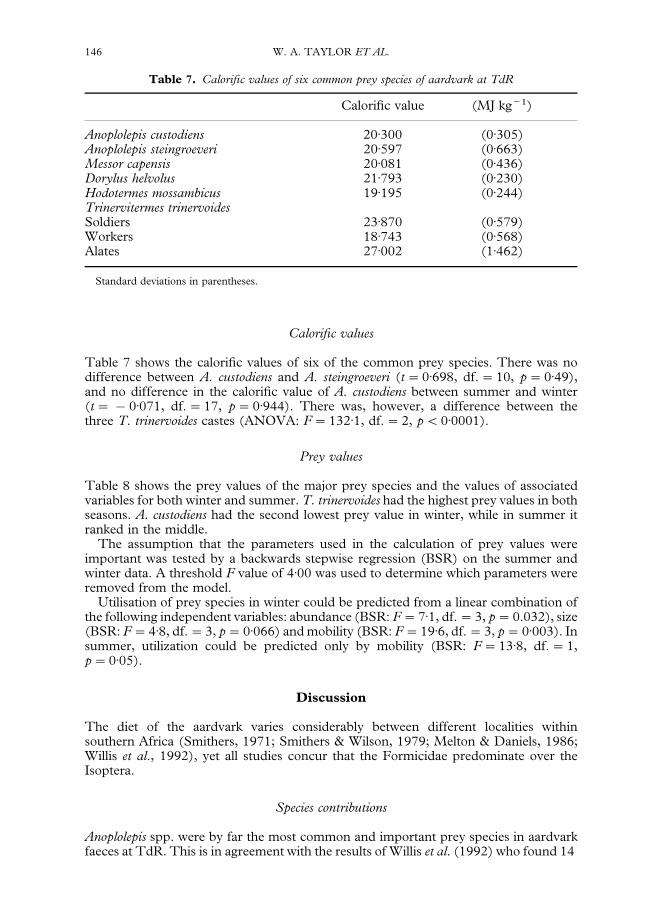
Table 7. Calorific values of six common prey species of aardvark at TdR
Calorific value (MJ kg~1)
Anoplolepis custodiens 20)300 (0)305)Anoplolepis steingroeveri 20)597 (0)663)Messor capensis 20)081 (0)436)Dorylus helvolus 21)793 (0)230)Hodotermes mossambicus 19)195 (0)244)Trinervitermes trinervoidesSoldiers 23)870 (0)579)Workers 18)743 (0)568)Alates 27)002 (1)462)
Standard deviations in parentheses.
146 W. A. TAYLOR ET AL.
Calorific values
Table 7 shows the calorific values of six of the common prey species. There was nodifference between A. custodiens and A. steingroeveri (t"0)698, df."10, p"0)49),and no difference in the calorific value of A. custodiens between summer and winter(t"!0)071, df."17, p"0)944). There was, however, a difference between thethree T. trinervoides castes (ANOVA: F"132)1, df."2, p(0)0001).
Prey values
Table 8 shows the prey values of the major prey species and the values of associatedvariables for both winter and summer. T. trinervoides had the highest prey values in bothseasons. A. custodiens had the second lowest prey value in winter, while in summer itranked in the middle.
The assumption that the parameters used in the calculation of prey values wereimportant was tested by a backwards stepwise regression (BSR) on the summer andwinter data. A threshold F value of 4)00 was used to determine which parameters wereremoved from the model.
Utilisation of prey species in winter could be predicted from a linear combination ofthe following independent variables: abundance (BSR: F"7)1, df."3, p"0.032), size(BSR: F"4)8, df."3, p"0)066) and mobility (BSR: F"19)6, df."3, p"0)003). Insummer, utilization could be predicted only by mobility (BSR: F"13)8, df."1,p"0)05).
Discussion
The diet of the aardvark varies considerably between different localities withinsouthern Africa (Smithers, 1971; Smithers & Wilson, 1979; Melton & Daniels, 1986;Willis et al., 1992), yet all studies concur that the Formicidae predominate over theIsoptera.
Species contributions
Anoplolepis spp. were by far the most common and important prey species in aardvarkfaeces at TdR. This is in agreement with the results of Willis et al. (1992) who found 14
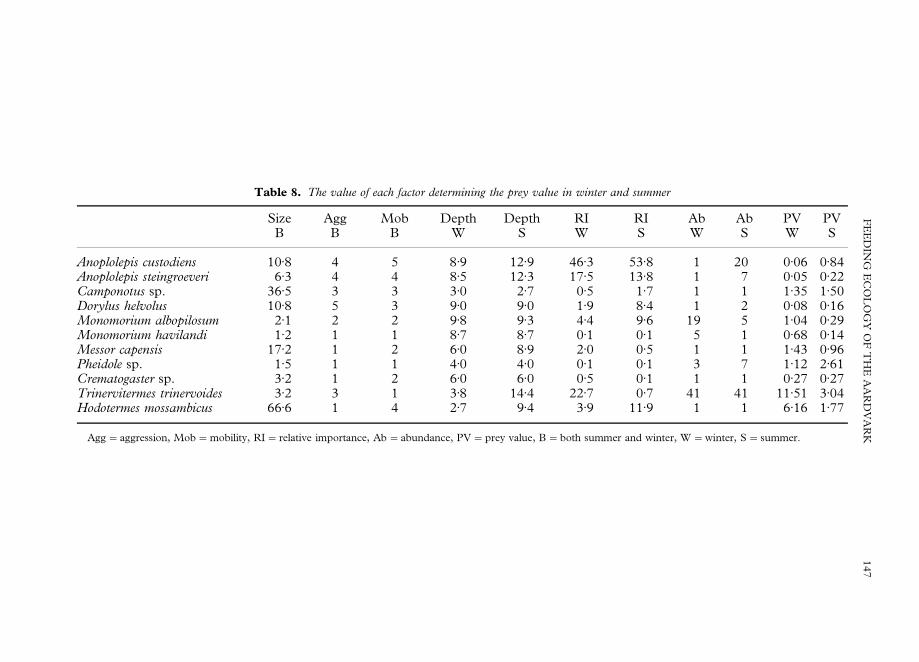
Table 8. The value of each factor determining the prey value in winter and summer
Size Agg Mob Depth Depth RI RI Ab Ab PV PVB B B W S W S W S W S
Anoplolepis custodiens 10)8 4 5 8)9 12)9 46)3 53)8 1 20 0)06 0)84Anoplolepis steingroeveri 6)3 4 4 8)5 12)3 17)5 13)8 1 7 0)05 0)22Camponotus sp. 36)5 3 3 3)0 2)7 0)5 1)7 1 1 1)35 1)50Dorylus helvolus 10)8 5 3 9)0 9)0 1)9 8)4 1 2 0)08 0)16Monomorium albopilosum 2)1 2 2 9)8 9)3 4)4 9)6 19 5 1)04 0)29Monomorium havilandi 1)2 1 1 8)7 8)7 0)1 0)1 5 1 0)68 0)14Messor capensis 17)2 1 2 6)0 8)9 2)0 0)5 1 1 1)43 0)96Pheidole sp. 1)5 1 1 4)0 4)0 0)1 0)1 3 7 1)12 2)61Crematogaster sp. 3)2 1 2 6)0 6)0 0)5 0)1 1 1 0)27 0)27Trinervitermes trinervoides 3)2 3 1 3)8 14)4 22)7 0)7 41 41 11)51 3)04Hodotermes mossambicus 66)6 1 4 2)7 9)4 3)9 11)9 1 1 6)16 1)77
Agg"aggression, Mob"mobility, RI"relative importance, Ab"abundance, PV"prey value, B"both summer and winter, W"winter, S"summer.
FE
ED
ING
EC
OL
OG
YO
FT
HE
AA
RD
VA
RK
147
148 W. A. TAYLOR ET AL.
prey species compared to 15 in the present study. Willis et al. (1992) found thatA. custodiens was present in all faecal samples, making up an average of 44% of the diet.Anoplolepis spp. occurred in 96% of faecal samples during the present study and madeup an average of 68% in the diet. The abundance of Anoplolepis spp. is the probablecause of them being so common in the aardvarks diet.
Trinervitermes trinervoides was the second most important prey species in the presentstudy, compared to third in that of Willis et al. (1992). The average proportions of totalnumbers were similar between the two studies (13)8% 1992 cf. 15)3% present) but thepercentage occurrence was different (30% 1992 cf. 83% present). Willis et al.(1992) found H. mossambicus in every faecal deposit, compared to 44% occurrence inthe present study.
The differential contributions made by the latter two prey species during the twostudies may be explained by temporal and spatial mosaics in their distributions. Therewas a time lapse of 10 years between studies, while data were collected from differ-ent sites within TdR. Ant and termite populations are known to have mosaic distribu-tions (Samways, 1983) and this was shown to be the case at TdR (Lindsey & Skinner,2001).
Seasonal variation in diet
Numbers of A. custodiens are lowest between May and July (Steyn, 1954; Lindsey& Skinner, 2001) when developmental stages are virtually non-existent. This suggestssummer is a relatively good time to eat them. However, no pattern of increased feedingon A. custodiens occurred in summer. This might be explained by two factors. First, eventhough A. custodiens numbers were low in winter, they were actually high relative tonumbers of other ant species (Lindsey & Skinner, 2001). Secondly, there was nodifference in the energy value of A. custodiens between seasons, making individualants just as valuable in winter.
Trinervitermes trinervoides differ from Anoplolepis spp. in several ways. First, theynest in hard mounds which require more effort to break into (pers. obs.). Secondly,large T. trinervoides mounds hold over 80,0000 termites (Adam, 1993), compared withA. custodiens nests which contain little over 1000 adult ants (Steyn, 1954). Thirdly,populations of adult T. trinervoides do not decrease significantly in winter months(Adam, 1993) so the number of termites per colony is not a limiting factor on predation.
Trinervitermes trinervoides is a nocturnal forager (Adam, 1993), while A. custodiens ispredominantly diurnal (Steyn, 1954; Willis et al., 1992). Surface activity of T. trinervo-ides virtually ceases in winter (Adam, 1993) and they are confined to their mounds. Inwarmer months the termites travel along shallow tunnels to foraging areas and are ofteneaten out of these.
Calorific values of T. trinervoides workers and soldiers do not vary between seasons,neither do their overall numbers. However, calorific values and numbers of alates dovary. Alate production begins in March and by October they are fully developed, withmaximum calorific value (Adam, 1993). The availability of alates might induce aar-dvarks to feed more from mounds in winter, but there was no evidence for this becauseany ingested alates would have been fully digested due to their soft bodies (Adam,1993).
Trinervitermes trinervoides occurred in higher percentages in the faeces in winter whenaardvarks fed from epigeal mounds. Aardvarks also eat T. trinervoides from foragingparties in summer, but as concentrations are higher in mounds, winter feeding predis-poses a higher intake rate and possibly more termites eaten overall. This contradicts thefindings of Melton (1976) and Willis et al. (1992), who found that termites were takenmore in summer than winter.
FEEDING ECOLOGY OF THE AARDVARK 149
ANOSIM showed that the prey communities within the faeces were differentbetween seasons and years. This indicates that, although T. trinervoides were eaten morein winter than summer, there was no seasonal pattern in the overall prey communityselection. Again, this can best be explained by temporal and spatial mosaics in preydistributions.
Predation of T. trinervoides castes
The relatively high proportion of workers ingested in winter compared to summer canperhaps be explained by the differing caste compositions of mounds and foragingparties. Foraging parties comprise 17% fewer workers than mound populations (Adam,1993), so the termites that aardvarks eat in summer comprise less workers. Moreover,the high proportion of soldiers ingested by aardvarks in 1997 contradicts the idea thataardvarks are deterred from eating soldiers by the distasteful terpenes contained withinthe soldiers heads (Richardson, 1987).
Predation of T. trinervoides mounds
The energy expended digging into a mound should be retrieved due to the largenumbers of prey inside. Observations of mound feeding indicated that aardvarks oftendug into the centre below ground level, where both adult and larval termites were highlyconcentrated (Adam, 1993). Rather than inhibiting the predation of T. trinervoides, theinactivity of this termite in winter makes it more accessible by concentrating its numbersin one place. Aardvarks preferentially selected large mounds over small ones, probablybecause large mounds have larger termite populations. They form a bigger resourceallowing aardvarks to spend more time feeding without depleting termite numbers toomuch. Moreover, alates are only produced in mounds over 30 cm, while 83% of moundsbetween 41 and 50 cm produce alates (Adam, 1993). In the present study mounds wereconsidered large when over 40 cm high, so it can be assumed that 83% or morecontained alates.
Predug mounds were also positively selected, probably as a result of the relative ease inwhich they could be re-excavated compared to the hard outer layers of untouchedmounds.
The orientation of aardvark digs on T. trinervoides mounds
As aardvarks fed from the central point of termite mounds, the digging effort shouldhave been the same from all sides. However, mounds were excavated significantly moreon their south sides. A possible explanation for this is that mound construction byT. trinervoides occurs most frequently on the southern side (Adam, 1993). This is incontrast to the study of Bernard & Peinke (1993) who found that most diggingsoccurred on the northern (32%) and eastern (28%) quadrants. They suggest that thiswas because in the southern hemisphere these quadrants of termitaria are the warmestand should contain most termites at night. Excavations into northern quadrants wouldthen be explained by optimal foraging theory based on the temperature differentialthat exists within the termite mound.
Prey values and choice
Of the 45 ant and termite species recorded at TdR (Willis et al., 1992; Lindsey& Skinner, 2001), only 15 were recorded in the diet of aardvarks during the present
150 W. A. TAYLOR ET AL.
study. The Formicines were highly preferred, while the Myrmicines were under-utilized,conforming to the findings of Redford (1987). The abundance of prey has beensuggested as an important factor in determining prey choice in myrmecophagousmammals (Redford, 1987; Abensperg-Traun, 1990). In the present study, abundancewas found to be predictive of utilization by aardvarks in winter, but not summer. Somespecies were not utilized in proportion to their abundance. T. trinervoides andM. albopilosum were both under-utilized relative to A. custodiens.
Aardvark forage in a haphazard manner, and this makes it likely that prey speciesabundance is important in determining their diet selection. For example, A. custodiens ismore widespread and numerous at TdR than A. steingroeveri (Lindsey & Skinner, 2001)and, if no preferential selection occurs between the two species, A. custodiens should beutilized more. This is indeed the case. In fact all the species of major importance in thediet of the aardvarks at TdR are extremely abundant in the area.
Prey mobility was predictive of prey utilization in both seasons. The mobility ofa species has the potential to rapidly reduce the value of a ‘prey patch’ (Abensperg-Traun, 1990) and encourage the aardvark to move to a fresh site. The high mobility ofH. mossambicus and A. custodiens, for example, rapidly reduces the prey density at thefeeding site. This seems to be a plausible explanation for the fact that aardvarksfrequently leave feeding sites despite the presence of hundreds of ants around the nestexit. The aardvarks tongue is vermiform, adapted for insertion into holes and tunnels,not for lapping up ants from the surface. As a result, once the ants have dispersed fromthe tunnel they are largely unavailable to the aardvark. In contrast, the low mobility ofT. trinervoides is probably a major reason behind the length of feeds upon the mounds.
Prey size was predictive of prey utilization in winter but not in summer, even thoughmost aardvark prey in summer were large. As the prey species have similar calorificvalues per unit mass it might be expected that the size of the various prey species wouldbe significant in prey choice. Greater calorific gains per ant would be achieved fromlarger ants.
Prey defence was not found to be predictive of prey utilization in the present studyalthough it has been found to be important in a number of other myrmecophages,including the pangolin Manis temminckii (Swart, 1996), the giant anteaterMyrmecophaga tridactyla (Redford, 1985), the vermilinguas Cyclopes didactylus andTamandua mexicana (Montgomery, 1985), and the echidna Tachyglossus aculeatus(Abensperg-Traun, 1990). Prey defences may cause irritation and premature cessationof feeding bouts in a number of species (Redford, 1987). It has been suggested that thepreference of myrmecophages for formicines over myrmicines can be explained in termsof prey defences.
The only prey species to visibly cause the aardvarks discomfort during feeding wasD. helvolus. The rest, including A. custodiens and H. mossambicus, which are recorded ascausing discomfort to pangolins (Swart, 1996), did not appear to affect theaardvarks. The defences of T. trinervoides did not deter aardvarks either. The hardmounds of this termite are an effective barrier to other myrmecophages, includingthe aardwolf (Richardson, 1987) and pangolin (Swart, 1996), but the aardvark is able todig into them with consummate ease. The chemical defences of T. trinervoides soldiersdo not prevent predation by aardvarks either, despite suggestions to the contrary(Richardson, 1987, 1994; Anderson, 1994). The proportions of soldier T. trinervoides inaardvark faeces were significantly higher than proportions in mounds, indicating that theaardvark is not too careful to avoid their ingestion. Therefore, the effect of preydefences upon the feeding patterns of the aardvark appears limited.
The effect of prey defences may be reduced by certain behavioural characteristicsof aardvark. First, on reaching prey nests they dig rapidly and feed frantically, enablingprey consumption to occur before the concentration of soldiers can increase signifi-cantly. Secondly, frequent digging during feeding probably has the effect of remov-ing any build up of soldiers. Thirdly, aardvarks do not chew their food (aside from
FEEDING ECOLOGY OF THE AARDVARK 151
M. capensis) and this reduces the release of chemical defences of certain prey. Redford(1983) showed that the efficacy of prey defences depends upon the size of thepredator and the aardvark is likely to be less affected than smaller species.
If energy is limiting, one would expect the cost of prey extraction to be of importancein prey selection. Digging is energetically costly and differences in the depths of thevarious species may affect their value as prey items. However, several points suggestthat this factor is of little importance in prey choice by the aardvark. For example, thedepth at which the various species were fed upon was not correlated with utilization orfeed length in either season, suggesting that digs were made to the depth required toexpose prey regardless of value. Moreover, aardvarks did not spend longer feeding inpreviously undug mounds that would have used up more energy to dig open thanpredug mounds. In contrast, the pangolin has been shown to make longer feeds uponspecies where the depth of the digs is greater, indicating that more effort wasexpended for species of higher value (Swart, 1996). In addition, the differencebetween the average depths of the feeds upon the various species of major importance inthe diet was small and in energetic terms, probably insignificant.
Summary
In keeping with previous studies, aardvarks fed predominantly on ants, with A. custodiensbeing the most important prey species in all seasons and years. Out of 15 prey speciesidentified, almost 98% of the aardvarks diet comprised only six species. There were noclearly defined seasonal patterns in prey species selection, although the termiteT. trinervoides was eaten more in winter than summer. This disagrees with previousfindings. It is possible that increased termite predation in winter may have supplementedthe aardvarks diet at a time when numbers of A. custodiens were at their lowest.T. trinervoides soldiers were consumed in larger numbers than expected indicating thatthey are not avoided as previously suggested.
Martin Haupt and Mike Hoffmann provided invaluable technical and field support, whilefield assistance was given by Sean O’Sullivan, Paul Henning, Gael Le Roch and Sarah Gillette.Hector Dott provided statistical advice, Hamish Robertson identified ant species, and LukeHunter, Ryan Johnson and Theo Wassenaar provided valuable discussion during the analyses. Wethank the Free State Department of Environmental Affairs and Tourism for allowing theresearch and in particular, Mark Roods, Francois van den Berg, Savvas Vrahimis, Rodney Adam,and Pierre Nel who performed the laparotomies. Two anonymous referees contributed greatly viaconstructive comments to an improved script.
References
Abensberg-Traun, M. (1990). Patch selection and patch use in the Echidna Tachyglossus aculeatusShaw 1792 (Monotremata: Tachyglossidae), in western Australian wheatbelt reserves. Ph.D.thesis, University of Western Australia, Perth. 252 pp.
Adam, R.A. (1993). Aspects of the biology of the harvester termite Trinervitermes trinervoides(Sjostedt) (Isoptera:Termitidae). Ph.D. thesis, University of the Orange Free State, Bloemton-tein. 226 pp.
Anderson, M.D. (1994). The influence of seasonality and quality of diet on the metabolism of theaardwolf, Proteles cristatus (Sparrman 1783). M.Sc. thesis, University of Pretoria, Pretoria. 176 pp.
Batschelet, E. (1981). Circular Statistics in Biology. London: Academic Press. 371 pp.Bernard, R.T.F. & Peinke, D. (1993). Is the orientation of aardvark diggings into termitaria
optimal? Naturwissenschaften, 80: 422–424.Clarke, K.R. & Warwick, R.M. (1994). Change in Marine Communities: an Approach to Statistical
Analysis and Interpretation. Plymouth Marine Laboratory. Bournemouth, UK: Bourne PressLimited. 144 pp.
152 W. A. TAYLOR ET AL.
Daniels, C. (1984). Some aspects of habitat utilization and feeding ecology of the aardvarkOrycteropus afer. B.Sc. (Hons) thesis, University of Natal, Pietermaritzburg. 71 pp.
Hinton, H.E. (1981). Biology of Insect Eggs, Vol. 1. New York: Pergamon Press. 172 pp.Hoffman, T. (1996). Eastern Mixed Nama Karoo. In: Low, A.B. & Rebelo, A.G. (Eds),
Vegetation of South Africa, Lesotho and Swaziland, pp. 52–57. Pretoria: Dept EnvironmentalAffairs and Tourism. 85 pp.
Lindsey, P.A. & Skinner, J.D. (2001). Ant composition and activity patterns as determined bypitfall trapping and other methods in three habitats in the semi-arid Karoo. Journal of AridEnvironments, 48: 551–568.
Manly, B.F.J. (1991). Randomization and Monte Carlo Methods in Biology. London: Chapman andHall. 281 pp.
Melton, D.A. (1976). The biology of aardvark (Tubulidentata-Orycteropodidae). MammalReview, 6: 75–88.
Melton, D.A. & Daniels, C. (1986). A note on the ecology of the aardvark, Orycteropus afer. SouthAfrican Journal of Wildlife Research, 16: 112–114.
Montgomery, G.G. (1985). Impact of vermilinguas (Cyclopes, Tamandua: Xenartha"Edentata)on arboreal ant populations. In: Montgomery, G.G. (Ed.), The Evolution and Ecology ofArmadillos, Sloths and Vermilinguas, pp. 351–363. Washington: Smithsonian Institution Press.451 pp.
Nel, P.J., Taylor, W.A., Haupt, M.A. & Meltzer, D.G.A. (2000). Capture and immobilization ofaardvark (Orycteropus afer) using different drug combinations. Journal of the South AfricanVeterinary Association, 71: 58–63.
Putman, R.J. (1984). Facts from faeces. Mammal Review, 14: 79–97.Redford, K.H. (1983). Mammalian myrmecophagy: feeding, foraging and food preference. Ph.D.
thesis, Harvard University, Cambridge, MA. 299 pp.Redford, K.H. (1985). Feeding and food preference in captive and wild giant anteaters. Journal of
Zoology, 205: 559–572.Redford, K.H. (1987). Ants and termites as food: patterns of mammalian myrmecophagy. In:
Genoways, H.H. (Ed.), Current Mammalogy. Vol. 1. pp. 349–399. New York: Plenum Press.513 pp.
Richardson, P.R.K. (1987). Aardwolf: the most highly specialised myrmecophagous mammal?South African Journal of Science, 83: 405–410.
Rockstein, M. (1978). Biochemistry of Insects. New York: Academic Press. 649 pp.Samways, M.J. (1983). Community structure of ants (Hymenoptera: Formicidae) in a series of
habitats associated with citrus. Journal of Applied Ecology, 20: 833–847.Skinner, J.D. & Smithers, R.H.N. (1990). The Mammals of the Southern African Subregion (2nd
Edn), Pretoria: University of Pretoria. 771 pp.Smithers, R.H.N. (1971). The Mammals of Botswana. Museums Memoir. National Museums and
Monuments of Rhodesia, 4: 188–199.Smithers, R.H.N., & Wilson, V.J. (1979). Check list and atlas of the mammals of Zimbabwe
Rhodesia. Museum Memoir, 9: 147 pp.Steyn, J.J. (1954). The pugnacious ant (Anoplolepis custodiens Smith) and its relation to the control
of citrus scales at Letaba. Memoirs of the Entomological Society of South Africa, 3: 1–96.Swart, J.M. (1996). Foraging behaviour of the Cape pangolin Manis temminckii in the Sabi Sand
Wildtuin. M.Sc. thesis, University of Pretoria, Pretoria. 149 pp.Swart, J.M., Richardson, P.R.K. & Ferguson, J.W.H. (1999). Ecological factors affecting the
feeding behaviour of pangolins (Manis temminckii ). Journal of Zoology, 247: 281–292.Werger, M. J. A. (1973). An account of the plant communities of Tussen die Riviere Game Farm,
Orange Free State. Bothalia, 11: 165–176.Willis, C.K., Skinner, J.D., & Robertson, H.G. (1992). Abundance of ants and termites in the
False Karoo and their importance in the diet of the aardvark, Orycteropus afer. African Journal ofEcology, 30: 322–334.


![index [assets.cambridge.org]assets.cambridge.org/97811074/06933/index/9781107406933_index… · index Aardvark (Orycteropus afer) 153Aardwolf (Proteles cristatus) 23, 31, 153, 154,159](https://img.dokumen.tips/doc/110x75/5ec8350f4707967199320090/index-index-aardvark-orycteropus-afer-153aardwolf-proteles-cristatus-23.jpg)