Embed Size (px)
Citation preview

Immigration, Health & Work
The Facts Behind the Myths
M i g r a t i o n , H e a l t h & W o r k :
Facts Behind the Myths
Acknowledgments:
The production of this document was made possible through the bi-national collaborative work of the Mexican Secretariat of Health, the University of California and The California Endowment. The research team was conducted by Steve Wallace, Xóchitl Castañeda, and Sylvia Guendelman with the assistance of Emily Felt, Imelda Padilla-Frausto and Jennifer Lee. We would like thank Maritza Moreno on the book layout, Jeremiah Cothren and Lauro Parra on the cover design, Bill MacGregor, Al Averbach and Sergi Bach on editing and Mariana Gumá Montalvo on the Spanish translation. Marc Schenker (UC Davis) and Almudena Ortiz provided the cover photography. This volume is the result of the valuable contributions from the following individuals and institutions:
University of California (UC) Office of the President & UC Berkeley,
School of Public Health
Health Initiative of the Americas (HIA)
Xóchitl Castañeda, Director Emily Felt, Binational Health AnalystAl Averbach, EditorBill MacGregor, EditorJeremiah Cothren, Program AssistantLauro Parra, Program Assistant
University of California, Los Angeles, School of Public Health
Center for Health Policy Research
Steven P. Wallace, Associate DirectorImelda Padilla-Frausto, Senior Research Associate
University of California, Berkeley, School of Public Health
Sylvia Guendelman, Professor
Copyright © 2007 By the Regents of the University of California and the Mexican Secretariat of Health (SSA)
Migration, Health & Work: Facts Behind the Myths First edition: October 2007 ISBN 978-970-721-436-1
The reproduction of this document for non-commercial purposes or classroom use is allowed, provided that the source is cited. Printed in Mexico
www.ucop.edu/cprc/hia
www.healthpolicy.ucla.edu
http://sph.berkeley.edu
www.calendow.org
www.salud.gob.mx
Foreword / 5CHAPTER 1 Characteristics of Mexican Immigrants in the United States / 9 Mexicans make up the largest proportion of the foreign-born workforce in the United States / 9 A majority of Mexican immigrants live in California and Texas but are increasingly well represented in many other states / 10 Mexican immigrants tend to concentrate in large urban localities / 10 Most Mexican immigrants are young adults / 11 A high proportion of Mexican immigrant adults live in poverty / 11 Mexican immigrants are in good overall health / 11 Summary / 12CHAPTER 2Mexican Immigrants in the U.S. Labor Force / 13 Recent Mexican immigrant men have a 94% U.S. labor force participation rate / 13 Mexican immigrant women’s labor force rates are lower / 13 Mexican immigrant men are concentrated in construction and service occupations nationally / 14 Mexican immigrant women are most commonly found in service occupations / 15 Low-wage industries rely heavily on Mexican immigrant men / 15 California relies more heavily on Mexican immigrant men than the nation as a whole / 15 Many occupations rely heavily on Mexican immigrant women / 16 Jobs fi lled by Mexican immigrant workers frequently pay the lowest wages / 17 Jobs fi lled by Mexican immigrants are the least likely to off er health insurance, leaving most of their workers uninsured / 18 Type of employment and uninsurance rates among Mexican immigrants / 19 Summary / 20CHAPTER 3Occupational Health Risks to Mexican Immigrants in the U.S. Labor Force / 21 Mexican immigrants are at particularly high risk for being killed or fatally injured at work / 21 The risk of non-fatal work-related injuries and illnesses is also higher in occupations that rely heavily on Mexican immigrant labor / 22 Common types and causes of non-fatal occupational injuries and illnesses among Latinos / 23 Farm work accounts for 13% of all workplace fatalities, making it one of the most dangerous occupations in the U.S. / 24 Day laborers’ job injuries receive scarce medical attention / 24 Barriers hinder the reporting of injuries and workers’ compensation claims / 25 Summary / 26Policy Considerations / 29Conclusions / 30
Contents

5
Foreword
The United States has been a nation of immigrants. Throughout the course of the nineteenth century, European immigration was widespread. With each new wave of migration, these groups brought new productive capacity and labor power that fueled the economic growth of the country. They also brought rich social traditions from their countries of origin, adding to the unique cultural mix in the United States. During the past century, the United States has continued to draw immigrants, though the ori-gin of much of this migration has shifted from the European continent to Latin America and Asia. No less important than other groups before them, La-tino immigrants are a key part of the base that helps satisfy the U.S. demand for labor. As such, the health of these workers and their families is essential in guaranteeing their continuing social and economic contribution to the nation. Healthcare and immigration are both leading politi-cal issues. They have come to the forefront of politi-cal debate for diff erent reasons, but they are increas-ingly interconnected. It is unfortunate that public discourse tends to connect immigrants with over-burdened U.S. public health insurance programs, implying that they consume large quantities of lim-ited healthcare resources. This myth is not substanti-ated by data. Past policy that denies social services to immigrants has not deterred migration. In fact, factors relating to employment and immigration status mean that immigrants often take the most detrimental and dangerous jobs even as they face restricted access to healthcare and social services.
This report is the third in a series that focuses on La-tino immigrant health in the United States. This vol-ume focuses on Mexican immigrants in particular as the largest Latino immigrant group in the U.S., and in recognition that people from many Latin Ameri-can countries often have similar experiences as
immigrant workers. Here we give special attention to the situation low-wage immigrant workers face when they come to the United States, in particular the way in which their occupations and immigration status may imply a cost for their health. Latino im-migrants are generally not looking for a free-ride of U.S. social services. They tend to come from work-ing class backgrounds and are better educated than the general population in their countries of origin. Though they are typically in good health when they emigrate to the U.S., studies show that the health of immigrants deteriorates with the length of their stay. This report shows that in the case of Mexican immigrants, workplace conditions and the type of work performed contribute to disparities in health outcomes that Latinos in the U.S. must endure.
The fi rst section of this report presents data on the trends and overall characteristics of Mexican immi-grants. It documents that Mexican immigrants ar-rive in the U.S. largely during their prime working ages and in good health, but live with low incomes. Working for low wages means they must reside in neighborhoods with scarce public investment and that often suff er high levels of violence. The second section documents the importance of Mexican immigrant workers in certain segments of the U.S. economy, as shown by the occupations where they are heavily concentrated. A high per-centage of Mexican immigrants work as low-wage service providers for the American middle-class, as dishwashers, cooks, and gardeners, and occupy jobs that are unfi lled through local demand as meat-packers and seasonal agricultural workers. These low wage industries involve greater physical risk of work related injury and rarely off er health insurance. Previous versions of this volume show that Latino workers and their families are less likely than non-La-tino Whites to be covered by insurance, have a usual
M i g r a t i o n , H e a l t h & W o r k : Facts Behind the Myths
6
source of healthcare, get maternal care, receive im-munizations and use hospital services. They are also less likely to rely on emergency rooms and use pub-lic health programs, countering the myth that they make disproportionate use of public resources. Lati-no communities have fewer healthcare providers, and when families do find care, they may go to a community clinic rather than a private physician.
The third section documents the occupational haz-ards that Latino immigrants face. They have a higher risk of death and disability at work than other groups, in large part because of the dangerous occupations that they are more likely to work at. It is counter to concepts of fairness and justice that a population that works for very low wages and is often not pro-vided with health insurance is the same population that is most likely to suff er from work related health problems.
Finally, this report draws general conclusions and discusses policy considerations. The health and well-being of Latino immigrant workers has important implications for their communities in the U.S. and for public health generally. The political response to immigration for the past decade has largely been to restrict immigrants’ access to public services. The Na-tional Conference of State Legislatures reports that
in the fi rst half of 2007 alone, state legislatures have introduced 1,404 pieces of legislation related to im-migration; more than double the number in 2006. Nine states enacted laws on health issues and 26 employment laws were passed in 19 states, mostly intending to curb immigrants’ access to jobs. Several states enacted bills that would exclude certain agri-cultural workers from unemployment benefi ts, and fi ve states enacted bills that would exclude undocu-mented residents from receiving public services.
The failure of broad-based immigration reform at the federal level aggravates barriers that reduce ac-cess to health services for Latino immigrants in the U.S. While community health clinics in some states help support immigrant health needs, these immi-grant workers themselves still bear much of the so-cial cost of low-wage, high risk labor and vulnerabil-ity that stems from their immigration status. There are many opportunities to shape policy to promote immigrant health, with the recognition that thriv-ing immigrant communities are an important part of American society both in an economic and social sense. Given the increasing economic interaction of the U.S. and Latin America and the likelihood of continued migratory pressures, we should not wait to pursue immigrant health policy solutions even as we await comprehensive immigration reform.
Dr. José Ángel Córdova Villalobos Secretary of Health of the Government of Mexico
Xóchitl Castañeda Director, Health Initiative of the Americas University
of California, Offi ce of the President School of Public Health, University of California,
Berkeley
Dr. Robert Ross President and CEO
The California Endowment
M i g r a t i o n , H e a l t h & W o r k :Facts Behind the Myths

9
Mexicans make up the largest
proportion of the foreign-born
workforce in the United States
The United States is a country of immigrants, though the geographic sources of immigration have varied over time. There have been several periods of high levels of immigration, each privileging diff erent mix-es of nationalities in the country. In the 1800s the foreign-born living in the U.S. came primarily from Western and Northern Europe. In 1890 over three-fourths of the 9.2 million U.S. residents born abroad were of Western and Northern European origin. To-gether, Germany, Ireland, and England accounted for 60% of the immigrant population.
In the early 1900s, immigration from Southern and Eastern European countries grew rapidly. By 1930, 40% of the 14.2 million immigrants residing in the United States hailed from those regions. Among all foreign-born U.S. residents in 1930, the most com-mon countries of birth were Italy, Poland, Russia/the Soviet Union, Germany, and Canada: over one mil-lion U.S. immigrants had been born in each of those countries.1
Another wave of immigration began in the 1960s, with Asia and Latin America supplying most of the immigrants. In 1980 there were 14.1 million immi-grants living in the United States. Mexico had be-come the most common foreign country of birth: 2.2 million Mexican immigrants were living in the U.S. at the time. There has been a steady increase—over 50% from 1996 to 2006—in the number of Mexican
CHAPTER 1 CHARACTERISTICS OF MEXICAN IMMIGRANTS
IN THE UNITED STATES
1 Campbell J. Gibson and Emily Lennon. 1999. “Historical Census Statistics on the Foreign-born Population of the United States: 1850-1990.” Population Division Working Paper No. 29. Washington, D.C.: U.S. Bureau of the Census.
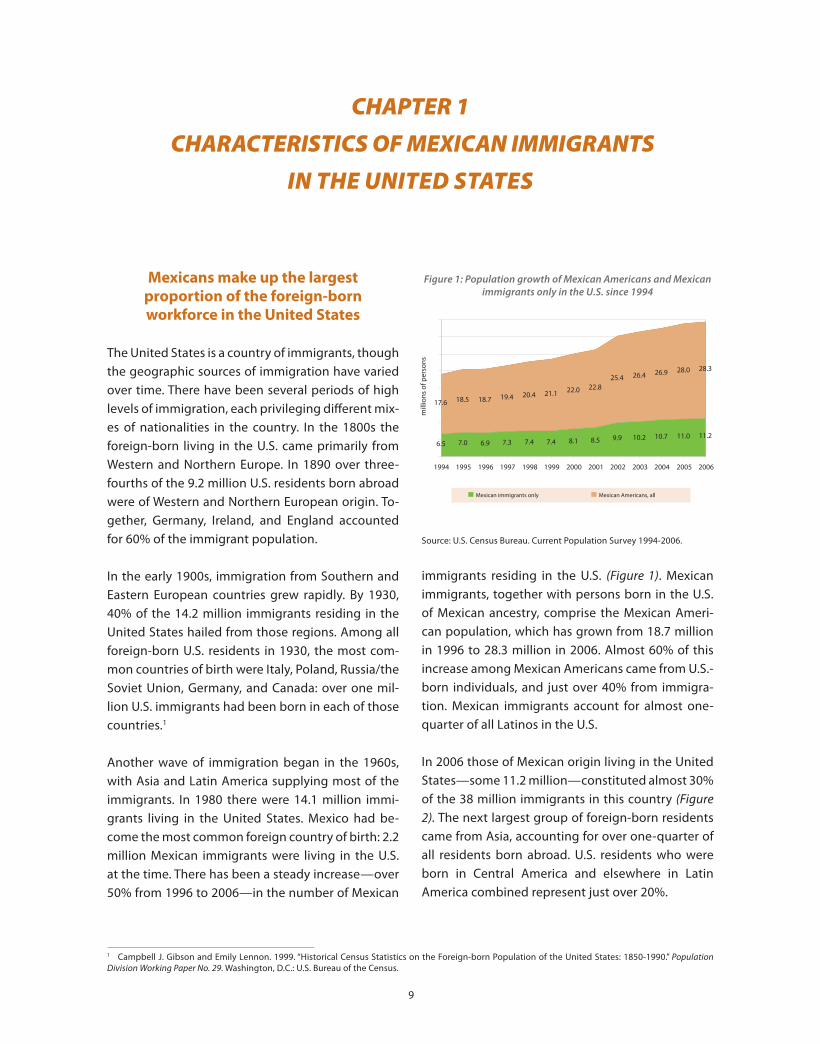
immigrants residing in the U.S. (Figure 1). Mexican immigrants, together with persons born in the U.S. of Mexican ancestry, comprise the Mexican Ameri-can population, which has grown from 18.7 million in 1996 to 28.3 million in 2006. Almost 60% of this increase among Mexican Americans came from U.S.-born individuals, and just over 40% from immigra-tion. Mexican immigrants account for almost one-quarter of all Latinos in the U.S.
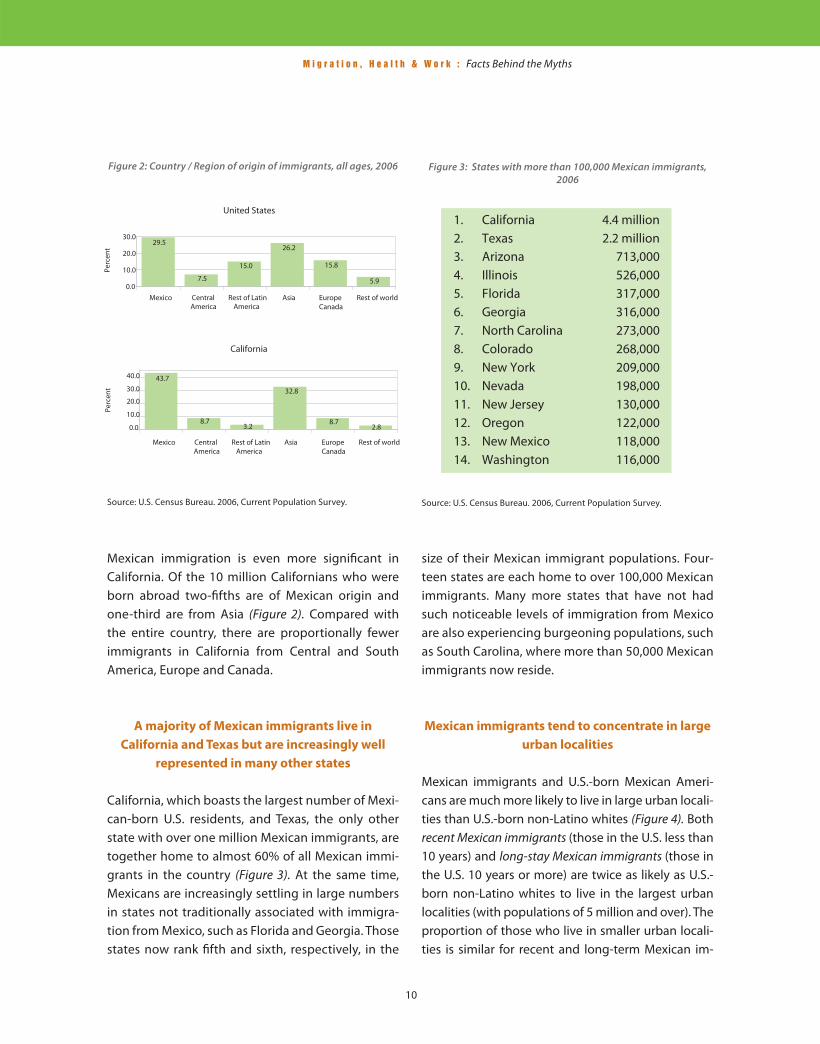
In 2006 those of Mexican origin living in the United States—some 11.2 million—constituted almost 30% of the 38 million immigrants in this country (Figure 2). The next largest group of foreign-born residents came from Asia, accounting for over one-quarter of all residents born abroad. U.S. residents who were born in Central America and elsewhere in Latin America combined represent just over 20%.
Figure 1: Population growth of Mexican Americans and Mexican immigrants only in the U.S. since 1994
Source: U.S. Census Bureau. Current Population Survey 1994-2006.
M i g r a t i o n , H e a l t h & W o r k : Facts Behind the Myths
10
Figure 2: Country / Region of origin of immigrants, all ages, 2006
Source: U.S. Census Bureau. 2006, Current Population Survey.
Mexican immigration is even more signifi cant in California. Of the 10 million Californians who were born abroad two-fi fths are of Mexican origin and one-third are from Asia (Figure 2). Compared with the entire country, there are proportionally fewer immigrants in California from Central and South America, Europe and Canada.
A majority of Mexican immigrants live in
California and Texas but are increasingly well
represented in many other states
California, which boasts the largest number of Mexi-can-born U.S. residents, and Texas, the only other state with over one million Mexican immigrants, are together home to almost 60% of all Mexican immi-grants in the country (Figure 3). At the same time, Mexicans are increasingly settling in large numbers in states not traditionally associated with immigra-tion from Mexico, such as Florida and Georgia. Those states now rank fi fth and sixth, respectively, in the
Figure 3: States with more than 100,000 Mexican immigrants, 2006
Source: U.S. Census Bureau. 2006, Current Population Survey.
size of their Mexican immigrant populations. Four-teen states are each home to over 100,000 Mexican immigrants. Many more states that have not had such noticeable levels of immigration from Mexico are also experiencing burgeoning populations, such as South Carolina, where more than 50,000 Mexican immigrants now reside.
Mexican immigrants tend to concentrate in large
urban localities
Mexican immigrants and U.S.-born Mexican Ameri-cans are much more likely to live in large urban locali-ties than U.S.-born non-Latino whites (Figure 4). Both recent Mexican immigrants (those in the U.S. less than 10 years) and long-stay Mexican immigrants (those in the U.S. 10 years or more) are twice as likely as U.S.-born non-Latino whites to live in the largest urban localities (with populations of 5 million and over). The proportion of those who live in smaller urban locali-ties is similar for recent and long-term Mexican im-
M i g r a t i o n , H e a l t h & W o r k : Facts Behind the Myths
11
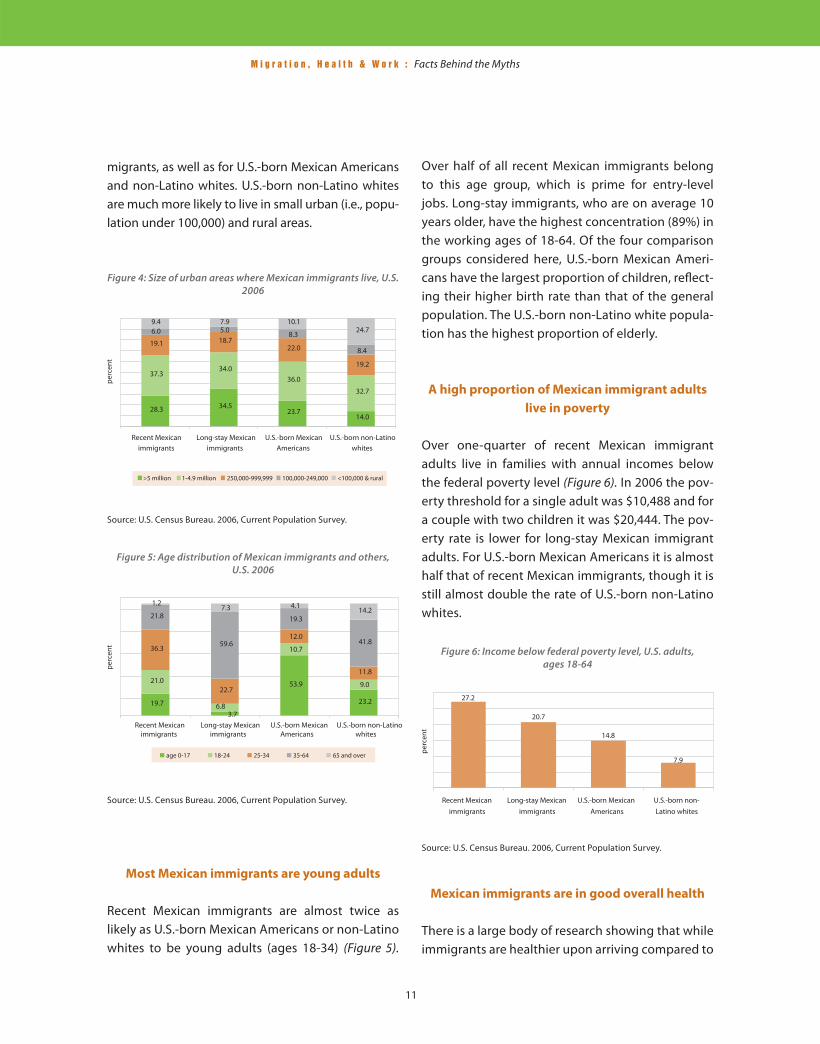
migrants, as well as for U.S.-born Mexican Americans and non-Latino whites. U.S.-born non-Latino whites are much more likely to live in small urban (i.e., popu-lation under 100,000) and rural areas.
Figure 4: Size of urban areas where Mexican immigrants live, U.S. 2006
Source: U.S. Census Bureau. 2006, Current Population Survey.
Figure 5: Age distribution of Mexican immigrants and others, U.S. 2006
Source: U.S. Census Bureau. 2006, Current Population Survey.
Over half of all recent Mexican immigrants belong to this age group, which is prime for entry-level jobs. Long-stay immigrants, who are on average 10 years older, have the highest concentration (89%) in the working ages of 18-64. Of the four comparison groups considered here, U.S.-born Mexican Ameri-cans have the largest proportion of children, refl ect-ing their higher birth rate than that of the general population. The U.S.-born non-Latino white popula-tion has the highest proportion of elderly.
A high proportion of Mexican immigrant adults
live in poverty
Over one-quarter of recent Mexican immigrant adults live in families with annual incomes below the federal poverty level (Figure 6). In 2006 the pov-erty threshold for a single adult was $10,488 and for a couple with two children it was $20,444. The pov-erty rate is lower for long-stay Mexican immigrant adults. For U.S.-born Mexican Americans it is almost half that of recent Mexican immigrants, though it is still almost double the rate of U.S.-born non-Latino whites.
Figure 6: Income below federal poverty level, U.S. adults, ages 18-64
Source: U.S. Census Bureau. 2006, Current Population Survey.
Most Mexican immigrants are young adults
Recent Mexican immigrants are almost twice as likely as U.S.-born Mexican Americans or non-Latino whites to be young adults (ages 18-34) (Figure 5).
Mexican immigrants are in good overall health
There is a large body of research showing that while immigrants are healthier upon arriving compared to
M i g r a t i o n , H e a l t h & W o r k : Facts Behind the Myths
12
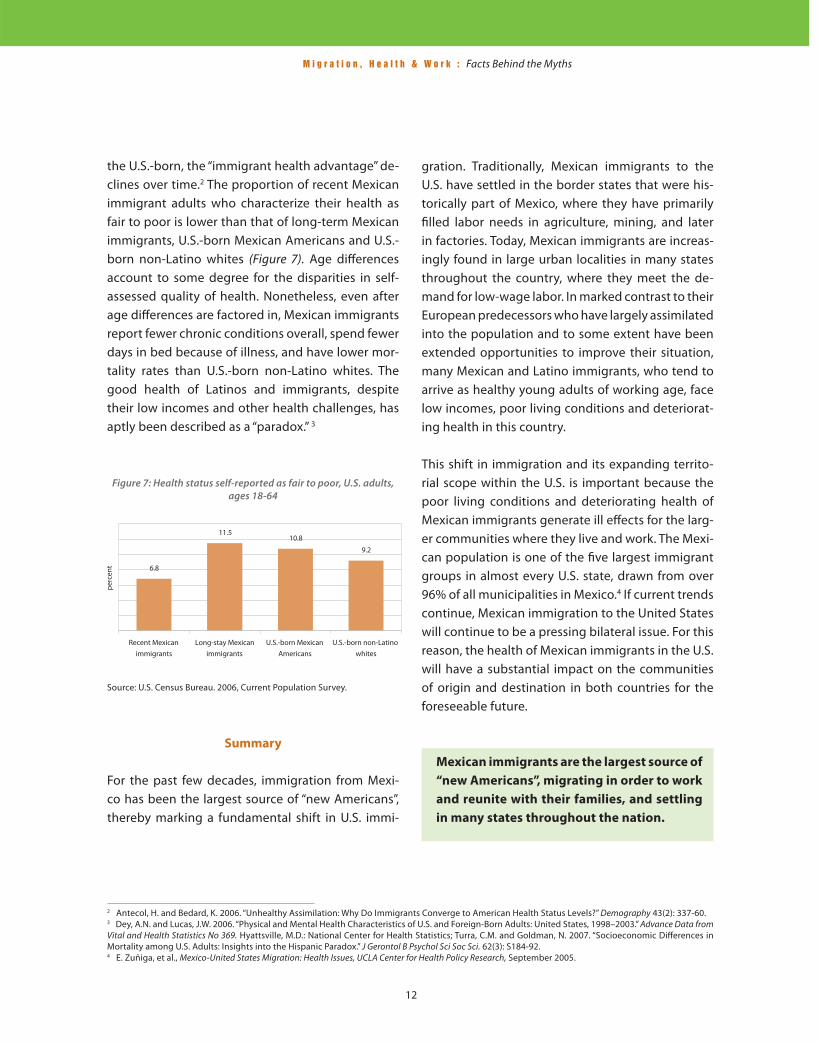
the U.S.-born, the “immigrant health advantage” de-clines over time.2 The proportion of recent Mexican immigrant adults who characterize their health as fair to poor is lower than that of long-term Mexican immigrants, U.S.-born Mexican Americans and U.S.-born non-Latino whites (Figure 7). Age diff erences account to some degree for the disparities in self-assessed quality of health. Nonetheless, even after age diff erences are factored in, Mexican immigrants report fewer chronic conditions overall, spend fewer days in bed because of illness, and have lower mor-tality rates than U.S.-born non-Latino whites. The good health of Latinos and immigrants, despite their low incomes and other health challenges, has aptly been described as a “paradox.” 3
2 Antecol, H. and Bedard, K. 2006. “Unhealthy Assimilation: Why Do Immigrants Converge to American Health Status Levels?” Demography 43(2): 337-60.3 Dey, A.N. and Lucas, J.W. 2006. “Physical and Mental Health Characteristics of U.S. and Foreign-Born Adults: United States, 1998–2003.” Advance Data from Vital and Health Statistics No 369. Hyattsville, M.D.: National Center for Health Statistics; Turra, C.M. and Goldman, N. 2007. “Socioeconomic Diff erences in Mortality among U.S. Adults: Insights into the Hispanic Paradox.” J Gerontol B Psychol Sci Soc Sci. 62(3): S184-92.4 E. Zuñiga, et al., Mexico-United States Migration: Health Issues, UCLA Center for Health Policy Research, September 2005.
gration. Traditionally, Mexican immigrants to the U.S. have settled in the border states that were his-torically part of Mexico, where they have primarily fi lled labor needs in agriculture, mining, and later in factories. Today, Mexican immigrants are increas-ingly found in large urban localities in many states throughout the country, where they meet the de-mand for low-wage labor. In marked contrast to their European predecessors who have largely assimilated into the population and to some extent have been extended opportunities to improve their situation, many Mexican and Latino immigrants, who tend to arrive as healthy young adults of working age, face low incomes, poor living conditions and deteriorat-ing health in this country.
This shift in immigration and its expanding territo-rial scope within the U.S. is important because the poor living conditions and deteriorating health of Mexican immigrants generate ill eff ects for the larg-er communities where they live and work. The Mexi-can population is one of the fi ve largest immigrant groups in almost every U.S. state, drawn from over 96% of all municipalities in Mexico.4 If current trends continue, Mexican immigration to the United States will continue to be a pressing bilateral issue. For this reason, the health of Mexican immigrants in the U.S. will have a substantial impact on the communities of origin and destination in both countries for the foreseeable future.
Figure 7: Health status self-reported as fair to poor, U.S. adults, ages 18-64
Source: U.S. Census Bureau. 2006, Current Population Survey.
Summary
For the past few decades, immigration from Mexi-co has been the largest source of “new Americans”, thereby marking a fundamental shift in U.S. immi-
Mexican immigrants are the largest source of
“new Americans”, migrating in order to work
and reunite with their families, and settling
in many states throughout the nation.
13
CHAPTER 2MEXICAN IMMIGRANTS IN THE U.S. LABOR FORCE
Recent Mexican immigrant men have a
94% U.S. labor force participation rate
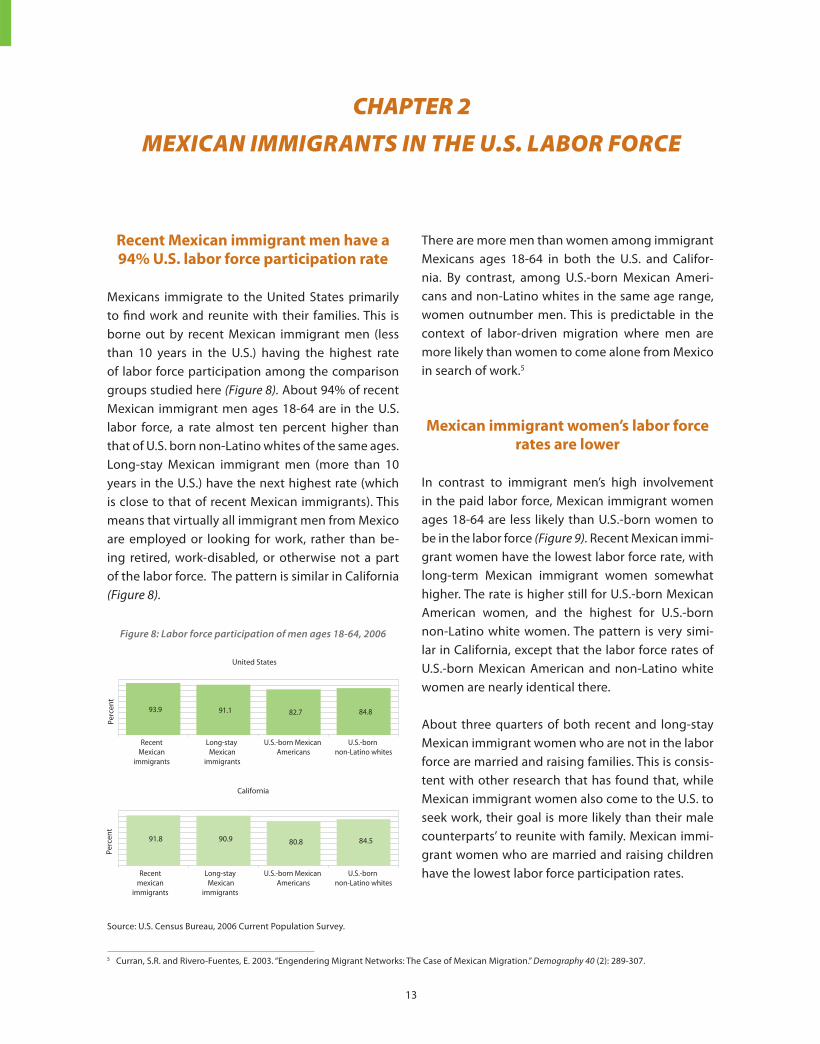
Mexicans immigrate to the United States primarily to fi nd work and reunite with their families. This is borne out by recent Mexican immigrant men (less than 10 years in the U.S.) having the highest rate of labor force participation among the comparison groups studied here (Figure 8). About 94% of recent Mexican immigrant men ages 18-64 are in the U.S. labor force, a rate almost ten percent higher than that of U.S. born non-Latino whites of the same ages. Long-stay Mexican immigrant men (more than 10 years in the U.S.) have the next highest rate (which is close to that of recent Mexican immigrants). This means that virtually all immigrant men from Mexico are employed or looking for work, rather than be-ing retired, work-disabled, or otherwise not a part of the labor force. The pattern is similar in California (Figure 8).
There are more men than women among immigrant Mexicans ages 18-64 in both the U.S. and Califor-nia. By contrast, among U.S.-born Mexican Ameri-cans and non-Latino whites in the same age range, women outnumber men. This is predictable in the context of labor-driven migration where men are more likely than women to come alone from Mexico in search of work.5
Mexican immigrant women’s labor force
rates are lower
In contrast to immigrant men’s high involvement in the paid labor force, Mexican immigrant women ages 18-64 are less likely than U.S.-born women to be in the labor force (Figure 9). Recent Mexican immi-grant women have the lowest labor force rate, with long-term Mexican immigrant women somewhat higher. The rate is higher still for U.S.-born Mexican American women, and the highest for U.S.-born non-Latino white women. The pattern is very simi-lar in California, except that the labor force rates of U.S.-born Mexican American and non-Latino white women are nearly identical there.
About three quarters of both recent and long-stay Mexican immigrant women who are not in the labor force are married and raising families. This is consis-tent with other research that has found that, while Mexican immigrant women also come to the U.S. to seek work, their goal is more likely than their male counterparts’ to reunite with family. Mexican immi-grant women who are married and raising children have the lowest labor force participation rates.
5 Curran, S.R. and Rivero-Fuentes, E. 2003. “Engendering Migrant Networks: The Case of Mexican Migration.” Demography 40 (2): 289-307.
Figure 8: Labor force participation of men ages 18-64, 2006
Source: U.S. Census Bureau, 2006 Current Population Survey.
M i g r a t i o n , H e a l t h & W o r k : Facts Behind the Myths
14
Mexican immigrant men are
concentrated in construction and service
occupations nationally
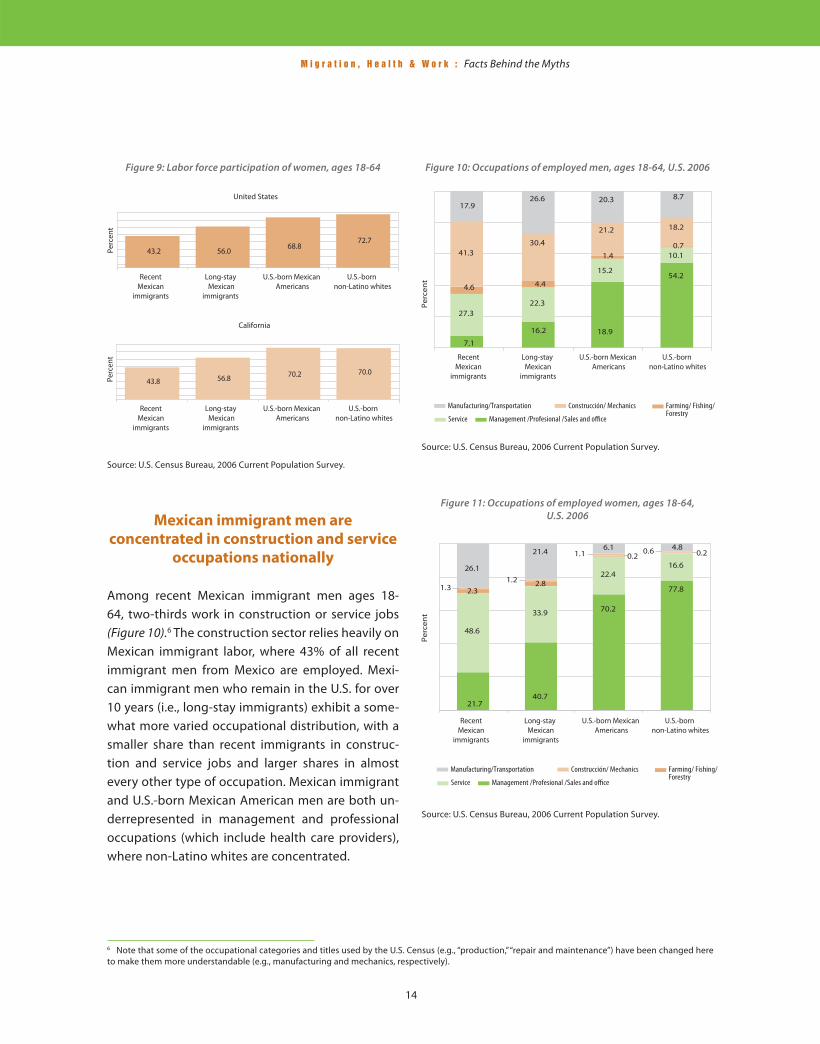
Among recent Mexican immigrant men ages 18-64, two-thirds work in construction or service jobs (Figure 10).6 The construction sector relies heavily on Mexican immigrant labor, where 43% of all recent immigrant men from Mexico are employed. Mexi-can immigrant men who remain in the U.S. for over 10 years (i.e., long-stay immigrants) exhibit a some-what more varied occupational distribution, with a smaller share than recent immigrants in construc-tion and service jobs and larger shares in almost every other type of occupation. Mexican immigrant and U.S.-born Mexican American men are both un-derrepresented in management and professional occupations (which include health care providers), where non-Latino whites are concentrated.
6 Note that some of the occupational categories and titles used by the U.S. Census (e.g., “production,” “repair and maintenance”) have been changed here to make them more understandable (e.g., manufacturing and mechanics, respectively).
Figure 9: Labor force participation of women, ages 18-64
Source: U.S. Census Bureau, 2006 Current Population Survey.
Figure 10: Occupations of employed men, ages 18-64, U.S. 2006
Source: U.S. Census Bureau, 2006 Current Population Survey.
Source: U.S. Census Bureau, 2006 Current Population Survey.
Figure 11: Occupations of employed women, ages 18-64, U.S. 2006
M i g r a t i o n , H e a l t h & W o r k : Facts Behind the Myths
15
Mexican immigrant women are most
commonly found in service occupations
The concentration of Mexican immigrant women ages 18-64 in certain occupations is even higher than that of men. Almost half of those in the labor force work in service occupations (Figure 11). For recent Mexican immigrant women, the next most common occupation is manufacturing (such as sew-ing machine operators), while for long-stay Mexican immigrant women it is sales and offi ce work. Mexi-can immigrant women are much less likely to work in management and professional occupations than U.S.-born non-Latino white women.
7 Note that some of the occupational titles used by the U.S. Census (e.g., “grounds maintenance,” “dining room attendants”) have been changed here to make them more understandable (e.g., gardeners and bus boys, respectively).
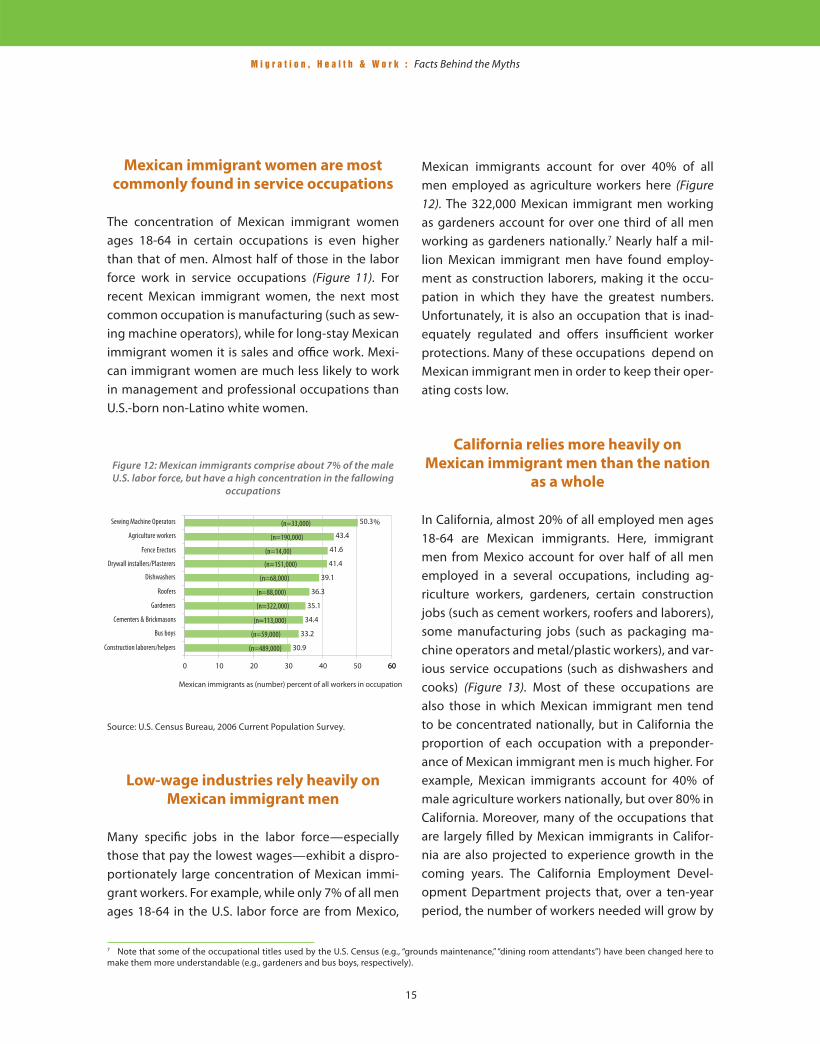
Mexican immigrants account for over 40% of all men employed as agriculture workers here (Figure 12). The 322,000 Mexican immigrant men working as gardeners account for over one third of all men working as gardeners nationally.7 Nearly half a mil-lion Mexican immigrant men have found employ-ment as construction laborers, making it the occu-pation in which they have the greatest numbers. Unfortunately, it is also an occupation that is inad-equately regulated and off ers insuffi cient worker protections. Many of these occupations depend on Mexican immigrant men in order to keep their oper-ating costs low.
Low-wage industries rely heavily on
Mexican immigrant men
Many specifi c jobs in the labor force—especially those that pay the lowest wages—exhibit a dispro-portionately large concentration of Mexican immi-grant workers. For example, while only 7% of all men ages 18-64 in the U.S. labor force are from Mexico,
California relies more heavily on
Mexican immigrant men than the nation
as a whole
In California, almost 20% of all employed men ages 18-64 are Mexican immigrants. Here, immigrant men from Mexico account for over half of all men employed in a several occupations, including ag-riculture workers, gardeners, certain construction jobs (such as cement workers, roofers and laborers), some manufacturing jobs (such as packaging ma-chine operators and metal/plastic workers), and var-ious service occupations (such as dishwashers and cooks) (Figure 13). Most of these occupations are also those in which Mexican immigrant men tend to be concentrated nationally, but in California the proportion of each occupation with a preponder-ance of Mexican immigrant men is much higher. For example, Mexican immigrants account for 40% of male agriculture workers nationally, but over 80% in California. Moreover, many of the occupations that are largely fi lled by Mexican immigrants in Califor-nia are also projected to experience growth in the coming years. The California Employment Devel-opment Department projects that, over a ten-year period, the number of workers needed will grow by
Figure 12: Mexican immigrants comprise about 7% of the male U.S. labor force, but have a high concentration in the fallowing
occupations
Source: U.S. Census Bureau, 2006 Current Population Survey.

M i g r a t i o n , H e a l t h & W o r k : Facts Behind the Myths
16
about 88,000 cooks, 70,000 gardeners, and 34,000 bus boys.8 In other words, California’s low-wage ser-vice economy depends overwhelmingly on Mexican workers, and economic growth in California will in-creasingly require low-wage labor in the future.
8 California Employment Development Department. “Occupations with the most job openings, 2004-2014.” Available at http://www.labormarketinfo.edd.ca.gov/cgi/databrowsing/?PageID=145. 9 Note that some of the occupational titles and categories used by the U.S. Census (e.g., “maids and housekeeping cleaners”, “butchers and other meat processing workers,” “pressers, textile, garment, and related materials and sewing machine operators”) have been changed here to make them more un-derstandable (e.g., housekeepers, meat processing, and garment workers, respectively)Available at http://repositories.cdlib.org/ile/scl2001/Section5.
Many occupations rely heavily on
Mexican immigrant women
Mexican immigrant women account for over one-quarter of all women working nationally as agri-cultural workers, meat packers, packaging machine workers, and dishwashers. Other “gender driven” occupations are also fi lled by Mexican immigrant women. For example, more Mexican immigrant women work nationally as housekeepers (310,000) than in any other occupation.9 Child-care is also a common service occupation, employing 64,000 Mexican immigrant women (Figure 14). Thus, while only three percent of all women ages 18-64 in the labor force in the U.S. are Mexican immigrants, they are concentrated disproportionately in service and agricultural occupations.
The distribution in California is similar, with Mexi-can immigrant women ages 18-64 concentrated in several occupations. At 12% of the female California labor force, Mexican immigrant women account for over half of all general agricultural workers, packers, sewing machine operators, assemblers and house-keepers (Figure 15). Housekeeping is the most com-mon occupation held by Mexican immigrant women in California, as it is nationally
Figure 13: Mexican immigrants comprise about 20% of the male California labor force, but have a high concentration in the
following occupations
Source: U.S. Census Bureau, 2006 Current Population Survey.
Figure 14: Mexican immigrants are about 3% of the female U.S. labor force, but have a high concentration in the
following occupations
Source: U.S. Census Bureau, 2006 Current Population Survey.
Figure 15: Mexican immigrants comprise about 12% of the female California labor force, but have a high concentration in
the following occupations
Source: U.S. Census Bureau, 2006 Current Population Survey.
M i g r a t i o n , H e a l t h & W o r k : Facts Behind the Myths
17
10 This follows the methodology used in Valenzuela, A. and Ong, P. 2001. “Immigrant Labor in California.” Chapter 3 in The State of California Labor, 2001. Los Angeles: University of California Institute for Labor and Employment. Available at http:// repositories.cdlib.org/ile/scl2001/Section5.
Jobs fi lled by Mexican immigrant
workers frequently pay the lowest wages
Mexican immigrants are likely to arrive in the United States in good health overall, but maintaining the “health capital” that they bring requires suffi cient income and access to health care. Unfortunately, the occupations where most Mexican immigrants are likely to be hired in the U.S. do not often provide adequate wages or health insurance.
There are many occupations, as noted above, in which Mexican immigrants cluster in disproportion-ate numbers. Occupations that rely heavily on the labor of Mexican immigrants are those where the proportion of Mexican immigrants in the occupa-tion is more than twice as common as their overall presence in the labor force.10 These jobs typically pay lower wages, as shown by the lower average annual earnings of Mexican immigrant men and women working in these jobs as compared to “other” occu-pations that are not heavily dependent on the labor of Mexican immigrants. We assessed occupations separately for men and women.
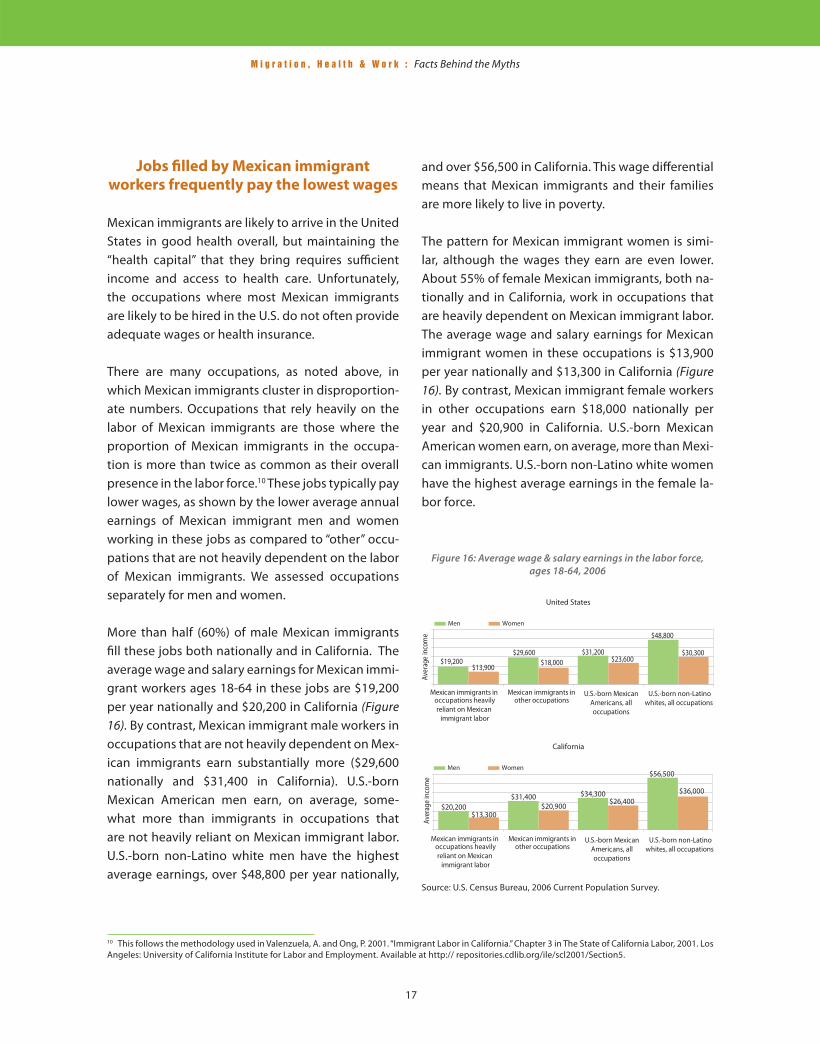
More than half (60%) of male Mexican immigrants fi ll these jobs both nationally and in California. The average wage and salary earnings for Mexican immi-grant workers ages 18-64 in these jobs are $19,200 per year nationally and $20,200 in California (Figure 16). By contrast, Mexican immigrant male workers in occupations that are not heavily dependent on Mex-ican immigrants earn substantially more ($29,600 nationally and $31,400 in California). U.S.-born Mexican American men earn, on average, some-what more than immigrants in occupations that are not heavily reliant on Mexican immigrant labor. U.S.-born non-Latino white men have the highest average earnings, over $48,800 per year nationally,
and over $56,500 in California. This wage diff erential means that Mexican immigrants and their families are more likely to live in poverty.
The pattern for Mexican immigrant women is simi-lar, although the wages they earn are even lower. About 55% of female Mexican immigrants, both na-tionally and in California, work in occupations that are heavily dependent on Mexican immigrant labor. The average wage and salary earnings for Mexican immigrant women in these occupations is $13,900 per year nationally and $13,300 in California (Figure 16). By contrast, Mexican immigrant female workers in other occupations earn $18,000 nationally per year and $20,900 in California. U.S.-born Mexican American women earn, on average, more than Mexi-can immigrants. U.S.-born non-Latino white women have the highest average earnings in the female la-bor force.
Figure 16: Average wage & salary earnings in the labor force, ages 18-64, 2006
Source: U.S. Census Bureau, 2006 Current Population Survey.
M i g r a t i o n , H e a l t h & W o r k : Facts Behind the Myths
18
11 Orszag, P.R. 2007. “The Role of Immigrants in the U.S. Labor Market.” Testimony, U.S. House of Representatives, May 3. Washington, D.C.: Congressional Budget Offi ce. Available at: http://judiciary.house.gov/media/pdfs/Orszag070503.pdf. 12 Pearce, D. and Brooks, J. 2003. The Self Suffi ciency Standard for California 2003. Oakland, CA: National Economic Development and Law Center. Available at http://www.sixstrategies.org/fi les/2003 CA Full Report with Map.pdf.
On average, Mexican immigrant men who work full time earn 45% less than native-born men, while Mexican immigrant women earn about 40% less than native-born women. About half of this earn-ings gap is due to diff erences in educational at-tainment and work experience between the two populations.11 The remainder of this earnings gap is largely attributable to the diff erent occupational profi les of Mexican immigrants and the native-born population.
Such low incomes make it diffi cult to aff ord the basic necessities to keep families healthy, includ-ing adequate housing, nutritious food, and needed medical care. A minimal standard of living for a fam-ily of four in California, for example, requires about $50,000 per year.12 This is beyond the reach of an av-erage Mexican immigrant family with both parents working in occupations that rely heavily on Mexican immigrants. U.S.-born non-Latino white males are the only group where a single wage earner reaches this amount for a family of four.
Jobs fi lled by Mexican immigrants are
the least likely to off er health insurance,
leaving most of their workers uninsured
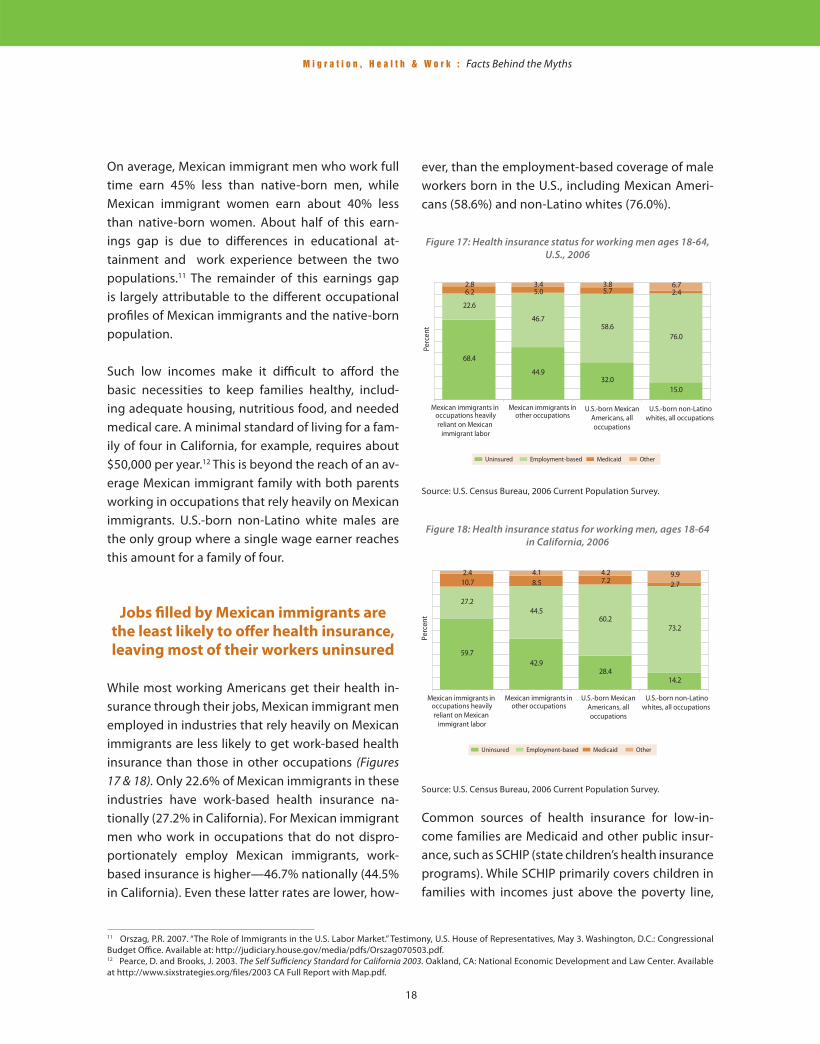
While most working Americans get their health in-surance through their jobs, Mexican immigrant men employed in industries that rely heavily on Mexican immigrants are less likely to get work-based health insurance than those in other occupations (Figures 17 & 18). Only 22.6% of Mexican immigrants in these industries have work-based health insurance na-tionally (27.2% in California). For Mexican immigrant men who work in occupations that do not dispro-portionately employ Mexican immigrants, work-based insurance is higher—46.7% nationally (44.5% in California). Even these latter rates are lower, how-
ever, than the employment-based coverage of male workers born in the U.S., including Mexican Ameri-cans (58.6%) and non-Latino whites (76.0%).
Figure 17: Health insurance status for working men ages 18-64, U.S., 2006
Source: U.S. Census Bureau, 2006 Current Population Survey.
Figure 18: Health insurance status for working men, ages 18-64 in California, 2006
Source: U.S. Census Bureau, 2006 Current Population Survey. Common sources of health insurance for low-in-come families are Medicaid and other public insur-ance, such as SCHIP (state children’s health insurance programs). While SCHIP primarily covers children in families with incomes just above the poverty line,
M i g r a t i o n , H e a l t h & W o r k : Facts Behind the Myths
19
Medicaid covers both children and their parents in families with very low incomes. The coverage rates for Medicaid and other public insurance are similar across immigrant and native-born Mexican groups—at 5.0% to 6.2%, respectively—despite the fact that Mexican immigrants have very low in-comes and the highest poverty rates, and as such are the most in need of these services (Figures 17 & 18).
Other sources of health insurance, including pri-vately purchased insurance (from out of pocket funds) and Medicare (the federal health insurance for the elderly and permanently disabled), represent the most common types of coverage obtained by U.S.-born non-Latino white men. Because of their low incomes, few male Mexican immigrant workers can aff ord to purchase private health insurance, and because of their relatively young age and the good health they come with, they are not often eligible for Medicare.
Type of employment and uninsurance
rates among Mexican immigrants
The low level of employer-provided insurance and the low rate of public insurance result in Mexican immigrant workers having exceptionally high rates of uninsurance (Figures 17 & 18). Indeed, over two-thirds of Mexican immigrants working in those oc-cupations that are heavily dependent on Mexican immigrant labor have no medical coverage. In those occupations that do not rely heavily on Mexican im-migrants, uninsurance is less prevalent, but Mexican immigrants in these jobs are still uninsured at a level three times that of U.S.-born non-Latino whites. In addition, the uninsurance rate for U.S.-born Mexican American men rate is double that of U.S.-born non-Latino white men.
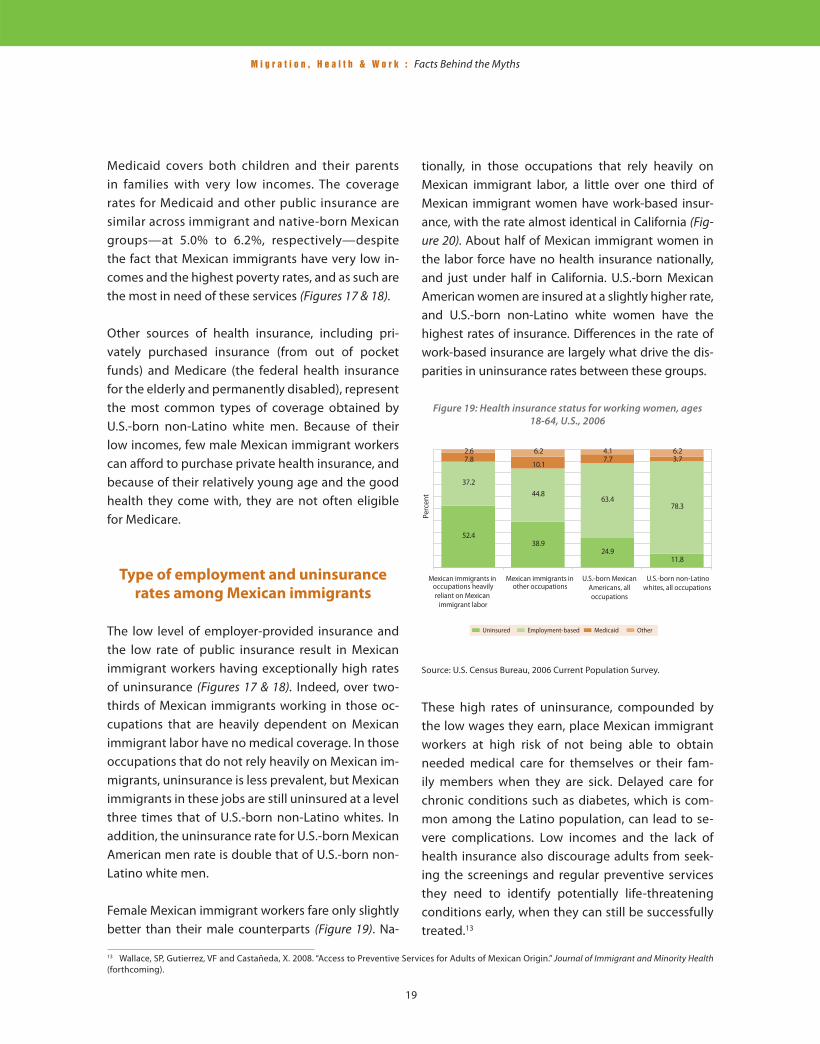
Female Mexican immigrant workers fare only slightly better than their male counterparts (Figure 19). Na-
13 Wallace, SP, Gutierrez, VF and Castañeda, X. 2008. “Access to Preventive Services for Adults of Mexican Origin.” Journal of Immigrant and Minority Health (forthcoming).
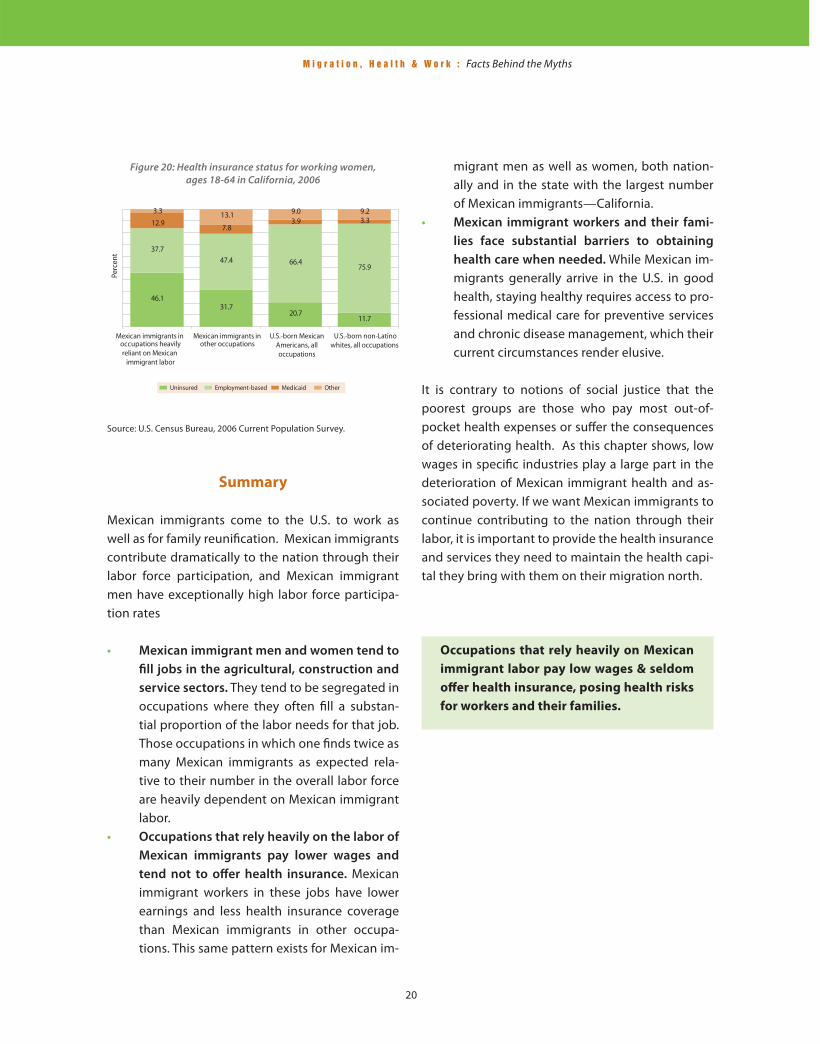
tionally, in those occupations that rely heavily on Mexican immigrant labor, a little over one third of Mexican immigrant women have work-based insur-ance, with the rate almost identical in California (Fig-ure 20). About half of Mexican immigrant women in the labor force have no health insurance nationally, and just under half in California. U.S.-born Mexican American women are insured at a slightly higher rate, and U.S.-born non-Latino white women have the highest rates of insurance. Diff erences in the rate of work-based insurance are largely what drive the dis-parities in uninsurance rates between these groups.
Figure 19: Health insurance status for working women, ages 18-64, U.S., 2006
Source: U.S. Census Bureau, 2006 Current Population Survey.
These high rates of uninsurance, compounded by the low wages they earn, place Mexican immigrant workers at high risk of not being able to obtain needed medical care for themselves or their fam-ily members when they are sick. Delayed care for chronic conditions such as diabetes, which is com-mon among the Latino population, can lead to se-vere complications. Low incomes and the lack of health insurance also discourage adults from seek-ing the screenings and regular preventive services they need to identify potentially life-threatening conditions early, when they can still be successfully treated.13
M i g r a t i o n , H e a l t h & W o r k : Facts Behind the Myths
20
Summary
Mexican immigrants come to the U.S. to work as well as for family reunifi cation. Mexican immigrants contribute dramatically to the nation through their labor force participation, and Mexican immigrant men have exceptionally high labor force participa-tion rates
• Mexican immigrant men and women tend to
fi ll jobs in the agricultural, construction and
service sectors. They tend to be segregated in occupations where they often fi ll a substan-tial proportion of the labor needs for that job. Those occupations in which one fi nds twice as many Mexican immigrants as expected rela-tive to their number in the overall labor force are heavily dependent on Mexican immigrant labor.
• Occupations that rely heavily on the labor of
Mexican immigrants pay lower wages and
tend not to off er health insurance. Mexican immigrant workers in these jobs have lower earnings and less health insurance coverage than Mexican immigrants in other occupa-tions. This same pattern exists for Mexican im-
migrant men as well as women, both nation-ally and in the state with the largest number of Mexican immigrants—California.
• Mexican immigrant workers and their fami-
lies face substantial barriers to obtaining
health care when needed. While Mexican im-migrants generally arrive in the U.S. in good health, staying healthy requires access to pro-fessional medical care for preventive services and chronic disease management, which their current circumstances render elusive.
It is contrary to notions of social justice that the poorest groups are those who pay most out-of-pocket health expenses or suff er the consequences of deteriorating health. As this chapter shows, low wages in specifi c industries play a large part in the deterioration of Mexican immigrant health and as-sociated poverty. If we want Mexican immigrants to continue contributing to the nation through their labor, it is important to provide the health insurance and services they need to maintain the health capi-tal they bring with them on their migration north.
Occupations that rely heavily on Mexican
immigrant labor pay low wages & seldom
off er health insurance, posing health risks
for workers and their families.
Figure 20: Health insurance status for working women, ages 18-64 in California, 2006
Source: U.S. Census Bureau, 2006 Current Population Survey.
21
CHAPTER 3OCCUPATIONAL HEALTH RISKS TO MEXICAN
IMMIGRANTS IN THE U.S. LABOR FORCE
Mexican immigrants are at particularly
high risk for being killed or fatally
injured at work
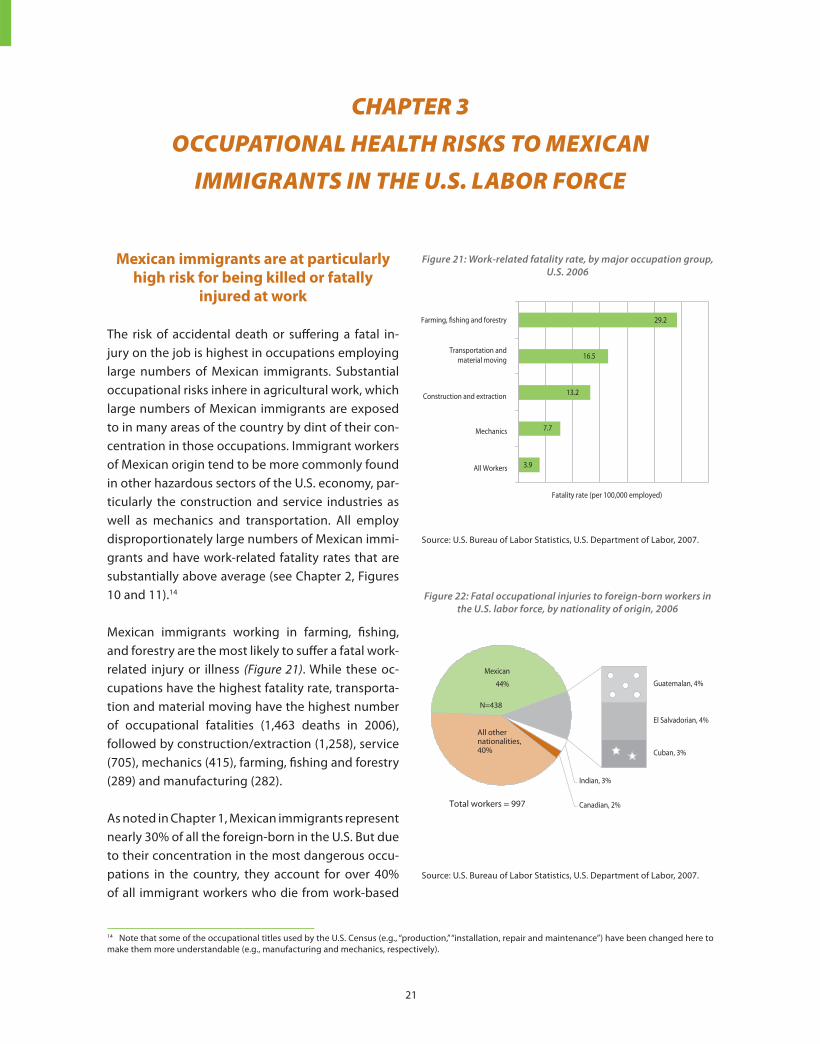
The risk of accidental death or suff ering a fatal in-jury on the job is highest in occupations employing large numbers of Mexican immigrants. Substantial occupational risks inhere in agricultural work, which large numbers of Mexican immigrants are exposed to in many areas of the country by dint of their con-centration in those occupations. Immigrant workers of Mexican origin tend to be more commonly found in other hazardous sectors of the U.S. economy, par-ticularly the construction and service industries as well as mechanics and transportation. All employ disproportionately large numbers of Mexican immi-grants and have work-related fatality rates that are substantially above average (see Chapter 2, Figures 10 and 11).14
Mexican immigrants working in farming, fi shing, and forestry are the most likely to suff er a fatal work-related injury or illness (Figure 21). While these oc-cupations have the highest fatality rate, transporta-tion and material moving have the highest number of occupational fatalities (1,463 deaths in 2006), followed by construction/extraction (1,258), service (705), mechanics (415), farming, fi shing and forestry (289) and manufacturing (282).
As noted in Chapter 1, Mexican immigrants represent nearly 30% of all the foreign-born in the U.S. But due to their concentration in the most dangerous occu-pations in the country, they account for over 40% of all immigrant workers who die from work-based
14 Note that some of the occupational titles used by the U.S. Census (e.g., “production,” “installation, repair and maintenance”) have been changed here to make them more understandable (e.g., manufacturing and mechanics, respectively).
Figure 21: Work-related fatality rate, by major occupation group, U.S. 2006
Source: U.S. Bureau of Labor Statistics, U.S. Department of Labor, 2007.
Figure 22: Fatal occupational injuries to foreign-born workers in the U.S. labor force, by nationality of origin, 2006
Source: U.S. Bureau of Labor Statistics, U.S. Department of Labor, 2007.
M i g r a t i o n , H e a l t h & W o r k : Facts Behind the Myths
22
injuries (Figure 22). Immigrants from other countries of origin fare markedly better in the work force here; only one-tenth as many immigrant workers from Guatemala and El Salvador, for example, annually suff er fatal occupational injuries in the U.S.
The risk of non-fatal work-related
injuries and illnesses is also higher in
occupations that rely heavily on Mexican
immigrant labor
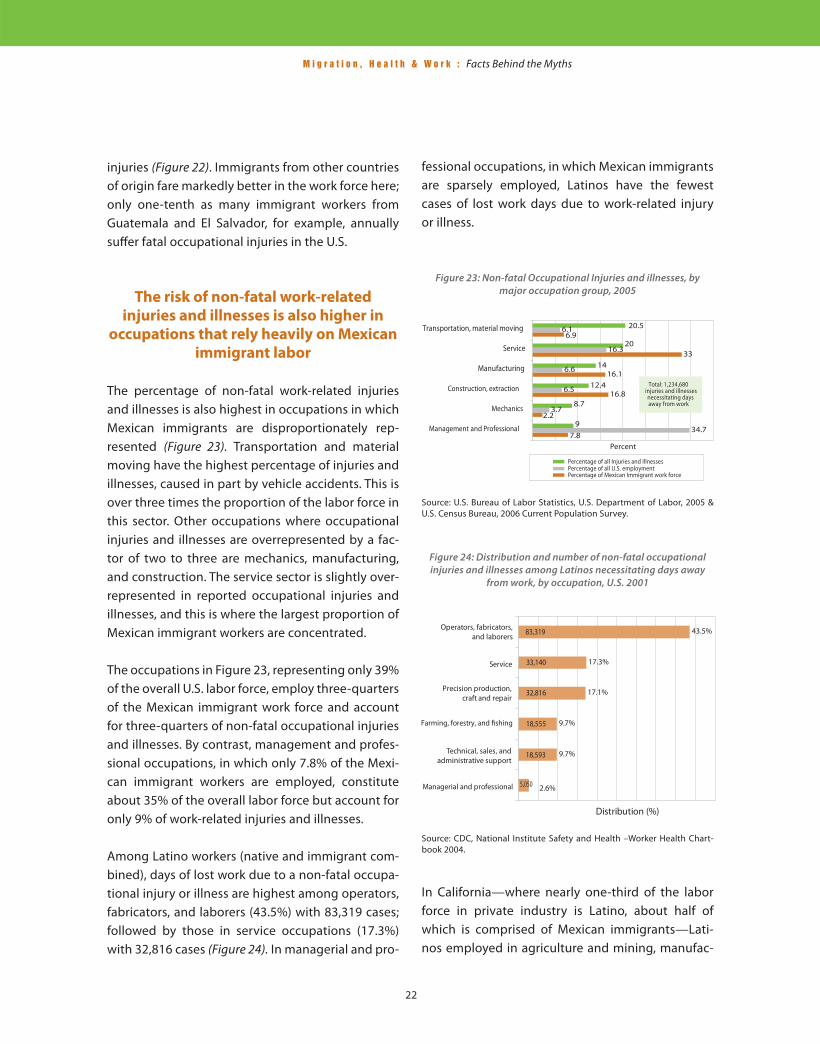
The percentage of non-fatal work-related injuries and illnesses is also highest in occupations in which Mexican immigrants are disproportionately rep-resented (Figure 23). Transportation and material moving have the highest percentage of injuries and illnesses, caused in part by vehicle accidents. This is over three times the proportion of the labor force in this sector. Other occupations where occupational injuries and illnesses are overrepresented by a fac-tor of two to three are mechanics, manufacturing, and construction. The service sector is slightly over-represented in reported occupational injuries and illnesses, and this is where the largest proportion of Mexican immigrant workers are concentrated.
The occupations in Figure 23, representing only 39% of the overall U.S. labor force, employ three-quarters of the Mexican immigrant work force and account for three-quarters of non-fatal occupational injuries and illnesses. By contrast, management and profes-sional occupations, in which only 7.8% of the Mexi-can immigrant workers are employed, constitute about 35% of the overall labor force but account for only 9% of work-related injuries and illnesses.
Among Latino workers (native and immigrant com-bined), days of lost work due to a non-fatal occupa-tional injury or illness are highest among operators, fabricators, and laborers (43.5%) with 83,319 cases; followed by those in service occupations (17.3%) with 32,816 cases (Figure 24). In managerial and pro-
fessional occupations, in which Mexican immigrants are sparsely employed, Latinos have the fewest cases of lost work days due to work-related injury or illness.
Figure 23: Non-fatal Occupational Injuries and illnesses, by major occupation group, 2005
Source: U.S. Bureau of Labor Statistics, U.S. Department of Labor, 2005 & U.S. Census Bureau, 2006 Current Population Survey.
Figure 24: Distribution and number of non-fatal occupational injuries and illnesses among Latinos necessitating days away
from work, by occupation, U.S. 2001
Source: CDC, National Institute Safety and Health –Worker Health Chart-book 2004.
In California—where nearly one-third of the labor force in private industry is Latino, about half of which is comprised of Mexican immigrants—Lati-nos employed in agriculture and mining, manufac-
M i g r a t i o n , H e a l t h & W o r k : Facts Behind the Myths
23
15 Note that some of the occupational titles used by the U.S. Census (e.g., “natural resources”) have been changed here to make them more understandable (e.g., agriculture and mining).16 See also Richardson, S. et al, 2003, “Hispanic Workers in the United States: An Analysis of Employment Distributions, Fatal Occupational Injuries, and Non-fatal Occupational Injuries and Illnesses”, available at http://books.nap.edu/openbook.php?record_id=10641&page=70
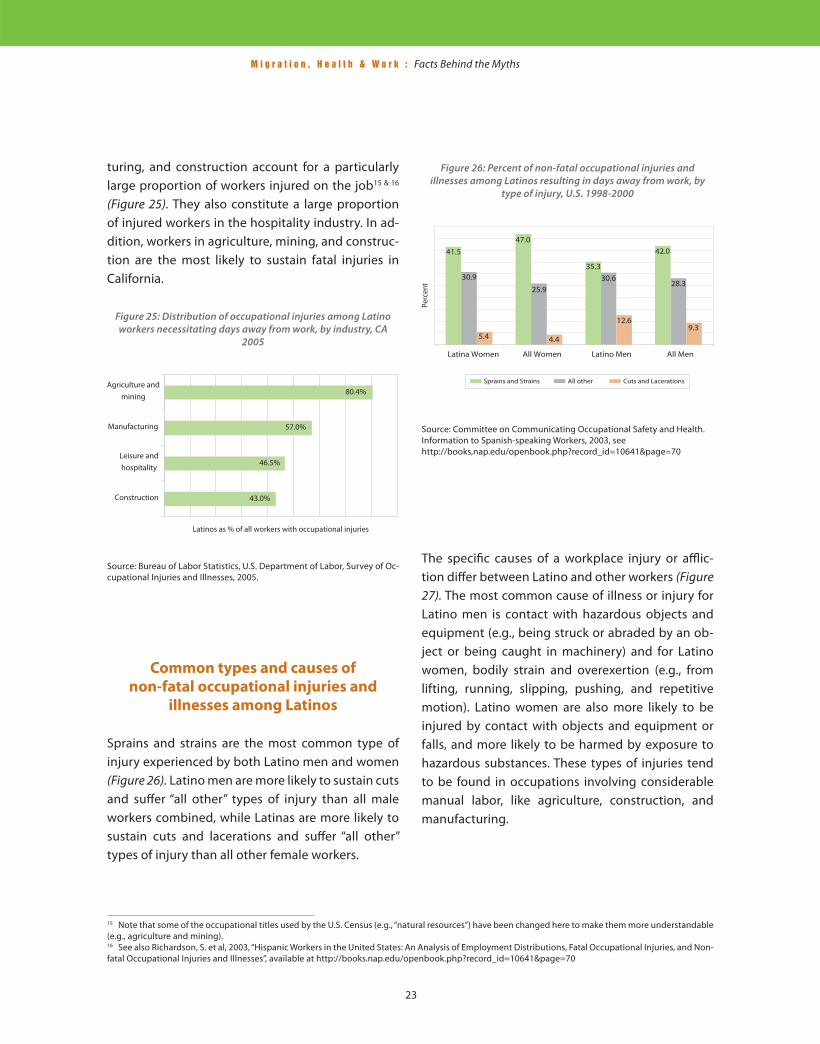
turing, and construction account for a particularly large proportion of workers injured on the job15 & 16
(Figure 25). They also constitute a large proportion of injured workers in the hospitality industry. In ad-dition, workers in agriculture, mining, and construc-tion are the most likely to sustain fatal injuries in California.
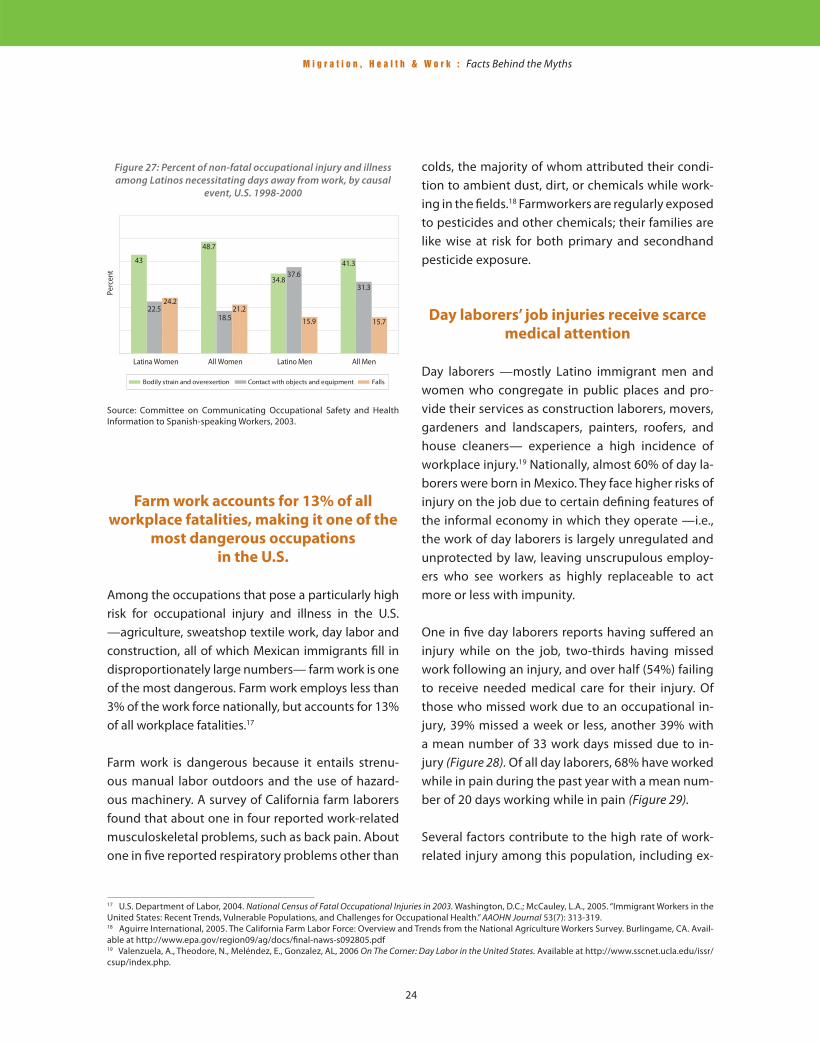
The specifi c causes of a workplace injury or affl ic-tion diff er between Latino and other workers (Figure 27). The most common cause of illness or injury for Latino men is contact with hazardous objects and equipment (e.g., being struck or abraded by an ob-ject or being caught in machinery) and for Latino women, bodily strain and overexertion (e.g., from lifting, running, slipping, pushing, and repetitive motion). Latino women are also more likely to be injured by contact with objects and equipment or falls, and more likely to be harmed by exposure to hazardous substances. These types of injuries tend to be found in occupations involving considerable manual labor, like agriculture, construction, and manufacturing.
Figure 25: Distribution of occupational injuries among Latino workers necessitating days away from work, by industry, CA
2005
Source: Bureau of Labor Statistics, U.S. Department of Labor, Survey of Oc-cupational Injuries and Illnesses, 2005.
Common types and causes of
non-fatal occupational injuries and
illnesses among Latinos
Sprains and strains are the most common type of injury experienced by both Latino men and women (Figure 26). Latino men are more likely to sustain cuts and suff er “all other” types of injury than all male workers combined, while Latinas are more likely to sustain cuts and lacerations and suff er “all other” types of injury than all other female workers.
Figure 26: Percent of non-fatal occupational injuries and illnesses among Latinos resulting in days away from work, by
type of injury, U.S. 1998-2000
Source: Committee on Communicating Occupational Safety and Health. Information to Spanish-speaking Workers, 2003, seehttp://books,nap.edu/openbook.php?record_id=10641&page=70
M i g r a t i o n , H e a l t h & W o r k : Facts Behind the Myths
24
Farm work accounts for 13% of all
workplace fatalities, making it one of the
most dangerous occupations
in the U.S.
Among the occupations that pose a particularly high risk for occupational injury and illness in the U.S. —agriculture, sweatshop textile work, day labor and construction, all of which Mexican immigrants fi ll in disproportionately large numbers— farm work is one of the most dangerous. Farm work employs less than 3% of the work force nationally, but accounts for 13% of all workplace fatalities.17
Farm work is dangerous because it entails strenu-ous manual labor outdoors and the use of hazard-ous machinery. A survey of California farm laborers found that about one in four reported work-related musculoskeletal problems, such as back pain. About one in fi ve reported respiratory problems other than
colds, the majority of whom attributed their condi-tion to ambient dust, dirt, or chemicals while work-ing in the fi elds.18 Farmworkers are regularly exposed to pesticides and other chemicals; their families are like wise at risk for both primary and secondhand pesticide exposure.
Day laborers’ job injuries receive scarce
medical attention
Day laborers —mostly Latino immigrant men and women who congregate in public places and pro-vide their services as construction laborers, movers, gardeners and landscapers, painters, roofers, and house cleaners— experience a high incidence of workplace injury.19 Nationally, almost 60% of day la-borers were born in Mexico. They face higher risks of injury on the job due to certain defi ning features of the informal economy in which they operate —i.e., the work of day laborers is largely unregulated and unprotected by law, leaving unscrupulous employ-ers who see workers as highly replaceable to act more or less with impunity.
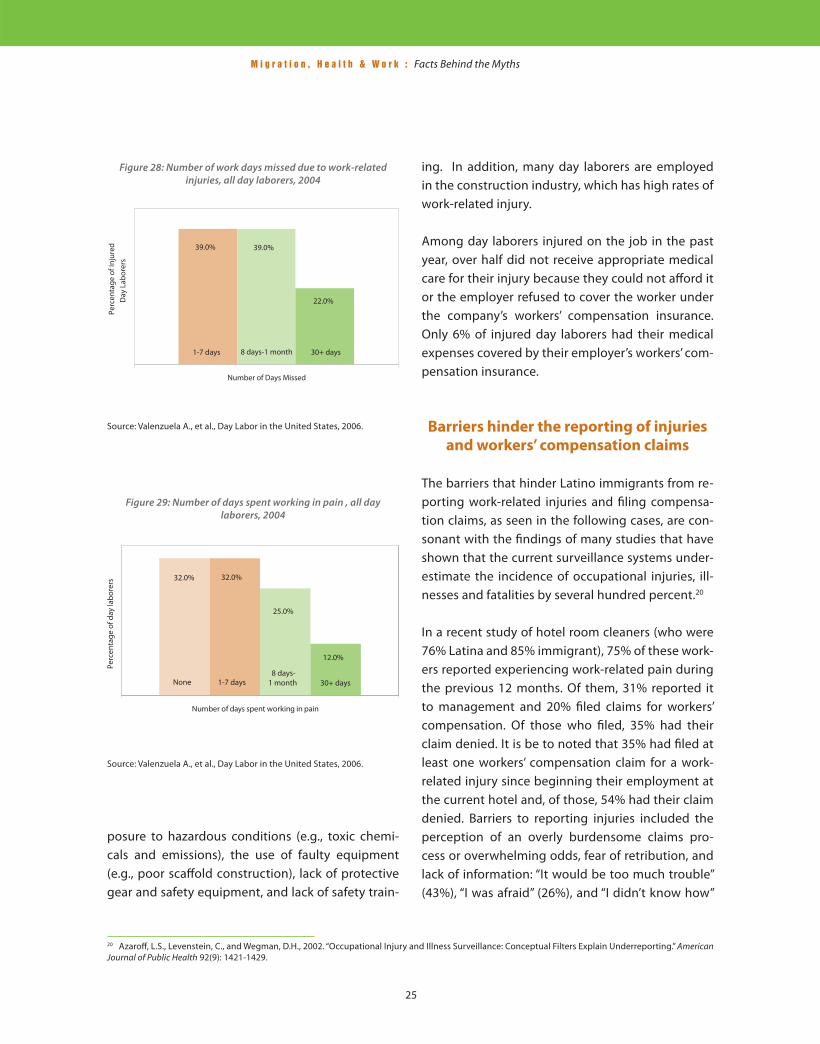
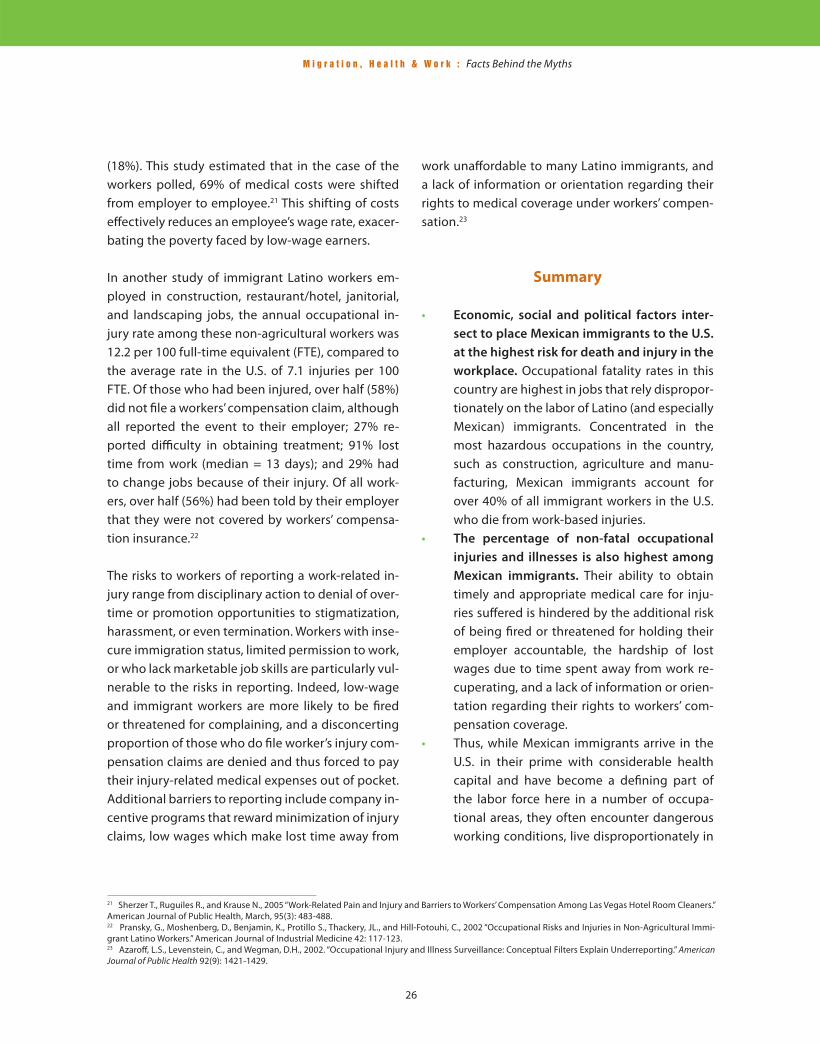
One in fi ve day laborers reports having suff ered an injury while on the job, two-thirds having missed work following an injury, and over half (54%) failing to receive needed medical care for their injury. Of those who missed work due to an occupational in-jury, 39% missed a week or less, another 39% with a mean number of 33 work days missed due to in-jury (Figure 28). Of all day laborers, 68% have worked while in pain during the past year with a mean num-ber of 20 days working while in pain (Figure 29).
Several factors contribute to the high rate of work-related injury among this population, including ex-
17 U.S. Department of Labor, 2004. National Census of Fatal Occupational Injuries in 2003. Washington, D.C.; McCauley, L.A., 2005. “Immigrant Workers in the United States: Recent Trends, Vulnerable Populations, and Challenges for Occupational Health.” AAOHN Journal 53(7): 313-319.18 Aguirre International, 2005. The California Farm Labor Force: Overview and Trends from the National Agriculture Workers Survey. Burlingame, CA. Avail-able at http://www.epa.gov/region09/ag/docs/fi nal-naws-s092805.pdf 19 Valenzuela, A., Theodore, N., Meléndez, E., Gonzalez, AL, 2006 On The Corner: Day Labor in the United States. Available at http://www.sscnet.ucla.edu/issr/csup/index.php.
Figure 27: Percent of non-fatal occupational injury and illness among Latinos necessitating days away from work, by causal
event, U.S. 1998-2000
Source: Committee on Communicating Occupational Safety and Health Information to Spanish-speaking Workers, 2003.
M i g r a t i o n , H e a l t h & W o r k : Facts Behind the Myths
25
20 Azaroff , L.S., Levenstein, C., and Wegman, D.H., 2002. “Occupational Injury and Illness Surveillance: Conceptual Filters Explain Underreporting.” American Journal of Public Health 92(9): 1421-1429.
Figure 28: Number of work days missed due to work-related injuries, all day laborers, 2004
Source: Valenzuela A., et al., Day Labor in the United States, 2006.
ing. In addition, many day laborers are employed in the construction industry, which has high rates of work-related injury. Among day laborers injured on the job in the past year, over half did not receive appropriate medical care for their injury because they could not aff ord it or the employer refused to cover the worker under the company’s workers’ compensation insurance. Only 6% of injured day laborers had their medical expenses covered by their employer’s workers’ com-pensation insurance.
Barriers hinder the reporting of injuries
and workers’ compensation claims
The barriers that hinder Latino immigrants from re-porting work-related injuries and fi ling compensa-tion claims, as seen in the following cases, are con-sonant with the fi ndings of many studies that have shown that the current surveillance systems under-estimate the incidence of occupational injuries, ill-nesses and fatalities by several hundred percent.20
In a recent study of hotel room cleaners (who were 76% Latina and 85% immigrant), 75% of these work-ers reported experiencing work-related pain during the previous 12 months. Of them, 31% reported it to management and 20% fi led claims for workers’ compensation. Of those who fi led, 35% had their claim denied. It is be to noted that 35% had fi led at least one workers’ compensation claim for a work-related injury since beginning their employment at the current hotel and, of those, 54% had their claim denied. Barriers to reporting injuries included the perception of an overly burdensome claims pro-cess or overwhelming odds, fear of retribution, and lack of information: “It would be too much trouble” (43%), “I was afraid” (26%), and “I didn’t know how”
Figure 29: Number of days spent working in pain , all day laborers, 2004
Source: Valenzuela A., et al., Day Labor in the United States, 2006.
posure to hazardous conditions (e.g., toxic chemi-cals and emissions), the use of faulty equipment (e.g., poor scaff old construction), lack of protective gear and safety equipment, and lack of safety train-
M i g r a t i o n , H e a l t h & W o r k : Facts Behind the Myths
26
21 Sherzer T., Ruguiles R., and Krause N., 2005 “Work-Related Pain and Injury and Barriers to Workers’ Compensation Among Las Vegas Hotel Room Cleaners.” American Journal of Public Health, March, 95(3): 483-488.22 Pransky, G., Moshenberg, D., Benjamin, K., Protillo S., Thackery, JL., and Hill-Fotouhi, C., 2002 “Occupational Risks and Injuries in Non-Agricultural Immi-grant Latino Workers.” American Journal of Industrial Medicine 42: 117-123.23 Azaroff , L.S., Levenstein, C., and Wegman, D.H., 2002. “Occupational Injury and Illness Surveillance: Conceptual Filters Explain Underreporting.” American Journal of Public Health 92(9): 1421-1429.
(18%). This study estimated that in the case of the workers polled, 69% of medical costs were shifted from employer to employee.21 This shifting of costs eff ectively reduces an employee’s wage rate, exacer-bating the poverty faced by low-wage earners.
In another study of immigrant Latino workers em-ployed in construction, restaurant/hotel, janitorial, and landscaping jobs, the annual occupational in-jury rate among these non-agricultural workers was 12.2 per 100 full-time equivalent (FTE), compared to the average rate in the U.S. of 7.1 injuries per 100 FTE. Of those who had been injured, over half (58%) did not fi le a workers’ compensation claim, although all reported the event to their employer; 27% re-ported diffi culty in obtaining treatment; 91% lost time from work (median = 13 days); and 29% had to change jobs because of their injury. Of all work-ers, over half (56%) had been told by their employer that they were not covered by workers’ compensa-tion insurance.22
The risks to workers of reporting a work-related in-jury range from disciplinary action to denial of over-time or promotion opportunities to stigmatization, harassment, or even termination. Workers with inse-cure immigration status, limited permission to work, or who lack marketable job skills are particularly vul-nerable to the risks in reporting. Indeed, low-wage and immigrant workers are more likely to be fi red or threatened for complaining, and a disconcerting proportion of those who do fi le worker’s injury com-pensation claims are denied and thus forced to pay their injury-related medical expenses out of pocket. Additional barriers to reporting include company in-centive programs that reward minimization of injury claims, low wages which make lost time away from
work unaff ordable to many Latino immigrants, and a lack of information or orientation regarding their rights to medical coverage under workers’ compen-sation.23
Summary
• Economic, social and political factors inter-
sect to place Mexican immigrants to the U.S.
at the highest risk for death and injury in the
workplace. Occupational fatality rates in this country are highest in jobs that rely dispropor-tionately on the labor of Latino (and especially Mexican) immigrants. Concentrated in the most hazardous occupations in the country, such as construction, agriculture and manu-facturing, Mexican immigrants account for over 40% of all immigrant workers in the U.S. who die from work-based injuries.
• The percentage of non-fatal occupational
injuries and illnesses is also highest among
Mexican immigrants. Their ability to obtain timely and appropriate medical care for inju-ries suff ered is hindered by the additional risk of being fi red or threatened for holding their employer accountable, the hardship of lost wages due to time spent away from work re-cuperating, and a lack of information or orien-tation regarding their rights to workers’ com-pensation coverage.
• Thus, while Mexican immigrants arrive in the U.S. in their prime with considerable health capital and have become a defi ning part of the labor force here in a number of occupa-tional areas, they often encounter dangerous working conditions, live disproportionately in
M i g r a t i o n , H e a l t h & W o r k : Facts Behind the Myths
27
poverty, and can seldom count on health in-surance, putting their continued well being at a particularly high risk. When the cost of medical treatment and missed work days due to a work-related injury or illness is subtracted from their already low earnings, Mexican im-migrants, along with their families, can be left in a precarious situation, unable to make ends meet or recoup their health.
Concentrated in the most hazardous occu-
pations in the country, Mexican immigrants
account for over 40% of all immigrant
workers in the U.S. who die from work-re-
lated injuries.
M i g r a t i o n , H e a l t h & W o r k : Facts Behind the Myths
28
Policy Considerations
This report documents the structural causes—low incomes, low rates of work-based health insurance coverage, and high levels of occupational injury and mortality—of the work-related health risks that dis-proportionately impact Mexican immigrants in the U.S. labor force: the “facts behind the myths”. While the ability of workers in many occupations to pro-vide for themselves and their families has eroded under pressures of the global economy, these issues are felt particularly acutely in this country by Lati-nos. As always, this erosion hits hardest those in the lowest occupational strata, many of whom are Mexi-can immigrant workers, and the health impact is felt within a wide segment of the U.S. population.
Reducing the health risks faced by immigrant work-ers in the U.S. benefi ts everyone. It is of direct ben-efi t to the workers themselves, who will face lower risks of on-the-job injury. It will benefi t employers, who will have a more stable and healthier work-force. And it will benefi t society, because workers who stay healthy on the job contribute even more to the nation’s prosperity. The best way to eff ective-ly reduce these risks is to address their underlying structural causes.
• Addressing the eff ect of low wages on immigrant workers’ health
As shown in this report, Latino workers in general, and Mexican immigrant workers in particular, earn salaries that are substantially below that of non-Lati-no whites, especially in the agriculture, construction and service occupations that rely heavily on Mexi-can immigrants for labor. One solution to the issues of inadequate income and a lack of health insurance is the living wage policies that have been adopted by some cities and states. Many large cities around the country now have ordinances that mandate a wage that raises workers and their families above the poverty level and in many cases provide incen-
tives to employers to include health insurance as well. This type of minimum wage levels the playing fi eld for all employers and provides needed benefi ts to low-wage workers.
• Addressing disproportionately high accident and fatality rates at work
The disproportionately high rates of work-related injury and death Mexican immigrants experience, (Mexicans account for 40% of all immigrant job re-lated deaths) are one of the most alarming public health risks presented in this report, signaling the need for more robust health and safety provisions for hazardous occupations and better coverage of worker’s compensation insurance. As a matter of public policy, these worker health and safety issues are addressed at the state level through laws mandat-ing that employers provide worker’s compensation insurance to their employees. These often ambigu-ous defi nitions can lead to gaps in coverage and the exclusion of some workers. More research is needed to determine how employers and employees make decisions regarding worker’s compensation, and to determine the impact on vulnerable populations. Overall, more rigorous enforcement and broader in-clusion would promote workplace safety and would improve the health and living conditions of Mexican immigrant workers, their families, and Latino com-munities in general.
• Addressing high levels of uninsurance in Latino communities
One means of targeting workers in occupations that rely heavily on Mexican immigrant labor is to expand health insurance programs, both public and private. This is typically a better way to address low-income groups than through tax incentives that are given to encourage individuals to purchase private insur-ance, because low-wage workers often already pay lower income taxes. In California, the State Children’s Health Insurance Plan (known as Healthy Families),
M i g r a t i o n , H e a l t h & W o r k : Facts Behind the Myths
29
together with county plans (e,g, Healthy Kids), have made impressive strides in providing health cover-age for all low-income children. The state also covers all low-income pregnant women and children under Medicaid (known as Medi-Cal in California).
Public programs also off er the opportunity to im-prove immigrant workers’ health through the ex-pansion of community clinics that provide access to health services for both basic care and work-related injuries. These community resources are commonly used by people with low incomes and are often the usual source of care for Mexican immigrants. Pro-grams that provide health education and outreach have helped bring individuals into these initiatives. In particular, lay health worker programs (promoto-ras) can be expanded to both increase a communi-ty’s knowledge about healthy behaviors as well as connect low-income workers with the resources of local community clinics.
Conclusions
This report demonstrates that Latino immigrant health is seriously impacted through participation in the U.S. labor force. Thus, we cannot overlook the importance of federal-level immigration reform in improving Latino community health. Being an im-migrant should not pose a risk to one’s health. U.S. employers benefi t from Latino immigrant labor, and consumers benefi t from the cost savings that are passed on. It is a basic premise of workers’ rights that employers should pay workers for the true cost of their labor, and this includes the health costs. Pro-visions that enable employers to opt against off er-ing health insurance or deny compensation claims make it cheaper to hire undocumented workers and encourage workers not to make claims on employ-ers for conditions that endanger health and safety. In summary, while we should not wait for a broad reform of U.S. immigration rules to address Latino health issues broadly considered, neither should im-
migration be separated from the debate. Ultimately, disadvantages to health suff ered by Latino work-ers due to their immigration status will continue to be felt at the community level unless we provide a mechanism that protects them at work. In the state of California, where dramatic economic growth in the occupations relying on Mexican immigrant la-bor is predicted, pro-health policy for immigrants is especially important. Thus, any guest-worker or ag-ricultural-labor program proposed as part of broad-er immigration reform must provide for the health and social conditions that workers need in order to thrive. This represents an enormous opportunity for all of us to recognize the contribution of these work-ers and their communities in the United States both economically and socially.