Embed Size (px)
Citation preview
The effects of teacher mathematics knowledgeand pedagogy on student achievement in ruralGuatemala
Jeffery H. Marshall • M. Alejandra Sorto
Published online: 22 February 2012
� Springer Science+Business Media B.V. 2012
Abstract Why are some teachers more effective than others? The importance of
understanding the interplay between teacher preparation, pedagogy and student
achievement has motivated a new line of research focusing on teacher knowledge.
This study analyses the effects of teacher mathematics knowledge on student
achievement using longitudinal data from rural Guatemalan primary schools. After
presenting a conceptual framework for linking the work of the teacher with student
learning in mathematics together with an overview of the different forms of teacher
knowledge, the paper introduces the Guatemalan context and the analytical
framework including the sample, data and methods. Overall, the results provide
some empirical support for a widely held, if infrequently tested, belief in mathe-
matics education: effective teachers have different kinds of mathematical knowl-
edge. The results also suggest specific mechanisms by which effective teachers can
make substantial impacts on student learning, even in extremely poor contexts.
Keywords Student mathematics achievement � Teacher mathematics knowledge �Teaching pedagogy � Guatemala
Resume Effets des connaissances mathematiques et de la pedagogie des enseig-
nants sur les resultats scolaires dans le Guatemala rural – Pourquoi certains en-
seignants sont plus efficaces que d’autres ? L’importance de cerner l’interaction
entre preparation de l’enseignant, pedagogie et resultats scolaires a motive un
nouvel axe de recherche qui se concentre sur les connaissances de l’enseignant. La
presente etude analyse les consequences des connaissances mathematiques des
J. H. Marshall (&)
4610 Ironstone Lane, West Lafayette, IN 47906, USA
e-mail: [email protected]
M. A. Sorto
601 University Drive, San Marcos, TX 78666, USA
e-mail: [email protected]
123
Int Rev Educ (2012) 58:173–197
DOI 10.1007/s11159-012-9276-6
enseignants sur les performances des eleves, en exploitant les donnees longitudi-
nales issues d’ecoles primaires du Guatemala rural. Les auteurs presentent un cadre
conceptuel qui relie le travail de l’enseignant a l’apprentissage des mathematiques
par les eleves, ainsi qu’une vue d’ensemble des diverses formes de savoir de
l’enseignant. Ils exposent ensuite le contexte guatemalteque et le cadre analytique
comportant l’echantillon, les donnees et les methodes. Globalement, les resultats
apportent un certain soutien empirique a la croyance largement repandue mais guere
verifiee sur l’enseignement des mathematiques : les enseignants efficaces possedent
des formes differentes de connaissances mathematiques. Les resultats induisent en
outre des mecanismes specifiques permettant aux enseignants efficaces d’exercer
une influence sensible sur l’apprentissage des eleves, meme dans les contextes
d’extreme pauvrete.
Zusammenfassung Die Auswirkungen mathematischer und padagogischer
Fahigkeiten von Lehrkraften auf die Leistungen ihrer Schulerinnen und Schuler im
landlichen Guatemala – Warum sind manche Lehrerinnen und Lehrer erfolgreicher
als andere? Aus dem dringenden Bedurfnis, die Wechselwirkungen zwischen
Lehrerausbildung, Padagogik und den Lernerfolgen der Schulerinnen und Schuler
zu verstehen, ist eine neue Forschungsrichtung erwachsen, die sich vor allem mit
dem Fachwissen der Lehrkrafte befasst. Anhand von Langsschnittdaten landlicher
Primarschulen in Guatemala wird in dieser Studie analysiert, wie sich das Wissen
der Lehrkrafte im Fach Mathematik auf die Leistungen ihrer Schulerinnen und
Schuler auswirken. Auf die Darstellung eines Rahmenkonzepts, das die Verknup-
fung zwischen der Arbeit der Lehrkraft und den Lernerfolgen der Schulerinnen und
Schuler im Fach Mathematik herstellt, und eines Uberblicks uber die verschiedenen
Arten von Lehrerwissen folgt eine Einfuhrung in den guatemaltekischen Kontext
und den Analyserahmen, einschließlich Stichprobe, Daten und Methoden. Insge-
samt liefern die Ergebnisse einen empirischen Beleg fur eine haufig anzutreffende,
jedoch selten uberprufte Ansicht im Bereich der mathematischen Bildung: erfol-
greiche Lehrkrafte verfugen uber verschiedene Arten von mathematischen Kennt-
nissen. Die Ergebnisse deuten außerdem darauf hin, dass erfolgreiche Lehrkrafte die
Lernleistungen von Schulerinnen und Schulern, selbst in einem Kontext extremer
Armut, durch bestimmte Mechanismen erheblich beeinflussen konnen.
Resumen Efectos de conocimientos en matematicas y pedagogıa de los docentes
sobre el rendimiento estudiantil en las zonas rurales de Guatemala – >Por que
algunos docentes son mas efectivos que otros? La importancia de entender la in-
teraccion entre preparacion docente, pedagogıa y rendimiento estudiantil ha dado
lugar a una nueva lınea de investigacion enfocada en los conocimientos del docente.
En este estudio, usando datos longitudinales de escuelas primarias en zonas rurales
de Guatemala, se analizan los efectos que tienen los conocimientos en matematicas
del docente sobre el rendimiento estudiantil. Luego de presentar un marco con-
ceptual para enlazar el trabajo del docente con el aprendizaje de matematicas de los
estudiantes, junto con una vision general de las diferentes formas de conocimiento
docente, este trabajo introduce el contexto Guatemalteco y el marco analıtico, in-
cluyendo muestra, datos y metodos. En general, los resultados proveen algun apoyo
174 J. H. Marshall, M. A. Sorto
123
empırico a la creencia generalizada, aunque poco comprobada, en cuanto a
ensenanza de las matematicas: los docentes efectivos tienen diferentes clases de
conocimientos matematicos. Los resultados tambien indican mecanismos especıfi-
cos con los cuales los docentes efectivos pueden producir un impacto importante en
el aprendizaje de los estudiantes, incluso en contextos de extrema pobreza.
Introduction
It makes intuitive sense that a teacher’s mathematics knowledge affects his or her
ability to teach mathematics and, by extension, his or her students’ achievement.
But considering the results of more than forty years of statistical analyses of student
test scores there is surprisingly little evidence to make this case empirically (Wayne
and Youngs 2003). Most studies have had to make do with proxies of the teacher’s
knowledge based on mathematics coursework, certification and education levels.
These are poor substitutes for actual knowledge, but less intrusive data to collect
compared with teacher tests. The exceptions have, historically, come mainly from
developing countries where a handful of studies show a positive correlation between
the teacher’s knowledge of mathematics and student achievement (Harbison and
Hanushek 1992; Mullens et al. 1996; Marshall and White 2001).
The results from these studies make a general case for raising teacher content
knowledge through more intensive pre-service preparation or in-service training.
But a number of important questions remain. For example, how much exposure to
higher-level mathematics content do teachers need to be effective, including non-
mathematics specialists or general education majors who often work in primary
schools? Also, to what degree is the empirical link between mathematics content
knowledge and student achievement a product of an underlying, specialised
The effects of teacher mathematics knowledge and pedagogy 175
123
teaching knowledge domain (Shulman 1986)? And how does teachers’ knowledge
of mathematics influence their pedagogical choices (i.e. how much time to spend on
which activities) in the classroom?
The importance of understanding this interplay between teacher preparation,
pedagogy and student achievement has motivated a new line of research focusing on
teacher knowledge. A lot of the work builds on the pedagogical content knowledge
(or PCK) concept introduced by Lee Shulman (Shulman 1986). PCK goes beyond
basic content knowledge and emphasises subject matter knowledge for teaching,
which can include the teacher’s knowledge of how students learn as well as different
ways of teaching specific content. In recent years these ideas have been further
extended in mathematics through the work of Deborah Ball, Hyman Bass and
Heather Hill (Ball and Bass 2000; Hill and Ball 2004; Hill et al. 2008a). As a result
there is a growing research base analysing different forms of teacher knowledge
using large-sample surveys of student achievement. For example, Hill et al. (2005)
and Jonah E. Rockoff et al. (2008) found that the teacher’s ‘‘mathematics
knowledge for teaching’’ (or MKT) predicts student knowledge growth in
elementary and middle schools in the United States. Jurgen Baumert et al. (2010)
found that a measure of PCK is a significant predictor of student mathematics
learning gains in German secondary schools. Marshall et al. (2009) have shown
significant results linking measures of teacher PCK and content knowledge with
student achievement in Cambodian primary schools.
Our study continues this line of inquiry in analysing the effects of teacher
mathematics knowledge on student achievement using longitudinal data from rural
Guatemalan primary schools. The teachers in our sample answered mathematics test
questions at primary and middle school levels, and completed several activities
designed to measure their specialised content knowledge for primary school
mathematics teaching. This information is augmented with observational data that
break down lessons into a series of time segments for activities such as seatwork1
and recitation.2 The availability of three different forms of mathematical knowledge
(primary and middle school content plus a more specialised form) together with
indicators of pedagogical choices provided an excellent opportunity to analyse the
effects of teachers’ capacities on student learning. We did this for the overall student
mathematics test score as well as by individual content areas (numbers, geometry,
etc.), which allowed for a still more precise accounting of how specific teacher –
and teaching – characteristics help determine learning outcomes.
After presenting a conceptual framework for linking the work of the teacher with
student learning in mathematics together with an overview of the different forms of
teacher knowledge, this paper introduces the Guatemalan context and the analytical
framework including the sample, data and methods. This is followed by the results
and some conclusions.
1 Seatwork refers to assignments pupils are asked to carry out individually while sitting at their desks.2 Recitation refers to question and answer activities individually and in ‘‘chorus’’ (i.e. the whole class
answers in unison).
176 J. H. Marshall, M. A. Sorto
123
Conceptual framework
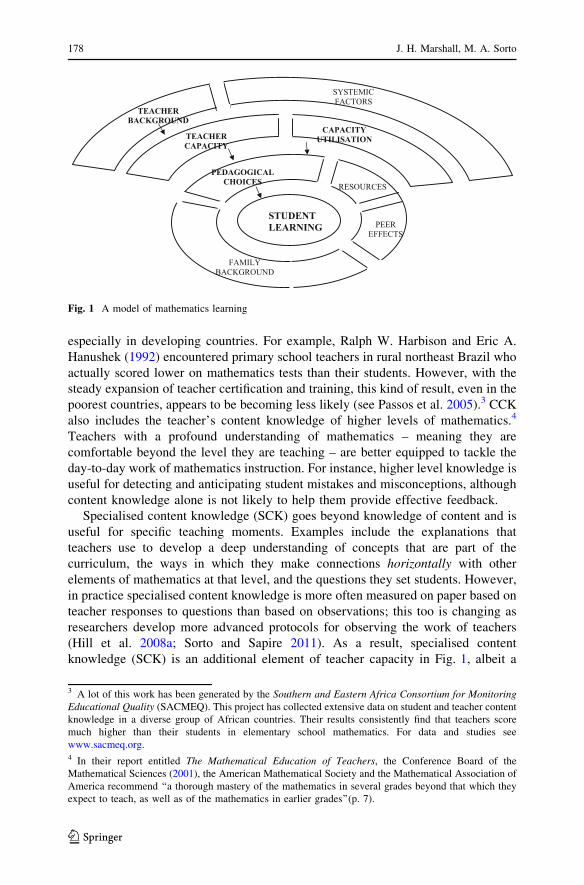
Figure 1 provides a general overview of the factors that determine student learning,
adapted in this study to the teaching of mathematics in a developing country. Family
background figures prominently as a direct predictor of learning. But based on the
evidence from quantitative analyses of student test scores (Wayne and Youngs
2003; Fuller and Clarke 1994), the same is not true for teacher background
characteristics like experience, education and training, which are positioned along
the outer edges of Fig. 1. The challenge for researchers – in both conceptual and
empirical terms – is to fill in the chain (shown as arrows in Fig. 1) linking these
background measures with student learning. This in turn requires opening up the
teaching and learning ‘‘black box’’ in order to understand more about the
antecedents of effective teaching.
Teacher capacity refers to specific domains of knowledge that are critical for
good teaching. These domains of knowledge have been studied (both in theory and
empirically) under different conceptualisations and terminology. Shulman (1986)
first introduced a classification of teacher knowledge into three categories: (1)
subject matter content knowledge; (2) pedagogical content knowledge (PCK)
combining elements of content and teaching knowledge; and (3) curricular
knowledge. Shulman’s PCK concept has since been expanded and used in many
contexts, although often with different meanings (e.g. Grossman 1990 in literature;
Wilson and Wineburg 1988 in social sciences; Watson 2001 in statistics education).
Heather Hill, Deborah Ball and Stephen Schilling (2008a) addressed this lack of
clarity by introducing an updated terminology for mathematics that expands on the
PCK domain while also defining what it is and how it relates to student outcomes
(see Ball et al. 2005; Hill et al. 2004). They call this mathematical knowledge for
teaching, or MKT. MKT has two main categories: (1) subject matter knowledge,
including common content knowledge (or CCK), specialised content knowledge
(SCK), and ‘‘knowledge at the mathematical horizon’’; and (2) pedagogical content
knowledge with a more explicit classification to include knowledge of content and
students (KCS), knowledge of content and teaching (KCT), and knowledge of
curriculum. There is clearly some overlap with Shulman’s original PCK formula-
tion, but with some important differences. First, the subject matter knowledge in
Shulman’s conceptualisation is a subset of the subject matter knowledge for MKT
and, according to Hill et al. (2008a), it corresponds to the CCK domain only.
Second, Shulman did not consider the knowledge of curriculum as part of the PCK
element, but rather as a separate domain of knowledge.
The framework and terminology introduced by Hill et al. (2008a) underlie a lot of
recent work in the United States. Theirs is certainly not the last word on this
concept, as noted by some recent extensions in an international study of
mathematics (Tatto et al. 2008). Nevertheless, the MKT ‘‘umbrella’’ covers a lot
of terrain for understanding teacher capacity, and it is the conceptualisation that we
incorporated in this study.
Returning to Fig. 1, teacher capacity begins with common content knowledge
(CCK) and the necessity that teachers are familiar with the subject matter they are
responsible for (Boero et al. 1996). These minimum skills should not be assumed,
The effects of teacher mathematics knowledge and pedagogy 177
123
especially in developing countries. For example, Ralph W. Harbison and Eric A.
Hanushek (1992) encountered primary school teachers in rural northeast Brazil who
actually scored lower on mathematics tests than their students. However, with the
steady expansion of teacher certification and training, this kind of result, even in the
poorest countries, appears to be becoming less likely (see Passos et al. 2005).3 CCK
also includes the teacher’s content knowledge of higher levels of mathematics.4
Teachers with a profound understanding of mathematics – meaning they are
comfortable beyond the level they are teaching – are better equipped to tackle the
day-to-day work of mathematics instruction. For instance, higher level knowledge is
useful for detecting and anticipating student mistakes and misconceptions, although
content knowledge alone is not likely to help them provide effective feedback.
Specialised content knowledge (SCK) goes beyond knowledge of content and is
useful for specific teaching moments. Examples include the explanations that
teachers use to develop a deep understanding of concepts that are part of the
curriculum, the ways in which they make connections horizontally with other
elements of mathematics at that level, and the questions they set students. However,
in practice specialised content knowledge is more often measured on paper based on
teacher responses to questions than based on observations; this too is changing as
researchers develop more advanced protocols for observing the work of teachers
(Hill et al. 2008a; Sorto and Sapire 2011). As a result, specialised content
knowledge (SCK) is an additional element of teacher capacity in Fig. 1, albeit a
STUDENT LEARNING
PEDAGOGICAL CHOICES
TEACHER CAPACITY
CAPACITY UTILISATION
SYSTEMIC FACTORS
TEACHER BACKGROUND
RESOURCES
PEER EFFECTS
FAMILY BACKGROUND
Fig. 1 A model of mathematics learning
3 A lot of this work has been generated by the Southern and Eastern Africa Consortium for MonitoringEducational Quality (SACMEQ). This project has collected extensive data on student and teacher content
knowledge in a diverse group of African countries. Their results consistently find that teachers score
much higher than their students in elementary school mathematics. For data and studies see
www.sacmeq.org.4 In their report entitled The Mathematical Education of Teachers, the Conference Board of the
Mathematical Sciences (2001), the American Mathematical Society and the Mathematical Association of
America recommend ‘‘a thorough mastery of the mathematics in several grades beyond that which they
expect to teach, as well as of the mathematics in earlier grades’’(p. 7).
178 J. H. Marshall, M. A. Sorto
123
potentially more powerful one compared with common content knowledge. This
distinction between hypothetical and applied knowledge may seem inconsistent
with a concept that is so grounded in application. But teacher trainers and
researchers have long been puzzled by the dynamic of the ‘‘expert student’’ who
becomes a ‘‘novice teacher’’ (Shulman 1986; Borko et al. 1992; Eisenhart et al.
1993). This in turn raises the possibility that teachers with apparently high levels of
mathematics knowledge may not be effective in actually delivering that curriculum
in the classroom.
One explanation for ‘‘underperforming’’ teachers is that high levels of content
and specialised knowledge may be of little help when the teacher lacks the general
pedagogical skills required to create an environment where learning can take place
(meaning there are other forms of knowledge that matter as well). But this
discussion so far largely assumes that pedagogical actions are determined solely by
capacity. In reality the choices that teachers make in the classroom are affected by
what they can do (i.e. capacity) as well as their motivation to fully apply these skills.
This is captured in Fig. 1 by the capacity utilisation element, which includes
systemic and environmental features that affect teacher behaviour.
A substantial body of evidence demonstrates the potential for school supervision
and support regimes to impact the work of teachers in the classroom (Rizvi 2008;
Anderson 2008; Sargent and Hannum 2009). Nevertheless, many teachers in the
developing world work in very isolated situations, with little support or account-
ability. This may help explain in part the high rates of school closure and teacher
absences observed in places like rural Guatemala (Marshall 2009). But based on
recent research in classrooms in Honduras (UMCE 2003), Panama (Sorto et al.
2009), Brazil (Carnoy et al. 2007) and South Africa (Sorto and Sapire, 2011) there is
good reason to be concerned about a pedagogical manifestation of this problem as
well. Teachers in these studies were frequently observed relying on students
copying activities from the blackboard or workbooks, with extended periods of
individual seatwork devoted to procedural exercises with little instruction.
Recitation activities were often limited to very simple, yes/no questions, and
students were rarely asked to justify their answers or make a connection with other
elements of mathematics. Student mistakes were not always corrected, and were
often marked as incorrect and then the student was told to simply fix the problem.
Manipulatives5 and visual models were rarely used.
There are clearly teacher capacity limitations in this situation, meaning teachers
may lack basic content knowledge or the necessary pedagogical content knowledge
to articulate effective explanations when students struggle. In many cases their
pedagogical choices may simply reflect the kind of training they received, or the
way they were taught when they were in school. But there is also the possibility that
these teachers are not fully applying themselves in their work, which in turn opens
the door to a range of school environmental and support influences that need to be
considered together with teacher capacity as explanations of low quality teaching.
This discussion of the teacher’s impact on student achievement in mathematics
highlights three research areas where much work remains. The first requires
5 Manipulatives are hands-on models, e.g. geometric shapes, designed for learners of mathematics.
The effects of teacher mathematics knowledge and pedagogy 179
123
information on how pedagogical choices affect student achievement. Ideally these
data would capture the critical components of effective maths instruction (Hill et al.
2007; Seidel and Shavelson 2007). But even basic indicators of pedagogy – when
based on actual observations – are likely to be useful for understanding why some
teachers are more effective than others. Second, how are these choices themselves
influenced by teacher capacity, including their knowledge of mathematics, and the
work environment? The studies by Hill et al. (2005) and Baumert et al. (2010) make
a convincing case that the teacher’s mathematics knowledge matters; but there is
still the need to identify the pedagogical mechanisms by which this knowledge is
transferred to specific teaching moments. Finally, how are different forms of teacher
knowledge (CCK, SCK, etc.) related to student learning? Despite the growing
interest in this topic the research base is still pretty limited, which in turn highlights
the need for more theory testing and applications of these ideas around the world.
Analytical framework
Guatemalan context
Guatemala has a population of 13 million people, and is located in the Central
American region bordering Mexico, El Salvador, Honduras and Belize. It is one of
the poorest countries of Latin America. 25 per cent of the population lives on less
than the equivalent of two USD per day, and at the time of this data collection
(2002) approximately 70 per cent of the rural population lived below the poverty
line defined by the World Bank (UNDP 2009; World Bank 2002). Parents often
have less than three years of completed education, and many mothers are illiterate.
Child labour indices are also among the highest in the region (Marshall 2003).
Guatemala has a rich cultural heritage, and is one of the few places in Latin
America where large numbers of indigenous peoples have maintained their
language and dress. But these communities have also received little from the central
government in terms of public services (McEwan and Trowbridge 2007), in part
because of their concentration in rural areas. This situation is slowly changing,
stimulated by the official recognition of bilingual education (in 1996) and a
redoubling of efforts to improve rural education. At the time of this survey the
national net primary enrolment rate stood at 88 per cent, although this is lower in
rural areas (UIS 2007).
Given the widespread poverty in these communities, a policy and research
emphasis on the work of the teacher is well justified. A recent sector study (PREAL
2008) highlights both the accomplishments in coverage and the challenges that
remain to guarantee a quality education for all students. The structural constraints
are considerable, as per pupil spending at the primary level (in 2006) was at about
430 US dollars per year (PREAL 2008, Table 20).6 Teachers are graduates of
normal schools that provide three years of high school-level instruction, and in rural
6 Primary schooling in Guatemala has six grades, with the official age of entry being seven.
180 J. H. Marshall, M. A. Sorto
123
areas especially few primary school teachers have completed post-secondary
education.
Sample and data collection
The data collection began at the end of the 2001 school year (August–September)
with a set of Spanish and mathematics exams in a nationally representative sample
of rural grade three classrooms. This work was completed by the ProgramaNacional de Evaluacion del Rendimiento Escolar (PRONERE) evaluation project
(PRONERE 2001), which selected up to thirty grade three students at random in
each school. The follow-up data collection took place throughout the 2002 school
year in a sub-sample of 55 schools drawn from the PRONERE sample in three
administrative states. The states were selected in order to cover the three main
community types in rural Guatemala: largely indigenous Alta Verapaz in the
northern highlands, largely ladino (non-indigenous) Escuintla along the southern
coast, and Chimaltenango in the central highlands, where both indigenous and
ladino populations reside. In each state all of the PRONERE sample schools from
2001 were re-visited. The averages for 2001 test scores and parental education in
these 55 schools are very similar to the national PRONERE averages. This of course
does not mean that the sample is nationally representative, or that the results are
generalisable to all of rural Guatemala. But it is important to note that the schools
were not drawn solely from a single region in what is linguistically and ethnically a
very diverse country.
Two teams of data collection personnel were hired and supervised by the first
author to complete the fieldwork. Each school was visited at least twice throughout
the 2002 school year. The first visit, which took place between April and June, was
used to observe teacher work in the classroom, update student lists from the
previous year’s PRONERE test application, and distribute the first of two
questionnaires to teachers. The schools were then revisited during a two-week
period in late July/early August for conducting the same PRONERE exams with the
cohort of students who had originally participated in the 2001 test.7 Additional data
on student and family background were obtained through a 15–20-minute interview
with each student after the test application, and teachers were asked to complete the
second questionnaire while their students worked on the exams. The late July/early
August period was chosen in order to maximise the number of students who were
available for testing. Guatemalan schools officially begin their school year in
January and end it in October, but in rural areas the actual calendar is often shorter,
and students can begin to leave in August or September.
In most cases the roughly 900 tested students from 2001 were in grade four in
2002, with a smaller group (about 10 per cent) of repeaters who remained in grade
three. Data collection personnel were instructed to distribute the teacher question-
naires to all teachers with students in the testing cohort, regardless of grade (or
section). This work was facilitated by several factors. First, in 12 schools the same
7 There were two slightly different forms (see the Variables section in this article). Students were given
the opposite form (A or B) the second time round.
The effects of teacher mathematics knowledge and pedagogy 181
123
teacher was responsible for grades three and four, while in another 15 schools there
were no (tested) grade three repeaters in 2002. Also, only six of the 55 schools had
more than one grade four section. About 90 teachers completed the background
questionnaires measuring things like experience and maths content knowledge.
However, in most schools the classroom observations were conducted in only one
grade four classroom per school. This does result in missing data for some students,
a detail which we will return to below.
Variables
Table 1 lists the variable names, definitions, means and standard deviations (when
appropriate). Controls for student/family background include student gender, age,
frequency of school attendance, ethnicity, parental education and the student’s
incoming (2001) mathematics score. These data confirm the widespread poverty in
rural Guatemala, as evidenced by parental education levels of roughly two years.
There are some additional controls for school and community characteristics, as
well as the four main groups of variables used in this study.
Student achievement measures (listed under Achievement-dependent variables in
Table 1) include whole test summaries (from 2001 and 2002) and seven specific
content area scores for the 2002 test. The test questions were created by PRONERE
subject specialists in multiple choice format. The two forms (A and B) included
different questions, and were intended to be symmetrical with each item correspond-
ing to a nearly identical question on the opposite form.8 However, for a handful of
items the difficulty levels (i.e. per cent who answered correctly) are significantly
different between the two forms. These differences do not turn up in comparisons of
the overall averages by form, and the PRONERE tests have very good properties in
nationally representative samples (PRONERE 2001). Nevertheless, to further
strengthen the test form equivalence we used a two-parameter item response theory
(IRT) model to exclude several items with poor fit (Cartwright 2010; Crocker and
Algina 1986). The remaining item characteristics were then used to generate adjusted
student percentage correct scores for the overall test (in 2002) and by content area.9
The student scores in Table 1 are presented as percentages between 0 and 100.
The most important result is that there is clear improvement taking place on the
mathematics exam between the end of the 2001 school year (when the PRONERE
tests were applied) and the end of the 2002 school year (when the sub-sample was
revisited). Average achievement increased from 43.8 per cent to 57.5 per cent
during this period. The results by content areas suggest that students were most
comfortable with addition-subtraction and units, and struggled with fractions. But
8 For example, on Form A the second addition task is 352 ? 234 ? 601, whereas on Form B the
corresponding task is 351 ? 241 ? 602.9 This was implemented using the Item and Test Analysis (IATA) programme (version 3.0); see
Cartwright (2010) for details about the software and model. Item pairs with statistically indistinguishable
difficulty levels by form were treated as a single anchor item answered by all students. The remaining
items were included as separate questions answered by half of the students. Items with discrimination
values below 0.30 were discarded for the final analysis. The IRT-generated percentage correct measures
are very similar to the raw averages.
182 J. H. Marshall, M. A. Sorto
123
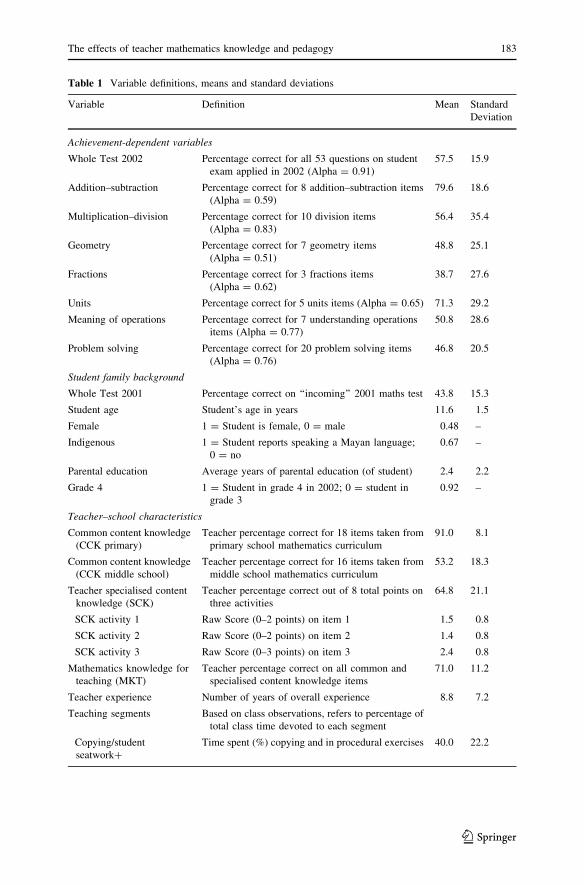
Table 1 Variable definitions, means and standard deviations
Variable Definition Mean Standard
Deviation
Achievement-dependent variables
Whole Test 2002 Percentage correct for all 53 questions on student
exam applied in 2002 (Alpha = 0.91)
57.5 15.9
Addition–subtraction Percentage correct for 8 addition–subtraction items
(Alpha = 0.59)
79.6 18.6
Multiplication–division Percentage correct for 10 division items
(Alpha = 0.83)
56.4 35.4
Geometry Percentage correct for 7 geometry items
(Alpha = 0.51)
48.8 25.1
Fractions Percentage correct for 3 fractions items
(Alpha = 0.62)
38.7 27.6
Units Percentage correct for 5 units items (Alpha = 0.65) 71.3 29.2
Meaning of operations Percentage correct for 7 understanding operations
items (Alpha = 0.77)
50.8 28.6
Problem solving Percentage correct for 20 problem solving items
(Alpha = 0.76)
46.8 20.5
Student family background
Whole Test 2001 Percentage correct on ‘‘incoming’’ 2001 maths test 43.8 15.3
Student age Student’s age in years 11.6 1.5
Female 1 = Student is female, 0 = male 0.48 –
Indigenous 1 = Student reports speaking a Mayan language;
0 = no
0.67 –
Parental education Average years of parental education (of student) 2.4 2.2
Grade 4 1 = Student in grade 4 in 2002; 0 = student in
grade 3
0.92 –
Teacher–school characteristics
Common content knowledge
(CCK primary)
Teacher percentage correct for 18 items taken from
primary school mathematics curriculum
91.0 8.1
Common content knowledge
(CCK middle school)
Teacher percentage correct for 16 items taken from
middle school mathematics curriculum
53.2 18.3
Teacher specialised content
knowledge (SCK)
Teacher percentage correct out of 8 total points on
three activities
64.8 21.1
SCK activity 1 Raw Score (0–2 points) on item 1 1.5 0.8
SCK activity 2 Raw Score (0–2 points) on item 2 1.4 0.8
SCK activity 3 Raw Score (0–3 points) on item 3 2.4 0.8
Mathematics knowledge for
teaching (MKT)
Teacher percentage correct on all common and
specialised content knowledge items
71.0 11.2
Teacher experience Number of years of overall experience 8.8 7.2
Teaching segments Based on class observations, refers to percentage of
total class time devoted to each segment
Copying/student
seatwork?
Time spent (%) copying and in procedural exercises 40.0 22.2
The effects of teacher mathematics knowledge and pedagogy 183
123
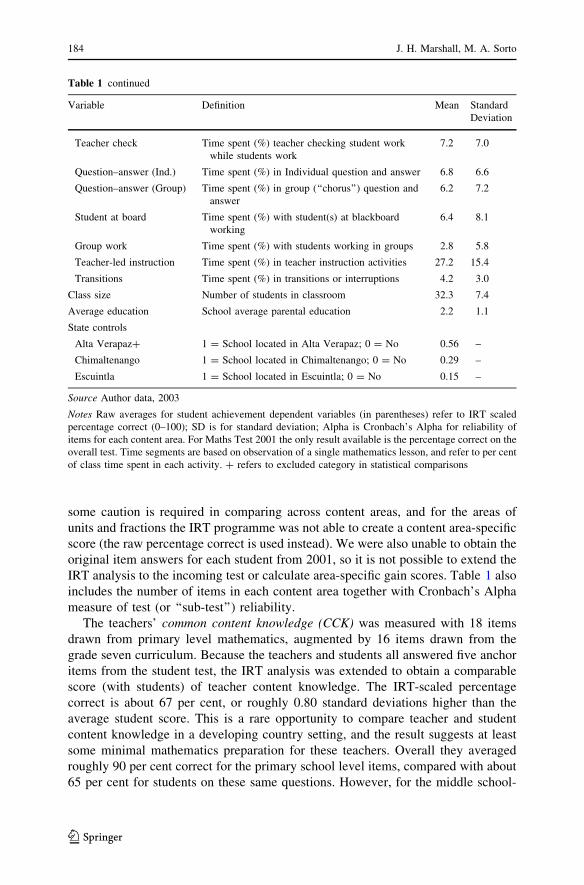
some caution is required in comparing across content areas, and for the areas of
units and fractions the IRT programme was not able to create a content area-specific
score (the raw percentage correct is used instead). We were also unable to obtain the
original item answers for each student from 2001, so it is not possible to extend the
IRT analysis to the incoming test or calculate area-specific gain scores. Table 1 also
includes the number of items in each content area together with Cronbach’s Alpha
measure of test (or ‘‘sub-test’’) reliability.
The teachers’ common content knowledge (CCK) was measured with 18 items
drawn from primary level mathematics, augmented by 16 items drawn from the
grade seven curriculum. Because the teachers and students all answered five anchor
items from the student test, the IRT analysis was extended to obtain a comparable
score (with students) of teacher content knowledge. The IRT-scaled percentage
correct is about 67 per cent, or roughly 0.80 standard deviations higher than the
average student score. This is a rare opportunity to compare teacher and student
content knowledge in a developing country setting, and the result suggests at least
some minimal mathematics preparation for these teachers. Overall they averaged
roughly 90 per cent correct for the primary school level items, compared with about
65 per cent for students on these same questions. However, for the middle school-
Table 1 continued
Variable Definition Mean Standard
Deviation
Teacher check Time spent (%) teacher checking student work
while students work
7.2 7.0
Question–answer (Ind.) Time spent (%) in Individual question and answer 6.8 6.6
Question–answer (Group) Time spent (%) in group (‘‘chorus’’) question and
answer
6.2 7.2
Student at board Time spent (%) with student(s) at blackboard
working
6.4 8.1
Group work Time spent (%) with students working in groups 2.8 5.8
Teacher-led instruction Time spent (%) in teacher instruction activities 27.2 15.4
Transitions Time spent (%) in transitions or interruptions 4.2 3.0
Class size Number of students in classroom 32.3 7.4
Average education School average parental education 2.2 1.1
State controls
Alta Verapaz? 1 = School located in Alta Verapaz; 0 = No 0.56 –
Chimaltenango 1 = School located in Chimaltenango; 0 = No 0.29 –
Escuintla 1 = School located in Escuintla; 0 = No 0.15 –
Source Author data, 2003
Notes Raw averages for student achievement dependent variables (in parentheses) refer to IRT scaled
percentage correct (0–100); SD is for standard deviation; Alpha is Cronbach’s Alpha for reliability of
items for each content area. For Maths Test 2001 the only result available is the percentage correct on the
overall test. Time segments are based on observation of a single mathematics lesson, and refer to per cent
of class time spent in each activity. ? refers to excluded category in statistical comparisons
184 J. H. Marshall, M. A. Sorto
123
level content knowledge questions these primary school teachers clearly struggled:
the overall average correct is only about 50 per cent (see Table 1).10
The teachers’ specialised content knowledge (SCK) in mathematics was assessed
using three items created by the second author. These open-ended questions asked
teachers to diagnose student errors and create a word problem; the items and grading
schematics are presented in more detail elsewhere.11 The questions are intended to
capture the teacher’s applied knowledge by embedding content knowledge elements
within specific teaching situations. Our SCK measure lacks the kind of ‘‘breadth and
depth’’ that comes from applying IRT analysis to a large number of items over a
wide range of teaching areas (see Hill et al. 2005; Baumert et al. 2010). But the
availability of this kind of specialised measure together with common content
knowledge provides a useful opportunity to compare the relative importance of
different forms of knowledge. The overall average is about 65 per cent correct (or
roughly 5 points out of the total 8). Table 1 also presents the results for each of the
three individual activities that make up the overall SCK score.
The three separate knowledge measures for primary school content, middle
school content and specialised content knowledge were also combined to create a
single indicator of mathematics knowledge for teaching (MKT) (see Table 1). It
should be noted that our MKT measure covers only content knowledge in common
and specialised form, which is similar to the strategy employed by Heather Hill,
Brian Rowan and Deborah Ball (2005) in their study of student learning in United
States elementary schools. This means we cannot touch on the full range of the
MKT concept as defined by Hill et al. (2008a). Nevertheless, the overall measure
goes beyond most previous studies, and we also retain the flexibility to consider the
effects of different forms of knowledge, as in Baumert et al. (2010).
Data on classroom processes were collected by observing a single grade four
mathematics lesson during the middle of the school year. The main instrument
applied was a time segment summary, based on a simple ‘‘time on task’’ framework
(Carroll 1963). Data collection personnel observed an entire mathematics lesson and
indicated the predominant segment during each 15-second period. The enumerators
were trained by the first author at the beginning of the school year using videotapes
of classes from other countries, as well as ‘‘live’’ practice sessions in schools to
compare notes. The actual observations were completed individually in real time,
and the classes were not filmed. Each lesson can be summarised as a series of
percentages devoted to individual activities, summing to 1 (or 100 per cent).
The summaries in Table 1 show that the predominant activity is student seatwork
(40 per cent of all time), divided into copying instructions and working on
procedural exercises individually. A version of this segment (‘‘Teacher Checking’’)
10 Of the two measures of common content knowledge (CCK) the fairly high mean (together with low
variance) for the primary level limits its utility for classifying teachers, especially if those with lower
scores were missing questions because of carelessness. We investigated this further using IRT and factor
analysis; the results identified a handful of items with poor fit (mainly at the primary level). But the power
of these statistical extensions is limited somewhat by sample size, so in the empirical work below the
teacher mathematics knowledge indicators refer to raw percentages (or total points), and are not adjusted
using IRT.11 Grading schematics are available upon request from the authors.
The effects of teacher mathematics knowledge and pedagogy 185
123

refers to students engaged in seatwork while the teacher is circulating to check their
work. Recitation activities include question and answer activities individually and in
‘‘chorus’’ (i.e. the whole class answers in unison), as well as students working at the
blackboard. Teacher-led instruction takes up about 27 per cent of the average class,
which includes lecturing, explaining, and demonstrating an example on the board.
Finally, transitions refer to ‘‘dead time’’ in between activities, interruptions and
episodes of disciplining a student (which were rarely observed).
These kinds of classroom snapshots are far from ideal for capturing the
mathematical quality of the lesson. Instead they tell us more about the general
strategies employed by teachers, and the extent to which they are directly involved
in the learning activities in the classroom. We have no way of verifying that each
observed teaching outcome is a valid representation of how these teachers teach
every day. Nevertheless, we are sceptical that things are much different on other
days, for three reasons. First, the overall flavour of these results is consistent with
our observations of classrooms elsewhere in rural Guatemala, and throughout the
Central American region (UMCE 2003). Second, it seems unlikely that teachers are
able to significantly change their teaching style given the fairly limited preparation
they receive, and in most cases permission to observe the class was obtained on the
same day the observation took place. And finally, the students themselves play a
part in these outcomes, and their behaviour is not likely to be easily modified by
teachers in response to having visitors.
Methodology
The student test score data are hierarchical since students are grouped together (or
nested) within individual classrooms, mainly in the grade four classroom in 2002.
Multilevel models are popular in education because they explicitly account for
this kind of nesting by estimating parameters that correspond to different levels
(Raudenbush and Bryk 1986). In the present case there are two levels of observation,
corresponding to students (level 1) and teachers (level 2); a three-level model with
teachers nested within schools is not necessary because these rural schools on
average are very small, and have one section where most of the students are found.
We use the Hierarchical Linear and Nonlinear Modeling (HLM) programme (Bryk
and Raudenbush 1992) to estimate achievement models of the form:
yij ¼ p0j þ p0X Xð Þiþeij ð1Þ
p0j ¼ b00 þ b0MK MKTð Þjþb0TS TSð Þjþb0T Tð Þjþb0S Sð Þjþr0j ð2Þ
Maths achievement y for student i is measured as an overall score as well as for
seven specific content areas (see Table 1). The level-one predictors include a
teacher- (or classroom-) specific intercept (p0j), a vector of individual student and
family background characteristics (X), and an error term.12 Among these background
12 For the final analyses, all of the level 1 predictors (except the intercept) are fixed, meaning they do not
have a random component. In some preliminary analyses significant random effects were encountered,
but these estimations were not very robust and varied considerably by content area. So the more
conservative estimations are presented here.
186 J. H. Marshall, M. A. Sorto
123
variables is the student’s score on the 2001 PRONERE mathematics exam, which is
used for the overall test score model as well as for the content area-specific
estimations. As noted before, it was not possible to apply IRT scaling to the 2001
results, so gains are captured indirectly using the level of mathematics knowledge at
the end of 2002 while controlling the overall level score from the end of the 2001
school year.
Equation 2 generates the various point estimates b for the level-2 predictors of
the (adjusted) classroom average achievement (p0j). The teacher mathematics
knowledge for teaching (MKT) vector includes common content knowledge (CCK),
specialised knowledge (SCK) and an overall indicator (see Table 1); each is used in
different specifications that are described in more detail in the Results section
below. The only other teacher background variable (corresponding to T in Eq. 2)
that is included is for experience. In preliminary analyses the teacher’s education
level was used as well, but there is some collinearity between education and
mathematics knowledge (this is discussed later). This is a somewhat parsimonious
specification for the teacher, but the availability of mathematics knowledge
measures and observational data on teaching means we are not dependent on the
kinds of teacher background indicators incorporated in most existing studies.
The teaching segment (TS) summaries are taken from the classroom observa-
tions. Since the segments add up to 100 per cent they are interpreted in much the
same way as a group of categorical variables for race or school type. The coefficient
for each included segment (Question–Answer, etc.) is interpreted in relation to the
excluded category (Student Seatwork). These are not 0–1 measures corresponding
to the predominant overall strategy employed in the observed class. They are instead
linear measures corresponding to the percentage of the lesson that was spent in each
instructional activity. So each point estimate is interpreted as the change in maths
achievement given a standard deviation increase in this activity relative to seatwork.
Finally, the school level controls (S) include a measure for class size, average
parental education and state dummies (fixed effects); these help improve the causal
properties of the model overall by controlling for things that may be related to the
distribution of teachers across these communities.
Before estimating the final models we had to deal with missing data. Only about
80 of the roughly 900 students with 2001 and 2002 test score data are missing
individual or teacher background information like parental education, attendance
frequency and teacher experience. But the questionnaires measuring teacher content
and specialised teaching knowledge have more missing data. The available student
sample is reduced by about 150 cases (or 17 per cent of the total) after matching
students with their teacher’s mathematics knowledge; this corresponds to losing
roughly 20 of the original 90 teachers (or 22 per cent of the teachers). Also, there is
another group of roughly 20 teachers for whom we have teacher mathematics data
but incomplete observation data; this corresponds to another 150 students.
We considered three options for handling missing data. Our preferred approach
matched students with teachers for the teacher mathematics knowledge data, but
computed school averages for the classroom observations to fill in for missing
observation data. This resulted in roughly 70 teachers and 700 students, or roughly
85 per cent of the original sample for whom complete student data were available.
The effects of teacher mathematics knowledge and pedagogy 187
123
We also weighted the data for non-response, although the response function shows
no significant student or school background predictors of having missing data.
Results
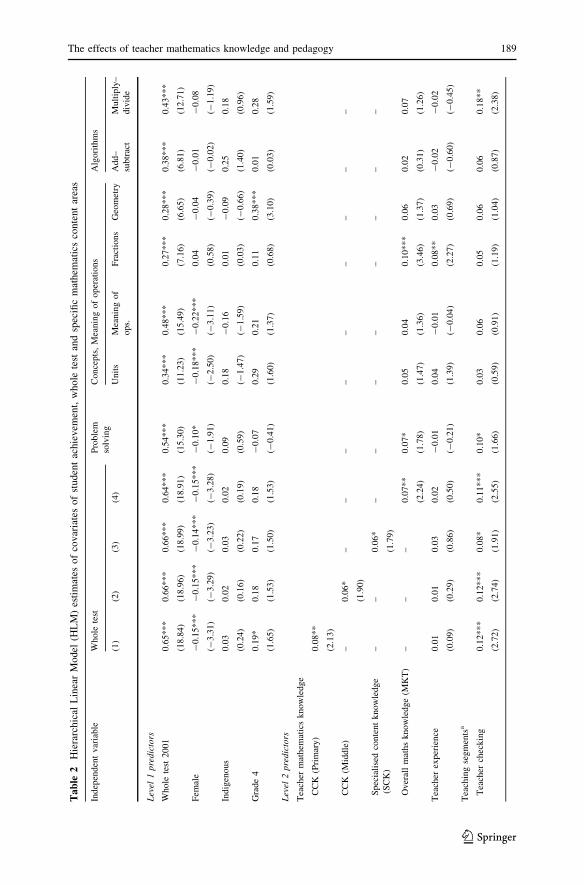
Table 2 presents the results for the HLM analyses of student achievement. The
coefficients for continuous variables measure one standard deviation changes.
Additional variables that are not presented include controls for student attendance,
parental education and state-fixed effects (see notes underneath Table 2). As
expected, the overall score on the 2001 maths test is a very significant predictor of
the overall and content area-specific mathematics outcomes in 2002, with
standardised effects of upwards of 0.66 standard deviations. Girls score significantly
lower than boys on the overall test, although the differences are concentrated in only
three areas: problem solving, measurement, and meaning of operations. Grade four
students score moderately higher than their grade three counterparts. Part of this
advantage is curriculum-related, since concepts like division are usually introduced
in grade four. One surprise is that indigenous student scores are not significantly
different from Spanish-only speakers (ladinos) when controlling for background,
learning context and incoming scores. This does not mean that their achievement
levels are the same – indigenous students score lower – and it should also be noted
that the sample does not include urban areas where most ladino children reside.
For the overall test score, the teacher mathematics knowledge measures are
introduced one by one (Table 2, columns 1–4). The results show that both of the
level-specific common content knowledge (CCK) measures (primary and middle),
as well as the specialised content knowledge measure (SCK), are significantly
associated with student achievement. The standardised effect sizes are only about
0.05–0.08 standard deviations, although with the control for 2001 achievement the
parameters are measuring a form of learning gain.13 The most significant predictor
is for the overall teacher mathematics knowledge for teaching (MKT) measure that
combines the common and specialised knowledge forms. Interestingly, the effect
size for this variable is almost identical to what Hill et al. (2005) encountered in
their study using a similar measure in United States primary schools.
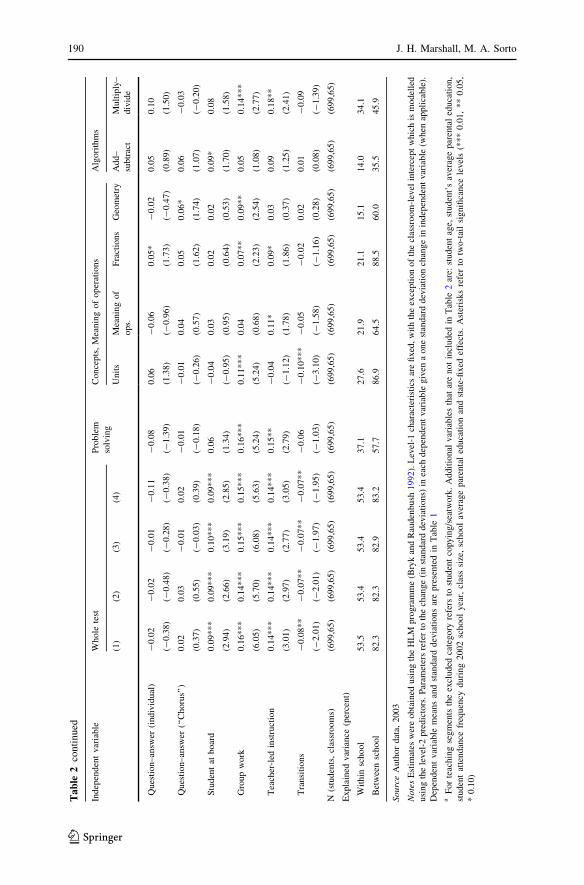
For the remaining content-area specific estimations in Table 2 we use this overall
measure of the teacher’s mathematics knowledge for teaching (MKT). The point
estimates are positive for each of the seven content areas, although only significant
in problem solving (moderately) and fractions. Overall, these results provide some
empirical support for a widely held, if infrequently tested, belief in mathematics
education: effective teachers have different kinds of mathematical knowledge.
However, we can only speculate about the underlying teaching mechanisms that
link mathematics knowledge with higher student test scores, in part because of the
lack of correlation between the teaching segment data and teacher background (we
13 In other estimations (not presented) we computed gain scores subtracting the 2001 raw percentage
correct from the IRT-scaled percentage correct in 2002. The results are nearly identical, but do show
moderately larger effect sizes for the estimations using teacher knowledge (columns 1–4 in Table 2).
188 J. H. Marshall, M. A. Sorto
123
Ta
ble
2H
iera
rch
ical
Lin
ear
Mo
del
(HL
M)
esti
mat
eso
fco
var
iate
so
fst
ud
ent
achie
vem
ent,
wh
ole
test
and
spec
ific
mat
hem
atic
sco
nte
nt
area
s
Indep
enden
tvar
iable
Whole
test
Pro
ble
m
solv
ing
Conce
pts
,M
eanin
gof
oper
atio
ns
Alg
ori
thm
s
(1)
(2)
(3)
(4)
Unit
sM
eanin
gof
ops.
Fra
ctio
ns
Geo
met
ryA
dd–
subtr
act
Mult
iply
–
div
ide
Lev
el1
pre
dic
tors
Whole
test
2001
0.6
5***
(18.8
4)
0.6
6***
(18.9
6)
0.6
6***
(18.9
9)
0.6
4***
(18.9
1)
0.5
4***
(15.3
0)
0.3
4***
(11.2
3)
0.4
8***
(15.4
9)
0.2
7***
(7.1
6)
0.2
8***
(6.6
5)
0.3
8***
(6.8
1)
0.4
3***
(12.7
1)
Fem
ale
-0.1
5***
(-3.3
1)
-0.1
5***
(-3.2
9)
-0.1
4***
(-3.2
3)
-0.1
5***
(-3.2
8)
-0.1
0*
(-1.9
1)
-0.1
8***
(-2.5
0)
-0.2
2***
(-3.1
1)
0.0
4
(0.5
8)
-0.0
4
(-0.3
9)
-0.0
1
(-0.0
2)
-0.0
8
(-1.1
9)
Indig
enous
0.0
3
(0.2
4)
0.0
2
(0.1
6)
0.0
3
(0.2
2)
0.0
2
(0.1
9)
0.0
9
(0.5
9)
0.1
8
(-1.4
7)
-0.1
6
(-1.5
9)
0.0
1
(0.0
3)
-0.0
9
(-0.6
6)
0.2
5
(1.4
0)
0.1
8
(0.9
6)
Gra
de
40.1
9*
(1.6
5)
0.1
8
(1.5
3)
0.1
7
(1.5
0)
0.1
8
(1.5
3)
-0.0
7
(-0.4
1)
0.2
9
(1.6
0)
0.2
1
(1.3
7)
0.1
1
(0.6
8)
0.3
8***
(3.1
0)
0.0
1
(0.0
3)
0.2
8
(1.5
9)
Lev
el2
pre
dic
tors
Tea
cher
mat
hem
atic
sknow
ledge
CC
K(P
rim
ary)
0.0
8**
(2.1
3)
CC
K(M
iddle
)–
0.0
6*
(1.9
0)
––
––
––
––
–
Spec
iali
sed
conte
nt
know
ledge
(SC
K)
––
0.0
6*
(1.7
9)
––
––
––
––
Over
all
mat
hs
know
ledge
(MK
T)
––
–0.0
7**
(2.2
4)
0.0
7*
(1.7
8)
0.0
5
(1.4
7)
0.0
4
(1.3
6)
0.1
0***
(3.4
6)
0.0
6
(1.3
7)
0.0
2
(0.3
1)
0.0
7
(1.2
6)
Tea
cher
exper
ience
0.0
1
(0.0
9)
0.0
1
(0.2
9)
0.0
3
(0.8
6)
0.0
2
(0.5
0)
-0.0
1
(-0.2
1)
0.0
4
(1.3
9)
-0.0
1
(-0.0
4)
0.0
8**
(2.2
7)
0.0
3
(0.6
9)
-0.0
2
(-0.6
0)
-0.0
2
(-0.4
5)
Tea
chin
gse
gm
ents
a
Tea
cher
chec
kin
g0.1
2***
(2.7
2)
0.1
2***
(2.7
4)
0.0
8*
(1.9
1)
0.1
1***
(2.5
5)
0.1
0*
(1.6
6)
0.0
3
(0.5
9)
0.0
6
(0.9
1)
0.0
5
(1.1
9)
0.0
6
(1.0
4)
0.0
6
(0.8
7)
0.1
8**
(2.3
8)
The effects of teacher mathematics knowledge and pedagogy 189
123
Ta
ble
2co
nti
nu
ed
Indep
enden
tvar
iable
Whole
test
Pro
ble
m
solv
ing
Conce
pts
,M
eanin
gof
oper
atio
ns
Alg
ori
thm
s
(1)
(2)
(3)
(4)
Unit
sM
eanin
gof
ops.
Fra
ctio
ns
Geo
met
ryA
dd–
subtr
act
Mult
iply
–
div
ide
Ques
tion–an
swer
(indiv
idual
)-
0.0
2
(-0.3
8)
-0.0
2
(-0.4
8)
-0.0
1
(-0.2
8)
-0.1
1
(-0.3
8)
-0.0
8
(-1.3
9)
0.0
6
(1.3
8)
-0.0
6
(-0.9
6)
0.0
5*
(1.7
3)
-0.0
2
(-0.4
7)
0.0
5
(0.8
9)
0.1
0
(1.5
0)
Ques
tion–an
swer
(‘‘C
horu
s’’)
0.0
2
(0.3
7)
0.0
3
(0.5
5)
-0.0
1
(-0.0
3)
0.0
2
(0.3
9)
-0.0
1
(-0.1
8)
-0.0
1
(-0.2
6)
0.0
4
(0.5
7)
0.0
5
(1.6
2)
0.0
6*
(1.7
4)
0.0
6
(1.0
7)
-0.0
3
(-0.2
0)
Stu
den
tat
boar
d0.0
9***
(2.9
4)
0.0
9***
(2.6
6)
0.1
0***
(3.1
9)
0.0
9***
(2.8
5)
0.0
6
(1.3
4)
-0.0
4
(-0.9
5)
0.0
3
(0.9
5)
0.0
2
(0.6
4)
0.0
2
(0.5
3)
0.0
9*
(1.7
0)
0.0
8
(1.5
8)
Gro
up
work
0.1
6***
(6.0
5)
0.1
4***
(5.7
0)
0.1
5***
(6.0
8)
0.1
5***
(5.6
3)
0.1
6***
(5.2
4)
0.1
1***
(5.2
4)
0.0
4
(0.6
8)
0.0
7**
(2.2
3)
0.0
9**
(2.5
4)
0.0
5
(1.0
8)
0.1
4***
(2.7
7)
Tea
cher
-led
inst
ruct
ion
0.1
4***
(3.0
1)
0.1
4***
(2.9
7)
0.1
4***
(2.7
7)
0.1
4***
(3.0
5)
0.1
5**
(2.7
9)
-0.0
4
(-1.1
2)
0.1
1*
(1.7
8)
0.0
9*
(1.8
6)
0.0
3
(0.3
7)
0.0
9
(1.2
5)
0.1
8**
(2.4
1)
Tra
nsi
tions
-0.0
8**
(-2.0
1)
-0.0
7**
(-2.0
1)
-0.0
7**
(-1.9
7)
-0.0
7**
(-1.9
5)
-0.0
6
(-1.0
3)
-0.1
0***
(-3.1
0)
-0.0
5
(-1.5
8)
-0.0
2
(-1.1
6)
0.0
2
(0.2
8)
0.0
1
(0.0
8)
-0.0
9
(-1.3
9)
N(s
tuden
ts,
clas
sroom
s)(6
99,6
5)
(699,6
5)
(699,6
5)
(699,6
5)
(699,6
5)
(699,6
5)
(699,6
5)
(699,6
5)
(699,6
5)
(699,6
5)
(699,6
5)
Expla
ined
var
iance
(per
cent)
Wit
hin
school
53.5
53.4
53.4
53.4
37.1
27.6
21.9
21.1
15.1
14.0
34.1
Bet
wee
nsc
hool
82.3
82.3
82.9
83.2
57.7
86.9
64.5
88.5
60.0
35.5
45.9
Sourc
eA
uth
or
dat
a,2003
Note
sE
stim
ates
wer
eobta
ined
usi
ng
the
HL
Mpro
gra
mm
e(B
ryk
and
Rau
den
bush
1992
).L
evel
-1ch
arac
teri
stic
sar
efi
xed
,w
ith
the
exce
pti
on
of
the
clas
sroom
-lev
elin
terc
ept
whic
his
model
led
usi
ng
the
level
-2pre
dic
tors
.P
aram
eter
sre
fer
toth
ech
ange
(in
stan
dar
ddev
iati
ons)
inea
chdep
enden
tvar
iable
giv
ena
one
stan
dar
ddev
iati
on
chan
ge
inin
dep
enden
tvar
iable
(when
appli
cable
).
Dep
enden
tvar
iable
mea
ns
and
stan
dar
ddev
iati
ons
are
pre
sente
din
Tab
le1
aF
or
teac
hin
gse
gm
ents
the
excl
uded
cate
gory
refe
rsto
studen
tco
pyin
g/s
eatw
ork
.A
ddit
ional
var
iable
sth
atar
enot
incl
uded
inT
able
2ar
e:st
uden
tag
e,st
uden
t’s
aver
age
par
enta
led
uca
tion,
studen
tat
tendan
cefr
equen
cyduri
ng
2002
school
yea
r,cl
ass
size
,sc
hool
aver
age
par
enta
led
uca
tion
and
stat
e-fi
xed
effe
cts.
Ast
eris
ks
refe
rto
two-t
ail
signifi
cance
level
s(*
**
0.0
1,
**
0.0
5,
*0.1
0)
190 J. H. Marshall, M. A. Sorto
123
return to this below). One interesting clue is that the teacher’s overall mathematics
knowledge for teaching is most significant in areas of the student test that have the
highest levels of cognitive demand. For example, even at primary level problem
solving requires students to put together different aspects of mathematics, and
fractions is one of the more difficult concepts in mathematics because effective
teaching requires linking the algorithms with conceptual meaning.
The time segment summaries come next in Table 2. Most of the coefficients are
positive in relation to the excluded category made up of copying/seatwork. This
result largely confirms our expectation that the least effective schools are those
where student copying and individual seatwork appear to predominate. One problem
with this activity, at least as we have observed its use in places like rural Guatemala,
is that it is often inefficient. Seatwork segments can drag on while the teacher waits
for slower children, and even then it is not unusual for some students to be far
behind at the end. This is exacerbated by the fact that seatwork routines in these
classes are often disconnected from the rest of the lesson. For example, they are
infrequently followed up by intensive and effective discussion activities.
One unexpected result is the general lack of significance for the two forms of
question and answer activities. This segment is marked by the teacher going around
the room asking individual or whole class (chorus) questions, usually in simple yes/
no or basic operations (‘‘two plus two equals?’’) format. One explanation is that the
kinds of recitation activities that take place between students and teachers in these
schools involve very limited cognitive content (Vygotsky 1978). Teachers rarely
challenge students to explain their answers, or make connections with other
elements of mathematics.
This take on the question and answer segment results is indirectly supported by
the positive effects on achievement when students spend more time solving
problems at the blackboard, or engaging in group work. Work at the board provides
opportunities for individual tutoring, and it also provides immediate feedback (see
Marshall et al. 2009 for a similar result from Cambodia). When the student ‘‘gets it
right’’ it builds confidence that helps overall performance. Furthermore, this
segment suggests more actively engaged teachers who are interacting with students
in very specific dimensions. Group work also provides students with opportunities
to have direct interaction with others. In the area of problem solving this is likely to
be especially important, since listening and talking to other students makes it easier
to see different ways to solve problems, and also allows for practising multiple
strategies.
Students studying in classrooms marked by more direct instruction also score
significantly higher overall, and in most of the specific content areas. Observing
direct instruction combining explanations with actual activities is likely to be more
productive than just letting students work on problems alone. Also, the teacher’s use
of this particular activity may be based in part on a better preparation of the lesson,
meaning a more detailed lesson plan. In contrast, teachers who rely more on
seatwork may have less teaching content planned for the lesson.
The results for the time segment summaries show that even relatively simple
observational data on teaching actions can provide some useful insight into
questions related to teacher effectiveness. The effect sizes for the various categories
The effects of teacher mathematics knowledge and pedagogy 191
123

are generally in 0.10–0.15 standardised range, which is substantially higher than the
mathematics knowledge measures. Also, the results are robust to the inclusion of
controls for teacher education (not included in Table 2), experience and commu-
nity-level measures of parental education, etc.
Overall, the results in Table 2 provide an unusually detailed accounting of
specific teacher and teaching characteristics that are associated with higher student
maths scores, both overall and by content area. But our interest in the effects of
teacher mathematics knowledge on student achievement warranted a still more
detailed examination of the data. We therefore re-estimated the content area-specific
models in Table 2 by replacing the teachers’ overall mathematics knowledge for
teaching (MTK) scores with each of the individual knowledge measures, including
the three specialised teaching activities that make up the SCK construct. The
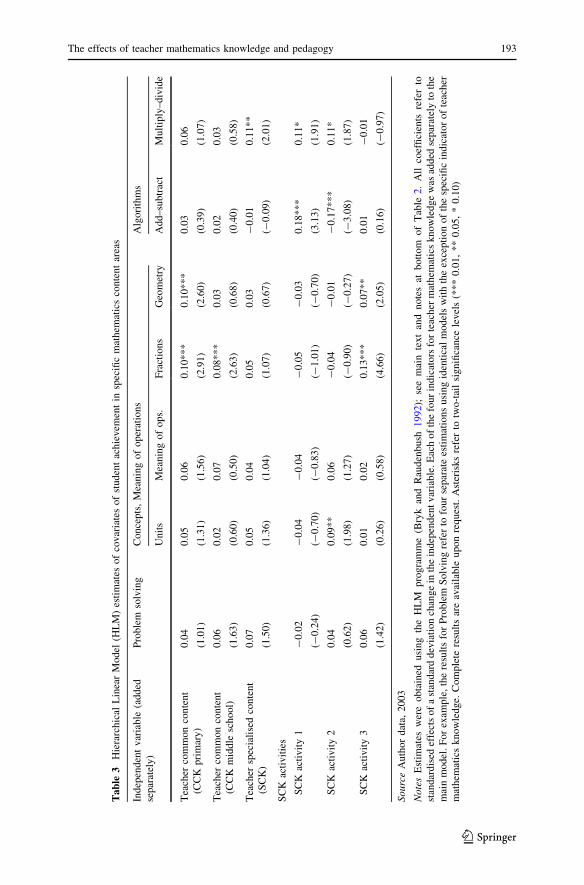
condensed results are presented in Table 3. For the teacher’s common content
knowledge (CCK) the results add little to the earlier findings from Table 2. One
exception is for the area of geometry, which is strongly associated with the teacher’s
CCK at the primary school level.
For the overall SCK measure, the coefficients are generally positive but only
significant in the Multiplication-Division algorithm content area. This is a notable
finding, however, because the SCK activities completed by teachers included a
focus on operations for multiplication and division. As a result it is not surprising
that the SCK construct appears to be most closely related to student achievement in
this particular content area. This finding provides some additional justification for
analysing mathematics achievement by content area. It also highlights the need to
continue developing specialised measures of teacher knowledge and attempting to
link these with student achievement outcomes in those same content areas. With
only a handful of teacher SCK questions, our ability in this study to make those
kinds of specific connections is constrained. But as more and more researchers
develop teacher knowledge items – and make them publicly available – future
research should be able to build considerably on these kinds of initial findings.
Discussion and conclusions
In this paper we use data from rural Guatemala to analyse the effects of teachers on
student mathematics achievement. We are able to shed some light on questions that
motivate mathematics policy discussions around the globe, such as the importance
of different forms of teacher mathematical knowledge, and the effects of pedagogy
on student learning. For policymakers (and teachers) in general the results are
encouraging because they suggest specific mechanisms by which effective teachers
can make substantial impacts on student learning, even in extremely poor contexts.
Our results linking higher levels of teacher mathematics knowledge with higher
student test scores provide empirical support for a proposition that makes intuitive
sense, but has been tested in relatively few instances. The content knowledge results
highlight both the imperative of guaranteeing minimum levels of teacher preparation
(Santibanez 2006) as well as the potential for primary school teachers to apply higher
level content skills in their teaching. The significant effects of the teacher’s
192 J. H. Marshall, M. A. Sorto
123
Tab
le3
Hie
rarc
hic
alL
inea
rM
odel
(HL
M)
esti
mat
esof
covar
iate
sof
studen
tac
hie
vem
ent
insp
ecifi
cm
athem
atic
sco
nte
nt
area
s
Ind
epen
den
tv
aria
ble
(add
ed
sep
arat
ely
)
Pro
ble
mso
lvin
gC
once
pts
,M
eanin
gof
oper
atio
ns
Alg
ori
thm
s
Unit
sM
eanin
gof
ops.
Fra
ctio
ns
Geo
met
ryA
dd–su
btr
act
Mult
iply
–div
ide
Tea
cher
com
mon
con
ten
t
(CC
Kp
rim
ary
)
0.0
4
(1.0
1)
0.0
5
(1.3
1)
0.0
6
(1.5
6)
0.1
0*
**
(2.9
1)
0.1
0*
**
(2.6
0)
0.0
3
(0.3
9)
0.0
6
(1.0
7)
Tea
cher
com
mon
con
ten
t
(CC
Km
idd
lesc
ho
ol)
0.0
6
(1.6
3)
0.0
2
(0.6
0)
0.0
7
(0.5
0)
0.0
8*
**
(2.6
3)
0.0
3
(0.6
8)
0.0
2
(0.4
0)
0.0
3
(0.5
8)
Tea
cher
spec
iali
sed
conte
nt
(SC
K)
0.0
7
(1.5
0)
0.0
5
(1.3
6)
0.0
4
(1.0
4)
0.0
5
(1.0
7)
0.0
3
(0.6
7)
-0
.01
(-0
.09)
0.1
1*
*
(2.0
1)
SC
Kac
tivit
ies
SC
Kac
tivit
y1
-0
.02
(-0
.24)
-0
.04
(-0
.70)
-0
.04
(-0
.83)
-0
.05
(-1
.01)
-0
.03
(-0
.70
)
0.1
8*
**
(3.1
3)
0.1
1*
(1.9
1)
SC
Kac
tivit
y2
0.0
4
(0.6
2)
0.0
9*
*
(1.9
8)
0.0
6
(1.2
7)
-0
.04
(-0
.90)
-0
.01
(-0
.27
)
-0
.17
**
*
(-3
.08)
0.1
1*
(1.8
7)
SC
Kac
tivit
y3
0.0
6
(1.4
2)
0.0
1
(0.2
6)
0.0
2
(0.5
8)
0.1
3*
**
(4.6
6)
0.0
7*
*
(2.0
5)
0.0
1
(0.1
6)
-0
.01
(-0
.97)
So
urc
eA
uth
or
dat
a,2
00
3
Not
esE
stim
ates
wer
eobta
ined
usi
ng
the
HL
Mpro
gra
mm
e(B
ryk
and
Rau
den
bush
19
92);
see
mai
nte
xt
and
no
tes
atb
ott
om
of
Tab
le2.
All
coef
fici
ents
refe
rto
stan
dar
dis
edef
fect
so
fa
stan
dar
dd
evia
tio
nch
ang
ein
the
ind
epen
den
tv
aria
ble
.E
ach
of
the
fou
rin
dic
ato
rsfo
rte
ach
erm
ath
emat
ics
kn
ow
led
ge
was
added
separ
atel
yto
the
mai
nm
od
el.
Fo
rex
amp
le,
the
resu
lts
for
Pro
ble
mS
olv
ing
refe
rto
fou
rse
par
ate
esti
mat
ion
su
sin
gid
enti
cal
mod
els
wit
hth
eex
cep
tio
no
fth
esp
ecifi
cin
dic
ato
ro
fte
ach
er
mat
hem
atic
sk
no
wle
dge.
Co
mp
lete
resu
lts
are
avai
lab
leu
po
nre
qu
est.
Ast
eris
ks
refe
rto
two
-tai
lsi
gn
ifica
nce
lev
els
(**
*0
.01
,*
*0
.05,
*0
.10)
The effects of teacher mathematics knowledge and pedagogy 193
123

specialised content knowledge (SCK) on overall student achievement gains, as well
as more specific connections within individual content areas, provide tentative
support for the teaching knowledge concept prized by many mathematics education
researchers.
Does one form of teacher knowledge matter more than the other? Given some
partial overlap between the common content and specialised knowledge domains,
and the specificity of some results by content area, this question is impossible to
answer based on these data (see Baumert et al. 2010). Besides, we are reluctant to
treat the content and specialised knowledge elements as competing modes of
understanding teacher effectiveness, or distinct training approaches. In reality they
both play an important role in preparing teachers for the classroom, a position
echoed in a 2005 article by a group of prominent mathematicians and mathematics
education researchers (Ball et al. 2005).
This study also extends the research base on teacher quality by examining the
effects of actual teaching activities. Using observational data on mathematics
classes we find that student maths scores are lower in schools where more time is
spent copying and solving problems individually. Given the apparent predominance
of this activity in areas such as rural Guatemala this gives cause for concern, since at
least some students are likely to fall behind when the seatwork activities are not
followed up by careful review and recitation. The more productive activities instead
seem to be those that are more certain to engage students in the learning process.
These include direct lecture, sending students to the blackboard, and having them
work in groups.
One of the challenges for studies such as this one is to understand the underlying
dynamics that help explain why some teachers appear to be more effective than
others. Compared with the data linking student test scores with teachers, our
information is less complete on this count, although we do provide more detailed
statistical analyses elsewhere.14 Three results stand out. First, the teachers’
specialised content knowledge in mathematics is significantly correlated with their
common content knowledge (r = 0.40). This confirms the relevance of content
knowledge in understanding specialised knowledge, but it is not the case that one is
a substitute for the other. Second, there is almost no correlation between any of the
teacher mathematics knowledge indicators and the observed pedagogical choices
(time segments). This is an important reminder that teacher actions in the classroom
are not automatically determined by capacity. Finally, there is some evidence that
teachers’ access to university courses is associated with higher levels of common
and specialised content knowledge in mathematics. This supports ongoing efforts in
countries like Guatemala to upgrade teacher training levels.
Future research can build on these results by adapting more comprehensive
observation protocols to measure pedagogical choices in the classroom (Sorto et al.
2009; Hill et al. 2008b; Learning Mathematics for Teaching 2006). Our results
suggest that teachers with higher levels of mathematical knowledge are more
effective in the classroom. But the actual teaching mechanisms – if they do exist –
were not identifiable with our observation instruments. Ideally this kind of
14 On this count; results from more detailed statistical analyses are available upon request.
194 J. H. Marshall, M. A. Sorto
123
information will be linked with student achievement results in different content
areas, which is another improvement in our study design compared with most other
studies of mathematics test scores.
References
Anderson, J. B. (2008). Principals’ role and public primary schools’ effectiveness in four Latin American
cities. The Elementary School Journal, 109(1), 36–60.
Ball, D. L., & Bass, H. (2000). Interweaving content and pedagogy in teaching and learning to teach:
Knowing and using mathematics. In J. Boaler (Ed.), Multiple perspectives on the teaching andlearning of mathematics. Westport, CT: Ablex.
Ball, D. L., Hill, H. C., & Bass, H. (2005). Knowing mathematics for teaching: Who knows mathematics
well enough to teach third grade, and how can we decide? American Educator, 2005 (Fall), 14–22.
Baumert, J., Kunter, M., Blum, W., Brunner, M., Voss, T., Jordan, A., et al. (2010). Teachers’
mathematical knowledge, cognitive activation in the classroom, and student progress. AmericanEducational Research Journal, 47(1), 133–180.
Boero, P., Dapueto, C., & Parenty, L. (1996). Didactics of mathematics and the professional knowledge
of teachers. In A. J. Bishop, M. A. Clements, C. Keitel, J. Patrick, & F. K. S. Leung (Eds.),
International handbook of mathematics education (pp. 1097–1121). Dordrecht: Kluwer.
Borko, H., Eisenhart, M., Brown, C. A., Underhill, R. G., Jones, D., & Agard, P. C. (1992). Learning to
teach hard mathematics: Do novice teachers and their instructors give up too easily? Journal forResearch in Mathematics Education, 23, 194–222.
Bryk, A. S., & Raudenbush, S. (1992). Hierarchical linear models: Applications and data analysismethods. Thousand Oaks, CA: Sage Publications.
Carnoy, M., Gove, A., & Marshall, J. H. (2007). Cuba’s academic advantage: Why students in Cuba dobetter in school. Stanford, CA: Stanford University Press.
Carroll, J. B. (1963). A model of school learning. Teachers College Record, 64, 723–733.
Cartwright, F. (2010). Item and test analysis: A software tutorial and theoretical introduction. Accessed
May 2011 from http://polymetrika.com/IATA/.Conference Board of the Mathematical Sciences. (2001). The mathematical education of teachers.
Providence, RI and Washington, DC: American Mathematical Society and Mathematical
Association of America.
Crocker, L., & Algina, J. (1986). Introduction to classical and modern test theory. Belmont, CA:
Wadsworth Group/Thomson Learning.
Eisenhart, M., Borko, H., Underhill, R. G., Brown, M., Jones, D., & Agard, P. C. (1993). Conceptual
knowledge falls through the cracks: Complexities of learning to teach mathematics for
understanding. Journal for Research in Mathematics Education, 24, 8–40.
Fuller, B., & Clarke, P. (1994). Raising school effects while ignoring culture? Local conditions and the
influence of classroom tools, rules and pedagogy. Review of Educational Research, 64, 119–157.
Grossman, P. L. (1990). The making of a teacher. Teacher knowledge and teacher education. New York:
Teachers College Press.
Harbison, R., & Hanushek, E. A. (1992). Educational performance of the poor: Lessons from ruralnortheast Brazil. New York: Oxford University Press.
Hill, H. C., & Ball, D. L. (2004). Learning mathematics for teaching: Results from California’s
mathematics professional development institutes. Journal for Research in Mathematics Education,35(5), 330–351.
Hill, H. C., Ball, D. L., & Schilling, S. G. (2008a). Unpacking pedagogical content knowledge:
Conceptualizing and measuring teachers’ topic-specific knowledge of students. Journal forResearch in Mathematics Education, 39(4), 372–400.
Hill, H. C., Blunk, M. L., Charalambous, Y. C., Lewis, J. M., Phelps, G. C., Sleep, L., et al. (2008b).
Mathematical knowledge for teaching and the mathematical quality of instruction: An exploratory
study. Cognition and Instruction, 26, 430–511.
Hill, H. C., Rowan, B., & Ball, D. L. (2005). Effects of teachers’ mathematical knowledge for teaching on
student achievement. American Educational Research Journal, 42, 371–406.
The effects of teacher mathematics knowledge and pedagogy 195
123
Hill, H. C., Schilling, S. G., & Ball, D. L. (2004). Developing measures of teachers’ mathematical
knowledge for teaching. Elementary School Journal, 105, 11–30.
Hill, H. C., Sleep, L., Lewis, J. M., & Ball, L. B. (2007). Second handbook of research on mathematics
teaching and learning. In F. K. Lester (Ed.), Assessing teachers’ mathematical knowledge. Whatknowledge matters and what evidence counts? (pp. 111–155). Reston, VA: National Council of
Teachers of Mathematics.
Learning Mathematics for Teaching (LMT). (2006). A Coding rubric for measuring the quality ofmathematics in instruction, Tech. Rep. LMT1.06. University of Michigan, School of Education, Ann
Arbor, MI.
Marshall, J. H. (2003). If you build it will they come? The effects of school quality on primary schoolattendance in rural Guatemala. Doctoral dissertation, Stanford University School of Education.
Marshall, J. H. (2009). School quality and learning gains in rural Guatemala. Economics of EducationReview, 28(2), 207–216.
Marshall, J. H., Chinna, U., Nessay, P., Hok, U. N., Savoeun, V., Tinon, S., et al. (2009). Student
achievement and education policy in a period of rapid expansion: Assessment data evidence from
Cambodia. International Review of Education, 55(4), 393–413.
Marshall, J. H., & White, K. A. (2001). Academic achievement, school attendance and teacher quality inHonduras: An empirical analysis. Tegucigalpa, Honduras: UMCE.
McEwan, P. J., & Trowbridge, M. (2007). The achievement of indigenous students in Guatemalan
primary schools. International Journal of Educational Development, 27, 61–76.
Mullens, J. E., Murnane, R. J., & Willett, J. B. (1996). The contribution of training and subject matter
knowledge to teaching effectiveness: A multilevel analysis of longitudinal evidence from Belize.
Comparative Education Review, 40, 139–157.
Passos, A., Nahara, T., Magaia, F., & Lauchande, C. (2005). The SACMEQ project II in Mozambique: Astudy of the conditions of schooling and the quality of education. Southern and Eastern Africa
Consortium for Monitoring Educational Quality (SACMEQ) and Ministry of Education and Culture,
Mozambique.
PREAL. (2008). Education: A challenge of national urgency. Partnership for Educational Revitalization
in the Americas and Center for National Economic Research (CIEN).
PRONERE. (2001). Informe de resultados del Programa Nacional de Evaluacion del RendimientoEscolar. Guatemala City: PRONERE.
Raudenbush, S., & Bryk, A. S. (1986). A hierarchical model for studying school effects. Sociology ofEducation, 59, 1–17.
Rizvi, M. (2008). The role of school principals in enhancing teacher professionalism: Lessons from
Pakistan. Educational Management Administration & Leadership, 36(1), 85–100.
Rockoff, J. E., Jacob, B. A., Kane, T. J., & Steiger, D. O. (2008). Can you recognize an effective teacherwhen you recruit one? National Bureau of Economic Research Working Paper 14485. NBER,
Cambridge, MA.
Santibanez, L. (2006). Why we should care if teachers get A’s: Teacher test scores and student
achievement in Mexico. Economics of Education Review, 25(5), 510–520.
Sargent, T., & Hannum, E. (2009). Doing more with less: Teacher professional learning communities in
resource-constrained primary schools in rural China. Journal of Teacher Education, 60(3), 258–276.
Seidel, T., & Shavelson, R. J. (2007). Teaching effectiveness research in the past decade: The role of
theory and research design in disentangling meta-analysis results. Review of Educational Research,77(4), 454–499.
Shulman, L. S. (1986). Those who understand: Knowledge growth in teaching. Educational Researcher,15, 4–14.
Sorto, M. A., Marshall, J. H., Luschei, T. F., & Carnoy, M. (2009). Teacher knowledge and teaching in
Panama and Costa Rica: A comparative study. Revista Latinamericana de Investigacion enMatematica Educativa, 12(2), 251–290.
Sorto, M. A., & Sapire, I. (2011). The teaching quality of mathematics lessons in South Africa schools.
Journal of Education, 51, 93–114.
Tatto, M. T., Schwille, J., Senk, S., Ingvarson, L., Peck, R., & Rowley, G. (2008). Teacher education anddevelopment study in mathematics (TEDS-M): Policy, practice, and readiness to teach primary andsecondary mathematics. Conceptual framework. East Lansing, MI: Teacher Education and
Development International Study Center, College of Education, Michigan State University.
UNESCO Institute for Statistics (UIS). (2007). World education indicators 2007. Montreal: UIS.
Accessed 15 June 2007 from www.unesco.org.
196 J. H. Marshall, M. A. Sorto
123
Unidad Externa de Medicion de la Calidad de la Educacion (UMCE). (2003). Factores asociados alrendimiento academico de los alumnos de la Educacion primaria en Honduras 2002. [Factors
associated with primary school academic achievement in Honduras 2002]. Published by UMCE
project. Tegucigalpa, Honduras.
United Nations Development Programme (UNDP). (2009). Human Development Report 2009. New
York: UNDP.
Vygotsky, L. S. (1978). Mind in society: The development of higher psychological processes, Translation.
M. Cole, V. John-Steiner, S. Scribner, & E. Souberman (Eds.). Cambridge, MA: Harvard University
Press.
Watson, J. M. (2001). Profiling teachers’ competence and confidence to teach particular mathematics
topics: The case of chance and data. Journal of Mathematics Teacher Educator, 4(4), 305–337.
Wayne, A. J., & Youngs, P. (2003). Teacher characteristics and student achievement gains: A review.
Review of Educational Research, 73(1), 89–122.
Wilson, S. M., & Wineburg, S. (1988). Peering at history through different lenses: The role of disciplinary
perspectives in teaching history. Teachers College Record, 89, 525–539.
World Bank. (2002). Project appraisal document (Guatemala). Washington, DC: World Bank.
The authors
Jeffery H. Marshall is a Visiting Researcher at the Instituto de Investigacion y Evaluacion Educativas y
Sociales (Institute of Educational and Social Research and Evaluation) at the Universidad Pedagogica
Nacional Francisco Morazan (Francisco Morazan National Teachers University) in Tegucigalpa,
Honduras, and Co-Director of Sapere Development Solutions. Dr Marshall holds a PhD in education from
Stanford University. His research interests are in education policy, programme evaluation, economics of
education and assessment.
M. Alejandra Sorto is an Associate Professor of Mathematics and Mathematics Education at Texas State
University. Dr Sorto holds a PhD in Mathematics Education from Michigan State University. Her
research interests include the development of instruments to assess teachers’ knowledge in mathematics
and statistics.
The effects of teacher mathematics knowledge and pedagogy 197
123