Embed Size (px)
Citation preview

THE EFFECT OF UREA INGESTION ON THE NITROGEN PARTITION OF THE URINE AT ENDOGENOUS
NITROGEN LEVEL
BY R. A. KOCHER AND HAROLD C. TORBERT
(From the Grace Deere Velie Metabolic Clinic, Carmel-by-the-Sea, California)
(Received for publication, November 6, 1931)
The possible utilization of urea as a partial substitute for protein in the diet of animals has been the subject of considerable experi- mentation. The results have, unfortunately, led to a variety of interpretations.
In recent experiments with the ingestion of large amounts of urea by normal human subjects, Moore, Lavietes, Wakeman, and Peters (1) were unable to recover all the urea nitrogen in the excreta. The subjects were first placed in nitrogen equilibrium, in two experiments with fairly high protein diet, in two other experiments in negative balance on low protein diets, and fed urea over a number of days. The ingested urea was not all recovered in the urine. These experiments gave no information concerning the fate of the retained nitrogen. A number of German investi- gators, Volts (2), Vijltz and associates (3), Honcamp et al. (4), and Hanson (5), have claimed retention and utilization of urea in experiments on animals; lambs, sheep, cows. Morgen and his associates (6) were unable to show that ingested urea could replace any part of the protein ration of sheep. Other experi- ments, carried out on humans, have been concerned with the diuretic effect of urea, or with its use as a measure of kidney function. Most of these experiments were performed on hospital subjects. The experiments of Cathcart and Green (7), as well as those of Addis and Watanabe (S), indicate that by far the greater percentage of urea ingested was recovered in the urine in the first 48 to 72 hours and in all probability would have been completely recovered had the experiments been sufficiently ex- tended. Thus far, the inconclusive results of the experiments
427
by guest on May 1, 2019
http://ww
w.jbc.org/
Dow
nloaded from

Urea Effect on Nitrogen Partition
directed to the determination of a possible retention or utilization of ingested urea, may be due to one or another of the following factors. (1) Other forms of nitrogen besides urea were fed daily in the diet in varying amounts so that their value was difficult to determine. (2) Th e analyses of the excreta were not sufficiently complete to furnish information as to the possible form and amounts of the various nitrogenous end-products. (3) The period of analysis was too short to insure complete re- covery of ingested urea. (4) Adequate methods were lacking for the determination of nitrogen loss from the skin. Moreover, in the experiments on ruminants there is some likelihood of bacteria participating in t.he breakdown of urea in the paunch with the consequent utilization of the nitrogen in some other form.
Plan of Experiments
The present experiments were planned to determine (1) whether there is any urea nitrogen retention by the normal human subject after ingestion of large amounts of urea when the subject is on a nitrogen-free diet and the nitrogen output is down to the so called minimum or wear and tear level; (2) what effect, if any, such urea ingestion might have on the nitrogen partition of the urine. The advantages of this method of approach to the problem of urea utilization are: (1) The subject at the time of urea ingestion is in a state of nitrogen hunger, a condition most favorable to utilization of any added nitrogen. (2) On such a diet, adequate in calories but practically nitrogen-free, the interpretation of the urinary output becomes of more definite significance. Any added nitrogenous constituent can be quantitatively traced in the urine without the confusing factor of a possible retention of dietary nitrogen or its replacement in the body tissues.
Experimental Procedure
The urine was collected directly in thoroughly cleaned flasks, in each of which were left 2 cc. of toluene. The flasks and urine with the one exception of the night specimen were kept in the ice box. The night specimen, kept cool, was placed in the ice box immediately on reaching the laboratory. Collections were made from 8 a.m. to 8 a.m. All analyses were made on the same day
by guest on May 1, 2019
http://ww
w.jbc.org/
Dow
nloaded from
R. A. Kocher and H. C. Torbert 429
the urine was collected with the exception of those for sulfur, which were made at the end of the period. Urines were made up to convenient volume, all rinsings being carefully preserved and mixed with the sample.
Blood was taken for non-protein nitrogen and urea determina- tion for 2 days before urea ingestion, 2 hours after ingestion of urea, and again every 24 hours until the original level was reached.
Feces were collected in three periods, transferred to 1:l sul- furic acid, and allowed to stand several days. Samples of the resulting uniform fine suspension were taken gravimetrically and total nitrogen determined by the macro-Kjeldahl procedure.
Nitrogen in the diet was determined as follows: The entire ingredients of 1 day’s diet, which was identical from day to day throughout the experiments, were carefully weighed and treated with 1: 1 sulfuric acid. This gave a thin soup of uniform sus- pension. Portions were taken gravimetrically for analyses by the macro-Kjeldahl method.
Urine pH was determined daily by the electrometric method wit’h the quinhydrone electrode.
Methods
Urine-Total nitrogen was determined by the usual Kjeldahl method. Urea nitrogen was estimated according to Youngburg’s modification of the Van Slyke and Cullen method, in which urine is diluted 1: 10, ammonia removed by shaking with permutit, urea hydrolyzed by urease solution and aerated into 0.02 N HCl. Ammonia was determined by the Van Slyke and Cullen method; creatinine by the method of Folin; uric acid by the Folin-Wu method; amino acid nitrogen by the Folin calorimetric method; and total sulfur by the Denis modification of the Benedict method.
Blood-The .non-protein nitrogen was determined by the method of Folin and Wu, and blood urea by Van Slyke and Cullen’s modification of Marshall’s method.
All analyses were made in duplicate and repeated when adequate checks were not obtained.
Subject R. A. K., age 47 years, male, was a physician in good health. This subject, who was on routine activity, was given a diet containing 3408 calories, which was practically nitrogen-free (0.378 gm. per 24 hours by analysis) except during the first 2 days when the N content was approxi-
by guest on May 1, 2019
http://ww
w.jbc.org/
Dow
nloaded from
Urea Effect on Nitrogen Partition
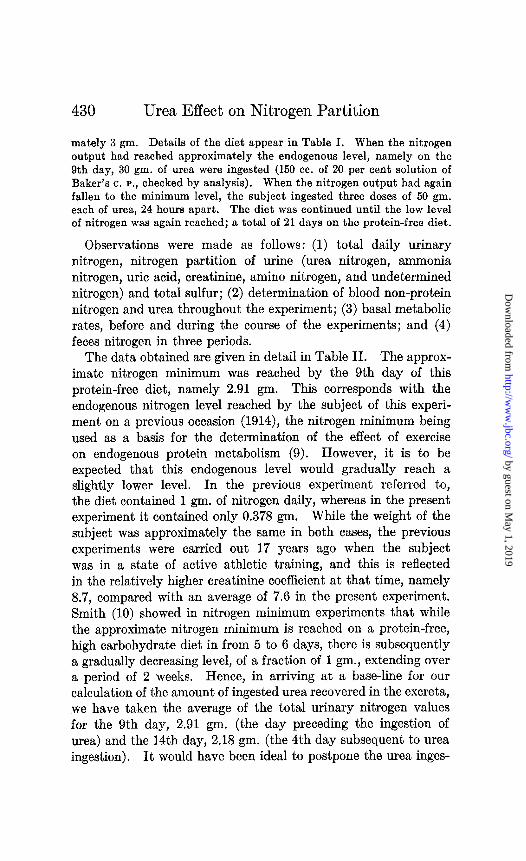
mately 3 gm. Details of the diet appear in Table I. When the nitrogen output had reached approximately the endogenous level, namely on the 9th day, 30 gm. of urea were ingested (150 cc. of 20 per cent solution of Baker’s c. P., checked by analysis). When the nitrogen output had again fallen to the minimum level, the subject ingested three doses of 50 gm. each of urea, 24 hours apart. The diet was continued until the low level of nitrogen was again reached; a total of 21 days on the protein-free diet.
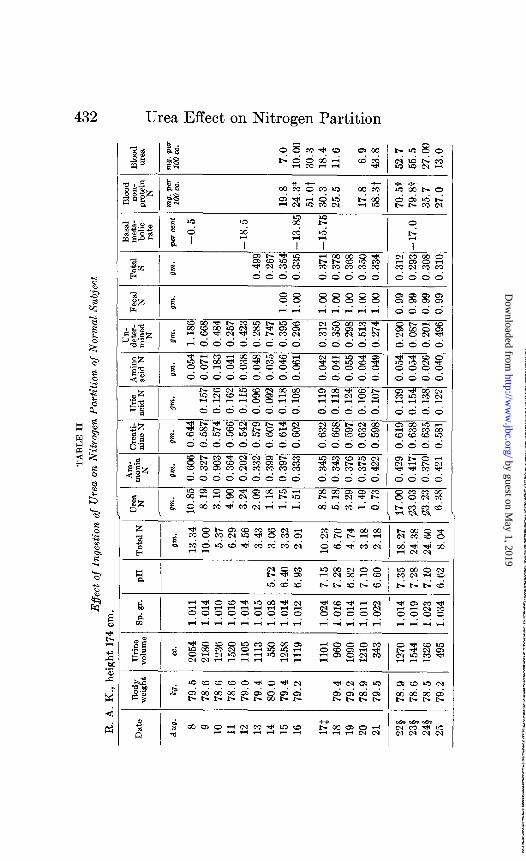
Observations were made as follows: (1) total daily urinary nitrogen, nitrogen partition of urine (urea nitrogen, ammonia nitrogen, uric acid, creatinine, amino nitrogen, and undetermined nitrogen) and total sulfur; (2) determination of blood non-protein nitrogen and urea throughout the experiment; (3) basal metabolic rates, before and during the course of the experiments; and (4) feces nitrogen in three periods.
The data obtained are given in detail in Table II. The approx- imate nitrogen minimum was reached by the 9th day of this protein-free diet, namely 2.91 gm. This corresponds with the endogenous nitrogen level reached by the subject of this experi- ment on a previous occasion (1914), the nitrogen minimum being used as a basis for the determination of the effect of exercise on endogenous protein metabolism (9). However, it is to be expected that this endogenous level would gradually reach a slightly lower level. In the previous experiment referred to, the diet contained 1 gm. of nitrogen daily, whereas in the present experiment it contained only 0.378 gm. While the weight of the subject was approximately the same in both cases, the previous experiments were carried out 17 years ago when the subject was in a state of active athletic training, and this is reflected in the relatively higher creatinine coefficient at that time, namely 8.7, compared with an average of 7.6 in the present experiment. Smith (10) showed in nitrogen minimum experiments that while the approximate nitrogen minimum is reached on a protein-free, high carbohydrate diet in from 5 to 6 days, there is subsequently a gradually decreasing level, of a fraction of 1 gm., extending over a period of 2 weeks. Hence, in arriving at a base-line for our calculation of the amount of ingested urea recovered in the excreta, we have taken the average of the total urinary nitrogen values for the 9th day, 2.91 gm. (the day preceding the ingestion of urea) and the 14th day, 2.18 gm. (the 4th day subsequent to urea ingestion). It would have been ideal to postpone the urea inges-
by guest on May 1, 2019
http://ww
w.jbc.org/
Dow
nloaded from
R. A. Kocher and H. C. Torbert 431
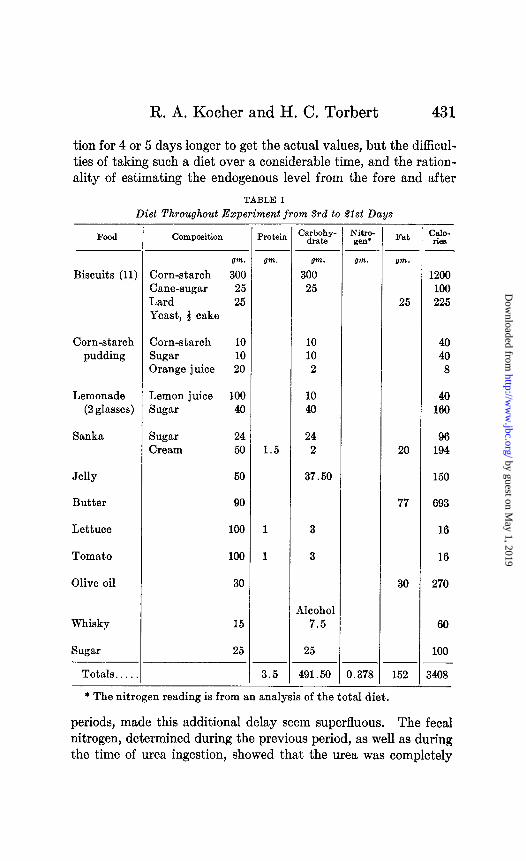
tion for 4 or 5 days longer to get the actual values, but the difficul- ties of taking such a diet over a considerable time, and the ration- ality of estimating the endogenous level from the fore and after
TABLE I
Diet Throughout Experiment from 3rd to Slst Days
Food
Biscuits (11)
Corn-starch pudding
Lemonade (2 glasses)
Sanka
Jelly
Butter
Lettuce
Tomato
Olive oil
Whisky
Sugar
Totals.. .
Composition
!F.
Corn-starch 300 Cane-sugar 25 Lard 25 Yeast, 4 cake
Corn-starch 10 Sugar 10
Orange juice 20
Lemon juice 100 Sugar 40
Sugar 24 Cream 50
50
25
Protein
gm.
1.5
1
1
3.5
c?i%iy- gm.
300 25
10 10 2
10 40
24 2
37.50
3
3
lllcohol 7.5
25
Nitro- gen’
gm.
0.378
-
-_
_-
- * The nitrogen reading is from an analysis of the total diet.
Fat
gm.
25
20
77
30
152 -
1200 100 225
40 40 8
40 160
96 194
150
693
16
16
270
60
100
1408
periods, made this additional delay seem superfluous. The fecal nitrogen, determined during the previous period, as well as during the time of urea ingestion, showed that the urea was completely
by guest on May 1, 2019
http://ww
w.jbc.org/
Dow
nloaded from
R.
A.
K.,
h ei
g tht
17
4 cm
.
Date
Bo
d .z
welg
t
Aug.
kg.
cc.
8 79
.5
2054
1.
011
9 78
.6
2180
1.
014
10
78.6
12
36
1.01
0 11
78
.6
1520
1.
016
12
79.0
11
05
1.01
4 13
79
.4
1113
1.
015
14
80.0
55
0 1.
018
15
79.4
12
58
1.01
4 16
79
.2
1119
1.
012
17$
18
19
20
21
79.4
79
.2
78.9
79
.5
1101
96
0 10
90
1210
34
3
1.02
4 1.
016
1.01
4 1.
011
1.02
2
22i
78.9
12
70
1.01
4
23s
78.6
15
44
1.01
9 24
8 78
.5
1326
1.
023
25
79.2
49
5 1.
034
-- --
TABL
E II
E#ec
t of
In
gesti
on
of
Urea
on
Ni
troge
n Pa
rtitio
n of
No
rmal
Subj
ect
Urine
VO
lWlX
-
SP.
gr.
PH
rota
1 h
gm.
5.72
6.
40
6.93
/ I I
.-
I
13.3
4 10
.00
5.37
6.
29
4.56
3.
43
3.06
3.
32
2.91
7.15
10
.23
7.28
6.
70
6.82
4.
74
7.10
3.
18
6.60
2.
18
7.35
18
.27
7.28
24
.38
7.10
24
.60
8.62
8.
04
_--~
---
gm.
gm.
gm.
gm.
pm.
gm.
sm.
10.8
5 0.
606
0.64
4 0.
054
1.18
6 8.
19
0.32
7 0.
587
0.15
7 0.
071
0.66
8 3.
10
0.90
3 0.
574
0.12
6 0.
183
0.48
4 4.
90
0.36
4 0.
566
0.16
2 0.
041
0.25
7 3.
24
0.20
2 0.
542
0.11
5 0.
038
0.42
3 2.
09
0.33
2 0.
579
0.09
6 0.
048
0.28
5 1.
18
0.39
9 0.
607
0.09
2 0.
035
0.74
7 1.
75
0.39
7 0.
614
0.11
8 0.
046
0.39
5 1.
00
1.51
0.
333
0.60
2 0.
108
0.06
1 0.
296
1.00
8.78
0.
345
0.63
2 0.
119
0.04
2 0.
312
1.00
5.
18
0.34
3 0.
668
0.11
8 0.
041
0.35
0 1.
00
3.29
0.
376
0.59
7 0.
124
0.05
5 0.
298
1.00
1.
49
0.37
5 0.
632
0.10
6 0.
064
0.51
3 1.
00
0.73
0.
422
0.59
8 0.
107
0.04
9 0.
274
1.00
_-
_----
17.0
0 0.
429
0.61
9 0.
139
0.05
4 0.
290
0.99
23
.03
0.41
7 0.
638
0.15
4 0.
054
0.08
7 0.
99
23.2
3 0.
370
0.63
5 0.
138
0.02
6 0.
201
0.99
6.
38
0.42
1 0.
581
0.12
2 0.
040
0.49
6 0.
99
Tota
l S gm.
0.49
! 0.
26:
0.35
i 0.
33!
0.37
: 0.
371
D. 3
61
D. 3
5(
0.33
0.31
: 0.
29:
0.30
2 D.
31(
Basa
l m
eta-
bo
lic
rate
per
cent
-0.5
-18.
5
-13.
8:
-15.
7:
-17.
0
Bloo
d no
n-
proI
?n
19.8
24
.3*
51.o
t 30
.3
25.5
17.8
58
.3t
70.5
t 52
.7
79.8
7 55
.5
35.7
27
.00
27.0
13
.0
6.9
43.8
5 B
by guest on May 1, 2019
http://ww
w.jbc.org/
Dow
nloaded from
26
79.5
27
80
.2
28
79.8
29
79
.3
486
1.03
5 6.
78
4.19
58
6 1.
026
6.75
3.
41
1287
1.
016
7.30
2.
97
1186
1.
013
7.00
2.
25
2.70
0.
335
0.54
7 0.
123
0.05
7 0.
428
0.99
0.
339
23.4
1.
79
0.39
5 0.
581
0.10
4 0.
035
0.50
5 0.
99
0.27
9 21
.8
1.52
0.
391
0.56
0 0.
125
0.08
9 0.
285
0.99
0.
306
19.4
0.
92
0.38
0 0.
544
0.11
1 0.
090
0.20
5 0.
99
0.26
4 18
.75
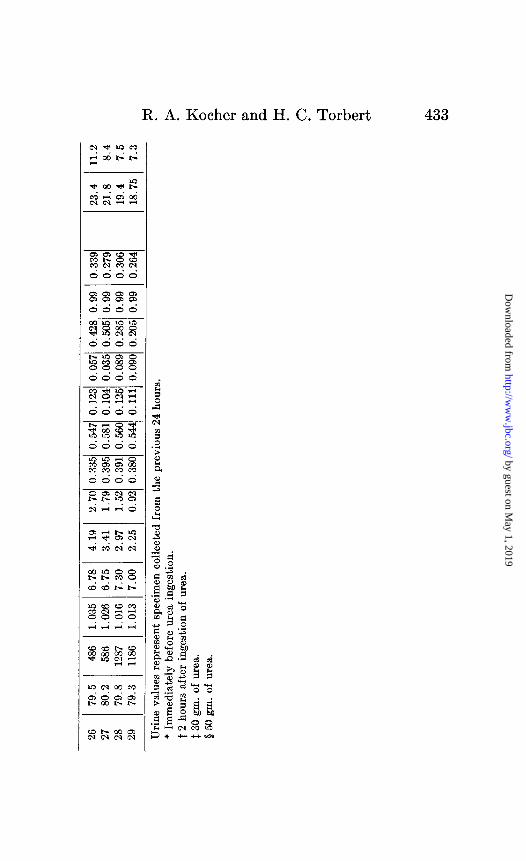
Urine
va
lues
repr
esen
t sp
ecim
en
colle
cted
fro
m
the
prev
ious
24
hour
s. *
Imm
ediat
ely
befo
re
urea
in
gest
ion.
t
2 ho
urs
afte
r in
gest
ion
of
urea
. $3
0 gm
. of
ur
ea.
$ 50
gm
. of
ur
ea.
11.2
8.
4 7.
5 7.
3
--9
by guest on May 1, 2019
http://ww
w.jbc.org/
Dow
nloaded from

434 Urea Effect on Nitrogen Partition
absorbed from the intestinal tract, and hence need not enter further into the calculation of urea recovery. In the first experi- ment, 30 gm. of urea in 20 per cent solution, containing 14 gm. of nitrogen, were ingested on the morning of August 16, the 9th day of the experiment. The total nitrogen excreted for this day and the subsequent 4 days was 27.02 gm. The average endog-
enous nitrogen level for this period 2.91 - 2.18 2 = 2.54 X 5 =
12.7 gm. 27.03 - 12.70 = 14.33 gm. of nitrogen excreted in excess of the endogenous nitrogen. Ingested urea N = 14.0 gm.
The calculation for the urea nitrogen excretion is as follows:
gm. Urea N on day before urea ingestion.. . . . 1.51
‘I “ ‘I “ ending period.. . . . . . . . . . . 0.73 2.24
Daily average endogenous urea N ‘$ = 1.12
Total endogenous urea N for period 1.12 X 5 = 5.60
“ urea N put out during experiment. 19.47 Endogenous urea N.. . . . . . . . . . . . . . . . . . 5.60 Total ingested urea N recovered.. . . . . . 13.87 Urea N ingested.. . . . . . . . . . . . . . . . . . 14.00 Total urea N recovered.. . . . . . . . . . . . . 13.87 = 99.07 per cent
The level of all the other nitrogenous constituents of the urine remained at the same average level during the period of extra urea excretion. The average total sulfur excretion likewise re- mained constant. This with the trend toward a slightly lower minimum paralleling the lower endogenous nitrogen minimum is further conclusive evidence that in this experiment, not only was the ingested urea fully recovered as such but there was no synthesis of protein or conversion of urea into other nitrogenous forms.
In the second experiment, while the subject continued on the same diet, 50 gm. of urea in 20 per cent solution were ingested on August 21, 22, and 23; a total of 150 gm. of urea, or 70 gm. of nitrogen during the 14th, 15th, and 16th days on the diet. The endogenous base-line was again taken as the average of the day preceding the ingestion of urea and the final low level reached 5 days after the last day of urea ingestion.
by guest on May 1, 2019
http://ww
w.jbc.org/
Dow
nloaded from
R. A. Kocher and H. C. Torbert 435
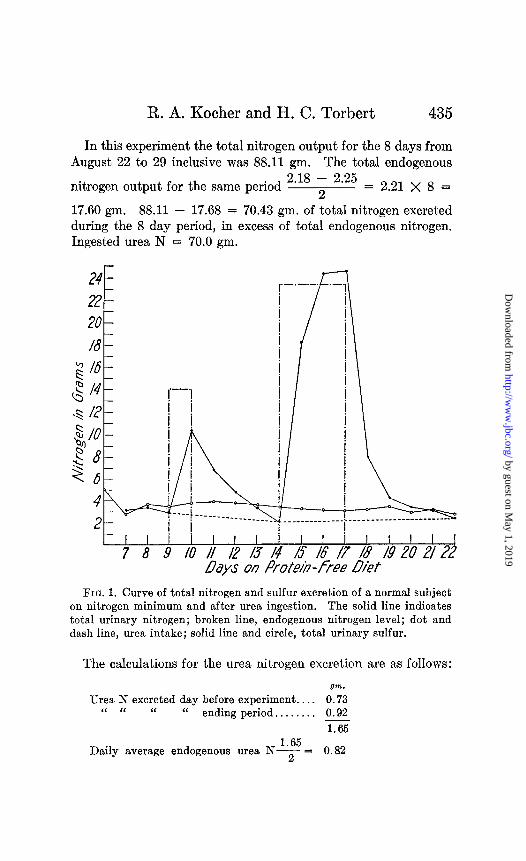
In this experiment the total nitrogen output for the 8 days from August 22 to 29 inclusive was 88.11 gm. The total endogenous
nitrogen output for the same period 2.18 - 2.25
2 = 2.21 X 8 =
17.60 gm. 88.11 - 17.68 = 70.43 gm. of total nitrogen excreted during the 8 day period, in excess of total endogenous nitrogen. Ingested urea N = 70.0 gm.
24 22 20 /8
“, I6 F
. . t-1 I I I I I I i I I
7 8 9 IO /!! P /3 /4 1s ls_ /1 Days on PruLk-free Diet
FIQ. 1. Curve of total nitrogen and sulfur excretion of a normal subject on nitrogen minimum and after urea ingestion. The solid line indicates total urinary nitrogen; broken line, endogenous nitrogen level; dot and dash line, urea intake; solid line and circle, total urinary sulfur.
The calculations for the urea nitrogen excretion are as follows:
Urea N excreted day before experiment.. . . 0.73 “ “ “ “ ending period.. . . . . . . 0.92
1.65
Daily average endogenous urea NT = 0.82
by guest on May 1, 2019
http://ww
w.jbc.org/
Dow
nloaded from
436 Urea Effect on Nitrogen Partition
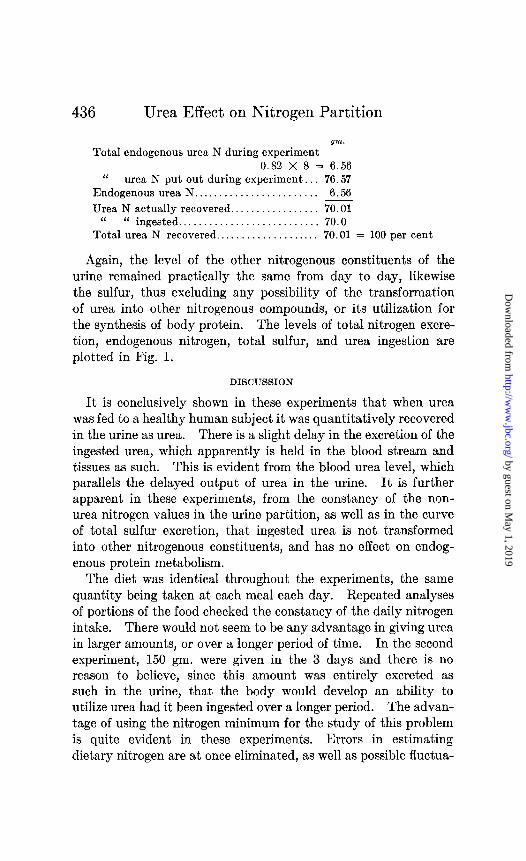
Total endogenous urea N during experiment 0.82 X 8 = 6.56
‘I urea N put out during experiment. 76.57 Endogenous urea N.. . . . . . . . . . . . . . . . 6.56 Urea N actually recovered.. . . . 70.01
‘I “ ingested........................... 70.0 Total urea N recovered.. . . . . . . . . . . . 70.01 = 100 per cent
Again, the level of the other nitrogenous constituents of the urine remained practically the same from day to day, likewise the sulfur, thus excluding any possibility of the transformation of urea into other nitrogenous compounds, or its utilization for the synthesis of body protein. The levels of total nitrogen excre- tion, endogenous nitrogen, total sulfur, and urea ingestion are plotted in Fig. 1.
DISCUSSION
It is conclusively shown in these experiments that when urea was fed to a healthy human subject it was quantitatively recovered in the urine as urea. There is a slight delay in the excretion of the ingested urea, which apparently is held in the blood stream and tissues as such. This is evident from the blood urea level, which parallels the delayed output of urea in the urine. It is further apparent in these experiments, from the constancy of the non- urea nitrogen values in the urine partition, as well as in the curve of total sulfur excretion, that ingested urea is not transformed into other nitrogenous constituents, and has no effect on endog- enous protein metabolism.
The diet was identical throughout the experiments, the same quantity being taken at each meal each day. Repeated analyses of portions of the food checked the constancy of the daily nitrogen intake. There would not seem to be any advantage in giving urea in larger amounts, or over a longer period of time. In the second experiment, 150 gm. were given in the 3 days and there is no reason to believe, since this amount was entirely excreted as such in the urine, that the body would develop an ability to utilize urea had it been ingested over a longer period. The advan- tage of using the nitrogen minimum for the study of this problem is quite evident in these experiments. Errors in estimating dietary nitrogen are at once eliminated, as well as possible fluctua-
by guest on May 1, 2019
http://ww
w.jbc.org/
Dow
nloaded from

R. A. Kocher and H. C. Torbert 437
tions in the nitrogen balance from the variable utilization of dietary nitrogenous constituents from day to day. Abderhalden and others long ago warned against the interpretation of experimental data based on nitrogen equilibrium. The results of these experi- ments are in accord with those of Addis and Watanabe (S), in humans, and with Morgen and associates (6), Scheunert et al. (ll), Taylor and Ringer (12), and others on animals.
The discrepancy between our results and those recently reported by Moore, Lavietes, Wakeman, and Peters (1) is more apparent than real. We take the liberty of making the following cal- culations from the data of their four experiments.
Experiment I
The total nitrogen intake for a period of 17 days was 358.2 gm. and the total unrecovered nitrogen, 25.8 gm. = 7.2 per cent of the total intake for 17 days. Of the 358.2 gm. intake, 244.8 gm. represent dietary nitrogen, estimated as such from standard dietary tables. The error of this method of estimating nitrogen intake could quite easily be of the magnitude of 7.2 per cent. Of par- ticular interest in this experiment is the fact that during the 10 day period immediately following the 7 days of urea ingestion with an estimated daily dietary intake of 14.4 gm., there was a positive balance of 3 gm., notwithstanding that a delayed excretion of urea nitrogen from the previous period would tend to produce a negative balance. The data in this experiment are not reported day by day, but are lumped for each period, so that it is not apparent at what stage of the after period nitrogen began to be retained. This emphasizes the uncertainty of estimating nitrogen retention on the basis of the nitrogen balance.
Experiment 2
Daily nitrogen intake of 3.3 gm. for 13 days.. . . . . . . . . 42.9 gm. Total urea N.. . . . . . . . . . . . . . . . . . . . . . . . . . . . . . . . . . . . . 243.0 “
285.9 “
The total unrecovered nitrogen was 7.3 gm. = 2.3 per cent of the total intake.
In this experiment, the nitrogen excretion was determined for only 3 days following the period of urea ingestion. In our own
by guest on May 1, 2019
http://ww
w.jbc.org/
Dow
nloaded from
438 Urea Effect on Nitrogen Partition
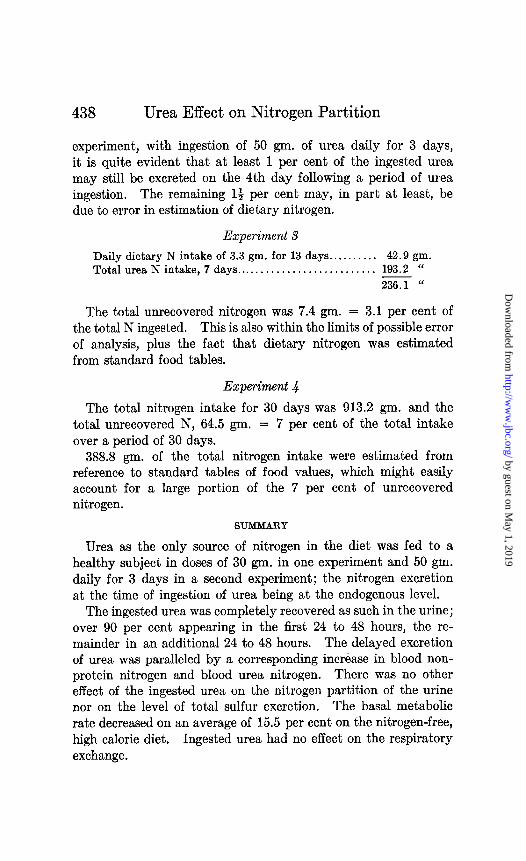
experiment, with ingestion of 50 gm. of urea daily for 3 days, it is quite evident that at least 1 per cent of the ingested urea may still be excreted on the 4th day following a period of urea ingestion. The remaining 13 per cent may, in part at least, be due to error in estimation of dietary nitrogen.
Experiment 3
Daily dietary N intake of 3.3 gm. for 13 days.. . . . . . . . . 42.9 gm. Total urea N intake, 7 days. . . . . . . . . . . . . . . . . . . . . . . . . . . 193.2 “
236.1 “
The total unrecovered nitrogen was 7.4 gm. = 3.1 per cent of the total N ingested. This is also within the limits of possible error of analysis, plus the fact that dietary nitrogen was estimated from standard food tables.
Experiment 4 The total nitrogen intake for 30 days was 913.2 gm. and the
total unrecovered N, 64.5 gm. = 7 per cent of the total intake over a period of 30 days.
388.8 gm. of the total nitrogen intake were estimated from reference to standard tables of food values, which might easily account for a large portion of the 7 per cent of unrecovered nitrogen.
SUMMARY
Urea as the only source of nitrogen in the diet was fed to a healthy subject in doses of 30 gm. in one experiment and 50 gm. daily for 3 days in a second experiment; the nitrogen excretion at the time of ingestion of urea being at the endogenous level.
The ingested urea was completely recovered as such in the urine; over 90 per cent appearing in the first 24 to 48 hours, the re- mainder in an additional 24 to 48 hours. The delayed excretion of urea was paralleled by a corresponding increase in blood non- protein nitrogen and blood urea nitrogen. There was no other effect of the ingested urea on the nitrogen partition of the urine nor on the level of total sulfur excretion. The basal metabolic rate decreased on an average of 15.5 per cent on the nitrogen-free, high calorie diet. Ingested urea had no effect on the respiratory exchange.
by guest on May 1, 2019
http://ww
w.jbc.org/
Dow
nloaded from
R. A. Kocher and H. C. Torbert
The authors wish to express their appreciation to Mrs. Ruth Christiansen for assistance in the blood analyses, and to Miss Mac Watson, dietitian of the Grace Deere Velie Metabolic Clinic for assistance in the preparation of the diets.
BIBLIOGRAPHY
1. Moore, D. D., Lavietes, P. H., Wakeman, A. M., and Peters, J. P., J. Biol. Chem., 91, 373 (1931).
2. Voltz, W., Biochem. Z., 102, 151 (1920). 3. Volts, W., Dietrich, W., and Jantzon, H., Biochem. Z., 130, 323 (1922). 4. Honcamp, F., Koudela, S., and Miiller, E., Biochem. Z., 143,111 (1923). 5. Hanson, J., Landw. Jahrb., 67, 141 (1922). 6. Morgen, A., Windheuser, C., and Ohlman, E., Landw. VeTsuch.-Sta.,
133, 359 (1922). 7. Cathcart, E. P., and Green, H. H., Biochem. J., 7, 1 (1913). 8. Addis, T., and Watanabe, C. K., J. Biol. Chem., 27, 249 (1916). 9. Kocher, R. A., Deutsch. Arch. Min. Med., 116, 82 (1914).
10. Smith, M., J. Biol. Chem., 68, 15 (1926). 11. Scheunert, A., Klein, W., and Steuber, M., Biochem. Z., 133, 137 (1922). 12. Taylor, A. E., and Ringer, A. I., J. Biol. Chem., 14, 407 (1913).
by guest on May 1, 2019
http://ww
w.jbc.org/
Dow
nloaded from

R. A. Kocher and Harold C. TorbertLEVEL
URINE AT ENDOGENOUS NITROGENTHE NITROGEN PARTITION OF THE
THE EFFECT OF UREA INGESTION ON
1932, 95:427-439.J. Biol. Chem.
http://www.jbc.org/content/95/2/427.citation
Access the most updated version of this article at
Alerts:
When a correction for this article is posted•
When this article is cited•
alerts to choose from all of JBC's e-mailClick here
ml#ref-list-1
http://www.jbc.org/content/95/2/427.citation.full.htaccessed free atThis article cites 0 references, 0 of which can be by guest on M
ay 1, 2019http://w
ww
.jbc.org/D
ownloaded from