Embed Size (px)
Citation preview
The effect of financial misreporting on corporate mergers and acquisitions
Merle Erickson Booth School of Business - University of Chicago
Shane Heitzman Simon School of Business – University of Rochester
X. Frank Zhang Yale School of Management
November 20, 2012
Abstract
In this paper, we investigate how misreporting influences merger and acquisition decisions. We analyze a sample of 283 firms accused of committing accounting fraud by the SEC between 1985 and 2003. During the alleged fraud period, these firms pursued over 300 acquisitions valued at $305 billion in the aggregate. Managers that pursue acquisitions increase the risk that the fraud will be discovered during negotiations. On the other hand, successful transactions conceal misreporting by complicating the firm’s accounting information after the transaction closes. Our results suggest that these concealment benefits outweigh the incremental detection costs: Fraud firms are more likely than non-fraud firms to acquire another company and are also more likely to acquire firms that have less public information, are harder to value, and have less similar operations. In addition, we find that fraud firms negotiate provisions that increase the likelihood of deal success and accelerate the closing date to speed up the consolidation of the target’s and fraud firm’s financial statements. Taken as a whole, our results suggest that managers engaged in accounting manipulation use acquisitions in an ex ante attempt to conceal misreporting and that these concealment benefits outweigh the increase in detection risk.
We appreciate comments from Jerry Zimmerman and workshop participants at National University of Singapore, Penn State University, SUNY Buffalo, Yale University, University of Alabama, and the Information, Markets and Organizations conference at Harvard University. Mengjie Huang provided valuable research assistance.
1
The effect of financial misreporting on corporate mergers and acquisitions
1. Introduction
When managers misrepresent the firm’s performance, they face strong private incentives to
conceal their misreporting (Karpoff et al. 2008). These managers also make real hiring and
investment decisions, including acquisitions, while misreporting (McNichols and Stubben, 2008;
Kedia and Phillipon, 2009). This results in a fundamental conflict between the cost and benefit of
acquisitions for firms engaged in intentional misreporting. Under the concealment benefits
hypothesis, an acquisition has the potential to support managerial attempts to conceal the
accounting misstatement. Misreporting firms are therefore more likely to make acquisitions,
choose targets that reduce the comparability and consistency of the financial statements, and
close the deal just before the fiscal quarter end. Under the detection cost hypothesis, the
negotiation process can increase scrutiny of the buyer’s confidential accounting records and
increase the likelihood of fraud detection. Thus, the manager should be less willing to engage in
an acquisition and, if they choose to acquire, they should structure the deal to minimize the
firm’s exposure to enhanced scrutiny of its accounting information. The concealment benefit and
detection cost hypotheses have competing views on the frequency and characteristics of
acquisition activities. In this paper, we empirically test these two competing hypotheses.
We analyze the acquisition decisions of a sample of 283 firms accused by the SEC of
engaging in accounting fraud (fraud firms) between 1985 and 2003. These firms pursued 307
target firms during the period of the alleged fraud; the aggregate value of all acquisitions by
fraud firms during this period is approximately $305 billion.1 During the period of the alleged
fraud, the fraud firms in our sample are 37% more likely than non-fraud firms to announce an 1 This is a lower bound estimate of the activity by misreporting firms, as we cannot identify firms that committed
fraud but were not caught.

2
acquisition and shift total investment expenditures to acquisitions of existing businesses. Among
those firms that enter the acquisition market in a given year, fraud firms purchase more entities
and spend more as a fraction of total assets relative to other firms. For the 307 acquisition
attempts during the alleged fraud period, the average target is valued at about $1 billion, has
EBITDA of around $150 million, and annual sales that approach 19% of the acquiring firm’s
sales. This evidence suggests that the concealment benefits that arise after the transaction is
completed are quite large.
Given the decision to pursue an acquisition, we also examine how managers trade off these
considerations in negotiations. From the concealment benefit perspective, the misreporting
manager has incentives to select a target that makes it difficult for external parties to analyze the
target’s assets and operations and their impact on the subsequent financial results reported by the
combined firm. Consistent with this argument, we predict that misreporting firms will be more
likely to acquire privately held firms, subsidiaries rather than stand-alone firms, firms located
abroad, as well as firms in different industries.2 Based on the sample of completed deals, we find
that misreporting firms on average are about 18% more likely to acquire a subsidiary than non-
fraud firms and 34% more likely to acquire a firm in a different industry, evidence consistent
with the concealment benefits hypothesis.
The manager’s decision to misstate accounting information should also have an impact on
bargaining strategy. If detection costs are relevant, the manager will reduce the incentives for
sellers and capital providers to scrutinize the firm and will retain options that allow the acquirer
to withdraw from the deal at low cost. This should manifest in a lower rate of target termination
2 The detection cost hypothesis is silent on target type; we have no a priori reason to believe—holding payment
method, size, and structure constant—why these target characteristics should influence the likelihood the fraud will be detected during negotiations.
3
fees and a higher likelihood of deal failure.3 On the other hand, if the manager’s incentive to do
the deal is driven by post-closing fraud concealment benefits, we predict that misreporting
managers will demand that the target agree to a termination fee provision and will be more likely
to close the deal. While deal failure rates are no different after controlling for termination fees,
we do find that misreporting managers are 23% more likely to demand that the target agree to a
termination fee provision, suggesting that concealment benefits from completing the deal are
important.
Finally, the concealment benefits hypothesis should affect when the deal closes. Delaying the
close by just a few days can push back the consolidation of the target and acquiring firms’
financial statements—and the resulting expected concealment benefits—for months. From the
time a transaction is first announced, we find that misreporting firms complete the acquisition
about 19% faster than other firms. Moreover, they are nearly three times more likely to close a
large deal in the final week of the fiscal quarter. [Do we want to do some analysis of these “large
acquisitions” and report how much higher quarterly earnings are due to the early closing in those
“large acquisitions”] This latter result is perhaps the most direct evidence that misreporting
managers expect to obtain concealment benefits from consolidating the financial results of the
newly-acquired target firm with the misreporting acquirer.
Our work adds to an expanding literature on the relation between accounting misstatements
and investment decisions (including acquisitions) with an objective to better understand the
causal links between the incentives to misreport accounting information and the frequency and
characteristics of acquisitions undertaken by the firm. 4 Our investigation focuses on how the
3 Target termination fees award a payment to the acquiring firm if the target breaks off the deal. 4 This approach is distinct from the existing literature that focuses on why managers manipulate financial
information (Burns and Kedia 2006; Goldman and Slezak 2006; Armstrong et al. 2010; Wang 2011), how it is
4
decision to misreport affects subsequent investment decisions in the spirit of Kedia and Phillipon
(2009) who argue and provide evidence that managers that misstate accounting information must
then invest more than optimal in order to maintain investors’ optimistic perception about the
firm’s growth opportunities. We provide an alternative explanation that exploits the fact that
managers face substantial private costs if the misreporting is detected and thus their acquisition
decisions likely reflect a trade off of post-closing concealment benefits and detection costs.
Our results also have implications for understanding how agency conflicts influence the
decisions of corporate acquirers (Amihud and Lev 1981; Jensen 1986; Morck et al. 1990;
Harford 1999). Given the expected private costs if the fraud is detected, the manager has strong
incentives to pursue acquisitions that conceal the manipulation and these tend to compound the
effect on shareholder value. Taken together, our findings contribute to the growing stream of
literature on the role of agency costs, information asymmetry, and financial reporting on
investments and acquisitions.
In the next section, we review the prior literature. Section 3 discusses the data sources and
sample attributes. Section 4 discusses specific predictions and presents empirical evidence. We
discuss alternative explanations in Section 5 and conclude in Section 6.
2. Prior literature
Our paper is related to the growing literature on the connection between misreporting and
investment (including acquisitions), with an objective to better understand the causal links
between the incentives to misreport accounting information and the frequency and characteristics
of acquisitions undertaken by the firm. One potential association between misreporting and
detected (Dyck et al. 2010; Dechow et al. 2011; Wang 2011), and the impact of fraud detection on managers, directors, shareholders, and creditors (Karpoff et al. 2008a and b; Fich and Shivdasani 2007; Graham et al. 2008).
5
acquisitions arises if managers misstate accounting information with the primary purpose of
acquiring a target on better terms. Erickson and Wang (1999) find that acquirers in stock for
stock mergers manipulate earnings in the periods leading up to a merger announcement to inflate
the value of shares used to acquire the target’s stock. Louis (2004) and Gong, Louis and Sun
(2008) provide evidence that for these acquirers, there is a stock price reversal both before and
after the deal announcement that is a function of the pre-acquisition managed earnings. Kravet,
Myers, Sanchez and Scholz (2012) extend these studies and find that firms that restate
accounting earnings are more likely to have completed stock for stock mergers during the
periods for which their financial statements contained accounting misstatements.
Bens, Goodman and Neamtiu (2012) offer a second reason for the link between misreporting
and acquisitions: misstatements are driven by bad acquisition decisions in the past. If managers
are more likely to be replaced following poor performance, they have incentives to bias reported
earnings upward. The novel findings in Bens et al. (2012) suggest that managers concerned about
losing their job following a pessimistic market reaction to an acquisition announcement are more
likely to inflate subsequent performance reports to allay investor concerns and retain their
position.
The third set of studies reverses the direction of causality and focuses on how the decision to
misreport affects subsequent investment decisions. Kedia and Phillipon (2009) argue that
managers that misstate accounting information must then invest more than optimal in order to
maintain investors’ optimistic perception about the firm’s growth opportunities. McNichols and
Stubben (2008) provide an alternative explanation that allows those responsible for misreporting
to be distinct from those responsible for initiating and approving investment projects. They argue
6
that overinvestment occurring after misreporting begins is a consequence of managers using
optimistic forecasts, perhaps unknowingly, derived from the misreported information.
Our paper largely follows this third path. Complementing existing studies, we examine
whether misreporting firms use acquisitions to conceal accounting fraud. Specifically, we
examine how acquisition activities, target types, and acquisition structures are affected by the
manager’s incentives to conceal fraud. Under the detection cost hypothesis, acquisitions impose
a cost on the manager by increasing the access to and scrutiny of the financial statements by
outside parties, including sellers, financing providers, and investors. Thus, the manager should
be less willing to engage in an acquisition and should structure deals to minimize the firm’s
exposure to enhanced scrutiny of its accounting information. Under the concealment benefits
hypothesis, acquisitions benefit the manager by exploiting the financial reporting effects of a
business combination to cover up misstatements.5 Thus, misreporting buyers undertake more
successful deals, choose targets that reduce the comparability and consistency of the financial
statements, and speed up the closing process. To keep the analysis clear and organized, we
discuss specific predictions before each set of tests in Section 4.
3. Data and sample
5 There is anecdotal evidence that fraud impacts merger decisions. For example, in the Department of Justice’s
fraud indictment of Richard Scrushy at HealthSouth, it was alleged that, “It was further part of the conspiracy that defendant RICHARD M. SCRUSHY and co-conspirators would and
did cover up, conceal, and keep secret the fraud, by: (a) controlling and limiting access to HealthSouth’s financial information; (b) controlling the internal distribution of financial results; (c) providing fraudulent documentation and false information to its auditors; (d) providing false information to Federal and State taxing authorities; and (e) fraudulently using the acquisition of other companies to conceal fraudulent assets on HealthSouth’s books and in its reports.” (par. 36. Italics added)
Similarly, in Biovail Corporation Securities Litigation, Case No. 03-CV-8917 (RO): “According to the complaint, defendants knew throughout the Class Period that its earnings forecasts for
Biovail could not be met as evidenced by the fact that the Company was considering emergency plans for bolstering its business through essential acquisitions which were designed to replace foreseeable declining revenues.”
7
Our basic research question is straightforward: Do the acquisition preferences of
misreporting managers reflect a tradeoff of fraud concealment benefits and detection costs? To
address this question, we are interested in identifying cases of relatively aggressive accounting
manipulation in which managers have strong incentives to conceal their actions. This requires an
objective measure of accounting manipulation. Ideally, this measure will reliably capture the
accounting manipulation of firms whether or not the misreporting is actually detected, but such a
measure is difficult to construct and validate. Ex ante measures such as accounting accruals can
reflect accounting manipulation (Bergstresser and Philippon 2006), but also capture real changes
in the fundamentals of the firm. Ex post measures such as restatements are potentially more
useful (for example, Efendi et al. 2007; Graham et al. 2008), but often arise for reasons that have
little to do with accounting manipulation.6 Karpoff et al. (2012) document that the primary
restatement database, Audit Analytics, substantially overstates cases of aggressive misreporting.
Our primary measure of accounting manipulation is whether or not the SEC alleges that the
firm engaged in fraudulent financial reporting as evidenced by an AAER covering fiscal years
between 1982 and 2003 as identified by Dechow et al. (2011).7 The AAER are an important sub-
classification of enforcement actions analyzed by Karpoff et al. (2008b). We recognize that using
a sample of detected fraud cases to identify accounting manipulation has drawbacks, particularly
because we are interested in understanding the potential role of acquisitions in hiding the
misreporting. In other words, our sample is comprised of firms that engaged in fraud and were
actually caught, so firms that engaged in fraud but successfully concealed it are ultimately not
treated as accounting manipulators. Separating the effects of fraud commission from fraud
6 For example, firms can restate insignificant amounts or restate in response to a misinterpretation of accounting
rules. Class-action lawsuits have been used more recently to generate a sample of manipulating firms (Armstrong et al. 2010; Dyck et al. 2010).
7 We are grateful to Patty Dechow, Weili Ge, Chad Larson, and Richard Sloan for making this data available.
8
detection is not straightforward and this could lead to a potential interpretation problem. We
handle this challenge in two ways. First, we explicitly consider the role of fraud detection risk in
influencing mergers and acquisitions through the detection cost hypothesis. As it turns out, the
predictions under a detection cost explanation either stand alone or run in the opposite direction
of the concealment benefits hypothesis. Thus, our evidence allows us to draw inferences on
which of these two effects dominate. Second, we consider an alternative measure of fraud based
on an expectations model which is estimated using, but does not directly rely on, alleged cases of
fraud.8
Our analysis occurs at both the firm-year and transaction levels. Among the 283 firms
identified in the AAER sample with sufficient data from Compustat and CRSP (i.e., fraud firms),
181 pursue at least one acquisition during the 1982 through 2005 sample period (as identified by
SDC), and of those, 94 make at least one acquisition during the alleged fraud period. We identify
644 firm-years of data for fraud firms during the alleged frauds with sufficient accounting and
stock market information. For the set of non-fraud firms that we use for comparisons, we include
all years and deals between 1982 and 2005 with sufficient data.
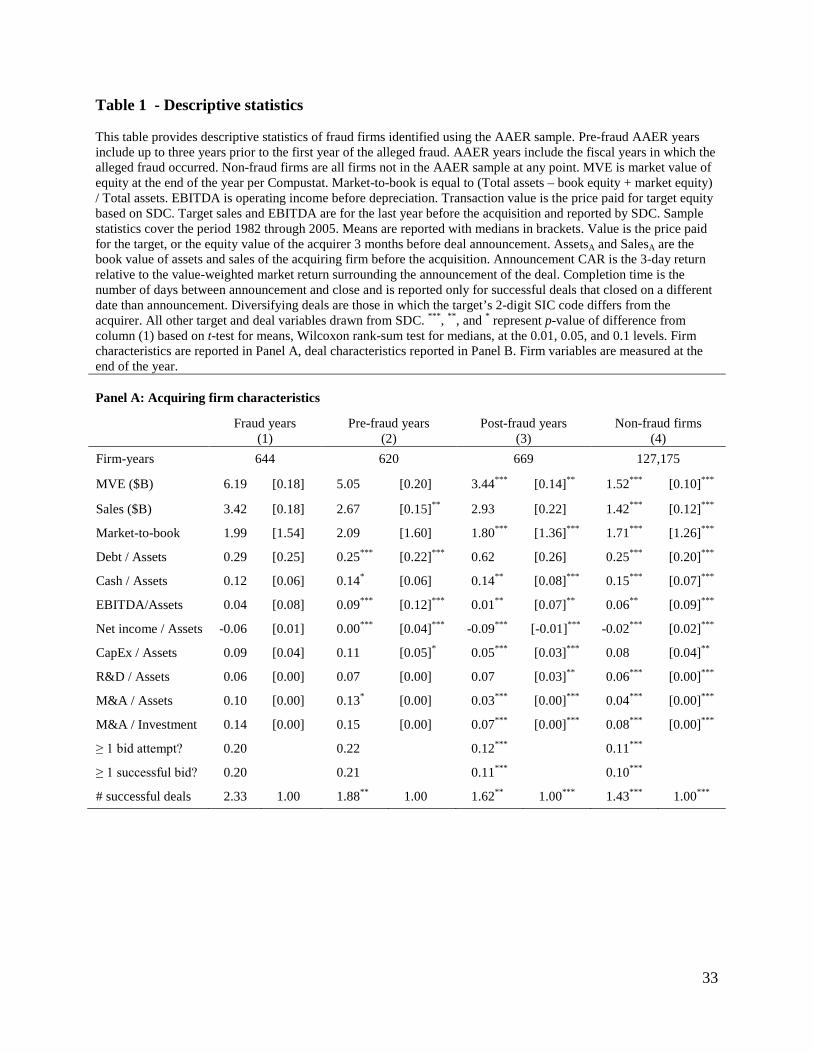
In Table 1, we summarize a number of characteristics for fraud and non-fraud firms. On
average, the SEC accuses managers of engaging in fraud over two fiscal years. However, it is
widely believed that the accounting manipulation underlying the fraud begins long before the
fraud’s alleged start date. Old or missing records and the federal statute of limitations can
prevent the SEC from formally alleging fraud in too early a period. Because of this, the period
directly preceding the alleged fraud is unlikely to serve as an effective control for expected non-
8 It is worth noting that nearly all studies of fraud determinants face a similar problem (e.g. Erickson et al. 2006;
Armstrong et al. 2010; Dechow et al. 2011; and Schrand and Zechman 2011), and dealing with this problem is not straightforward.
9
fraud acquisition behavior by fraud firms. It is also possible to benchmark to post-fraud years,
but such an analysis is hampered by sample attrition (often because of bankruptcy) or significant
changes to the firm’s management and control environment. Thus, we draw our main inferences
from comparisons of acquisitions by fraud firms during the fraud years to a sample of firms that
were never accused of fraud through an AAER during our sample period. We report distributions
for the alleged fraud firms during the fiscal years of the fraud period and three years immediately
before (pre-fraud) and after (post-fraud), as well as for control firms not subject to an AAER
during the sample period (non-fraud firms).
For each firm in the sample, we identify all acquisition attempts during the sample period.
Deals treated as occurring during the fraud period are those announced during the fiscal period in
which the SEC alleges the fraud occurred. For each acquisition attempt, we require the acquirer
to seek 100% of the target firm stock, not own more than 50% prior to the acquisition, and that
the acquisition value of the target’s stock be at least $10 million (in 2000 dollars). An acquisition
attempt is successful if the firm completes the deal within two years of the public announcement,
otherwise we treat it as unsuccessful. In each year of the alleged fraud, 21% of firms make at
least one acquisition attempt. By comparison, only 11% of non-fraud firms attempt an
acquisition in a given year, and the frequency for fraud firms is significantly greater than for
non-fraud firms at the 0.01 level. Relative to non-fraud firms, fraud firms are significantly larger,
have higher market-to-book ratios and higher leverage.
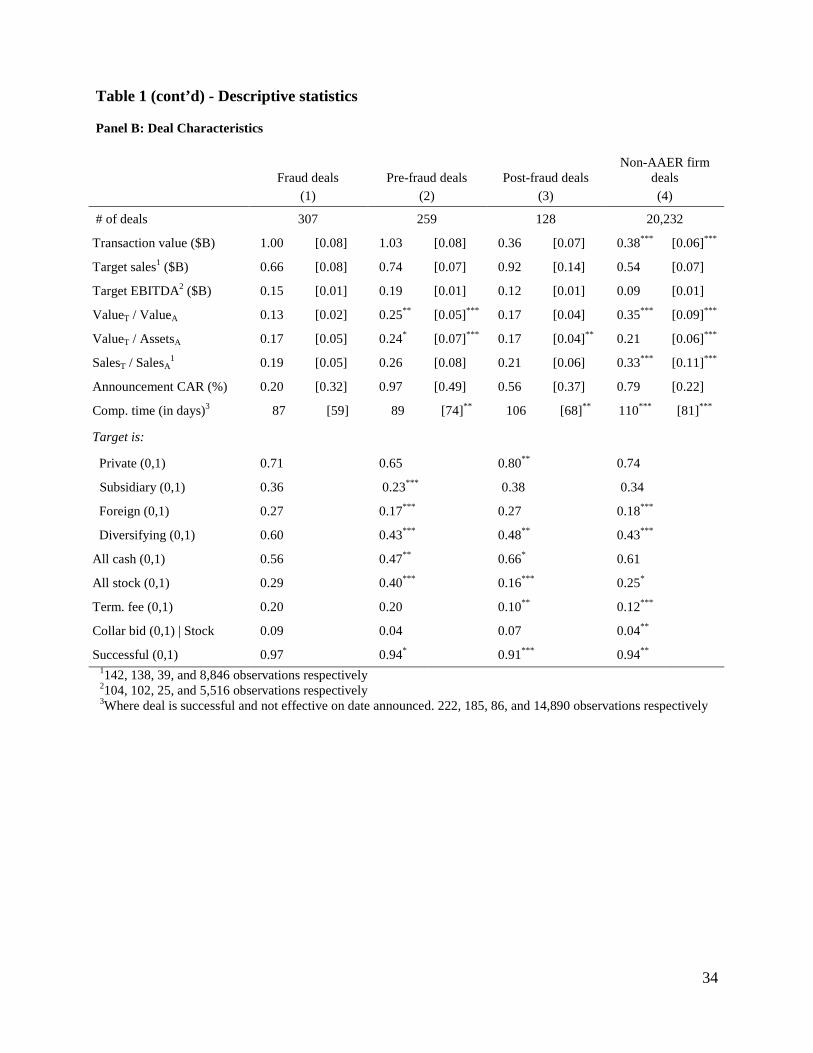
In Table 1, Panel B we summarize the characteristics of the attempted acquisitions during the
period of the alleged fraud. The average target purchased by fraud firms is valued at about $1
billion and has sales of $660 million and EBITDA of about $150 million. Non-fraud firms
purchase targets with an average value of about $380 million that have average EBITDA of

10
about $90 million and for which average sales are about $540 million. On a relative basis, fraud
firms acquire targets with equity values averaging 13% of their own value (2% at the median).
On the other hand, non-fraud firms purchase firms whose value averages 35% of the buyer’s pre-
acquisition value (9% at the median). Both the mean and median relative deal sizes are
significantly higher for the non-fraud sample at the 1% level, a result driven by the fact that fraud
firms are systematically larger than non-fraud firms. Fraud firm shareholders react positively to
the deal announcement throughout the sample, with 3-day excess returns averaging 0.20%, but
less so relative to non-fraud shareholders (3-day excess return=0.79%). The average positive
reaction in both samples is driven by the large proportion of takeovers of private firms,
consistent with the findings in Fuller et al. (2002). At the median, fraud firms close a deal in 59
days (87 at the mean) during the fraud period, significantly faster than the 81 days (110 at the
mean) taken by non-fraud firms.
Finally, we also provide evidence on target type and deal structure. 71% of fraud firm targets
are private (vs. 74% for non-fraud firms), while 36% of all targets are subsidiaries rather than
stand-alone firms (vs. 34% for non-fraud firms). Fraud firms purchase foreign firms in 27% of
their deals compared to 18% for non-fraud firms and this difference is statistically significant at
the 0.01 level. Fraud firms are more likely to acquire a target with a different 2-digit SIC code
(60% vs. 43% of deals). When fraud firms acquire, they are significantly more likely to obtain
target termination fee agreements (20% vs. 12%). Fraud firms appear to have a significantly
higher success rate for deals announced during the fraud, closing 97% of announced deals
compared to 94% for non-fraud firms (p < 0.1).
4. Evidence on accounting manipulation and corporate acquisitions

11
4.1. Acquisition activity
We first address the link between financial misreporting and acquisition activity. An
acquisition can provide a number of benefits to the manager manipulating financial information.
The right target can generate financial slack for a manager that has exhausted the firm’s existing
capacity for earnings manipulation. The required consolidation of the acquirer’s and target’s
financial statements introduces complexity into the financial reporting outputs used by auditors
and shareholders and can make post-deal financial statement analysis substantially more
difficult.9 Moreover, the announcement of an acquisition is usually a material information event.
Substantial director, investor, and analyst effort is devoted toward understanding the impact of
the deal on firm value, particularly when there is less information about the target. This can shift
information gathering activities toward understanding the strategic decisions of the firm and
away from the financial reporting integrity of the acquirer. Under the concealment benefits
hypothesis, managers use takeovers to both obscure the firm’s true performance and shift
attention to other activities of the firm, implying that misreporting firms should be more active in
the acquisition market.
But acquisitions are costly if the opportunity costs of both the capital required to complete
the transaction and the manager’s time are material. Moreover, acquisitions also subject the firm
to greater scrutiny from outsiders. Banks and underwriters provide additional scrutiny, and target
9 A recent accounting standard, Statement of Financial Accounting Standards No. 141 - Business Combinations,
explicitly discusses in the introduction to the standard the complexity arising from acquisition accounting, as follows.
“Under Opinion 16 [APB No. 16], business combinations were accounted for using one of two methods, the pooling-of-interests method (pooling method) or the purchase method. Use of the pooling method was required whenever 12 criteria were met; otherwise, the purchase method was to be used. Because those 12 criteria did not distinguish economically dissimilar transactions, similar business combinations were accounted for using different methods that produced dramatically different financial statement results. Consequently:
• Analysts and other users of financial statements indicated that it was difficult to compare the financial results of entities because different methods of accounting for business combinations were used.”
12
directors have a legal obligation to assess the intrinsic value of the acquirer’s stock consideration
in many circumstances. Under the detection cost hypothesis, managers avoid pursuing
acquisitions as this increased scrutiny significantly increases the probability that the
manipulation will be detected. Thus, we expect misreporting firms to be less active in the
acquisition market under the detection cost hypothesis.
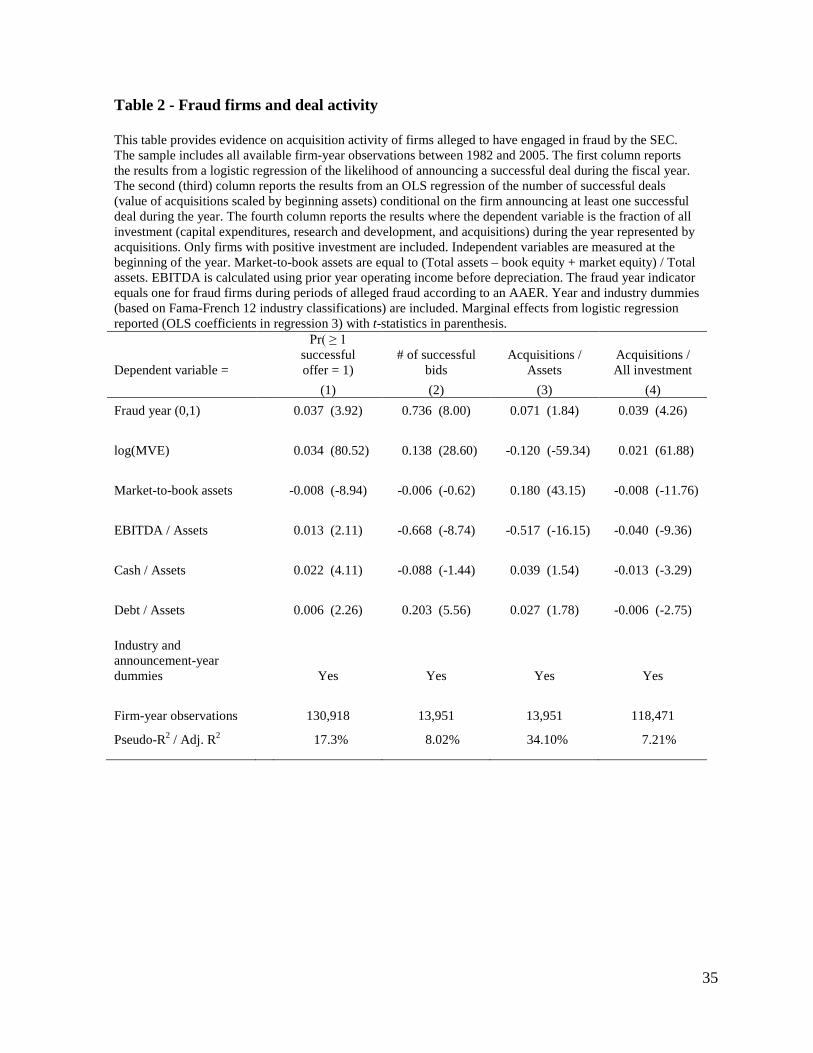
In the first column of Table 2, we report the results of a logistic regression explaining the
probability of announcing at least one offer during the year:
𝑃𝑟𝑜𝑏(≥ 1 𝑠𝑢𝑐𝑐𝑒𝑠𝑠𝑓𝑢𝑙 𝑜𝑓𝑓𝑒𝑟)
= 𝑓(𝛽1𝐹𝑟𝑎𝑢𝑑 𝑦𝑒𝑎𝑟 + 𝛽2𝐶𝑜𝑛𝑡𝑟𝑜𝑙𝑠 + 𝛽𝑇𝑌𝑒𝑎𝑟 𝑒𝑓𝑓𝑒𝑐𝑡𝑠
+ 𝛽𝐾𝐼𝑛𝑑𝑢𝑠𝑡𝑟𝑦 𝑒𝑓𝑓𝑒𝑐𝑡𝑠)
(1)
We measure merger activity as a binary variable equal to 1 if the firm announces at least one
ultimately successful acquisition attempt during the year.10 The variable of interest is an
indicator variable equal to one for firm-years in which the SEC alleges that fraud occurred.11 The
set of control variables includes the log of equity value, the market-to-book asset ratio,
profitability, cash holdings, and book leverage, all measured at the beginning of the fiscal year.
Year and industry fixed effects are also included.
Consistent with accounting manipulation having an impact on acquisition behavior, we find
that fraud firms are significantly more likely to complete acquisitions during periods of alleged
fraud (p < 0.001). The average marginal effect reported indicates that a firm later accused of
engaging in accounting fraud is 3.7 percentage points more likely to announce a successful
10 Given the high rate of completing announced offers, the results are almost identical if we include unsuccessful
deals. 11 We do not benchmark the fraud year effects against pre-fraud year effects because it is not clear when the fraud
actually begins. The SEC can be constrained by the statute of limitations when pursuing accounting fraud actions. Moreover, the farther back in time the SEC must go, the more likely the evidence necessary to prevail is incomplete or missing.
13
acquisition in a given fraud year. With non-fraud firms announcing at least one successful deal in
10% of sample years, misreporting firms are thus 37% more likely to announce an acquisition
attempt in a given year (3.7%/10% ≈ 37%). The coefficients on the control variables are largely
as expected. For example, large firms and those with more cash on hand are more likely to make
a deal.
We also examine whether the level of deal activity is different for misreporting firms. In
columns 2 and 3 of Table 2 we focus on years when firms enter the acquisition market by
announcing at least one acquisition. The level of activity is defined as the number of successful
deals announced during the year or the total amount paid in acquisitions as a fraction of the
firm’s beginning total assets. The coefficient of 0.736 on the fraud firm indicator reported in
column 2 suggests that among all firms that enter the acquisition market in a given year, a firm
engaged in fraud will make about 0.736 more acquisitions per year.12 The level of increased
activity translates into on average about $486 million of additional revenue from the target
(Panel B of Table 1). Using the same sample of firms that complete at least one deal, and
summing the value of all acquisitions for each firm-year, the results in column 3 show that deals
by fraud firms add 7 percentage points more to the acquirer’s asset base than deals by non-fraud
firms (t = 1.84).
Overall, the results support the concealment benefits hypothesis that misreporting firms tend
to do more acquisitions. A related but separate question is whether these acquisitions actually
add to the total investment of the firm or represent substitution from other forms of investment
like direct capital investment or research and development. We measure the composition of
investment as the fraction of total investment expenditures (acquisitions, R&D, and capital
12 Obviously, the acquirers in our sample buy entire firms, not fractions (we restrict ownership to be 100% for
completed deals). However, to provide economic interpretation of our results, we multiply the 0.74 by the various mean and median values for fraud firms as reported in Table 1.
14
expenditures) allocated to acquisitions. Panel A of Table 1 is consistent with the findings in prior
studies that firms invest significantly during fraud years. The average fraud firm adds 9% to the
total assets through capital investment and 10% through mergers and acquisitions during the
misreporting period. Non-fraud firms add a similar amount in capital expenditures, but less than
half the amount (4%) in acquisitions. As a fraction of total investment (capital expenditures,
R&D, and announced acquisitions), however, acquisitions represent 14% of total investment for
fraud firms and just 8% for non-fraud firms. Controlling for industry, year, and firm
characteristics, this difference remains significant in the regression results reported in column 4
of Table 2. Among all firms with positive investment expenditures in a given year, the fraction of
investment allocated to acquisitions is 3.9 percentage points, or 50% larger (3.9%/8%≈50%) for
fraud firms (t = 4.26). In other words, given the decision to invest, misreporting firms allocate
more capital to acquisitions (right word is acquisitions, not “investments” as before right?) thus
adding substantial complexity to the post-investment financial reporting environment further
supporting the concealment benefits hypothesis.
Acquisition activities serve as the first step to distinguish between the concealment and
detection cost hypotheses. We recognize the possibility that our control variables may not fully
address the endogeneity issue between misreporting and acquisition activities.13 Rather than
using more sophisticated models, we next turn to specific attributes of acquisitions, such as the
target types and deal closing times, to test the concealment benefits and detection cost
hypotheses.
4.2. Accounting manipulation and target type
13 One possible alternative explanation is that the SEC identifies fraud on the basis of acquisition activity. However,
prior research (Dyck, Morse and Zingales (2010)) does not suggest that the SEC identifies most frauds, and does not suggest that frauds in general are discovered due to acquisition activity.

15
Under the concealment benefits hypothesis, managers identify those firms that if acquired
make the firm’s post-closing financial reporting information more complex for insiders and
outsiders to process. Increasing opacity and uncertainty about the true impact of the acquisition
on the acquirer’s financial statements reduces the utility of the financial statements for detecting
earnings manipulation. Taking the decision to make an acquisition as given, the misreporting
manager will prefer targets that have less public information before the deal, assets that are
harder for outsiders to identify and analyze, and operations that have less in common with the
acquirer. We consider a number of target types.
First, we consider private companies. Historical and forecasted financial data are readily
available for most public targets, but unless they have publicly traded debt, private targets will
have minimal public information. And when an acquirer purchases a private target, the required
level of disclosure regarding the target’s assets and historical performance is generally minimal.
Among acquisitions of private targets in our sample, SDC provides historical accounting data for
only 27% of these deals. The SEC’s disclosure requirements look to the relative size of the target
based on total assets or income. If the target’s assets or income is less than 20% of the acquiring
company’s total assets, the acquirer has no obligation to disclose the target’s pre-acquisition
historical information.14
Second, we consider acquisitions of subsidiaries. A subsidiary’s financial information is less
transparent and acquiring-firm managers are likely to have more discretion over the ultimate
14 When the target makes up between 20% and 40% of the acquirer’s assets or income, only the most recent fiscal
year audited results must be disclosed. Between 40% and 50%, two years of audited results must be disclosed, and above 50%, three years. This threshold was 10% before 1996, but still only required a single year of results for acquisitions between 10% and 20% of the combined company. Beginning in 2000, no disclosure is required if the payment to target shareholders is entirely in cash and the acquiring firm shareholders do not vote. When the private target is a subsidiary of another corporation, the consideration is almost always in cash. When the unlisted target is a standalone entity, stock is used more frequently. See Officer (2007) for further analysis of purchase prices of private targets. See 17 C.F.R. §210 generally for current requirements. Rodrigues and Stegemoller (2007) provide a useful discussion of the requirements for disclosure of target financial information, and argue that many material acquisitions do not require disclosure of target financial statements.
16
financial statement impact in this type of deal than when acquiring a free-standing private or
public firm. Third, we examine whether misreporting firms are more likely to acquire foreign
firms. Foreign firm takeovers lead to similar limitations in pre-acquisition information as their
financial statements will not generally be constructed following U.S. GAAP even if they are
publicly traded. Finally, we examine whether misreporting firms tend to acquire targets from
different industries. A diversifying acquisition reduces the correlation in economic performance
across units and arguably impedes efforts to detect misreporting in the parent firm.
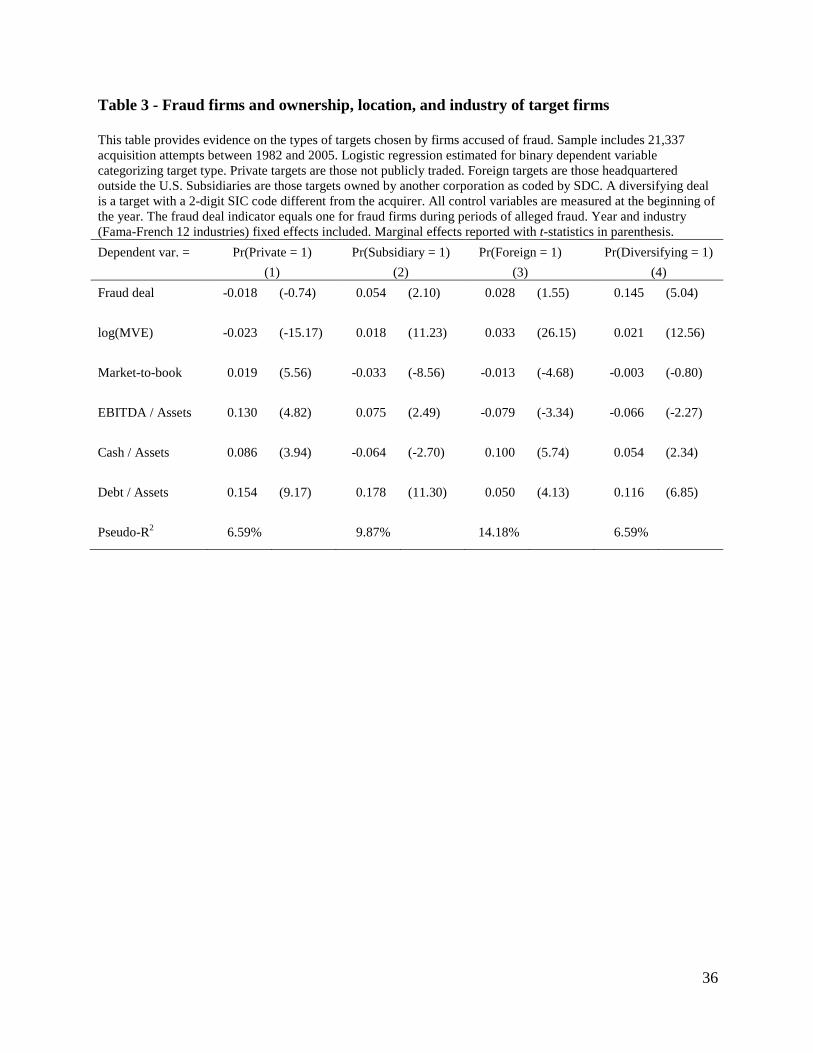
In Table 3, we analyze the effect of acquiring firm accounting manipulation on the type of
target acquired. The dependent variable takes a value of 1 when the acquirer purchases a target
of a given type (for example, a subsidiary). We control for acquiring firm size, market-to-book,
profitability, cash holdings, leverage, and announcement year and industry effects. As the first
column of Table 3 indicates, fraud acquirers are not more likely to purchase private targets (the
coefficient on the fraud year indicator is insignificant).
In the second column we compare acquisitions of subsidiary entities to those of stand-alone
public and private firms. Misreporting firms show a strong preference for subsidiaries and are 5.4
percentage points more likely to acquire one (p = 0.03), suggesting that subsidiary targets
provide more concealment benefits for fraud firm managers. Given that subsidiary acquisitions
make up about 34% of the private firms acquired by non-fraud firms, this implies that fraud
firms are about 16% more likely to acquire a subsidiary (computed as 5.4%/34% ≈ 16%). In the
third column of Table 3, we focus on the propensity to acquire a foreign target. The results from
that analysis indicate that misreporting acquirers are about 2.8 percentage points more likely to
acquire a foreign firm than non-fraud acquirers, but the effect is not significant (p = 0.12).

17
In the final column of Table 3, we investigate whether misreporting firms are more likely to
acquire a firm in a different industry. We define industries at the 2-digit SIC level and find that
misreporting firms are 14.5 percentage points more likely to acquire a target in a different
industry (p < 0.01) than non-fraud firms. Since 43% of the acquisition targets of non-fraud firms
are in a different two-digit industry, these estimates suggest that conditional on a deal,
misreporting firms are 34% more likely to purchase a firm in a different industry (14.5%/43%≈
34%).
Overall, we interpret our evidence in this section as somewhat consistent with the prediction
that firms engaged in accounting manipulation use acquisitions to provide concealment benefits
by selecting target firms that impede the ability of investors, creditors, and regulators to
understand what the firm acquired and how the acquisition affects post-transaction financial
information.
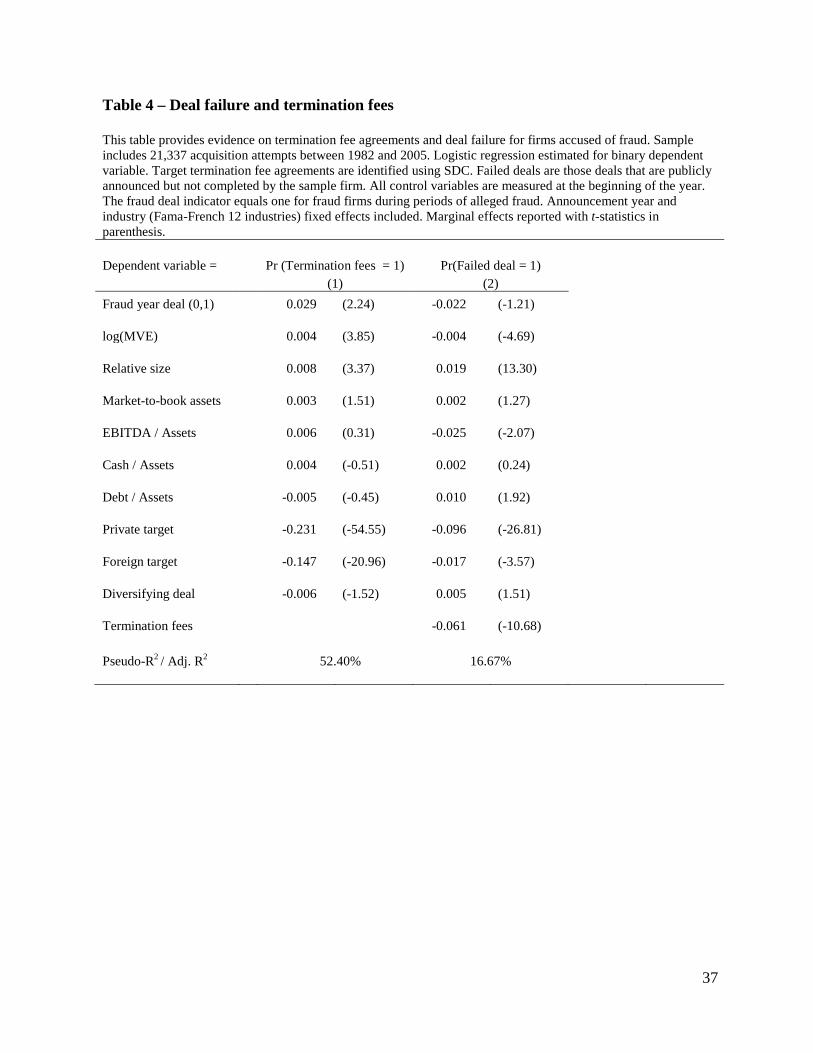
4.3. Deal failure and termination fees
If fraud detection risk is a material consideration during negotiations, the misreporting
manager will value the option to withdraw from negotiations. This effect should manifest in a
lower rate of target termination fees (a payment to the acquiring firm if the target breaks off the
deal) and a higher likelihood of deal failure. If concealment benefits dominate detection costs,
we expect managers will demand target termination fee agreements to raise the target’s cost of
breaking off deal negotiations and increase the likelihood of deal completion (Bates and
Lemmon 2003; Officer 2003). In Table 4, we find that fraud firms have a 2.9 percentage point
higher probability of including a target termination fee than non-fraud firms (p = 0.025). Because
18
non-fraud firms employ these agreements in 12% of deals, this implies that deals by fraud firms
are about 24% more likely to contain a termination fee provision (2.9%/12%≈24%).
We also examine whether misreporting affects the probability of deal failure independent of
the termination fee agreement and find no evidence that it does. However, a termination fee
agreement is associated with a 6.1 percentage point decline in the likelihood an announced deal
will fail (p < 0.01). One implication is that fraud firm managers impact deal outcomes through
their use of provisions such as termination fees. However, a well-known limitation of this
analysis is that deal failure rates are based on announced offers and thus understate the true
failure rate that includes unsuccessful offers that were conveyed privately but not announced
publicly. Thus, observed deal completions rates provide a relatively weak test of the impact of
misreporting on deal success or failure. [This paragraph is very confusing and I don’t know what
we are concluding – I think it needs a rewrite. We say “no evidence” in the first sentence, then
report a significant difference, then at the end say that this is a weak test. Please think about how
to explain this test more clearly]
4.4. Closing speed
Finally, we examine the impact of misreporting on the time it takes to complete a deal once it
is announced. We focus on the log of the number of days from announcement to completion so
that we can interpret the coefficient as the percentage impact on closing speed in the logarithm
format. After excluding deals that are announced and completed on the same day (usually small
deals and comprising about 25% of the sample), the results in Panel A of Table 5 imply that once
the deal is announced, fraud firms complete a deal 19% (=ln(nonfraud closing days) – ln(fraud
closing days)) faster than non-fraud firms (p < 0.01). Given that the average completion time is

19
110 days for non-fraud firms, our results imply that fraud firm managers take actions that cut the
time it takes to complete the transaction by 19 days.15
Delaying the close of the acquisition by just a few days can postpone consolidation with the
target’s financial statements by months. Thus, a more direct test of the concealment hypothesis is
based on the timing of deal closings. We expect misreporting firms will attempt to accelerate
deal closings to occur before the end of a fiscal quarter.16 For each successful deal, we identify
the fiscal quarter end closest to the deal close date. Deals that close the last seven days of the
fiscal quarter (ending on the quarter end date) represent week 0. Deals that close the first week of
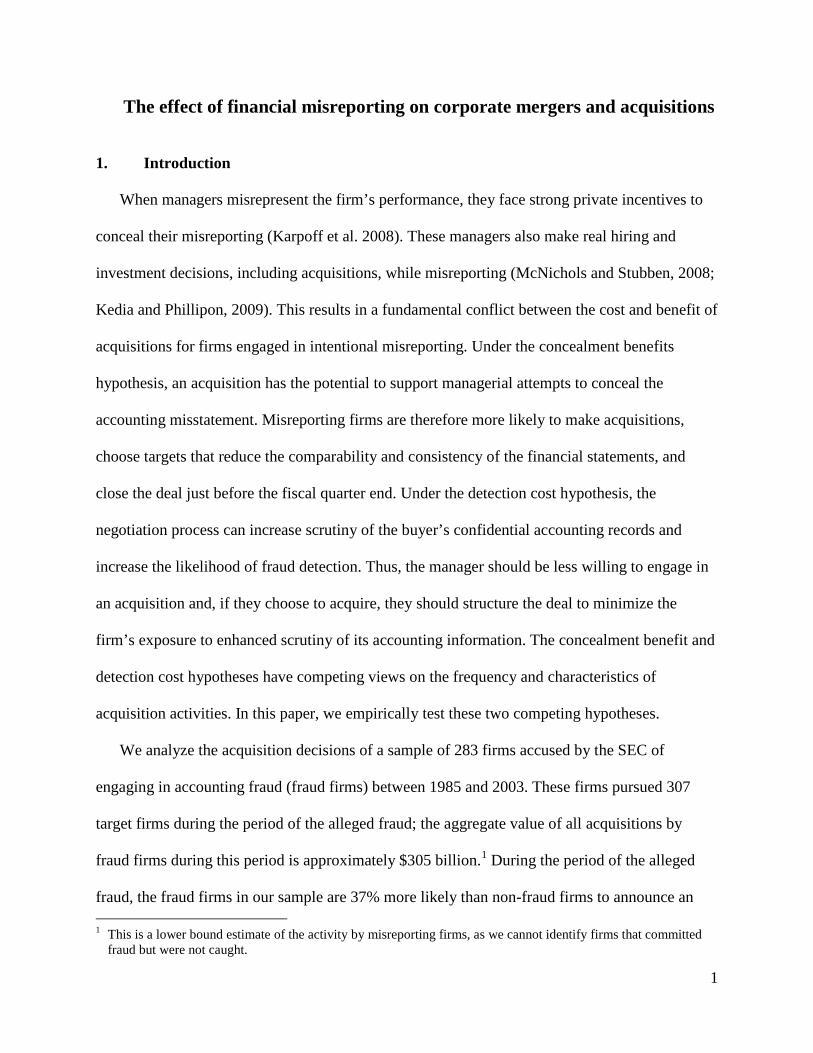
the next fiscal quarter represent week 1, and so on. For all deals, the distribution of deal close
dates around the nearest quarter end dates is represented in Figure 1a and suggests that fraud
firms do close a higher percentage of all deals (16.2%) just before the fiscal quarter close (week
0) relative to non-fraud firms (11.3%). The difference between these frequencies, as reported in
panel B of Table 5, is significant (p < 0.01).
If the manager’s desire to accelerate the close is a function of the materiality of the deal, then
we expect to find stronger results for large acquisitions. In figure 1b, we focus on targets valued
at least 10% of the acquirer, and find that fraud firms close 28.8% of their large deals in the final
week of the quarter while non-fraud firms close 11.3% of their large deals during the same
week.17 The difference is significant (p < 0.01) and provides further support for the conjecture
15 Interestingly, Grinstein and Hribar (2004) find that acquiring CEOs that take longer to complete a large deal have
higher future compensation. They interpret this result as longer completion times requiring more effort which the CEO is compensated for. In this light, our results suggest that fraud firm managers perceive greater benefits from speeding up the close and place a lower value on the potential wage increase from extending the closing period.
16 We thank Maureen McNichols for suggesting this test. 17 The apparent acceleration of closing dates to meet the close of the fiscal period is also reflected in the times to
completion. In untabulated tests, we find the median deal closing in the last week of the fiscal quarter take 87 days to close for non-fraud firms, and only 30 days to close for fraud firms (p-value of difference < 0.02). In contrast, the median deal closing in the first week of the fiscal quarter takes 76 days to close for non-fraud firms and 71 days to close for fraud firms (p-value of difference = 0.79).
20
that firms making deals to conceal misreporting will accelerate the closing dates to get the
target’s financial information on the combined entity’s books as quickly as possible.18
In panel C, we estimate logistic regressions in which the dependent variable is a binary
variable equal to one if the deal closes in the final week of the closest fiscal quarter, and zero
otherwise. We control for firm size and year effects, and the results confirm our univariate
findings—fraud firms are more likely to close deals during the last week of the quarter and this
propensity is an increasing function of target size. These findings are robust to controlling for a
number of other attributes of the deal.
Overall, the evidence is consistent with the concealment benefit hypothesis. Not only do
misreporting firms complete more acquisitions, they increase the fraction of total investment
allocated to acquisitions. Misreporting firms also tend to acquire subsidiaries and firms in
different industries. Finally, misreporting firms are more likely to demand termination fee
agreements and to close the deal just before the fiscal quarter end.
5. Additional analyses and alternative explanations
5.1. Does the acquisition delay the fraud detection?
To this point, the empirical analyses have centered on a comparison of fraud firms to non-
fraud firms. In this section, we try an alternative approach that compares fraud firms that make
acquisitions during the first year of the fraud period to those that do not. If the primary role of
accounting manipulation is to mislead investors about the fundamental value of the firm, then
actions that conceal that manipulation should lead to slower fraud detection and price correction.
We partition fraud firms based on whether or not they announced a successful acquisition in
the first year of the fraud. This approach avoids a potential mechanical relation between deal 18 During the years before the fraud, there is no apparent clustering of deal closings around fiscal period end.
21
activity and the duration of the fraud that would arise if we looked to multiple years. In Table 6,
Panel A we report the mean and median firm characteristics, measured at the end of the last pre-
fraud year, for firms that announce a deal in the first year (19% of firms) and those that do not
(81% of firms). Based on a comparison of the medians, the firms are largely similar in terms of
cash holdings and leverage, while acquirers are larger, have higher market to book, and are
slightly more profitable than non-acquirers.
As argued earlier, actions that conceal the fraud should lead to a slower detection and price
adjustment. Thus, if mergers and acquisitions have the effect of concealing underlying financial
manipulation, we would expect overvaluations to persist longer in fraud firms completing
acquisitions than in fraud firms not completing acquisitions. In Table 6, Panel A, we report
descriptive statistics on the cumulative raw returns over various windows before and after the
start of the alleged misreporting. At the univariate level, only long-run returns before and after
the fraud start date appear significantly different between the two groups.
A concealment explanation for acquisitions implies that to the extent the misreporting is
impounded in stock prices and results in overvaluation, acquisitions intended to conceal the fraud
will delay the recognition of misreporting and the stock price correction. To test this notion
formally, we adopt a model of return reversal. The dependent variable is the cumulative stock
return that begins in the first month of the fiscal year the fraud is alleged to have occurred and
ends 3, 6, 12, 24, or 48 months out. The primary independent variable that serves as a proxy for
overvaluation is the prior stock returns over an equally long window that ends in the last month
before the first year of the alleged fraud. To test whether firms that do deals appear better able to
conceal the fraud, we interact prior returns with an indicator for M&A activity in the first year of
fraud. We also control for firm size and market-to-book.
22
The results, reported in Table 6, Panel B, imply that the reversal of stock returns is
significantly delayed for firms doing deals in year 1, based on return windows between 6 and 24
months. For example, the results suggest that firms with strong returns leading up the fraud
period are less likely to experience a reversal in the months following the fraud if they make an
acquisition. When the return period equals 24 months, the coefficient on the interaction between
prior returns and acquisition activity is 0.24 (p = 0.02), and the interpretation of the coefficient is
…. In our study, we do not incorporate exactly when the fraud was detected as measuring that
construct is not straightforward. However, the result that non-acquiring fraud firms have faster
reversals of stock overvaluation is consistent with acquisitions having the effect of temporarily
concealing the misreporting from shareholders.
5.2. An alternative measure of misreporting
Following recent studies on accounting manipulation, we rely on enforcement actions taken
by the SEC against firms with alleged material misstatements to objectively identify a set of
firms with a demand for transactions that conceal accounting manipulation. While this approach
is unlikely to include firms that did not misreport, it likely misses a substantial number of firms
that did misreport but successfully concealed their actions from outsiders.19 Dealing with this
issue empirically is not straightforward and an accepted method has not yet emerged. Ideally, we
would like to use the available data to identify manipulating firms without reference to whether
or not they were actually caught. But conceptually, such a metric is unlikely to be a particularly
powerful way to identify manipulating firms. Manipulation demands opacity such that
19 While our interest lies in understanding the demand for acquisitions as a way to reduce the ex ante likelihood the
firm’s misreporting will be detected, an alternative interpretation of the results is simply that it reflects differences in the ex post likelihood of getting caught. This same criticism applies to nearly all studies that rely on samples with clear selection issues. This criticism, however, leads to the opposite prediction in nearly all of our tests, and as a result biases us against finding results consistent with the concealment motive.
23
regulators, investors, and researchers should have a difficult time detecting and proving the
misreporting in the first place. If the misreporting was obvious, managers would have much
weaker incentives to misreport.
Nevertheless, we consider an ex ante measure of the likelihood of committing fraud using the
F-score approach developed in Dechow et al. (2011). Dechow et al. use the sample of AAER
firms to generate a model that expresses the probability of fraud as a function of changes in the
fundamentals and accounting attributes of the firm. We use their parameter estimates to generate
an F-score for each firm-year in the sample, rank the firm into deciles based on the F-score. We
then replicate our main analysis by replacing the AAER indicator variable with the F-score. In
this analysis, we include all fraud and non-fraud firms with available data and disregard whether
the manipulation was actually detected. The F-score rank is based on data observed for the prior
fiscal year to mitigate the mechanical effects of a merger on the inputs to the F-score, and is
scaled to take values between 0.1 and 1.
Our results are qualitatively similar, with a few exceptions. For example, in untabulated
results, we find that the association between the ranked F-score and the likelihood of acquiring a
private firm is positive and significant (p < 0.001), with an average marginal effect equivalent to
a 0.5% increase the likelihood of acquiring at least one firm for every decile shift in F-score. In
our main tests, we did not find an association between misreporting and the likelihood of
acquiring a private target firm. We also find that high F-score firms do not acquire more firms
conditional on doing at least one deal and are not more likely to acquire subsidiaries or opt for
termination fees.20 [My read of this paragraph is that a some of our main results are not
quantitatively similar to the main results – either we should say that the result are qualitatively
20 In untabulated results, we also compare our set of fraud firms to a sample of non-fraud firms matched on industry,
size, and ROA. The results are qualitatively similar.
24
similar and stop there, or we probably ought to think about how many of the main results hold
and how many don’t and disclose that in some reasonable way]
5.3. The endogeneity issue
In this section, we consider the endogeneity issue underlying our main results. One form of
endogeneity is reverse causality. In our main analysis, we take the firm’s decision to commit
fraud as given and examine its subsequent acquisition activities. The reverse causality argument
suggests that firms misreport financial information in anticipation of acquisitions. We view
reverse causality as unlikely for several reasons. First, we introduce a lead-lag relation in our
research design by requiring the initial merger announcement date to be later than the fraud
starting date.21 Second, we include the acquirer’s market-to-book ratio to proxy for mispricing-
related effects, and doing so does not affect the results reported above. In robustness tests, we
also include past returns as an additional mispricing proxy and find comparable results. Finally,
reverse causality might explain our finding of acquisition frequency (Section 4.1) but has no
prediction on other main findings (Sections 4.2 – 4.4). For example, reverse causality does not
explain why fraud firms tend to close the deal in the last week of fiscal quarter or why fraud
firms tend to pick less transparent targets.
Another form of endogeneity is the omitted variable problem. Namely, both fraud and
acquisitions are driven by some omitted variables that we do not control for in our analyses. For
example, bad CEOs may commit fraud and at the same time make bad acquisitions. Recent
research suggests that managerial confidence and incentive structures impact the way they make
21 One caveat is that nonpublic negotiations begin about six months prior to the actual announcement (Heitzman,
2011). This suggests that some of the deals announced in the early part of the fraud may have been initiated before the misreporting occurred. To address this, we rerun our analysis using the timing of the acquisitions presumed initiation date, which is the announcement date less six months. This treats acquisitions announced in the first six months of the misreported period as part of the pre-fraud period. The results are similar.
25
acquisitions. Overconfident managers (Malmendier and Tate, 2008) are more likely to make
acquisitions but also tend to overpay. CEOs with illiquid equity portfolios tend to make
diversifying acquisitions and are more likely to pay with stock (Cai and Vijh, 2007). This raises
the question of whether our results can be explained by unobservable characteristics of fraud
firm managers or unobservable firm characteristics that drive both their incentive to manipulate
accounting information and their acquisition decisions.22
To address the omitted variable problem, we conduct additional tests by benchmarking
decisions during the fraud years against those in the pre-fraud years. Specifically, we compare
the acquisition of fraud firms during the alleged fraud to those same firms before the alleged
fraud. If our evidence is driven by an unobservable manager or firm effect, we expect to see no
differences in acquisition behavior before and during the fraud. One complicated issue is to
identify the true start date of the misreporting. The starting date is based on allegations in the
SEC’s enforcement release, and these are often ambiguous or constrained by a federal statute of
limitations (private actions are even more constrained). We drop the two years directly before the
start of the alleged fraud date to mitigate the impact of noise in fraud start dates.23 We find
similar results to those reported above if we compare fraud firms during the misreporting period
to the same fraud firms during a pre-fraud period that ends two years before the alleged
misreporting begins. These results suggest that omitted variables are unlikely to explain our main
results.
22 Empirically, however, there is little evidence to support a link between financial misreporting and either
managerial confidence or incentives. Schrand and Zechman (2012) test whether overconfident managers are more likely to commit fraud and find mixed evidence. Bergstresser and Phillipon (2006), Erickson et al. (2006), Efendi et al. (2007), and Armstrong et al. (2010) test the link between equity incentives and fraud, but find mixed evidence.
23 Another possibility is to use post-fraud comparisons as the control sample, but managers are often let go even go to jail after the fraud.
26
6. Conclusion
In this paper, we analyze the implications of aggressive accounting manipulation for
corporate investment through acquisitions. A recent stream of literature in accounting and
finance has produced many interesting results on how agency costs, incentive contracts, and
corporate governance mechanisms shape the frequency and form of a firm’s acquisitions. We
add to this body of evidence by analyzing the acquisition behavior of a set of firms whose
managers face strong incentives to conceal their misstatements.
For a sample of 283 firms accused of committing accounting fraud by the SEC between 1985
and 2003, we find that fraud firms are more likely than non-fraud firms to make successful
acquisitions during the period of the alleged fraud. In years that firms make at least one
acquisition, fraud firms are more active in both the number and aggregate size of the deals they
pursue. Not only are fraud firms more likely to do an acquisition, they also increase the fraction
of total investment expenditures allocated to acquisitions. At the deal level, misreporting
acquirers are more likely to make diversifying acquisitions and purchase subsidiaries rather than
stand-alone firms. Misreporting firms are also more likely to demand termination fee
agreements, complete acquisitions more rapidly during the fraud window, and are more likely to
close an acquisition in the final week of a fiscal quarter.
Overall, these results are consistent with the conclusion that misreporting managers engage
in acquisitions to help conceal and perpetuate the accounting manipulation. We find little
evidence that the risk the fraud will be detected during negotiations deters managers from
pursuing acquisitions. Rather, our results suggest that managers use acquisitions that—after the
deal closes—obscure the firm’s accounting information and make misreporting harder to detect.
Consistent with this result, we also find that the stock price correction is delayed when a

27
misreporting firm makes an acquisition during the first year of the alleged fraud. Using
alternative approaches to identify misreporting firms and control for manager-specific effects we
find consistent evidence that managers use acquisitions to conceal misreporting.
28
References Aboody, D., M. Barth, and R. Kasznik. 1999. Revaluations of fixed assets and future firm
performance: Evidence from the U.K. Journal of Accounting and Economics 26, 149 – 178. American Law Institute, 1992. Principles of Corporate Governance: Analysis and
Recommendations. American Law Institute Publishers: St. Paul, Minnesota. Amihud Y., Lev, B., 1981. Risk reduction as a managerial motive for conglomerate mergers.
Bell Journal of Economics 12, 605 – 617. Armstrong, C., Jagolinzer, A., Larcker, D., 2010. Chief executive officer equity incentives and
accounting irregularities. Journal of Accounting Research 48, 225 – 271. Bates, T., Lemmon, M., 2003. Breaking up is hard to do? An analysis of termination fee
provisions and merger outcomes. Journal of Financial Economics 69, 469 – 504. Bens, D., Goodman, T., Neamtiu, M., 2012. Does investment-related pressure lead to
misreporting? An analysis of reporting following M&A transactions. The Accounting Review 87, 839 – 865.
Bergstresser, D., Philippon, T., 2006. CEO incentives and earnings management. Journal of
Financial Economics 80, 511 – 529. Burns, N., Kedia, S., 2006. The impact of CEO incentives on misreporting. Journal of Financial
Economics 79, 35 – 67. Cai, J., Vijh, A., 2007. Incentive effects of stock and option holdings of target and acquirer
CEOs. Journal of Finance 62, 1891 – 1933. Chen, S., Thomas, J., Zhang, X.F., 2011. Income spring-loading when no one is looking?
Earnings management by acquisition targets between takeover announcement and completion. Working paper, Yale University.
Dechow, P., Ge, W., Larson, C., Sloan, R., 2011. Predicting material accounting misstatements.
Contemporary Accounting Research 28, 17 – 82. Dyck, A., Morse, A., Zingales, L., 2010. Who blows the whistle on corporate fraud? Journal of
Finance 65, 2213 – 2253. Efendi, J., Srivastava, A., Swanson, E., 2007. Why do corporate managers misstate financial
statements? The role of option compensation and other factors. Journal of Financial Economics 85, 667 – 708.
Erickson, M., Hanlon, M., Maydew, E., 2006. Is there a link between executive equity incentives
and accounting fraud? Journal of Accounting Research 44, 113 – 143.

29
Erickson, M., Wang, S., 1999. Earnings management by acquiring firms in stock for stock
mergers. Journal of Accounting and Economics 27, 149-176. Fich, E., Shivdasani, A., 2007. Financial fraud, director reputation, and shareholder wealth.
Journal of Financial Economics 86, 306-336. Fuller, K., Netter, J., Stegemoller, M., 2002. What do returns to acquiring firms tell us? Evidence
from firms that make many acquisitions. Journal of Finance 57, 1763 – 1784. Goldman, E., Slezak, S., 2006. An equilibrium model of incentive contracts in the presence of
information manipulation. Journal of Financial Economics 80, 603 –626. Gong, G., Louis, H., Sun, A., 2008. Earnings management, lawsuits, and stock-for-stock
acquirers’ market performance. Journal of Accounting and Economcs 46, 62-77. Graham, J., Li, S., Qiu, J., 2008. Corporate misreporting and bank loan contracting. Journal of
Financial Economics 89, 44 – 61. Grinstein, Y., Hribar, P., 2004. CEO compensation and incentives: Evidence from M&A
bonuses. Journal of Financial Economics 73, 119 – 143. Harford, J., 1999. Corporate cash reserves and acquisitions. Journal of Finance 54, 1969 – 1997. Heitzman, S., 2011. Equity grants to target CEOs during deal negotiations. Journal of Financial
Economics 102, 251 – 271. Hirshleifer, D., Teoh, S.H., 2003. Limited attention, information disclosure, and financial
reporting. Journal of Accounting and Economics 36, 337 – 386. Jensen, M., 1986. Agency costs of free cash flow, corporate finance, and takeovers. American
Economic Review 6, 323 – 329. Karpoff, J., Lee, D., Martin, G., 2008a. The costs to firms of cooking the books. Journal of
Financial and Quantitative Analysis 43, 581 – 612. Karpoff, J., Lee, D., Martin, G., 2008b. The costs to managers of cooking the books. Journal of
Financial Economics 88, 193 – 215. Karpoff, J., Koester, A., Lee, D.S., Martin, G., 2012. A critical analysis of databases used in
financial misconduct research. Working paper, University of Washington. Kedia, S., Philippon, T., 2009. The economics of fraudulent accounting. Review of Financial
Studies 22, 2169 – 2199.
30
Kravet, T., Myers, L., Sanchez, J.M., Scholz, S., 2012. Do financial statement misstatements facilitate corporate acquisitions? Working paper, University of Kansas.
Louis, H., 2004. Earnings management and the market performance of acquiring firms. Journal of
Financial Economics 74 (1), 121-148. Malmendier, U., Tate, G., 2008. Who makes acquisitions? CEO overconfidence and the market’s
reaction. Journal of Financial Economics 89, 20 – 43. McNichols, M., Stubben, S., 2008. Does earnings management affect firms’ investment
decisions? The Accounting Review 83: 1571-1603. Moeller, S., Schlingemann, F., Stulz, R., 2004. Firm size and gains from acquisitions. Journal of
Financial Economics 73, 201 – 228. Morck, R., Shleifer, A., Vishny R., 1990. Do managerial objectives drive bad acquisitions?
Journal of Finance 45, 31 – 48. Officer, M., 2003. Termination fees in mergers and acquisitions. Journal of Financial Economics
69, 431 – 467. Officer, M., 2004. Collars and renegotiation in mergers and acquisitions. Journal of Finance 59,
2719 – 2743. Officer, M., 2007. The price of corporate liquidity: Acquisition discounts for unlisted targets.
Journal of Financial Economics 83, 571 – 598. Rodrigues, U., Stegemoller, M., 2007. An inconsistency in SEC disclosure requirements? The
case of the “insignificant” private target. Journal of Corporate Finance 13, 251 – 269. Schrand, C., Zechman, S., 2012. Executive overconfidence and the slippery slope to financial
misreporting. Journal of Accounting and Economics 53, 311 – 329. Schwert, G.W., 1996. Markup pricing in mergers and acquisitions. Journal of Financial
Economics 41, 153 – 192. Schwert, G.W., 2000. Hostility in takeovers: in the eyes of the beholder? Journal of Finance 55,
2599 – 2640. Shleifer, A., Vishny, R., 2003. Stock market driven acquisitions. Journal of Financial Economics
70, 295 – 311. Travlos, N., 1987. Corporate takeover bids, method of payment, and bidding firm’s stock returns.
Journal of Finance 52, 943 – 963. Wang, T., 2011. Corporate securities fraud: Insights form a new empirical framework. Journal of
Law, Economics, and Organization, Forthcoming.

31
Zhang, I., Zhang, Y., 2007. Accounting discretion and purchase price allocation after
acquisitions. Working paper, University of Minnesota.

32
Figure 1a Distribution of deal close dates relative to nearest fiscal quarter end of acquiring firm for
fraud and non-fraud acquirers – all deals
Figure 1b Distribution of deal close dates relative to nearest fiscal quarter end of acquiring firm for
fraud and non-fraud acquirers – large deals (VT/VA ≥ 0.1)
0
5
10
15
20
25
-6 -5 -4 -3 -2 -1 0 1 2 3 4 5 6
% o
f dea
ls
Closing week of deal relative to nearest quarter end 0 = deal closes final week of fiscal quarter
Non-fraud
Fraud
0
5
10
15
20
25
30
35
-6 -5 -4 -3 -2 -1 0 1 2 3 4 5 6
% o
f dea
ls
Closing week of deal relative to nearest quarter end 0 = deal closes final week of fiscal quarter
Non-fraud
Fraud
33
Table 1 - Descriptive statistics This table provides descriptive statistics of fraud firms identified using the AAER sample. Pre-fraud AAER years include up to three years prior to the first year of the alleged fraud. AAER years include the fiscal years in which the alleged fraud occurred. Non-fraud firms are all firms not in the AAER sample at any point. MVE is market value of equity at the end of the year per Compustat. Market-to-book is equal to (Total assets – book equity + market equity) / Total assets. EBITDA is operating income before depreciation. Transaction value is the price paid for target equity based on SDC. Target sales and EBITDA are for the last year before the acquisition and reported by SDC. Sample statistics cover the period 1982 through 2005. Means are reported with medians in brackets. Value is the price paid for the target, or the equity value of the acquirer 3 months before deal announcement. AssetsA and SalesA are the book value of assets and sales of the acquiring firm before the acquisition. Announcement CAR is the 3-day return relative to the value-weighted market return surrounding the announcement of the deal. Completion time is the number of days between announcement and close and is reported only for successful deals that closed on a different date than announcement. Diversifying deals are those in which the target’s 2-digit SIC code differs from the acquirer. All other target and deal variables drawn from SDC. ***, **, and * represent p-value of difference from column (1) based on t-test for means, Wilcoxon rank-sum test for medians, at the 0.01, 0.05, and 0.1 levels. Firm characteristics are reported in Panel A, deal characteristics reported in Panel B. Firm variables are measured at the end of the year. Panel A: Acquiring firm characteristics
Fraud years Pre-fraud years Post-fraud years Non-fraud firms (1) (2) (3) (4)
Firm-years 644 620 669 127,175
MVE ($B) 6.19 [0.18] 5.05 [0.20] 3.44*** [0.14]** 1.52*** [0.10]***
Sales ($B) 3.42 [0.18] 2.67 [0.15]** 2.93 [0.22] 1.42*** [0.12]***
Market-to-book 1.99 [1.54] 2.09 [1.60] 1.80*** [1.36]*** 1.71*** [1.26]***
Debt / Assets 0.29 [0.25] 0.25*** [0.22]*** 0.62 [0.26] 0.25*** [0.20]***
Cash / Assets 0.12 [0.06] 0.14* [0.06] 0.14** [0.08]*** 0.15*** [0.07]***
EBITDA/Assets 0.04 [0.08] 0.09*** [0.12]*** 0.01** [0.07]** 0.06** [0.09]***
Net income / Assets -0.06 [0.01] 0.00*** [0.04]*** -0.09*** [-0.01]*** -0.02*** [0.02]***
CapEx / Assets 0.09 [0.04] 0.11 [0.05]* 0.05*** [0.03]*** 0.08 [0.04]**
R&D / Assets 0.06 [0.00] 0.07 [0.00] 0.07 [0.03]** 0.06*** [0.00]***
M&A / Assets 0.10 [0.00] 0.13* [0.00] 0.03*** [0.00]*** 0.04*** [0.00]***
M&A / Investment 0.14 [0.00] 0.15 [0.00] 0.07*** [0.00]*** 0.08*** [0.00]***
≥ 1 bid attempt? 0.20 0.22 0.12*** 0.11***
≥ 1 successful bid? 0.20 0.21 0.11*** 0.10***
# successful deals 2.33 1.00 1.88** 1.00 1.62** 1.00*** 1.43*** 1.00***
34
Table 1 (cont’d) - Descriptive statistics Panel B: Deal Characteristics
Fraud deals Pre-fraud deals Post-fraud deals Non-AAER firm
deals (1) (2) (3) (4)
# of deals 307 259 128 20,232
Transaction value ($B) 1.00 [0.08] 1.03 [0.08] 0.36 [0.07] 0.38*** [0.06]***
Target sales1 ($B) 0.66 [0.08] 0.74 [0.07] 0.92 [0.14] 0.54 [0.07]
Target EBITDA2 ($B) 0.15 [0.01] 0.19 [0.01] 0.12 [0.01] 0.09 [0.01]
ValueT / ValueA 0.13 [0.02] 0.25** [0.05]*** 0.17 [0.04] 0.35*** [0.09]***
ValueT / AssetsA 0.17 [0.05] 0.24* [0.07]*** 0.17 [0.04]** 0.21 [0.06]***
SalesT / SalesA1 0.19 [0.05] 0.26 [0.08] 0.21 [0.06] 0.33*** [0.11]***
Announcement CAR (%) 0.20 [0.32] 0.97 [0.49] 0.56 [0.37] 0.79 [0.22]
Comp. time (in days)3 87 [59] 89 [74]** 106 [68]** 110*** [81]***
Target is:
Private (0,1) 0.71 0.65 0.80** 0.74
Subsidiary (0,1) 0.36 0.23*** 0.38 0.34
Foreign (0,1) 0.27 0.17*** 0.27 0.18***
Diversifying (0,1) 0.60 0.43*** 0.48** 0.43***
All cash (0,1) 0.56 0.47** 0.66* 0.61
All stock (0,1) 0.29 0.40*** 0.16*** 0.25*
Term. fee (0,1) 0.20 0.20 0.10** 0.12***
Collar bid (0,1) | Stock 0.09 0.04 0.07 0.04**
Successful (0,1) 0.97 0.94* 0.91*** 0.94** 1142, 138, 39, and 8,846 observations respectively 2104, 102, 25, and 5,516 observations respectively 3Where deal is successful and not effective on date announced. 222, 185, 86, and 14,890 observations respectively
35
Table 2 - Fraud firms and deal activity This table provides evidence on acquisition activity of firms alleged to have engaged in fraud by the SEC. The sample includes all available firm-year observations between 1982 and 2005. The first column reports the results from a logistic regression of the likelihood of announcing a successful deal during the fiscal year. The second (third) column reports the results from an OLS regression of the number of successful deals (value of acquisitions scaled by beginning assets) conditional on the firm announcing at least one successful deal during the year. The fourth column reports the results where the dependent variable is the fraction of all investment (capital expenditures, research and development, and acquisitions) during the year represented by acquisitions. Only firms with positive investment are included. Independent variables are measured at the beginning of the year. Market-to-book assets are equal to (Total assets – book equity + market equity) / Total assets. EBITDA is calculated using prior year operating income before depreciation. The fraud year indicator equals one for fraud firms during periods of alleged fraud according to an AAER. Year and industry dummies (based on Fama-French 12 industry classifications) are included. Marginal effects from logistic regression reported (OLS coefficients in regression 3) with t-statistics in parenthesis.
Dependent variable =
Pr( ≥ 1 successful offer = 1)
# of successful bids
Acquisitions / Assets
Acquisitions / All investment
(1) (2) (3) (4) Fraud year (0,1) 0.037 (3.92) 0.736 (8.00) 0.071 (1.84) 0.039 (4.26) log(MVE) 0.034 (80.52) 0.138 (28.60) -0.120 (-59.34) 0.021 (61.88) Market-to-book assets -0.008 (-8.94) -0.006 (-0.62) 0.180 (43.15) -0.008 (-11.76) EBITDA / Assets 0.013 (2.11) -0.668 (-8.74) -0.517 (-16.15) -0.040 (-9.36) Cash / Assets 0.022 (4.11) -0.088 (-1.44) 0.039 (1.54) -0.013 (-3.29) Debt / Assets 0.006 (2.26) 0.203 (5.56) 0.027 (1.78) -0.006 (-2.75)
Industry and announcement-year dummies Yes Yes Yes Yes Firm-year observations 130,918 13,951 13,951 118,471
Pseudo-R2 / Adj. R2 17.3% 8.02% 34.10% 7.21%
36
Table 3 - Fraud firms and ownership, location, and industry of target firms This table provides evidence on the types of targets chosen by firms accused of fraud. Sample includes 21,337 acquisition attempts between 1982 and 2005. Logistic regression estimated for binary dependent variable categorizing target type. Private targets are those not publicly traded. Foreign targets are those headquartered outside the U.S. Subsidiaries are those targets owned by another corporation as coded by SDC. A diversifying deal is a target with a 2-digit SIC code different from the acquirer. All control variables are measured at the beginning of the year. The fraud deal indicator equals one for fraud firms during periods of alleged fraud. Year and industry (Fama-French 12 industries) fixed effects included. Marginal effects reported with t-statistics in parenthesis. Dependent var. = Pr(Private = 1) Pr(Subsidiary = 1) Pr(Foreign = 1) Pr(Diversifying = 1) (1) (2) (3) (4) Fraud deal -0.018 (-0.74) 0.054 (2.10) 0.028 (1.55) 0.145 (5.04) log(MVE) -0.023 (-15.17) 0.018 (11.23) 0.033 (26.15) 0.021 (12.56) Market-to-book 0.019 (5.56) -0.033 (-8.56) -0.013 (-4.68) -0.003 (-0.80) EBITDA / Assets 0.130 (4.82) 0.075 (2.49) -0.079 (-3.34) -0.066 (-2.27) Cash / Assets 0.086 (3.94) -0.064 (-2.70) 0.100 (5.74) 0.054 (2.34) Debt / Assets 0.154 (9.17) 0.178 (11.30) 0.050 (4.13) 0.116 (6.85) Pseudo-R2 6.59% 9.87% 14.18% 6.59%
37
Table 4 – Deal failure and termination fees This table provides evidence on termination fee agreements and deal failure for firms accused of fraud. Sample includes 21,337 acquisition attempts between 1982 and 2005. Logistic regression estimated for binary dependent variable. Target termination fee agreements are identified using SDC. Failed deals are those deals that are publicly announced but not completed by the sample firm. All control variables are measured at the beginning of the year. The fraud deal indicator equals one for fraud firms during periods of alleged fraud. Announcement year and industry (Fama-French 12 industries) fixed effects included. Marginal effects reported with t-statistics in parenthesis.
Dependent variable = Pr (Termination fees = 1) Pr(Failed deal = 1) (1) (2) Fraud year deal (0,1) 0.029 (2.24) -0.022 (-1.21)
log(MVE) 0.004 (3.85) -0.004 (-4.69)
Relative size 0.008 (3.37) 0.019 (13.30)
Market-to-book assets 0.003 (1.51) 0.002 (1.27)
EBITDA / Assets 0.006 (0.31) -0.025 (-2.07)
Cash / Assets 0.004 (-0.51) 0.002 (0.24)
Debt / Assets -0.005 (-0.45) 0.010 (1.92)
Private target -0.231 (-54.55) -0.096 (-26.81)
Foreign target -0.147 (-20.96) -0.017 (-3.57)
Diversifying deal -0.006 (-1.52) 0.005 (1.51)
Termination fees -0.061 (-10.68) Pseudo-R2 / Adj. R2 52.40% 16.67%
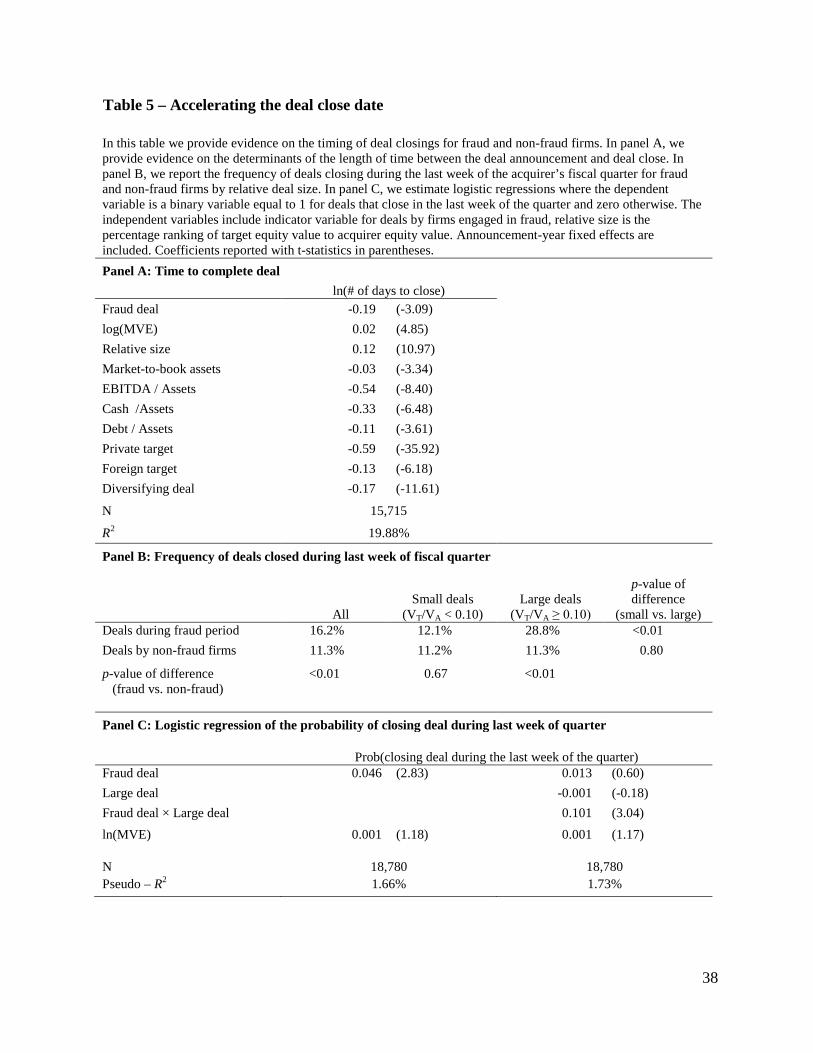
38
Table 5 – Accelerating the deal close date In this table we provide evidence on the timing of deal closings for fraud and non-fraud firms. In panel A, we provide evidence on the determinants of the length of time between the deal announcement and deal close. In panel B, we report the frequency of deals closing during the last week of the acquirer’s fiscal quarter for fraud and non-fraud firms by relative deal size. In panel C, we estimate logistic regressions where the dependent variable is a binary variable equal to 1 for deals that close in the last week of the quarter and zero otherwise. The independent variables include indicator variable for deals by firms engaged in fraud, relative size is the percentage ranking of target equity value to acquirer equity value. Announcement-year fixed effects are included. Coefficients reported with t-statistics in parentheses. Panel A: Time to complete deal ln(# of days to close) Fraud deal -0.19 (-3.09) log(MVE) 0.02 (4.85) Relative size 0.12 (10.97) Market-to-book assets -0.03 (-3.34) EBITDA / Assets -0.54 (-8.40) Cash /Assets -0.33 (-6.48) Debt / Assets -0.11 (-3.61) Private target -0.59 (-35.92) Foreign target -0.13 (-6.18) Diversifying deal -0.17 (-11.61)
N 15,715
R2 19.88%
Panel B: Frequency of deals closed during last week of fiscal quarter
All Small deals
(VT/VA < 0.10) Large deals
(VT/VA ≥ 0.10)
p-value of difference
(small vs. large) Deals during fraud period 16.2% 12.1% 28.8% <0.01 Deals by non-fraud firms 11.3% 11.2% 11.3% 0.80
p-value of difference (fraud vs. non-fraud)
<0.01 0.67 <0.01
Panel C: Logistic regression of the probability of closing deal during last week of quarter
Prob(closing deal during the last week of the quarter) Fraud deal 0.046 (2.83) 0.013 (0.60) Large deal -0.001 (-0.18) Fraud deal × Large deal 0.101 (3.04) ln(MVE) 0.001 (1.18) 0.001 (1.17) N 18,780 18,780 Pseudo – R2 1.66% 1.73%
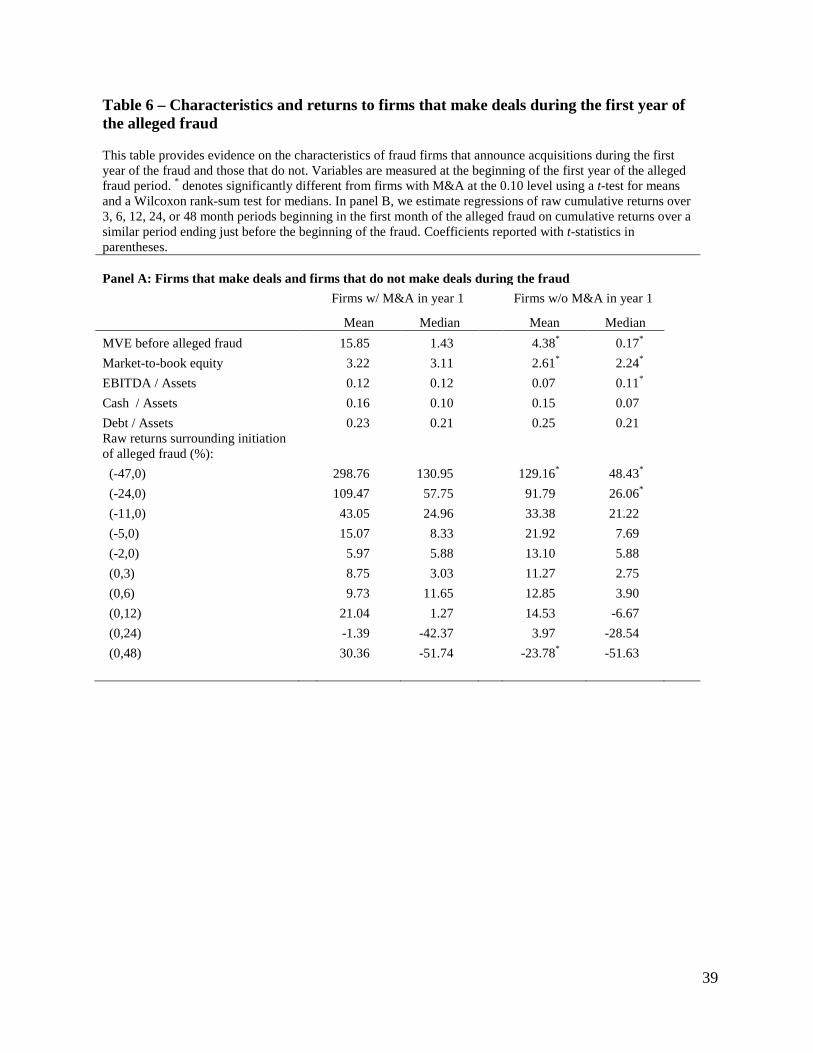
39
Table 6 – Characteristics and returns to firms that make deals during the first year of the alleged fraud This table provides evidence on the characteristics of fraud firms that announce acquisitions during the first year of the fraud and those that do not. Variables are measured at the beginning of the first year of the alleged fraud period. * denotes significantly different from firms with M&A at the 0.10 level using a t-test for means and a Wilcoxon rank-sum test for medians. In panel B, we estimate regressions of raw cumulative returns over 3, 6, 12, 24, or 48 month periods beginning in the first month of the alleged fraud on cumulative returns over a similar period ending just before the beginning of the fraud. Coefficients reported with t-statistics in parentheses. Panel A: Firms that make deals and firms that do not make deals during the fraud Firms w/ M&A in year 1 Firms w/o M&A in year 1
Mean Median Mean Median MVE before alleged fraud 15.85 1.43 4.38* 0.17* Market-to-book equity 3.22 3.11 2.61* 2.24* EBITDA / Assets 0.12 0.12 0.07 0.11* Cash / Assets 0.16 0.10 0.15 0.07 Debt / Assets 0.23 0.21 0.25 0.21 Raw returns surrounding initiation of alleged fraud (%): (-47,0) 298.76 130.95 129.16* 48.43* (-24,0) 109.47 57.75 91.79 26.06* (-11,0) 43.05 24.96 33.38 21.22 (-5,0) 15.07 8.33 21.92 7.69 (-2,0) 5.97 5.88 13.10 5.88 (0,3) 8.75 3.03 11.27 2.75 (0,6) 9.73 11.65 12.85 3.90 (0,12) 21.04 1.27 14.53 -6.67 (0,24) -1.39 -42.37 3.97 -28.54 (0,48) 30.36 -51.74 -23.78* -51.63
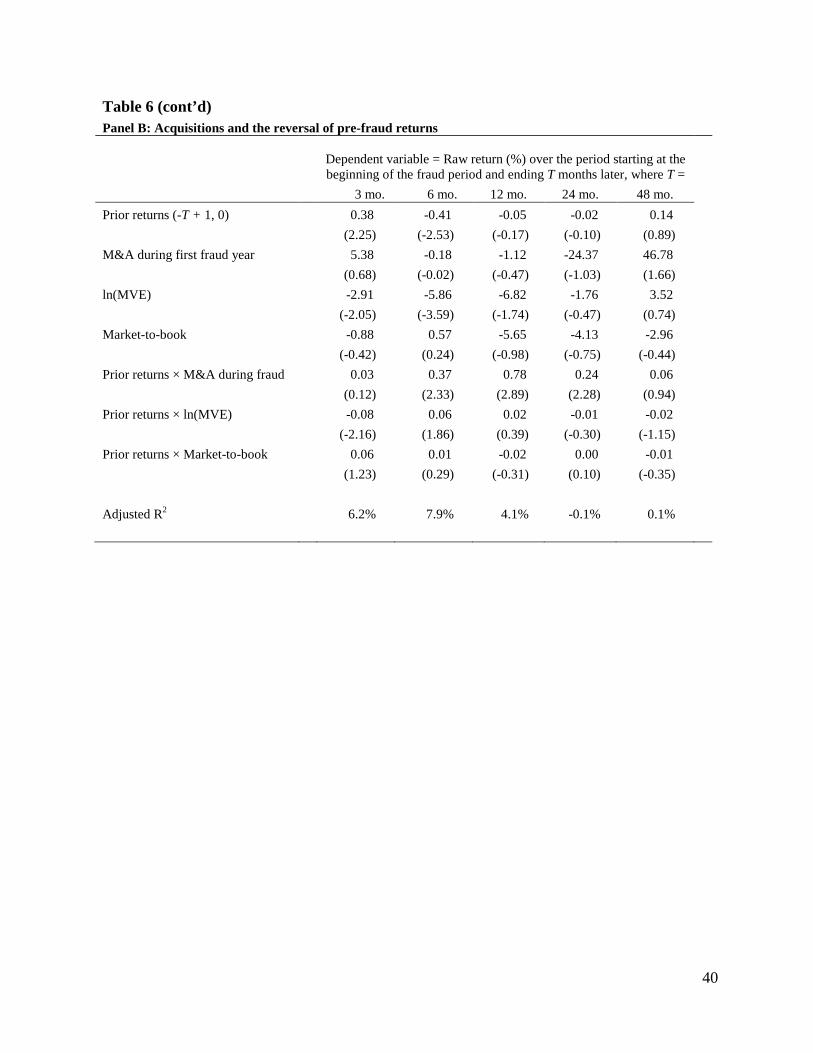
40
Table 6 (cont’d) Panel B: Acquisitions and the reversal of pre-fraud returns
Dependent variable = Raw return (%) over the period starting at the beginning of the fraud period and ending T months later, where T =
3 mo. 6 mo. 12 mo. 24 mo. 48 mo. Prior returns (-T + 1, 0) 0.38 -0.41 -0.05 -0.02 0.14 (2.25) (-2.53) (-0.17) (-0.10) (0.89) M&A during first fraud year 5.38 -0.18 -1.12 -24.37 46.78 (0.68) (-0.02) (-0.47) (-1.03) (1.66) ln(MVE) -2.91 -5.86 -6.82 -1.76 3.52 (-2.05) (-3.59) (-1.74) (-0.47) (0.74) Market-to-book -0.88 0.57 -5.65 -4.13 -2.96 (-0.42) (0.24) (-0.98) (-0.75) (-0.44) Prior returns × M&A during fraud 0.03 0.37 0.78 0.24 0.06 (0.12) (2.33) (2.89) (2.28) (0.94) Prior returns × ln(MVE) -0.08 0.06 0.02 -0.01 -0.02 (-2.16) (1.86) (0.39) (-0.30) (-1.15) Prior returns × Market-to-book 0.06 0.01 -0.02 0.00 -0.01 (1.23) (0.29) (-0.31) (0.10) (-0.35) Adjusted R2 6.2% 7.9% 4.1% -0.1% 0.1%