Embed Size (px)
Citation preview
University of New MexicoUNM Digital Repository
Civil Engineering ETDs Engineering ETDs
2-1-2016
THE EFFECT OF BIOFILM CARRIERLENGTH ON NITRIFICATION IN MOVINGBED BIOFILM REACTORS: ANEXAMINATION OF MIXING INTENSITY,SHOCK LOADINGS, AND PH CHANGESKody Garcia
Follow this and additional works at: https://digitalrepository.unm.edu/ce_etds
This Thesis is brought to you for free and open access by the Engineering ETDs at UNM Digital Repository. It has been accepted for inclusion in CivilEngineering ETDs by an authorized administrator of UNM Digital Repository. For more information, please contact [email protected].
Recommended CitationGarcia, Kody. "THE EFFECT OF BIOFILM CARRIER LENGTH ON NITRIFICATION IN MOVING BED BIOFILMREACTORS: AN EXAMINATION OF MIXING INTENSITY, SHOCK LOADINGS, AND PH CHANGES." (2016).https://digitalrepository.unm.edu/ce_etds/115
i
Kody A. Garcia
Candidate
Civil Engineering
Department
This thesis is approved, and it is acceptable in quality and form for publication:
Approved by the Thesis Committee:
Andrew J. Schuler, Chairperson
Kerry Howe
José M. Cerrato
ii
THE EFFECT OF BIOFILM CARRIER LENGTH ON NITRIFICATION IN
MOVING BED BIOFILM REACTORS: AN EXAMINATION OF MIXING
INTENSITY, SHOCK LOADINGS, AND PH CHANGES
by
KODY A. GARCIA
B.S. EARTH AND PLANETARY SCIENCES
THESIS
Submitted in Partial Fulfillment of the
Requirements for the Degree of
Master of Science
Civil Engineering
The University of New Mexico
Albuquerque, New Mexico
December 2015

iii
ACKNOWLEDGMENTS
I would like to thank Dr. Schuler, my advisor and committee chair, for the
guidance and assistance in completing this study, and for the detailed teaching in both
the classroom and in professional writing. His education will guide me in my career and
allow me to be successful as I begin my engineering career outside of academia.
I also wish thank committee members, Dr. Howe and Dr. Cerrato, for their
continued advice and recommendations through the duration of this study. Additionally,
I want thank Dr. Howe and Dr. Cerrato for their thorough teaching methods in the
classroom which will stick with me throughout my career.
I want to express immense gratitude to The Center for Water and the
Environment: Center of Research Excellence in Science and Technology through the
National Science Foundation for funding this project and for covering tuition expenses in
my master’s program.
Lastly, I must thank my family, my friends, and my pets for their seemingly
limitless understanding and support of me and my aspirations.
iv
THE EFFECT OF BIOFILM CARRIER LENGTH ON NITRIFICATION IN MOVING BED BIOFILM
REACTORS: AN EXAMINATION OF MIXING INTENSITY, SHOCK LOADINGS, AND PH
CHANGES
by
Kody A. Garcia
B.S., Earth and Planetary Sciences, University of New Mexico, 2012
M.S, Civil Engineering, University of New Mexico, 2015
ABSTRACT
Biofilms grown on free-floating attachment surfaces, as in integrated fixed film activated
sludg (IFAS) and moving bed bioreactors (MBBRs) are commonly used in wastewater
treatment, but little is known about how media geometry affects the biofilms and
process performance. The objective of this study was to compare nitrification and
growth of biofilms grown on different length media in bench-scale MBBRs. The carriers
were cut from high density polyethylene tubing with one media type one-third the
length of the other, but with inner and outer diameter dimensions identical. Each
bioreactor was continuously operated with coarse bubble aeration and provided with a
high ammonium loading to promote greatly active nitrifying communities. Biomass
measurements were taken regularly to observe growth. A series of variable velocity
gradient (G) batch tests was executed to determine the effect of mixing on mass
transfer through the biofilms of each media type. High ammonium and variable pH
v
batch tests were also conducted to assess inhibition effects on nitrifiers. Greater
biomass was consistently measured on the longer media despite both media types
having similar ammonia uptake during continuous operation. Lower G values
consistently produced greater ammonia utilization in the short media biofilm than in the
long media biofilm. However, at mid to high range G values, ammonia consumption was
similar between both biofilms. Ends of media typically had greater biomass and greater
nitrate production than middle sections, while ammonia consumption was similar along
carrier length. Abrupt changes in ammonium concentration and pH produced
significantly greater inhibition effects in the short media biofilm than in the long media
biofilm, suggesting greater protection in the biofilm grown on the longer media.
vi
TABLE OF CONTENTS
LIST OF FIGURES ................................................................................................... viii
LIST OF TABLES ....................................................................................................... xi
CHAPTER 1 INTRODUCTION...................................................................................1
Problem Statement .....................................................................................................1
Wastewater Treatment ..............................................................................................1
Research Objectives ...................................................................................................3
CHAPTER 2 BACKGROUND AND LITERATURE REVIEW ................................5
Nitrification in Nutrient Removal .............................................................................5
MBBR History............................................................................................................6
MBBR Retrofit to Municipal Wastewater Treatment ..............................................6
MBBR Media Design Effects .....................................................................................7
Nitrifier Inhibition in MBBRs ...................................................................................8
MBBR Media Differences ..........................................................................................8
Biofilm Mass Transport .............................................................................................9
CHAPTER 3 METHODS ............................................................................................ 12
Reactor Specifications .............................................................................................. 12
Media ........................................................................................................................ 13
Synthetic Feed .......................................................................................................... 15
MBBR Construction and Assembly ........................................................................ 17
vii
Reactor Operation .................................................................................................... 27
Batch Tests ............................................................................................................... 28
Analytical Methods .................................................................................................. 30
CHAPTER 4 RESULTS AND DISCUSSION ............................................................ 31
Continuous Performance ......................................................................................... 31
Biofilm Growth and Attachment ............................................................................. 33
Variable G Batch Testing ........................................................................................ 35
Variability along media length ................................................................................ 42
Shock Loading Inhibition ........................................................................................ 45
pH Inhibition ............................................................................................................ 47
CHAPTER 5 CONCLUSIONS ................................................................................... 53
REFERENCES ............................................................................................................ 55
APPENDIX A DAILY NITROGEN SPECIES MEASUREMENTS ........................ 59
APPENDIX B BIOMASS MEASUREMENTS .......................................................... 65
APPENDIX C NUTRIENT FEED AND WATER FEED CALCULATIONS .......... 69
viii
LIST OF FIGURES
Figure 1. Typical activated sludge system process with activated sludge recycle line……..2
Figure 2. The MBBR process does not require an activated sludge recycle due to the long
SRT provided by favorable attachment and growth of biomass to the free-floating
media……………………………………………………………………………………………………………………………..3
Figure 3. Various media types used in MBBR and IFAS systems (Ødegaard et al., 2000)…9
Figure 4. Illustration representing substrate transport through the mass transfer
boundary layer and into the biofilm according to Fick’s First Law and Monod kinetics…11
Figure 5. Schematic for continuous flow MBBRs……………………………………….………………….12
Figure 6. (a) R-Short media; (b) R-Long media; (c) Media cross section…………………………14
Figure 7. An example carrier is shown with the biologically active area (effective area) as
the striped surface…………………………………………………………………………………………..……..……15
Figure 8. MBBR body…………………………………………………………………………..…..……………….….18
Figure 9. MBBR lid and components………………………………………………………….………………...19
Figure 10. Water, nutrient, base, and pH setup………………………………………………..………….20
Figure 11. MBBR acid, effluent, and air setup…………………………………………………..………….22
Figure 12. Air flow and control for coarse bubble mixing……………………………………..………24
Figure 13. Water and nutrient feed storage…………………………………………………………..…….25
ix
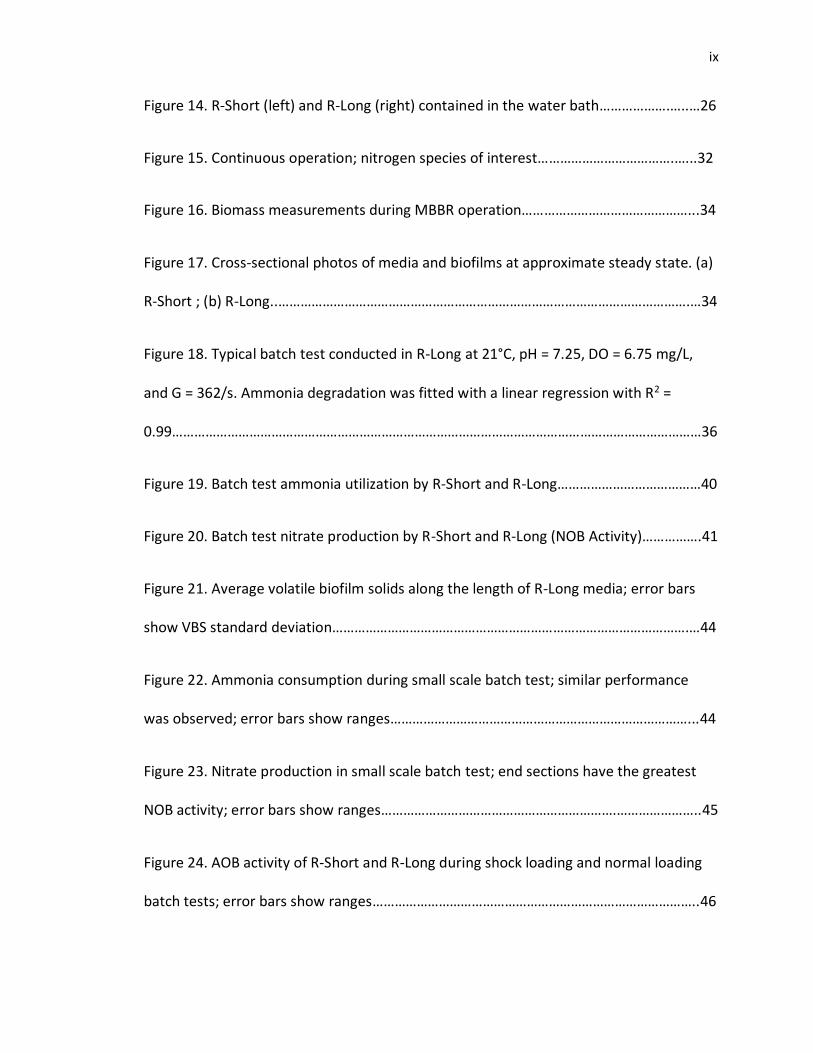
Figure 14. R-Short (left) and R-Long (right) contained in the water bath……………….…..…26
Figure 15. Continuous operation; nitrogen species of interest……………………………….…...32
Figure 16. Biomass measurements during MBBR operation………………………………………...34
Figure 17. Cross-sectional photos of media and biofilms at approximate steady state. (a)
R-Short ; (b) R-Long..………………………………………………………………………………………………….…34
Figure 18. Typical batch test conducted in R-Long at 21°C, pH = 7.25, DO = 6.75 mg/L,
and G = 362/s. Ammonia degradation was fitted with a linear regression with R2 =
0.99………………………………………………………………………………………………………………………………36
Figure 19. Batch test ammonia utilization by R-Short and R-Long…………………………………40
Figure 20. Batch test nitrate production by R-Short and R-Long (NOB Activity)…………….41
Figure 21. Average volatile biofilm solids along the length of R-Long media; error bars
show VBS standard deviation…………………………………………………………………………………….…44
Figure 22. Ammonia consumption during small scale batch test; similar performance
was observed; error bars show ranges………………………………………………………………………...44
Figure 23. Nitrate production in small scale batch test; end sections have the greatest
NOB activity; error bars show ranges……………………………………………………….…………………..45
Figure 24. AOB activity of R-Short and R-Long during shock loading and normal loading
batch tests; error bars show ranges……………………………………………………………………………..46
x
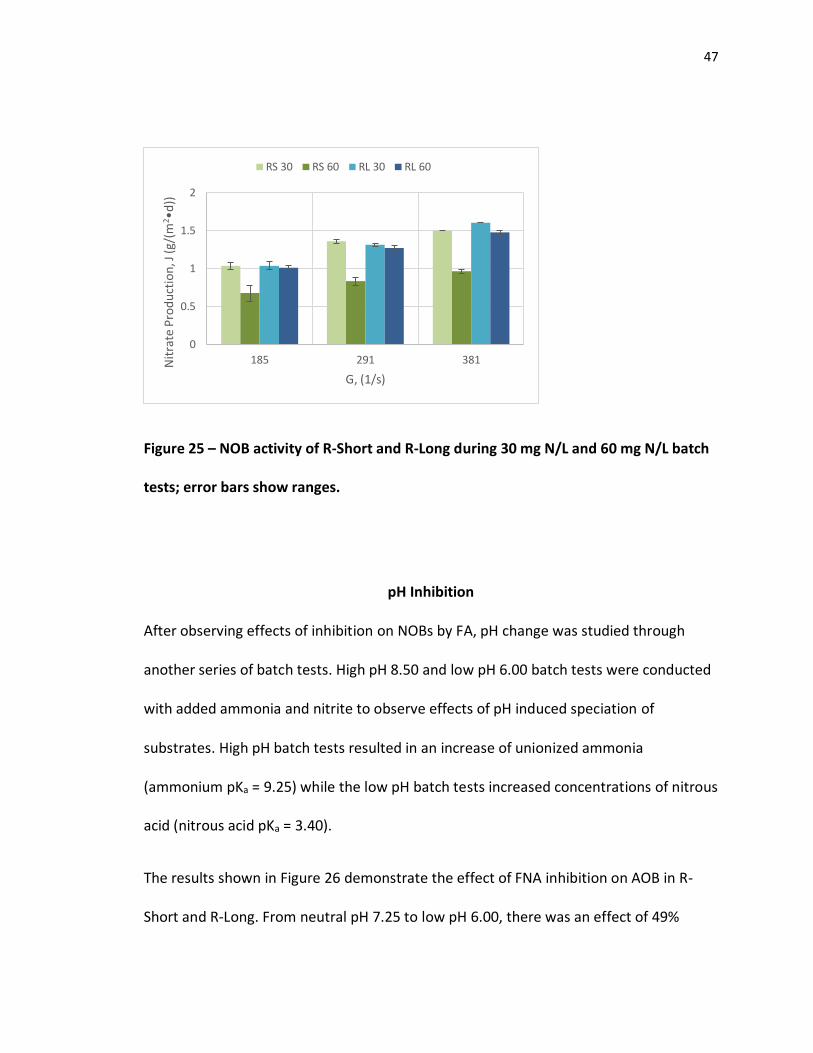
Figure 25. NOB activity of R-Short and R-Long during shock loading and normal loading
batch tests; error bars show ranges………………………………………………………………………..……47
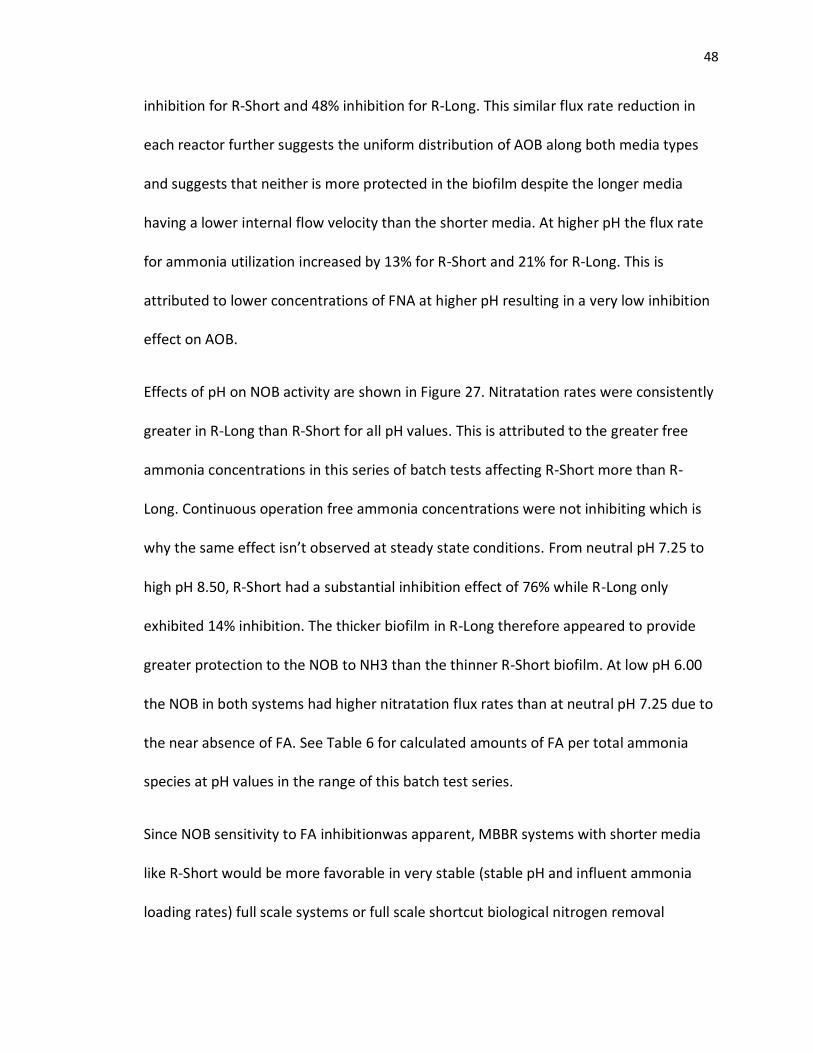
Figure 26. AOB activity during variable pH batch tests; error bars show ranges…………...49
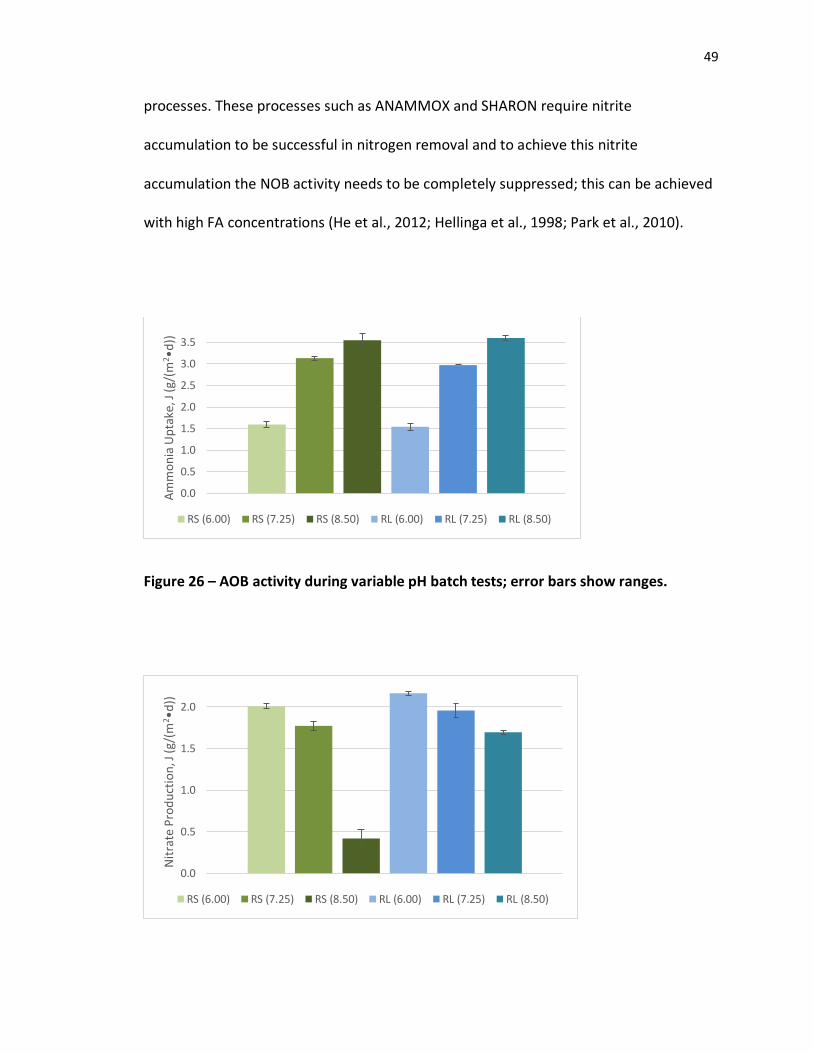
Figure 27. NOB activity during variable pH batch tests; error bars show ranges……….….50
Figure 28. AOB activity during low and neutral pH batch tests without added FNA; error
bars show ranges………………………………………………………………………………………………………...51
Figure 29. NOB activity during low and neutral pH batch tests without added FA; error
bars show ranges…………………………………………………………………………………………………………52
xi
LIST OF TABLES
Table 1. MBBR and media…………………………………………………………………………………………13
Table 2. Synthetic feed……………………………………………………………………………………………..17
Table 3. G values and corresponding air flow rates…………………………………………………..28
Table 4. TSS and VSS of Suspended Fluid…………………………………………………………………..35
Table 5. Summary of Flux and K Values…………………………………………………………………….41
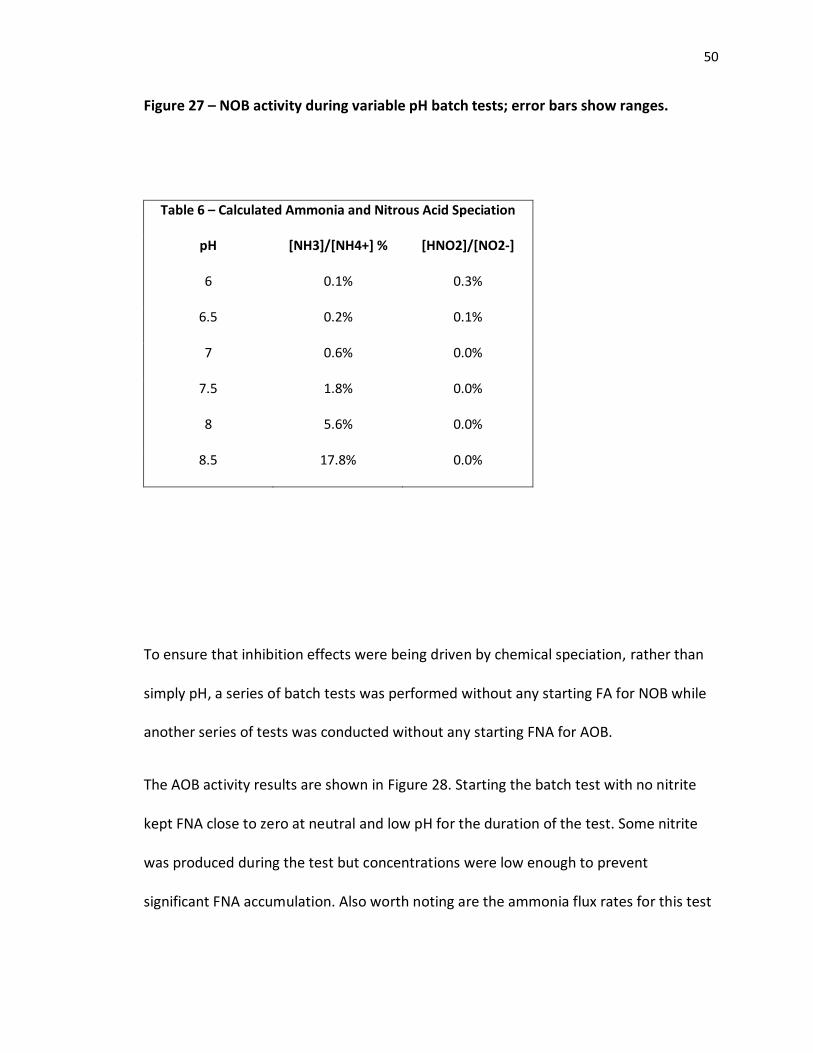
Table 6. Ammonia Speciation…………………………………………………………………………………...50
1
CHAPTER 1 INTRODUCTION
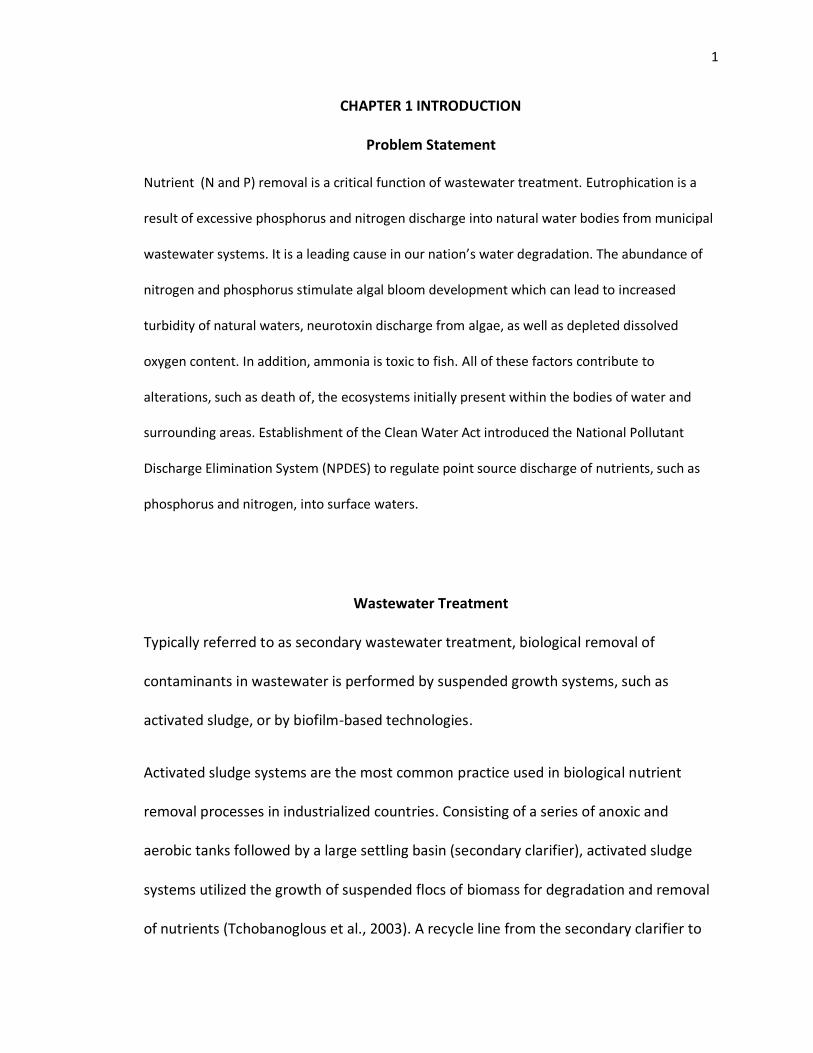
Problem Statement
Nutrient (N and P) removal is a critical function of wastewater treatment. Eutrophication is a
result of excessive phosphorus and nitrogen discharge into natural water bodies from municipal
wastewater systems. It is a leading cause in our nation’s water degradation. The abundance of
nitrogen and phosphorus stimulate algal bloom development which can lead to increased
turbidity of natural waters, neurotoxin discharge from algae, as well as depleted dissolved
oxygen content. In addition, ammonia is toxic to fish. All of these factors contribute to
alterations, such as death of, the ecosystems initially present within the bodies of water and
surrounding areas. Establishment of the Clean Water Act introduced the National Pollutant
Discharge Elimination System (NPDES) to regulate point source discharge of nutrients, such as
phosphorus and nitrogen, into surface waters.
Wastewater Treatment
Typically referred to as secondary wastewater treatment, biological removal of
contaminants in wastewater is performed by suspended growth systems, such as
activated sludge, or by biofilm-based technologies.
Activated sludge systems are the most common practice used in biological nutrient
removal processes in industrialized countries. Consisting of a series of anoxic and
aerobic tanks followed by a large settling basin (secondary clarifier), activated sludge
systems utilized the growth of suspended flocs of biomass for degradation and removal
of nutrients (Tchobanoglous et al., 2003). A recycle line from the secondary clarifier to
2
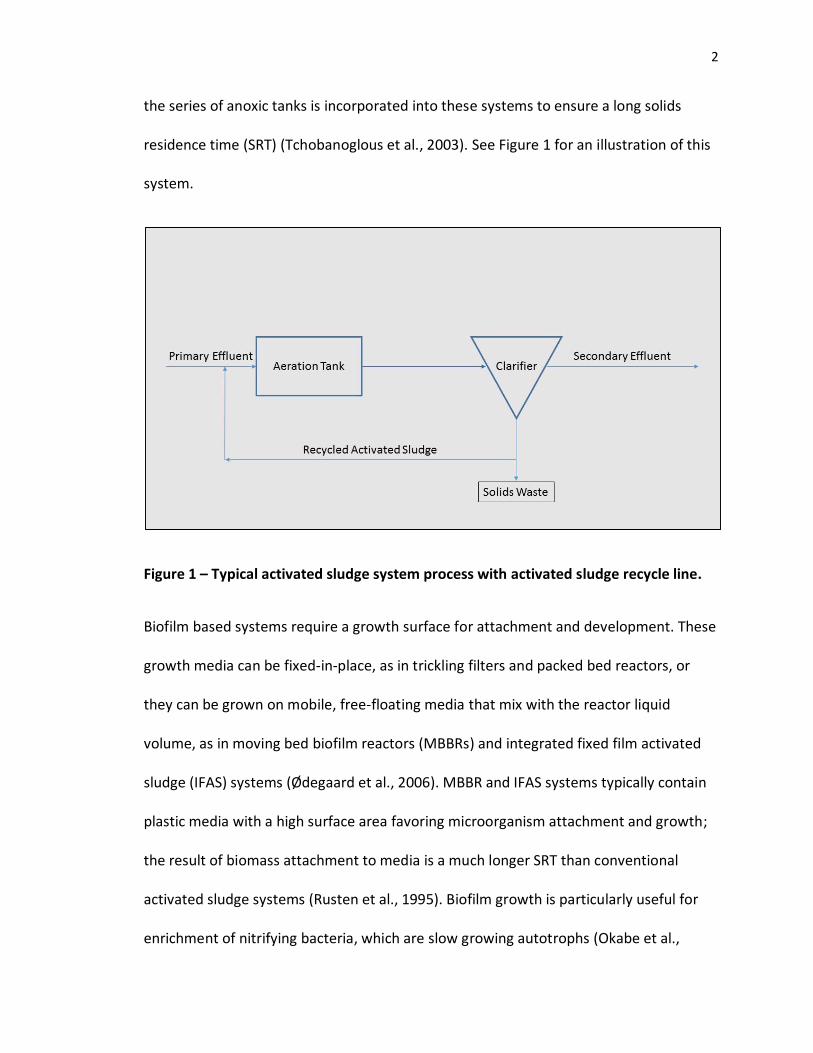
the series of anoxic tanks is incorporated into these systems to ensure a long solids
residence time (SRT) (Tchobanoglous et al., 2003). See Figure 1 for an illustration of this
system.
Figure 1 – Typical activated sludge system process with activated sludge recycle line.
Biofilm based systems require a growth surface for attachment and development. These
growth media can be fixed-in-place, as in trickling filters and packed bed reactors, or
they can be grown on mobile, free-floating media that mix with the reactor liquid
volume, as in moving bed biofilm reactors (MBBRs) and integrated fixed film activated
sludge (IFAS) systems (Ødegaard et al., 2006). MBBR and IFAS systems typically contain
plastic media with a high surface area favoring microorganism attachment and growth;
the result of biomass attachment to media is a much longer SRT than conventional
activated sludge systems (Rusten et al., 1995). Biofilm growth is particularly useful for
enrichment of nitrifying bacteria, which are slow growing autotrophs (Okabe et al.,
3
1999). Mass transfer in biofilm systems is dependent on: (1) diffusion across the mass
transfer boundary layer and (2) diffusion into the biofilm driven by the concentration
gradient in existence between the bulk solution and the substrate-depleted biofilm
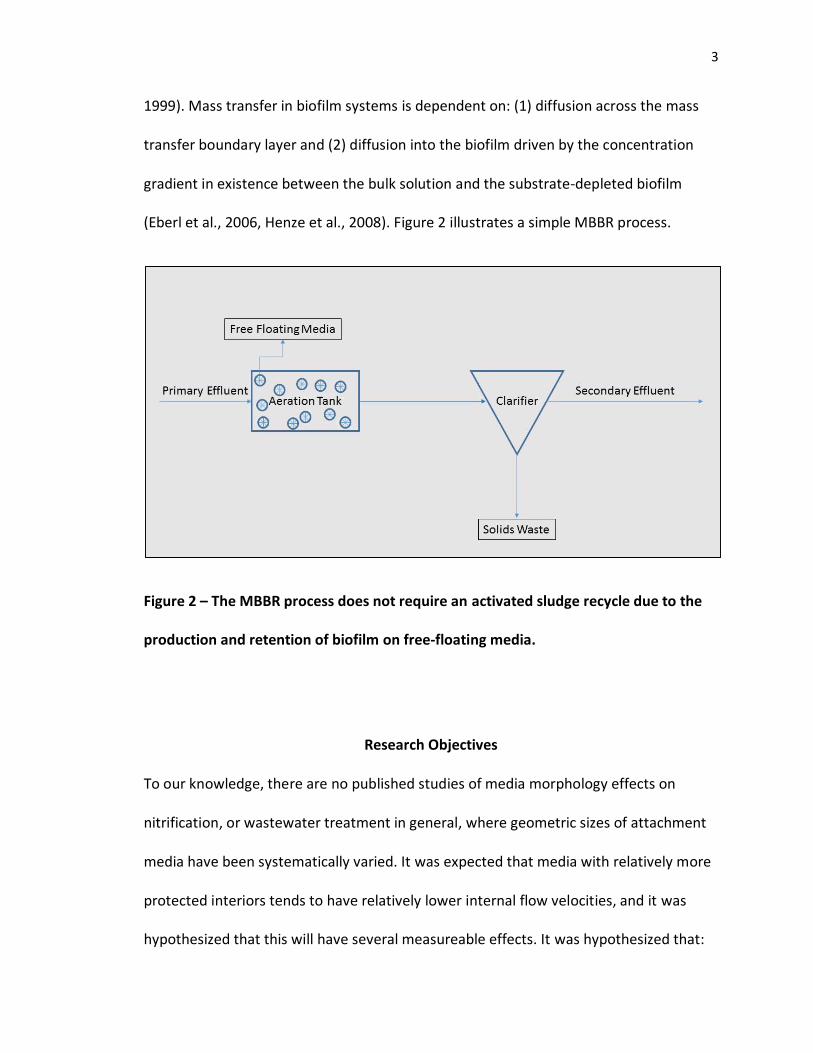
(Eberl et al., 2006, Henze et al., 2008). Figure 2 illustrates a simple MBBR process.
Figure 2 – The MBBR process does not require an activated sludge recycle due to the
production and retention of biofilm on free-floating media.
Research Objectives
To our knowledge, there are no published studies of media morphology effects on
nitrification, or wastewater treatment in general, where geometric sizes of attachment
media have been systematically varied. It was expected that media with relatively more
protected interiors tends to have relatively lower internal flow velocities, and it was
hypothesized that this will have several measureable effects. It was hypothesized that:
4
(1) Media with a relatively more protected interior would result in greater amounts of
biofilm due to less shearing of the biofilm surface.
(2) Media with relatively less protected interior has greater activity, due to greater
advective flow through the media and an increase in the “edge effect” suggested by
Bjornberg et al. 2009.
(3) The relationship between mixing rates and biofilm activity is dependent on media
geometry, with a more protected interior being more sensitive to mixing than a less
protected interior. This is due to a generally thicker laminar boundary layer in the more
protected media with greater potential to be reduced by mixing than the thinner
boundary layer in less protected media.
(4) Inhibition of AOB and NOB activity can be induced by increasing the inhibiting
species concentration with increased loading rates or by pH speciation of that
compound, but that a thicker biofilm grown in a more protected medium would be
more resistant to inhibition.
The objective of this study was to test these hypotheses with a systematic variation of
media geometry. The experimental approach was to operate laboratory scale MBBRs
containing media of variable length, with a focus on nitrification activity and inhibition
of said activity. A series of bench scale batch tests was also executed to assess the effect
of mixing on nitrification. A comparison of edge and inner interior biofilm activity was
5
also performed. A series of bench scale batch tests was also performed with shock
loadings and pH changes to measure inhibition effects.
CHAPTER 2 BACKGROUND AND LITERATURE REVIEW
Nitrification in Nutrient Removal
Nitrification (ammonia oxidation) is a critical process in wastewater treatment systems.
IFAS and MBBR systems are commonly used to increase rates of nitrification, as the slow
growing autotrophic nitrifying bacteria are enriched in biofilms, at least in part because
of the relatively long residence times inherent to biofilm growth.
Nitrification occurs in two steps: ammonia oxidation to nitrite (nitritation) by ammonia
oxidizing bacteria (AOBs) and nitrite oxidation to nitrate (nitratation) by nitrite oxidizing
bacteria (NOBs). Both steps in nitrification are shown in Reactions 1 and 2.
AOBs oxidize ammonium to nitrite with production of hydronium ion as a separate
product which results in pH reduction during secondary treatment:
2𝑁𝐻4+ + 3𝑂2 → 2𝑁𝑂2
− + 4𝐻+ + 2𝐻2𝑂 (1)
NOBs oxidize nitrite to nitrate:
2𝑁𝑂2− + 𝑂2 → 2𝑁𝑂3
− (2)
The total combined reaction is as follows (Reaction 3):
𝑁𝐻4+ + 2𝑂2 → 𝑁𝑂3
− + 2𝐻+ + 𝐻2𝑂 (3)
6
These bacteria use inorganic reduced carbon as their primary source for development
and are classified as chemoautotrophs (utilize inorganic carbon) and therefore are also
chemolithotrophic (utilize inorganic substrates) microorganisms. The nitritation step can
be inhibited by high concentrations of FNA via increased loading rate or a drop in pH
while the nitratation step is inhibited by increased FA loading rates or a rise in pH.
MBBR History
From 1972 to 2008, activated sludge system implementation has increased 27% while
biofilm treatment expansion has remained stationary (Parker et al., 2010). In the late
1980s the MBBR process was patented (European Patent no. 0,575,314, US Patent no.
5,458,779) in Norway by Kaldness Miljoteknologi through its affiliation with the
Foundation for Scientific and Industrial Research at the Norwegian University for
Science and Technology (Ødegaard et al., 1994; Rusten et al., 1998). By the late 1990s,
when MBBR and IFAS systems were available for nutrient removal applications, so many
activated sludge systems were already installed in wastewater treatment plants an
attractive option for integrating the MBBR process into an already existing secondary
treatment process was by means of upgrading and retrofitting activated sludge systems
as IFAS systems (Parker et al., 2010).
MBBR Retrofit to Municipal Wastewater Treatment
To achieve a greater efficiency in performance, or greater contaminant removal from
wastewater, it is possible for activated sludge systems to be upgraded and retrofitted to
7
an MBBR or IFAS type system. This upgrade will require a shorter hydraulic residence
time (HRT) to attain the same removal efficiency, which can be accomplished with a
smaller volume aeration tank system, or will result in greater removal if the system HRT
is unchanged; this is due to the greater capacity of the attached biofilm over suspended
biomass to degrade nutrients (Javid et al., 2013). Biofilm attachment to media translates
to a long SRT and makes biomass retention independent of biomass selection from
secondary clarifiers (McQuarrey et al., 2011).
MBBR Media Design Effects
IFAS and MBBR media are commercially available in a variety of shapes and sizes, but
there are few published studies of how media geometry affects biofilm development
and performance. Ødegaard et al. 2006 reported that differences in carrier shape had
no significant effect in performance despite the influence of shape on effective area for
biofilm attachment. Bjornberg et al. 2009 examined MBBR media cross sections and
determined that biomass attachment is more concentrated toward the edges of the
media rather than the interior. These researchers suggested that interior biofilms are
relatively inactive, and therefore media design with minimal interior area may have
greater overall activity. Melcer and Schuler (2014) reported that varying mixing rates
had a greater effect on a more protected MBBR media design than on MBBR media with
a less protected interior, but geometric variables were not studied in a systematic way..
8
Nitrifier Inhibition in MBBRs
There are also few published studies of how media geometry affects biofilm resistance
to inhibition. Park et al., 2009 demonstrated that ammonia oxidizing bacteria (AOB) and
nitrite oxidizing bacteria (NOB) are inhibited by free nitrous acid (FNA) and free
ammonia (FA) respectively (Anthonisen et al., 1976). Several studies have demonstrated
FA inhibition of the nitratation step to encourage shortcut biological nitrogen removal
via nitrite accumulation (Chung et al., 2007; Hellinga et al., 1998; Park et al., 2010).
MBBR Media Differences
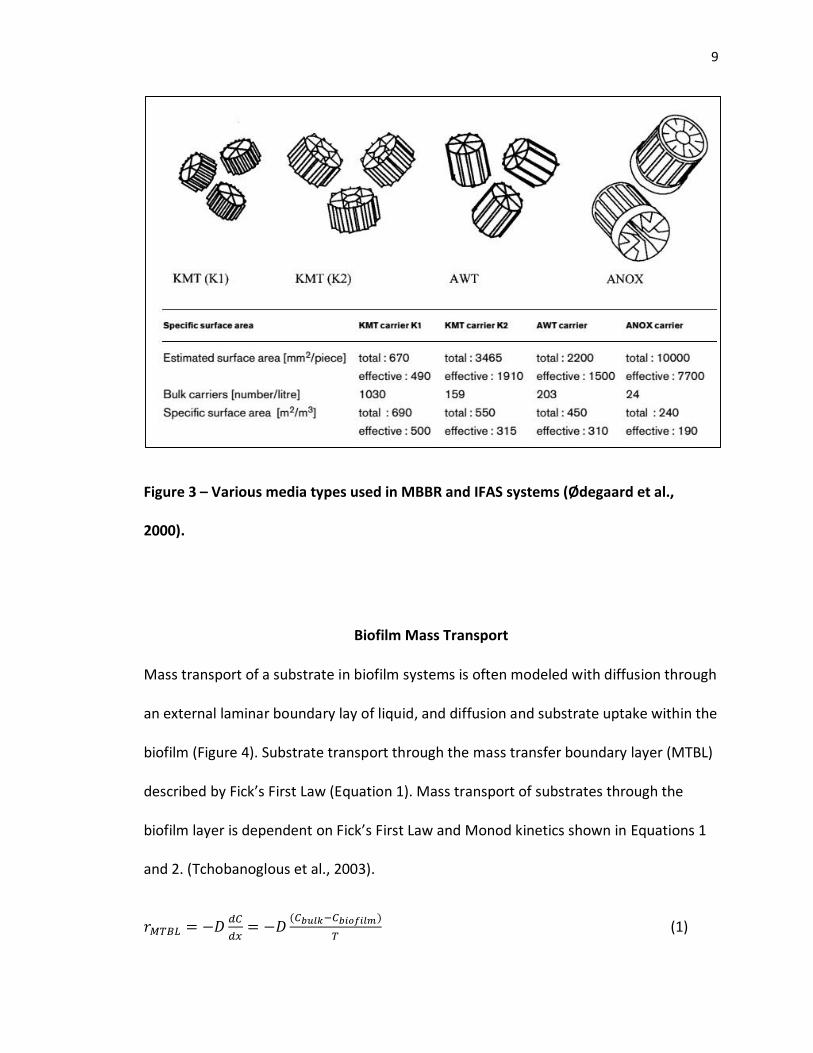
Example MBBR media geometries are shown in Figure 3. This figure demonstrates the
significant variability in media design geometry as well as effective surface area.
Performance comparison between the same shape media or same effective surface area
media is entirely absent.
9
Figure 3 – Various media types used in MBBR and IFAS systems (Ødegaard et al.,
2000).
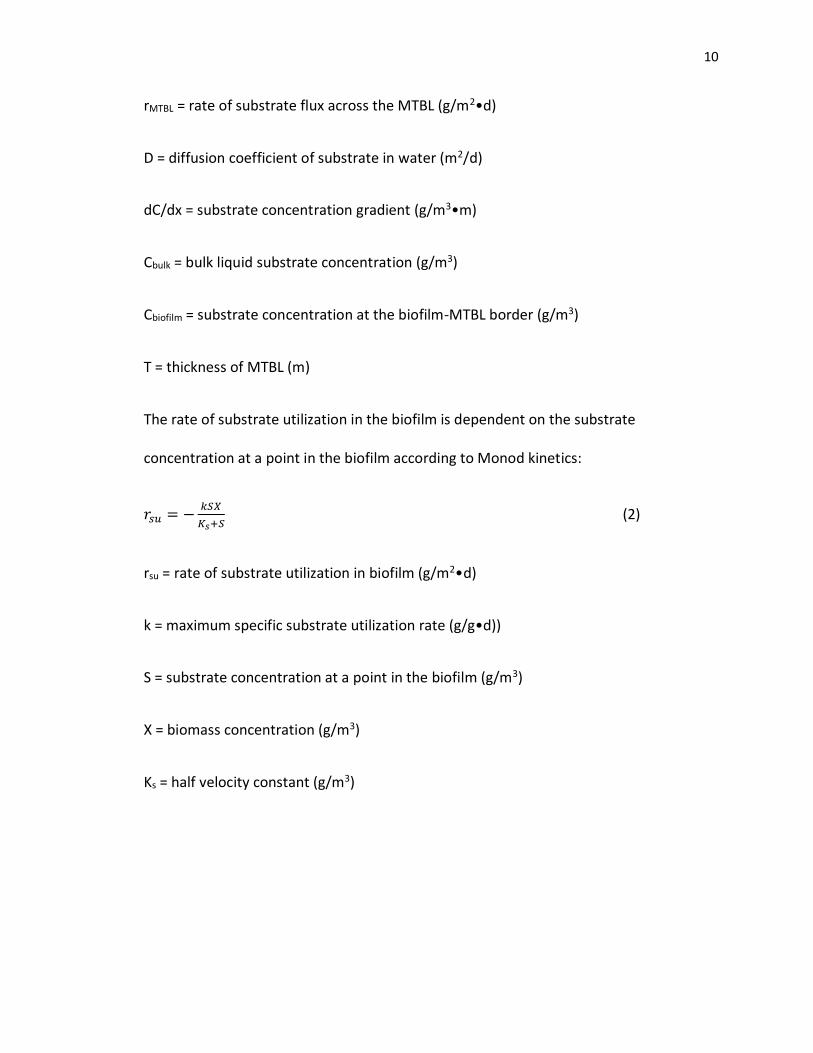
Biofilm Mass Transport
Mass transport of a substrate in biofilm systems is often modeled with diffusion through
an external laminar boundary lay of liquid, and diffusion and substrate uptake within the
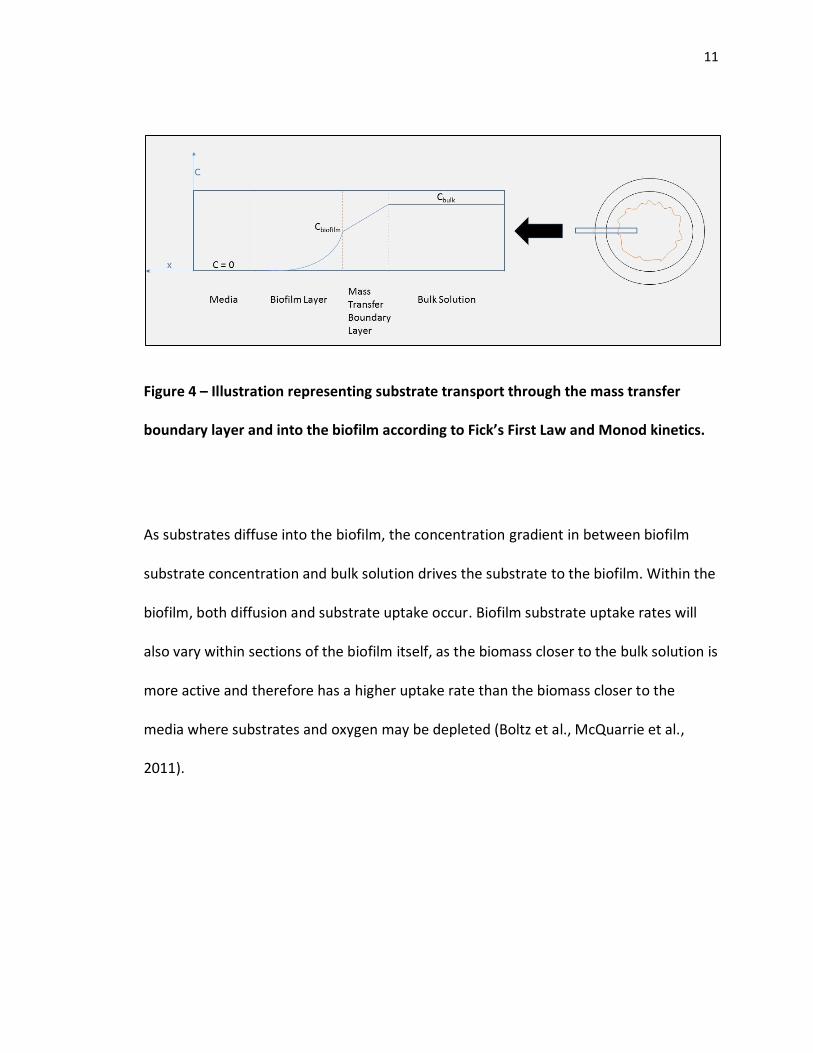
biofilm (Figure 4). Substrate transport through the mass transfer boundary layer (MTBL)
described by Fick’s First Law (Equation 1). Mass transport of substrates through the
biofilm layer is dependent on Fick’s First Law and Monod kinetics shown in Equations 1
and 2. (Tchobanoglous et al., 2003).
𝑟𝑀𝑇𝐵𝐿 = −𝐷𝑑𝐶
𝑑𝑥= −𝐷
(𝐶𝑏𝑢𝑙𝑘−𝐶𝑏𝑖𝑜𝑓𝑖𝑙𝑚)
𝑇 (1)
10
rMTBL = rate of substrate flux across the MTBL (g/m2•d)
D = diffusion coefficient of substrate in water (m2/d)
dC/dx = substrate concentration gradient (g/m3•m)
Cbulk = bulk liquid substrate concentration (g/m3)
Cbiofilm = substrate concentration at the biofilm-MTBL border (g/m3)
T = thickness of MTBL (m)
The rate of substrate utilization in the biofilm is dependent on the substrate
concentration at a point in the biofilm according to Monod kinetics:
𝑟𝑠𝑢 = −𝑘𝑆𝑋
𝐾𝑠+𝑆 (2)
rsu = rate of substrate utilization in biofilm (g/m2•d)
k = maximum specific substrate utilization rate (g/g•d))
S = substrate concentration at a point in the biofilm (g/m3)
X = biomass concentration (g/m3)
Ks = half velocity constant (g/m3)
11
Figure 4 – Illustration representing substrate transport through the mass transfer
boundary layer and into the biofilm according to Fick’s First Law and Monod kinetics.
As substrates diffuse into the biofilm, the concentration gradient in between biofilm
substrate concentration and bulk solution drives the substrate to the biofilm. Within the
biofilm, both diffusion and substrate uptake occur. Biofilm substrate uptake rates will
also vary within sections of the biofilm itself, as the biomass closer to the bulk solution is
more active and therefore has a higher uptake rate than the biomass closer to the
media where substrates and oxygen may be depleted (Boltz et al., McQuarrie et al.,
2011).
12
CHAPTER 3 METHODS
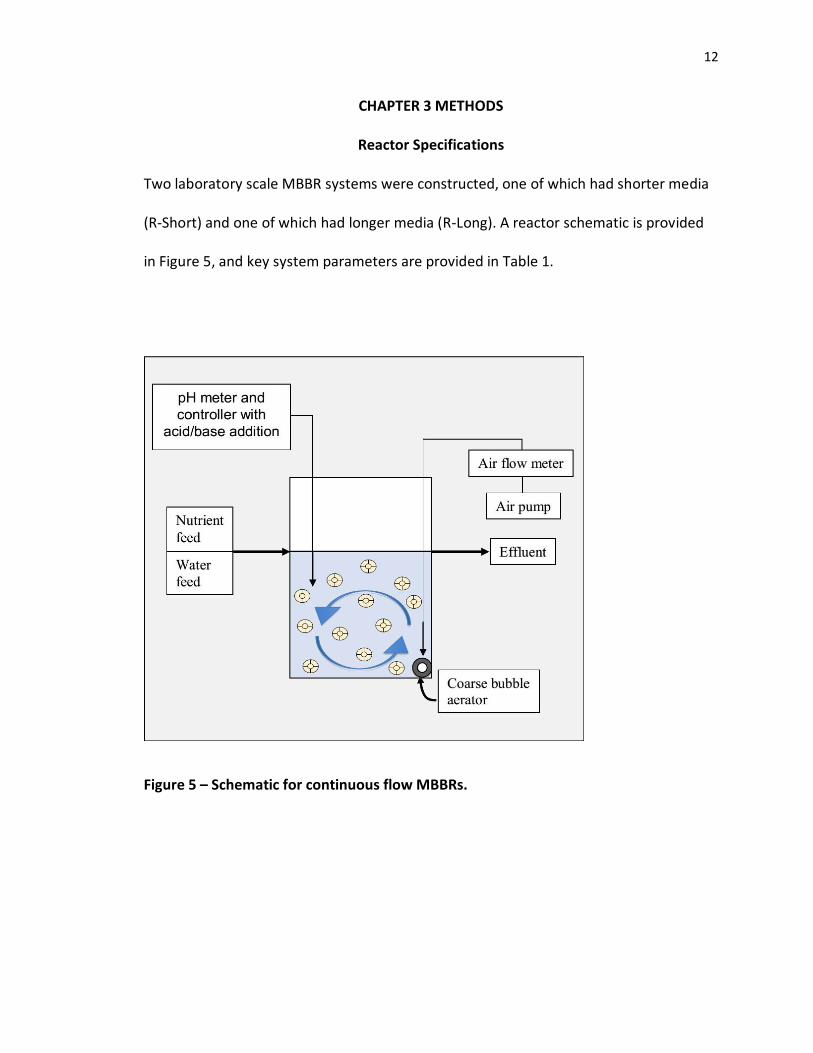
Reactor Specifications
Two laboratory scale MBBR systems were constructed, one of which had shorter media
(R-Short) and one of which had longer media (R-Long). A reactor schematic is provided
in Figure 5, and key system parameters are provided in Table 1.
Figure 5 – Schematic for continuous flow MBBRs.
13
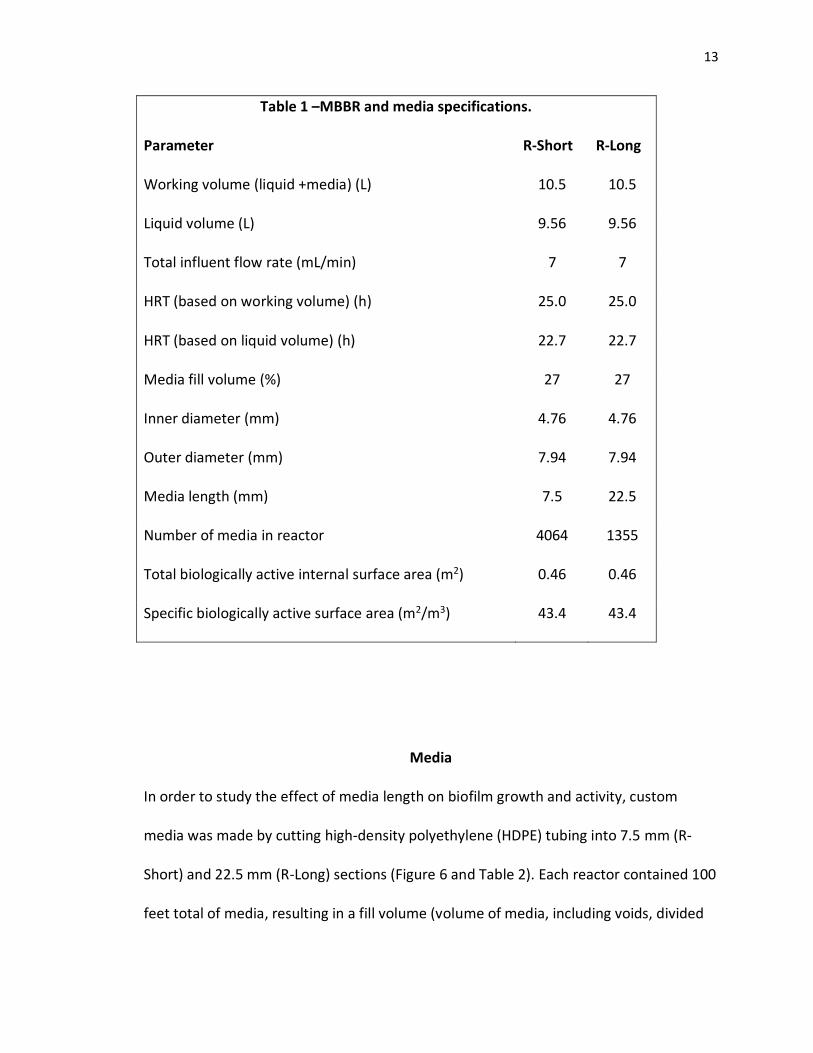
Table 1 –MBBR and media specifications.
Parameter R-Short R-Long
Working volume (liquid +media) (L) 10.5 10.5
Liquid volume (L) 9.56 9.56
Total influent flow rate (mL/min) 7 7
HRT (based on working volume) (h) 25.0 25.0
HRT (based on liquid volume) (h) 22.7 22.7
Media fill volume (%) 27 27
Inner diameter (mm) 4.76 4.76
Outer diameter (mm) 7.94 7.94
Media length (mm) 7.5 22.5
Number of media in reactor 4064 1355
Total biologically active internal surface area (m2) 0.46 0.46
Specific biologically active surface area (m2/m3) 43.4 43.4
Media
In order to study the effect of media length on biofilm growth and activity, custom
media was made by cutting high-density polyethylene (HDPE) tubing into 7.5 mm (R-
Short) and 22.5 mm (R-Long) sections (Figure 6 and Table 2). Each reactor contained 100
feet total of media, resulting in a fill volume (volume of media, including voids, divided
14
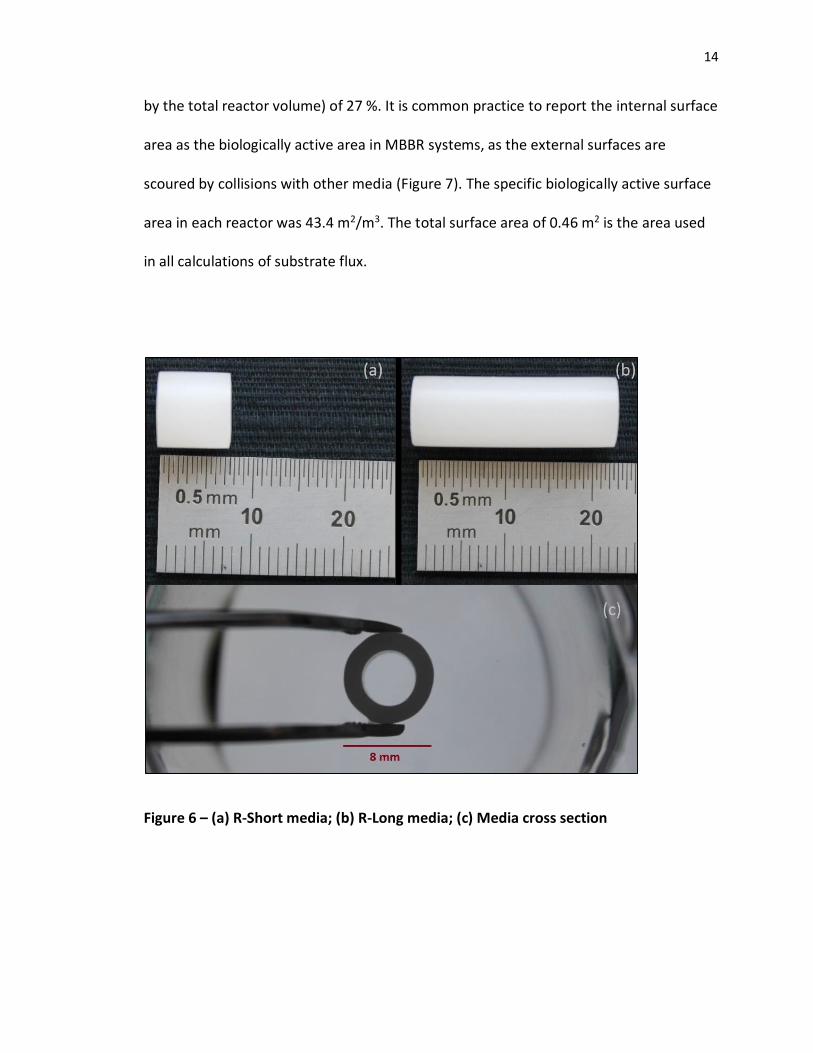
by the total reactor volume) of 27 %. It is common practice to report the internal surface
area as the biologically active area in MBBR systems, as the external surfaces are
scoured by collisions with other media (Figure 7). The specific biologically active surface
area in each reactor was 43.4 m2/m3. The total surface area of 0.46 m2 is the area used
in all calculations of substrate flux.
Figure 6 – (a) R-Short media; (b) R-Long media; (c) Media cross section
15
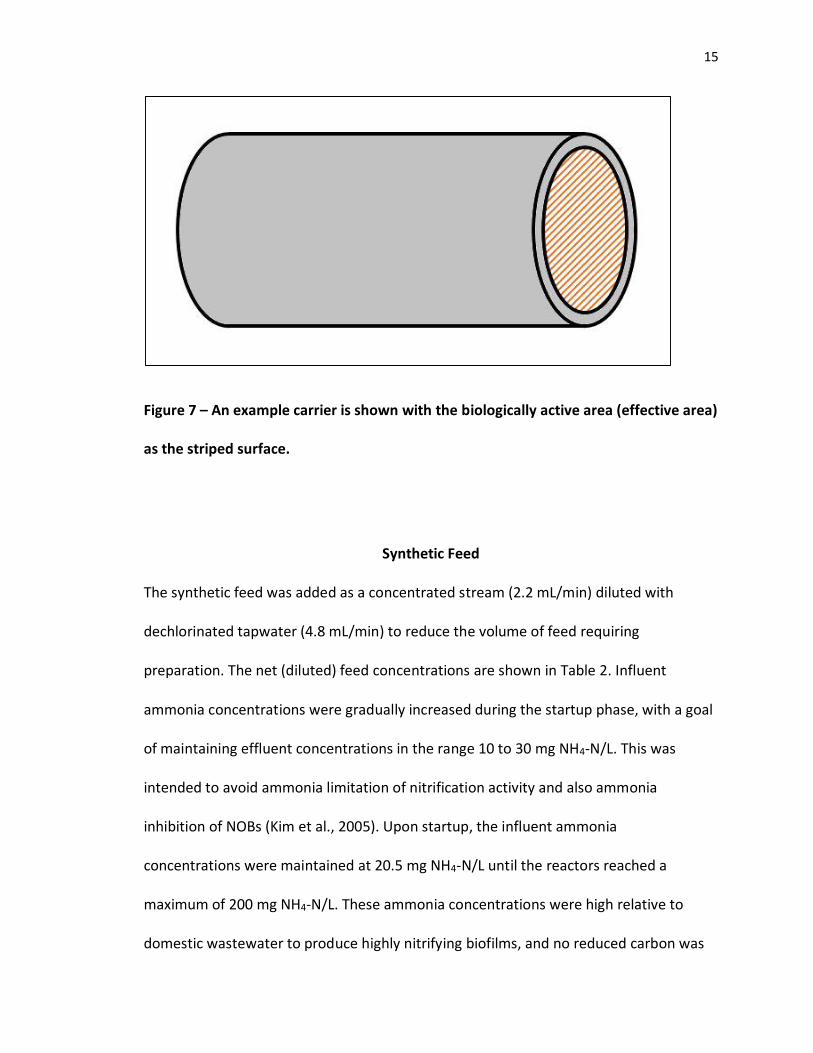
Figure 7 – An example carrier is shown with the biologically active area (effective area)
as the striped surface.
Synthetic Feed
The synthetic feed was added as a concentrated stream (2.2 mL/min) diluted with
dechlorinated tapwater (4.8 mL/min) to reduce the volume of feed requiring
preparation. The net (diluted) feed concentrations are shown in Table 2. Influent
ammonia concentrations were gradually increased during the startup phase, with a goal
of maintaining effluent concentrations in the range 10 to 30 mg NH4-N/L. This was
intended to avoid ammonia limitation of nitrification activity and also ammonia
inhibition of NOBs (Kim et al., 2005). Upon startup, the influent ammonia
concentrations were maintained at 20.5 mg NH4-N/L until the reactors reached a
maximum of 200 mg NH4-N/L. These ammonia concentrations were high relative to
domestic wastewater to produce highly nitrifying biofilms, and no reduced carbon was

16
included to reduce competition for space from heterotrophs. Synthetic feed was
prepared with autoclaved glassware to ensure sterile conditions.
17
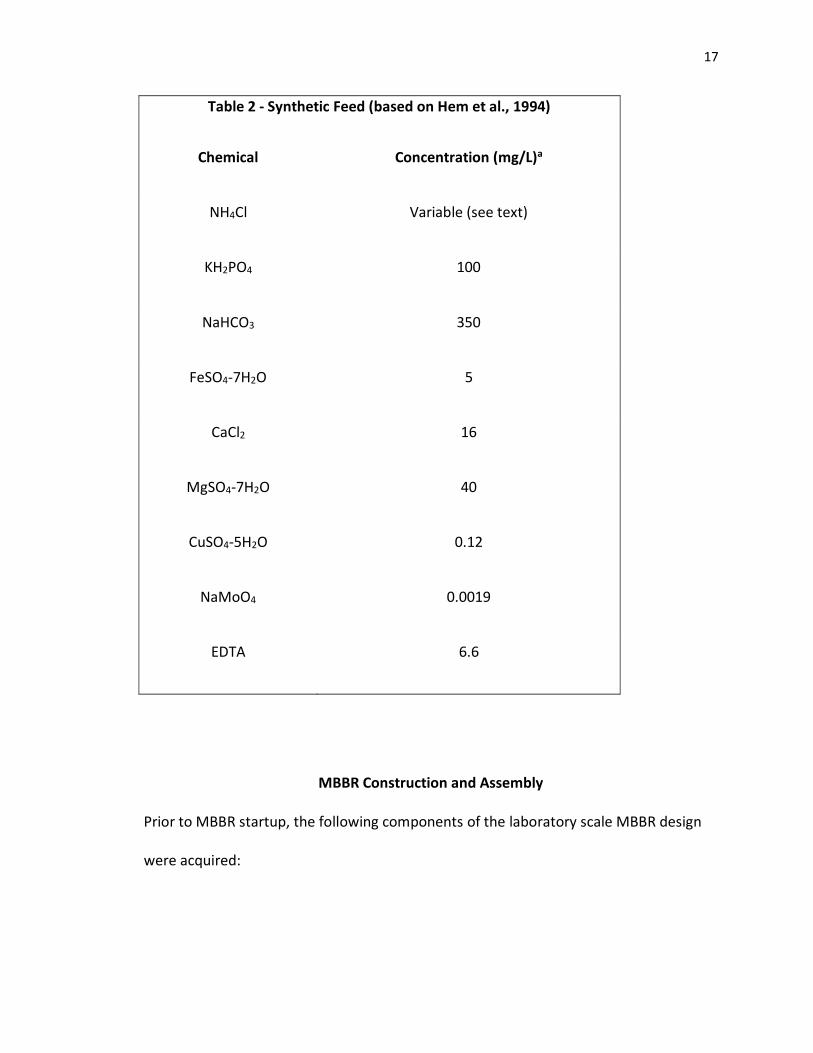
Table 2 - Synthetic Feed (based on Hem et al., 1994)
Chemical Concentration (mg/L)a
NH4Cl Variable (see text)
KH2PO4 100
NaHCO3 350
FeSO4-7H2O 5
CaCl2 16
MgSO4-7H2O 40
CuSO4-5H2O 0.12
NaMoO4 0.0019
EDTA 6.6
MBBR Construction and Assembly
Prior to MBBR startup, the following components of the laboratory scale MBBR design
were acquired:
18
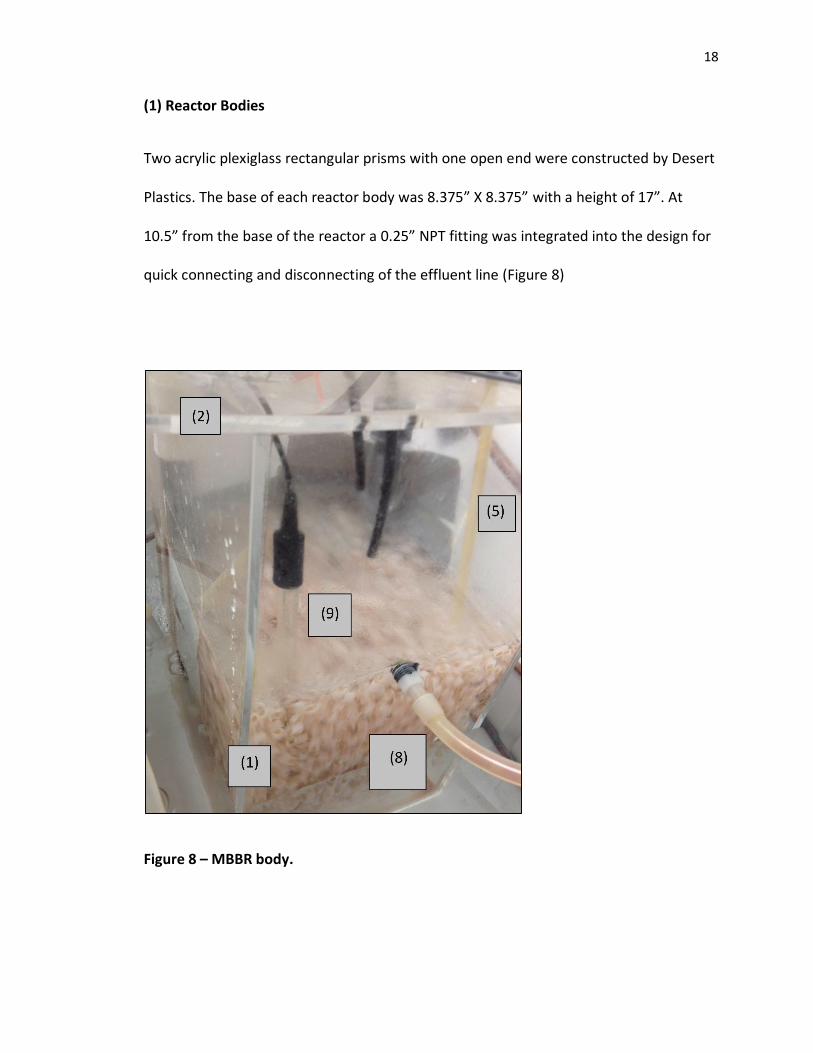
(1) Reactor Bodies
Two acrylic plexiglass rectangular prisms with one open end were constructed by Desert
Plastics. The base of each reactor body was 8.375” X 8.375” with a height of 17”. At
10.5” from the base of the reactor a 0.25” NPT fitting was integrated into the design for
quick connecting and disconnecting of the effluent line (Figure 8)
Figure 8 – MBBR body.
19
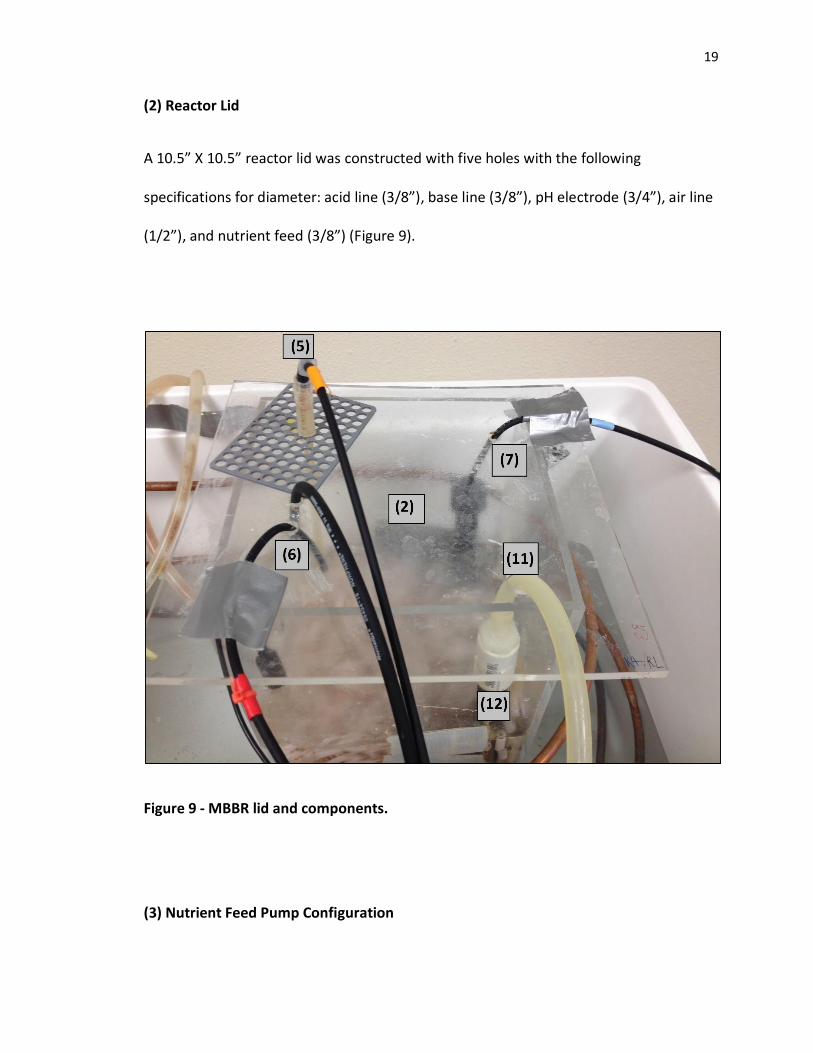
(2) Reactor Lid
A 10.5” X 10.5” reactor lid was constructed with five holes with the following
specifications for diameter: acid line (3/8”), base line (3/8”), pH electrode (3/4”), air line
(1/2”), and nutrient feed (3/8”) (Figure 9).
Figure 9 - MBBR lid and components.
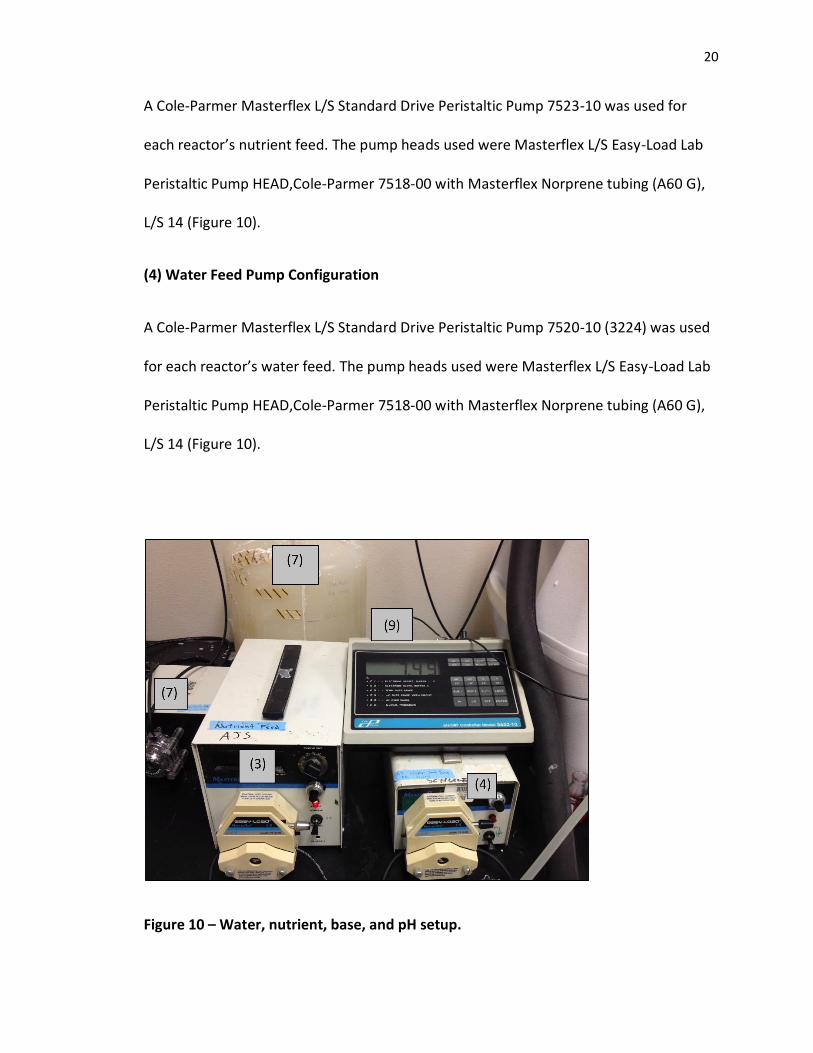
(3) Nutrient Feed Pump Configuration
20
A Cole-Parmer Masterflex L/S Standard Drive Peristaltic Pump 7523-10 was used for
each reactor’s nutrient feed. The pump heads used were Masterflex L/S Easy-Load Lab
Peristaltic Pump HEAD,Cole-Parmer 7518-00 with Masterflex Norprene tubing (A60 G),
L/S 14 (Figure 10).
(4) Water Feed Pump Configuration
A Cole-Parmer Masterflex L/S Standard Drive Peristaltic Pump 7520-10 (3224) was used
for each reactor’s water feed. The pump heads used were Masterflex L/S Easy-Load Lab
Peristaltic Pump HEAD,Cole-Parmer 7518-00 with Masterflex Norprene tubing (A60 G),
L/S 14 (Figure 10).
Figure 10 – Water, nutrient, base, and pH setup.
21
(5) Influent Configuration
The water feed (4.8 mL/min) and nutrient feed (2.2 mL/min) were combined in a
separate line before entering the reactor at 7 mL/min (Figure 9).
(6) Acid Pump Configuration
A Cole-Parmer Masterflex 7543-30 Pump was used for each reactor’s acid line. A
Masterflex 7014-52 pump head was used for each pump with Masterflex Norprene
tubing (A60 G), L/S 14 (Figure 11).
(7) Base Pump Configuration
A Cole-Parmer Masterflex 7540-30 Pump was used for each reactor’s base line. A
Masterflex 7014-52 pump head was used for each pump with Masterflex Norprene
tubing (A60 G), L/S 14 (Figure 10).
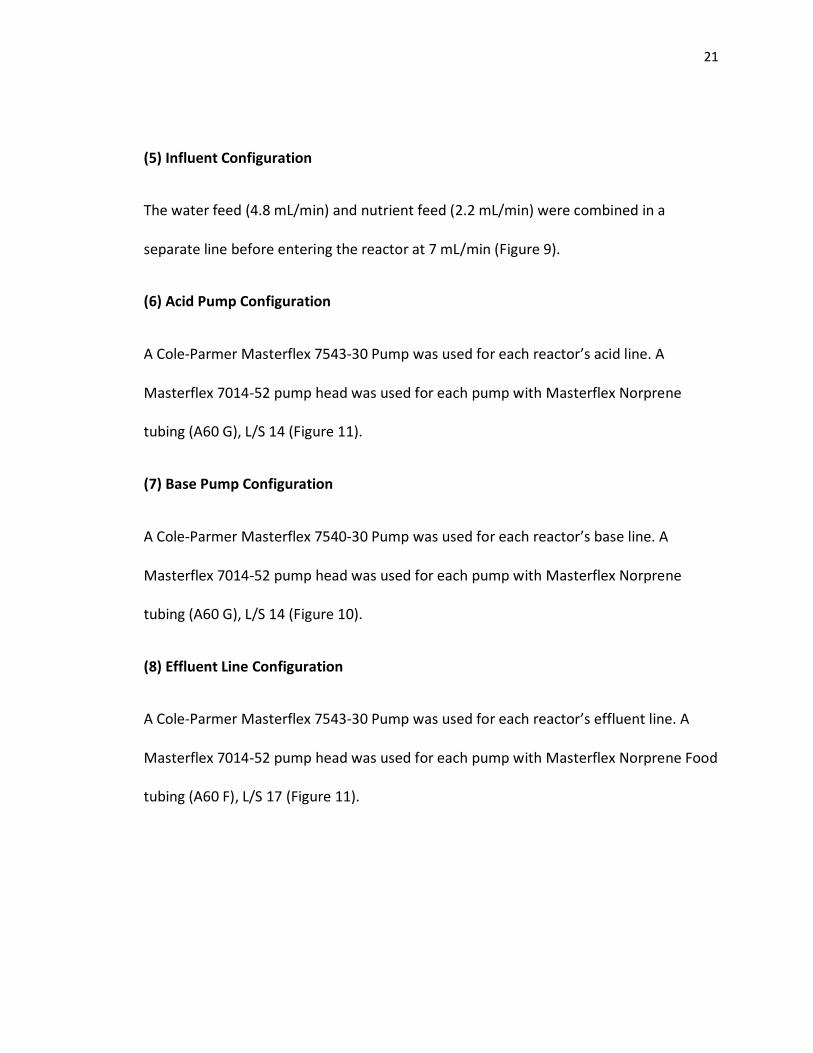
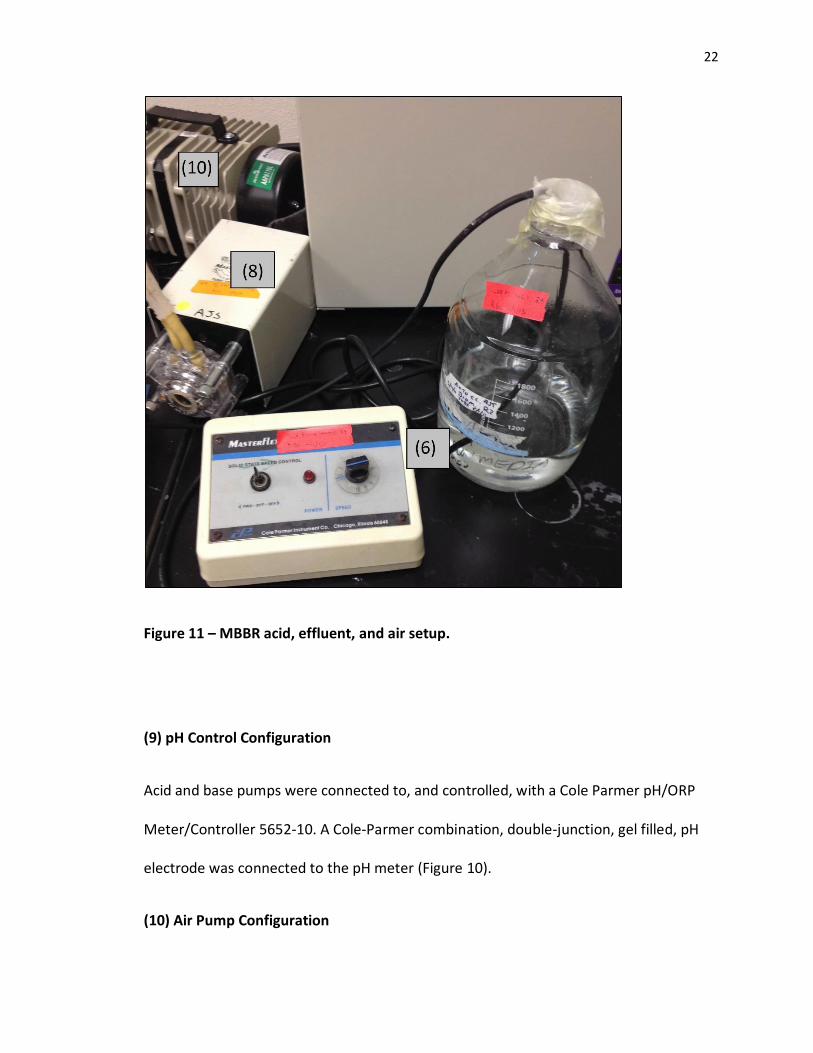
(8) Effluent Line Configuration
A Cole-Parmer Masterflex 7543-30 Pump was used for each reactor’s effluent line. A
Masterflex 7014-52 pump head was used for each pump with Masterflex Norprene Food
tubing (A60 F), L/S 17 (Figure 11).
22
Figure 11 – MBBR acid, effluent, and air setup.
(9) pH Control Configuration
Acid and base pumps were connected to, and controlled, with a Cole Parmer pH/ORP
Meter/Controller 5652-10. A Cole-Parmer combination, double-junction, gel filled, pH
electrode was connected to the pH meter (Figure 10).
(10) Air Pump Configuration
23
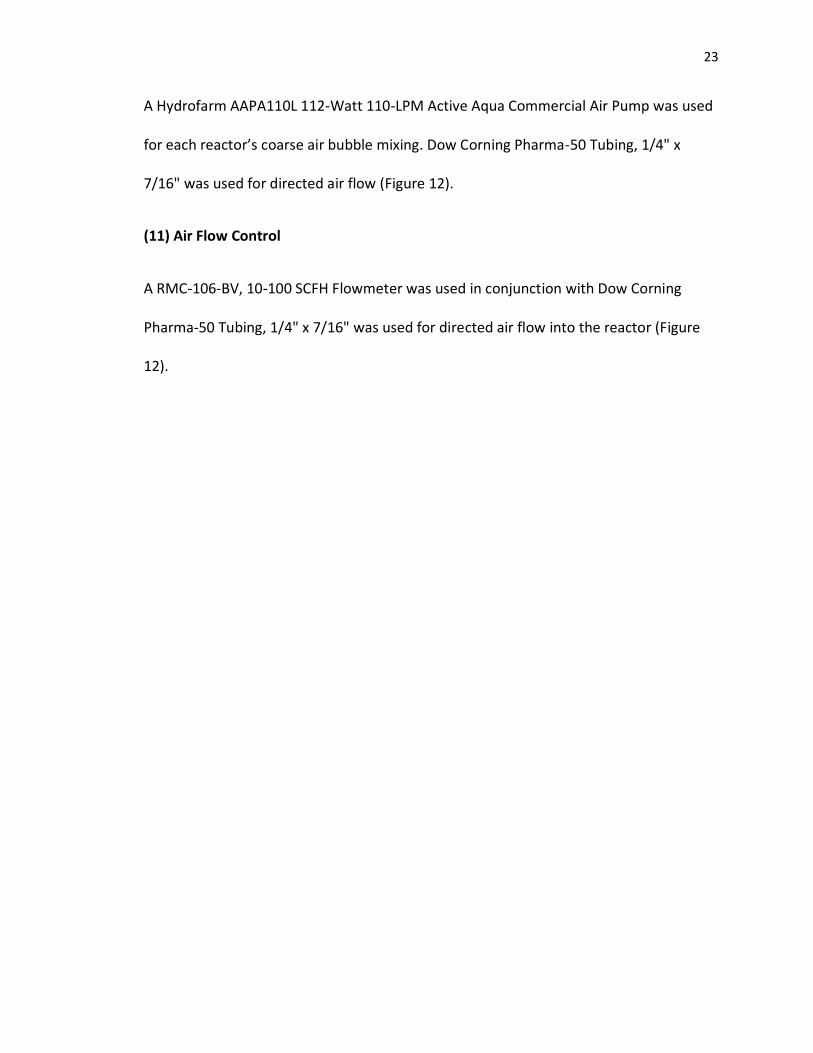
A Hydrofarm AAPA110L 112-Watt 110-LPM Active Aqua Commercial Air Pump was used
for each reactor’s coarse air bubble mixing. Dow Corning Pharma-50 Tubing, 1/4" x
7/16" was used for directed air flow (Figure 12).
(11) Air Flow Control
A RMC-106-BV, 10-100 SCFH Flowmeter was used in conjunction with Dow Corning
Pharma-50 Tubing, 1/4" x 7/16" was used for directed air flow into the reactor (Figure
12).
24
Figure 12 – Air flow and control for coarse bubble mixing.
(12) Aerator
The aerator was constructed with three 1/2” X 6” PVC Nipple Fittings, Double Threaded,
and a 1/2” NPT Male X 1/4" Barbed, Polypropylene Hose Fitting, Adapter (Figure 9).
25
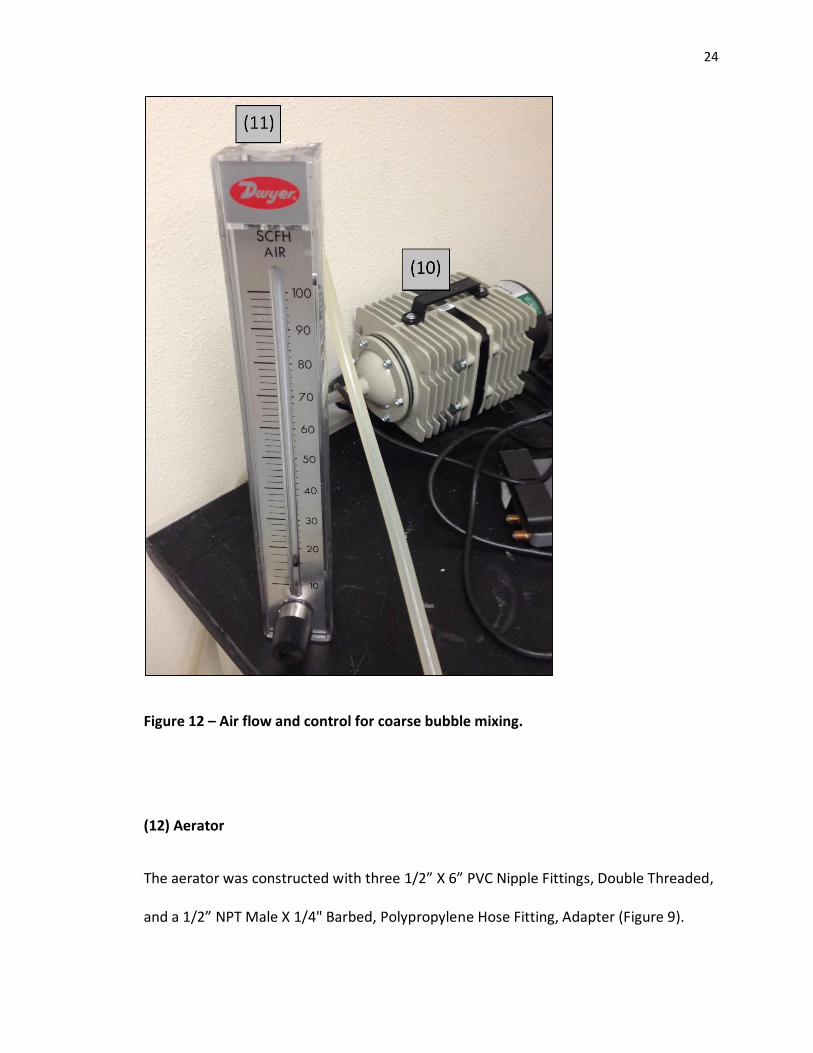
(13) Water Feed Container
The water feed was stored in 50L Nalgene, HDPE, Carboys (Figure 13).
(14) Nutrient Feed Container
The nutrient feed was stored in a 20L Pyrex, Autoclavable, Carboy (Figure 13).
Figure 13 – Water and nutrient feed storage.
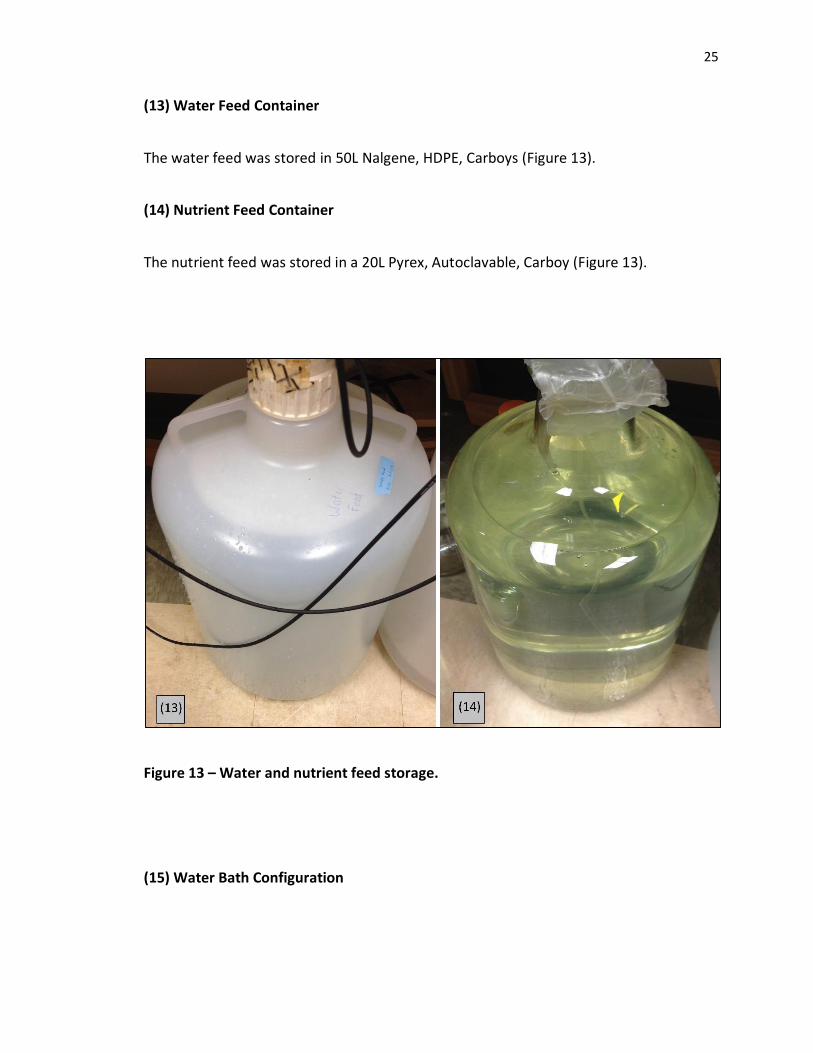
(15) Water Bath Configuration
26
Each MBBR was assembled and placed into a Rubbermaid 150 Qt. Gott™ Marine Cooler
which was filled halfway with tap water and surrounded by copper coiling. The coiling
was connected to Pharma-50 Tubing, 1/4" x 7/16" which was connected to a Cole-
Parmer Polystat Standard 6L Heat/Cool Bath, -20 to 100 °C; 115VAC. This provided a
strict temperature control in each reactor (Figure 14.)
Figure 14 – R-Short (left) and R-Long (right) contained in the water bath.
27
Reactor Operation
Before startup, both carrier types were separately inoculated in 10 L of fresh activated
sludge from the Albuquerque, New Mexico, Southside Wastewater Reclamation Plant
(SWRP) for 3 days at room temperature with coarse-bubble mixing. The SWRP uses a
Modified Ludzack-Ettinger configuration. After 3 days of inoculation, the media solution
in each MBBR was replaced with 5 L of settled activated sludge and 5 L of fresh primary
effluent. The continuous synthetic feed was then introduced to each reactor.
The pH of each reactor was kept between 7.15 and 7.50 using a pH controller with 0.5 M
HCl and 0.7 M NaCO3. The temperature was 21 degrees Celcius (°C). The reactors were
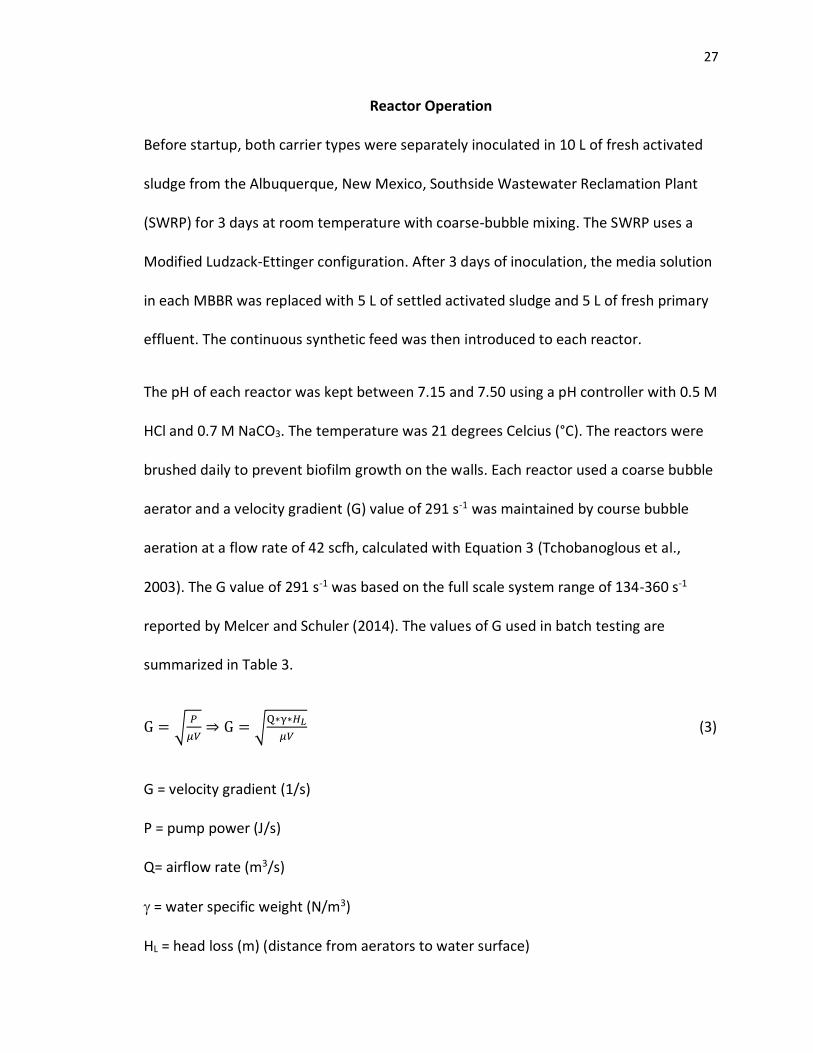
brushed daily to prevent biofilm growth on the walls. Each reactor used a coarse bubble
aerator and a velocity gradient (G) value of 291 s-1 was maintained by course bubble
aeration at a flow rate of 42 scfh, calculated with Equation 3 (Tchobanoglous et al.,
2003). The G value of 291 s-1 was based on the full scale system range of 134-360 s-1
reported by Melcer and Schuler (2014). The values of G used in batch testing are
summarized in Table 3.
G = √𝑃
𝜇𝑉⇒ G = √
Q∗γ∗𝐻𝐿
𝜇𝑉 (3)
G = velocity gradient (1/s)
P = pump power (J/s)
Q= airflow rate (m3/s)
= water specific weight (N/m3)
HL = head loss (m) (distance from aerators to water surface)
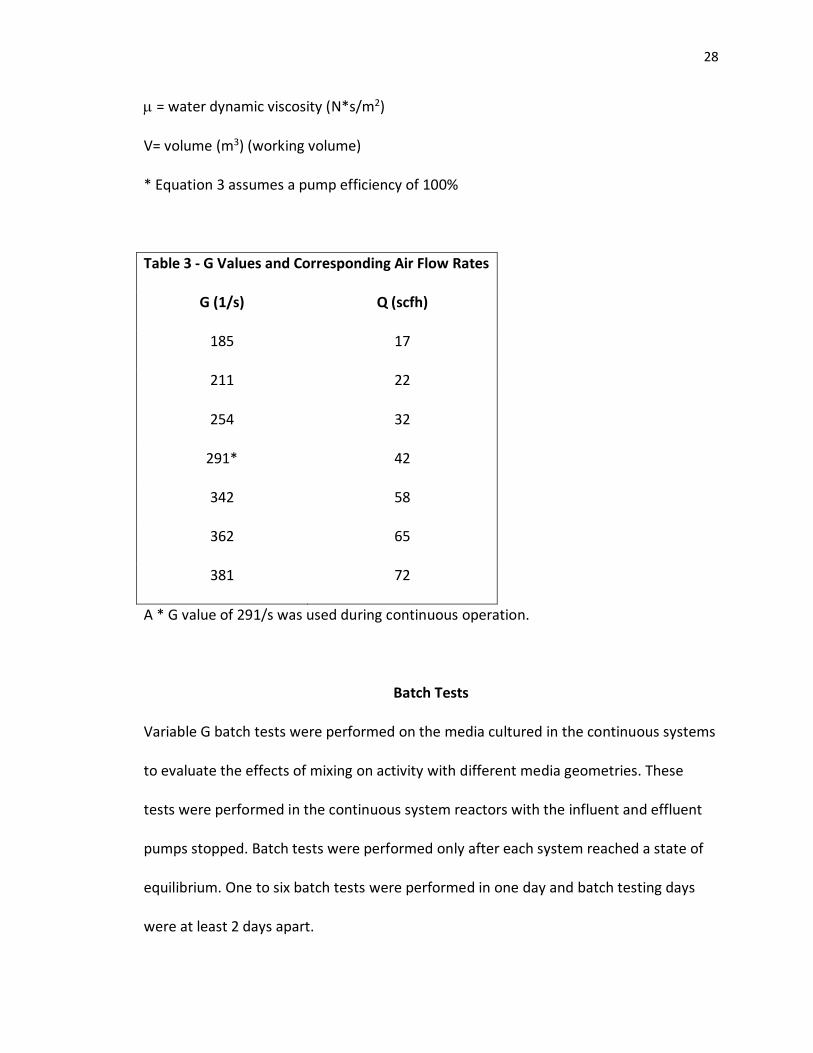
28
= water dynamic viscosity (N*s/m2)
V= volume (m3) (working volume)
* Equation 3 assumes a pump efficiency of 100%
Table 3 - G Values and Corresponding Air Flow Rates
G (1/s) Q (scfh)
185 17
211 22
254 32
291* 42
342 58
362 65
381 72
A * G value of 291/s was used during continuous operation.
Batch Tests
Variable G batch tests were performed on the media cultured in the continuous systems
to evaluate the effects of mixing on activity with different media geometries. These
tests were performed in the continuous system reactors with the influent and effluent
pumps stopped. Batch tests were performed only after each system reached a state of
equilibrium. One to six batch tests were performed in one day and batch testing days
were at least 2 days apart.
29
The batch test solution was the same as the reactor net feed (Table 2), with the
ammonia concentration equal to approximately 30 mg NH4-N/L. The media were gently
removed from the reactors and the liquid volume was removed separately. The media
were gently rinsed with fresh batch test solution, and the reactor was cleaned with DI
water, and rinsed with batch test solution. The media was replaced in each reactor and
filled with batch test solution to the original total volume (10.5 L). Mixing was
commenced via aeration to provide a target G value, which was varied across a series of
batch tests on a given day, and a 5 mL sample was quickly taken and filtered through at
0.45 μm filter to mark t=0. pH was controlled at 7.25 ±0.05 during the batch tests.
Additional samples were taken up to one hour.
Additional batch tests were performed to evaluate potential differences in activity of
biofilm grown in the center and the edges of the R-Long media. 13 media pieces were
taken from R-Long and cut into 3 equal sections with a pipe cutter. 13 end sections and
13 middle sections were tested separately in 100 mL batch tests, providing
approximately the same specific surface area as in the continuous systems (the
remaining 13 end pieces were discarded). 13 media from R-Short were also tested in a
100 mL batch reactor for comparison. After cutting, media pieces were gently rinsed
with batch test solution. Two sets of tests were performed. In the first, the batch test
solution was as in Table 2 but with 40 mg NO2--N/L and 0 mg NH4-N/L added to observe
nitratation (NOB activity) only. The second batch test included 40 mg NH4-N/L and 40
mg NO2--N/L to observe AOB and NOB activity. pH was 7.35 at the beginning of the test,
and was measured but was not controlled. The media were added to the 100 mL
30
working volume batch reactors (150 mL Erlenmeyer flasks over Fisher Scientific Auto
Mixers) and mixing was provided via stir bar/plate at 100 rpm). At the start of the test a
0.5 mL sample was taken from each reactor and filtered through a 0.45 μm nylon filter
for nitrogen analyses as described below. Additional samples were taken and measured
during the test.
Analytical Methods
Nitrogen species were measured on 0.45 μm filtered samples using using Hach kits for
ammonia (AmVer TNT High Range Set), nitrite (NitriVer 3 TNT Low Range Set), and
nitrate (NitraVer X High Range Reagent Set) using a Hach DR-2700 spectrophotometer.
Samples were diluted as necessary to measure in recommended ranges.
Biofilm biomass was measured on randomly selected carriers (12 for R-Short and 4 for
R-Long, providing the same total surface area of each type). Biomass was removed from
the media by brushing using Proxabrush dental cleaning tools (GUM Between Teeth
Cleaning) and rinsing with DI water. The number of media removed from each reactor
was accounted for in continuous system calculations. The removed biomass was
measured using Standard Methods 2450B and 2540E (American Public Health
Association et al., 2012) for total suspended and volatile suspended solids, respectively,
and the reactor total biofilm solids (TBS) and volatile biofilm solids (VBS) were calculated
based on the total number of media in the reactors (Equation 4).
31
𝑉𝐵𝑆 =𝑀550°𝐶
𝑉×
𝑇𝑚𝑒𝑑𝑖𝑎
𝑆𝑚𝑒𝑑𝑖𝑎 (4)
VBS = volatile suspended solids (mg/L)
M550°C = dry mass volatilized in 550°C oven (mg)
V = reactor working volume (L)
Tmedia = total number of media in reactor (#)
Smedia = sample number of media used for biomass calculation (#)
CHAPTER 4 RESULTS AND DISCUSSION
Continuous Performance
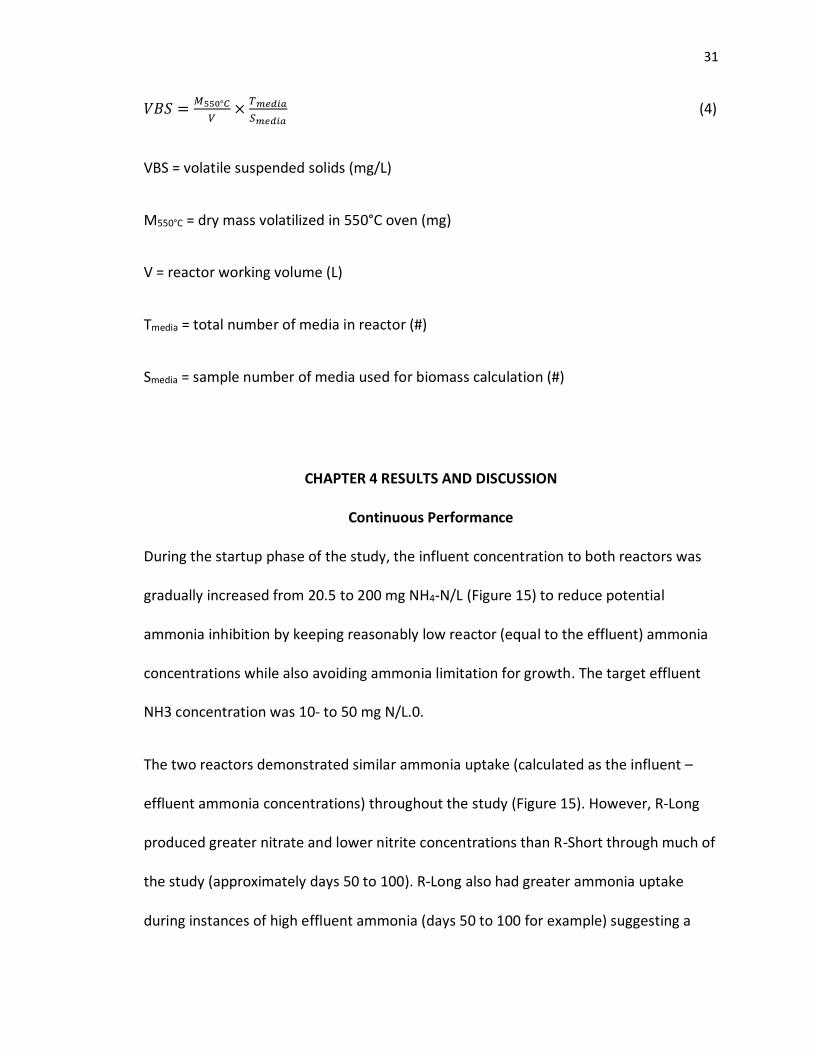
During the startup phase of the study, the influent concentration to both reactors was
gradually increased from 20.5 to 200 mg NH4-N/L (Figure 15) to reduce potential
ammonia inhibition by keeping reasonably low reactor (equal to the effluent) ammonia
concentrations while also avoiding ammonia limitation for growth. The target effluent
NH3 concentration was 10- to 50 mg N/L.0.
The two reactors demonstrated similar ammonia uptake (calculated as the influent –
effluent ammonia concentrations) throughout the study (Figure 15). However, R-Long
produced greater nitrate and lower nitrite concentrations than R-Short through much of
the study (approximately days 50 to 100). R-Long also had greater ammonia uptake
during instances of high effluent ammonia (days 50 to 100 for example) suggesting a
32
more active, or at least a more tolerant, AOB community than R-Short at higher effluent
ammonia levels. After 105 days of continuous operation, each MBBR achieved a
maximum ammonia uptake of approximately 180-190 mg NH4-N/L. Influent ammonia
concentrations were maintained at near 200 mg NH4-N/L thereafter. Also after 105 days
the ammonia uptake and nitrite and nitrate production reached steady states, and were
nearly the same.
Figure 15 – Continuous operation; nitrogen species of interest.
0
50
100
150
200
0 50 100 150 200
Co
nce
ntr
atio
n (
mg
N/L
)
Time (days)
R-Short effluent NH4 R-Short effluent NO2 R-Short effluent NO3R-Short NH4 Uptake R-Long effluent NH4 R-Long effluent NO2R-Long effluent NO3 R-Long NH4 Uptake R-Short and R-Long Influent NH4
33
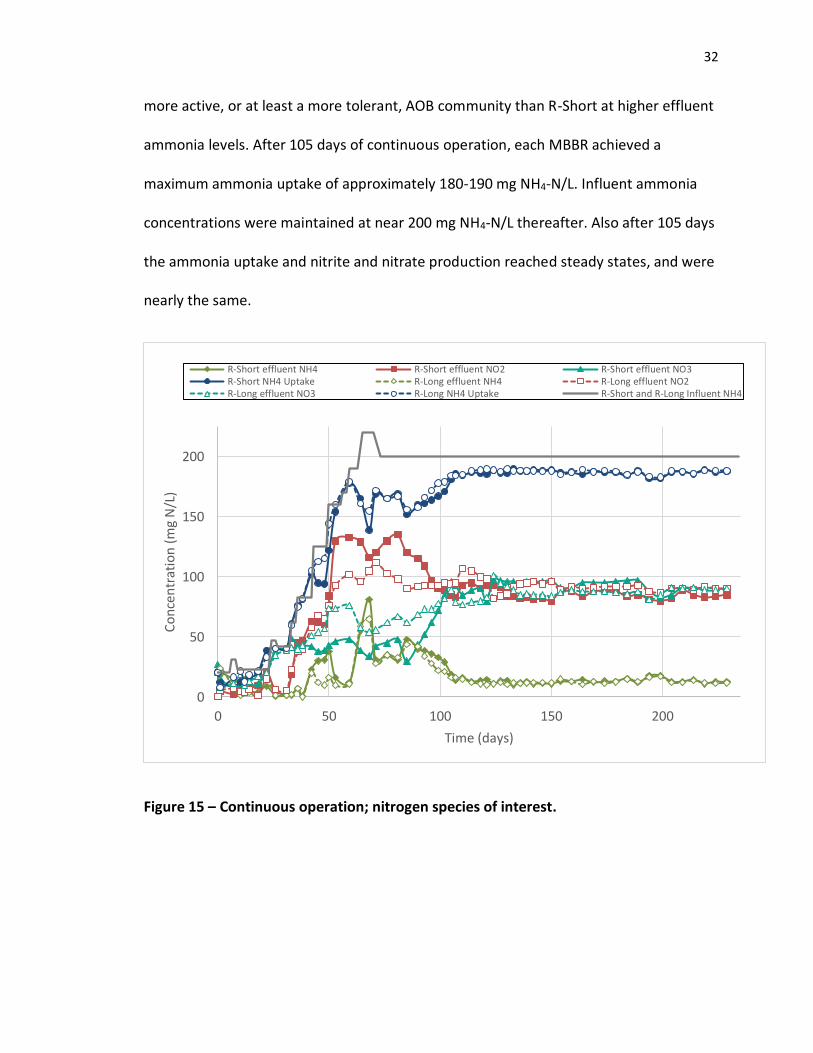
Biofilm Growth and Attachment
Biofilm growth in the two reactors is shown in Figure 16. The R-Long media consistently
had 78% higher biomass concentrations (approximately 0.41 mg VBS/cm2 at steady
state) than the R-short media (approximately 0.23 mg VBS/cm2 at steady state),
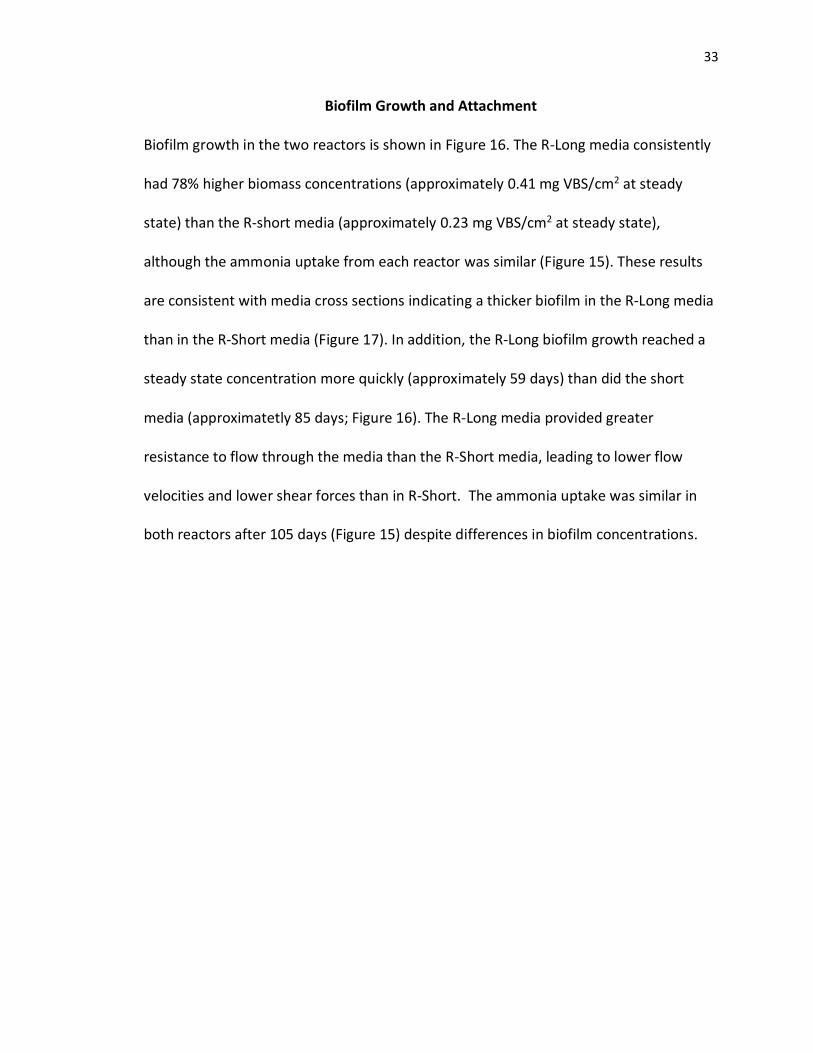
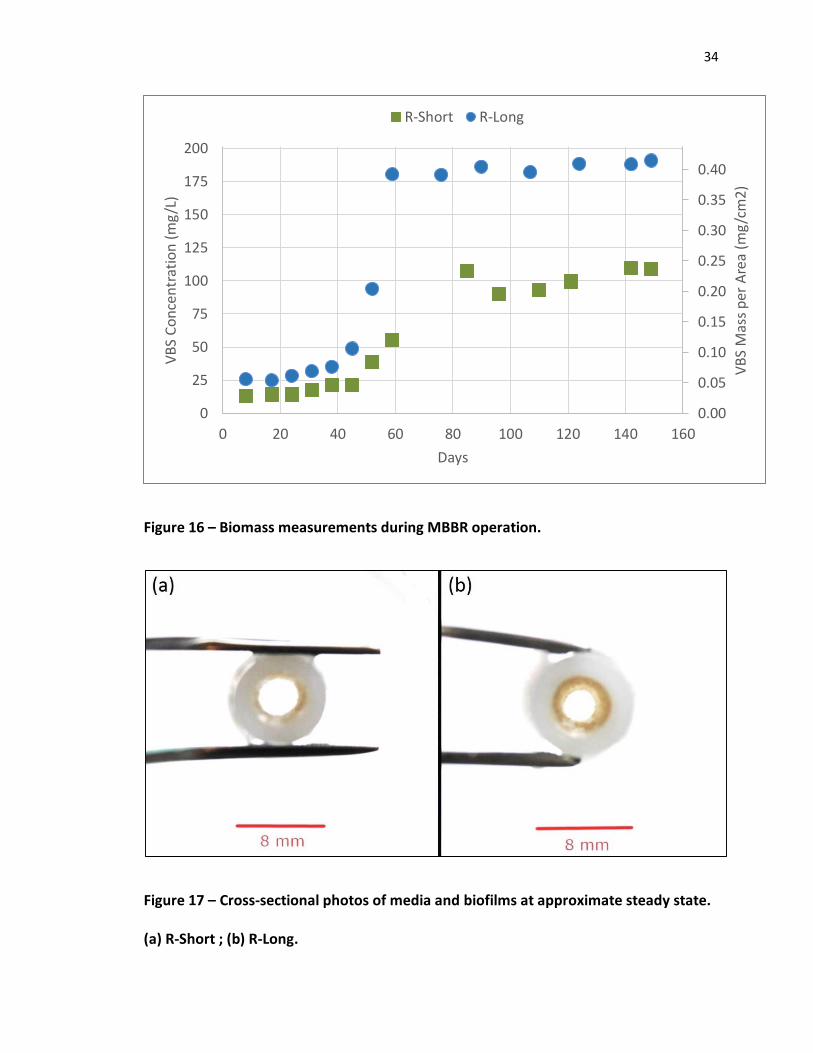
although the ammonia uptake from each reactor was similar (Figure 15). These results
are consistent with media cross sections indicating a thicker biofilm in the R-Long media
than in the R-Short media (Figure 17). In addition, the R-Long biofilm growth reached a
steady state concentration more quickly (approximately 59 days) than did the short
media (approximatetly 85 days; Figure 16). The R-Long media provided greater
resistance to flow through the media than the R-Short media, leading to lower flow
velocities and lower shear forces than in R-Short. The ammonia uptake was similar in
both reactors after 105 days (Figure 15) despite differences in biofilm concentrations.
34
Figure 16 – Biomass measurements during MBBR operation.
Figure 17 – Cross-sectional photos of media and biofilms at approximate steady state.
(a) R-Short ; (b) R-Long.
0.00
0.05
0.10
0.15
0.20
0.25
0.30
0.35
0.40
0
25
50
75
100
125
150
175
200
0 20 40 60 80 100 120 140 160
VB
S M
ass
per
Are
a (m
g/c
m2
)
VB
S C
on
cen
trat
ion
(m
g/L
)
Days
R-Short R-Long
35
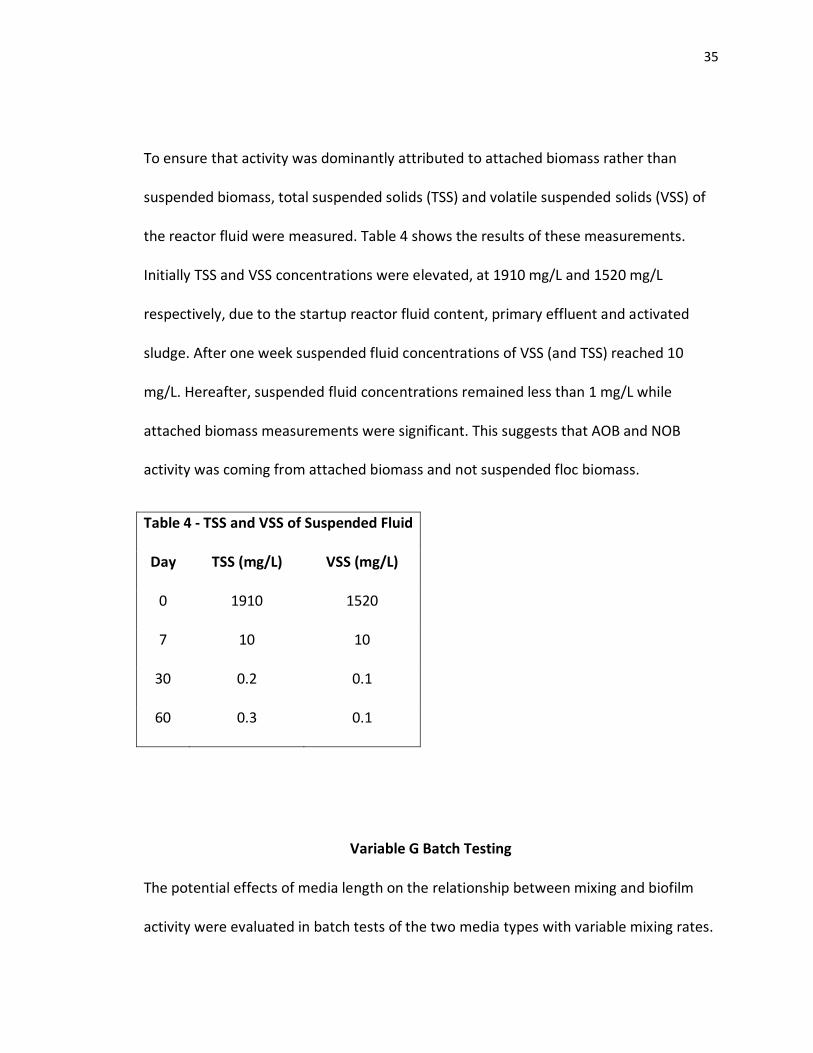
To ensure that activity was dominantly attributed to attached biomass rather than
suspended biomass, total suspended solids (TSS) and volatile suspended solids (VSS) of
the reactor fluid were measured. Table 4 shows the results of these measurements.
Initially TSS and VSS concentrations were elevated, at 1910 mg/L and 1520 mg/L
respectively, due to the startup reactor fluid content, primary effluent and activated
sludge. After one week suspended fluid concentrations of VSS (and TSS) reached 10
mg/L. Hereafter, suspended fluid concentrations remained less than 1 mg/L while
attached biomass measurements were significant. This suggests that AOB and NOB
activity was coming from attached biomass and not suspended floc biomass.
Table 4 - TSS and VSS of Suspended Fluid
Day TSS (mg/L) VSS (mg/L)
0 1910 1520
7 10 10
30 0.2 0.1
60 0.3 0.1
Variable G Batch Testing
The potential effects of media length on the relationship between mixing and biofilm
activity were evaluated in batch tests of the two media types with variable mixing rates.
36
The minimum G value required for media mixing was determined to be 185 s-1 (at lower
values dead zones of non-mixing media occurred), and so this was the minimum mixing
value used in the batch tests. For both media, the relationship between mixing rates and
ammonia flux (per biologically active, or internal, media area) followed an
approximately saturation-type relationship. Melcer and Schuler, 2014, reported similar
results, and modeled the relationship as half-order.
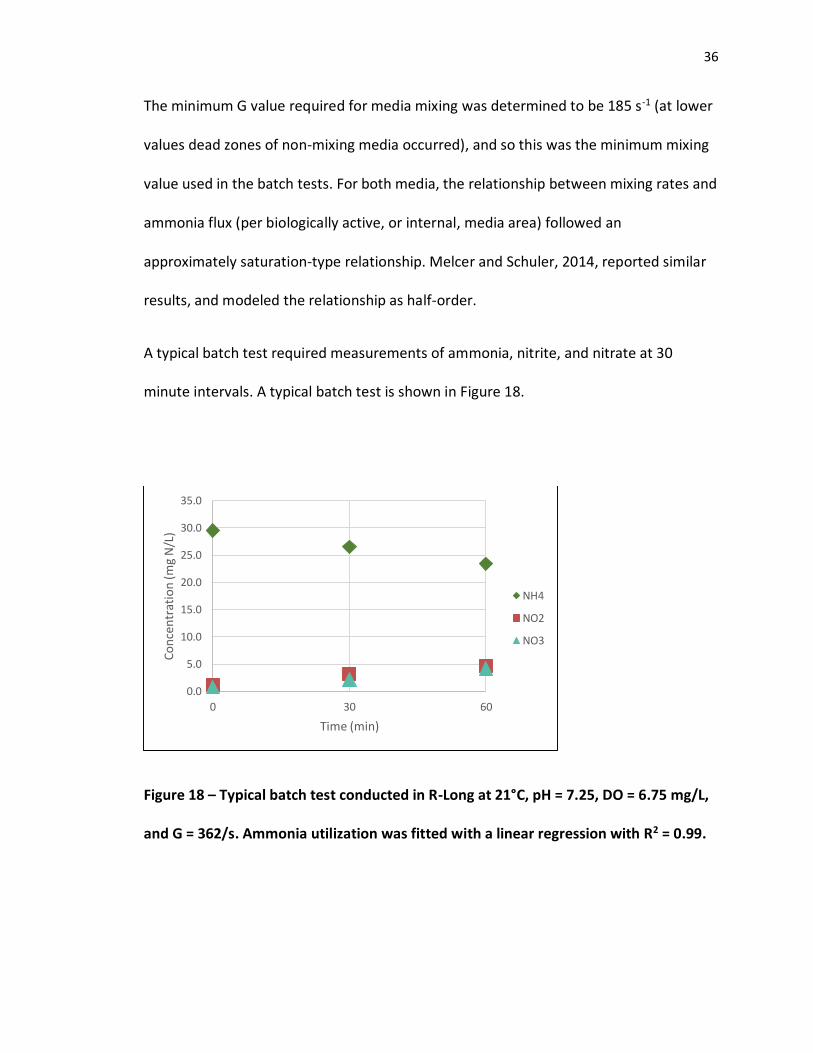
A typical batch test required measurements of ammonia, nitrite, and nitrate at 30
minute intervals. A typical batch test is shown in Figure 18.
Figure 18 – Typical batch test conducted in R-Long at 21°C, pH = 7.25, DO = 6.75 mg/L,
and G = 362/s. Ammonia utilization was fitted with a linear regression with R2 = 0.99.
0.0
5.0
10.0
15.0
20.0
25.0
30.0
35.0
0 30 60
Co
nce
ntr
atio
n (m
g N
/L)
Time (min)
NH4
NO2
NO3
37
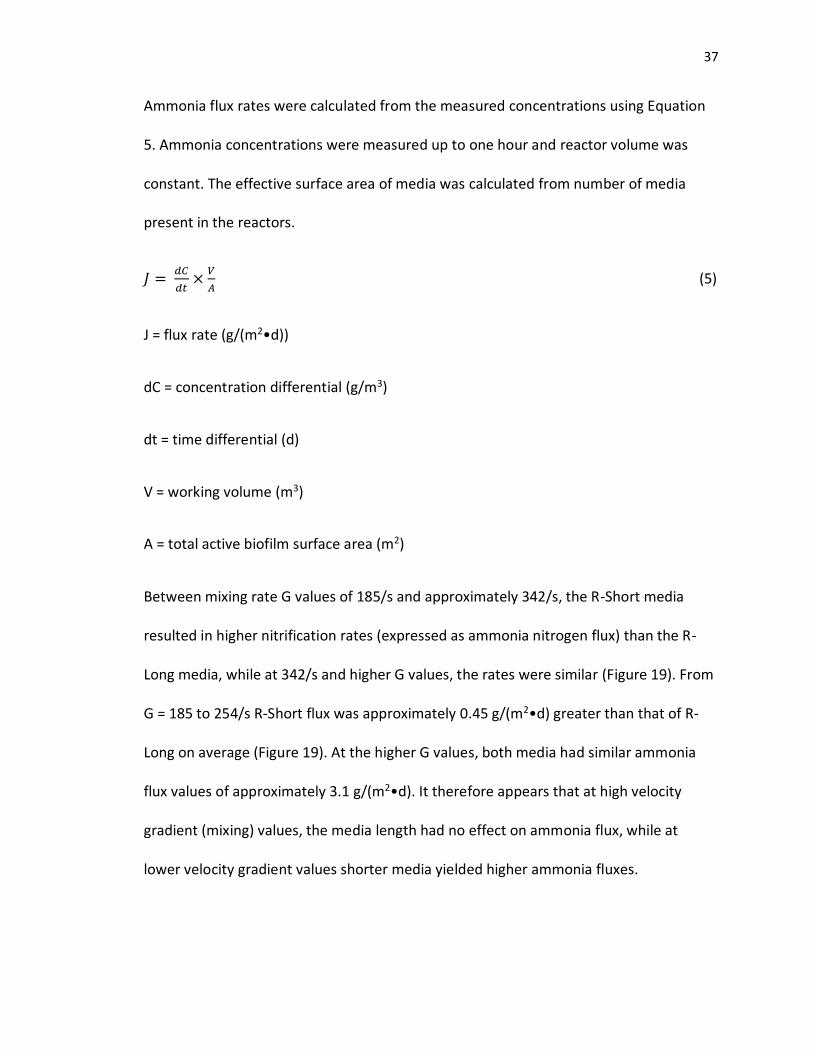
Ammonia flux rates were calculated from the measured concentrations using Equation
5. Ammonia concentrations were measured up to one hour and reactor volume was
constant. The effective surface area of media was calculated from number of media
present in the reactors.
𝐽 = 𝑑𝐶
𝑑𝑡×
𝑉
𝐴 (5)
J = flux rate (g/(m2•d))
dC = concentration differential (g/m3)
dt = time differential (d)
V = working volume (m3)
A = total active biofilm surface area (m2)
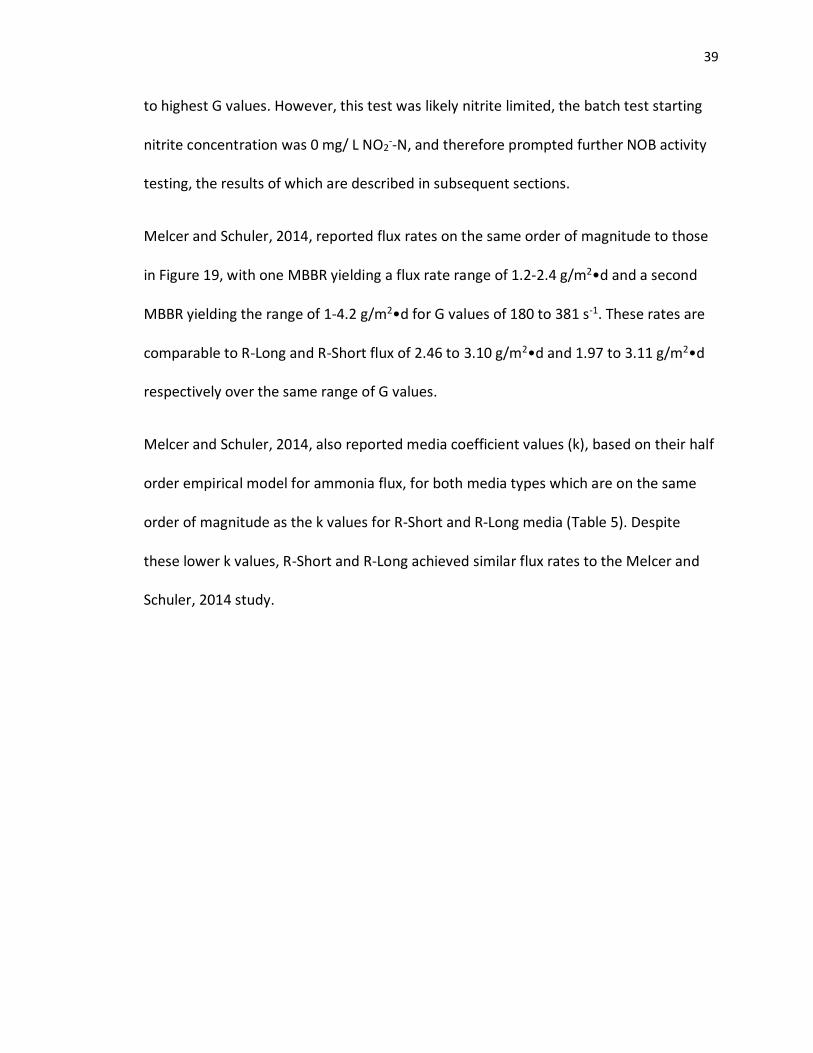
Between mixing rate G values of 185/s and approximately 342/s, the R-Short media
resulted in higher nitrification rates (expressed as ammonia nitrogen flux) than the R-
Long media, while at 342/s and higher G values, the rates were similar (Figure 19). From
G = 185 to 254/s R-Short flux was approximately 0.45 g/(m2•d) greater than that of R-
Long on average (Figure 19). At the higher G values, both media had similar ammonia
flux values of approximately 3.1 g/(m2•d). It therefore appears that at high velocity
gradient (mixing) values, the media length had no effect on ammonia flux, while at
lower velocity gradient values shorter media yielded higher ammonia fluxes.
38
These results in Figure 19 demonstrated that the shorter media was less sensitive to
mixing than was the longer media, with the shorter media flux having increased from
2.43 to 3.15 g/m2•d as mixing was increased from 185 to 342 s-1, while the longer media
increased from 1.92 to 3.16 g/m2•d over this range. Consequently, the R-Long media
flux increase was 72% greater than the R-Short media flux increase from lowest to
highest G (Figure 19 and Table 5). These results were consistent with the hypothesis
that increasing media length results in a lower internal flow velocity, as noted above,
and a thicker boundary layer. A thicker boundary layer provides greater resistance to
mass transport into and out of the biofilm, and so increasing mixing has greater
potential to increase mass transport with a thicker biofilm. In addition, it is possible that
differences in the concentrations towards the middle of the media played a role in these
results; for example, the lower internal flow velocity present in the longer media would
result in lower ammonia and oxygen concentrations towards the middle of the media
due to flux into the biofilm, which would tend to decrease rates of reaction toward the
media middle, particularly at lower mixing rates when internal flow velocities are
minimal. As mixing rates increase, the concentrations along the length of the media
approach those of the bulk media. Because this effect is expected to be less pronounced
in shorter media, it could also explain the observed differences in responses to mixing
by the two media. The relative contribution of these two phenomena to observed
differences between the two media is not known.
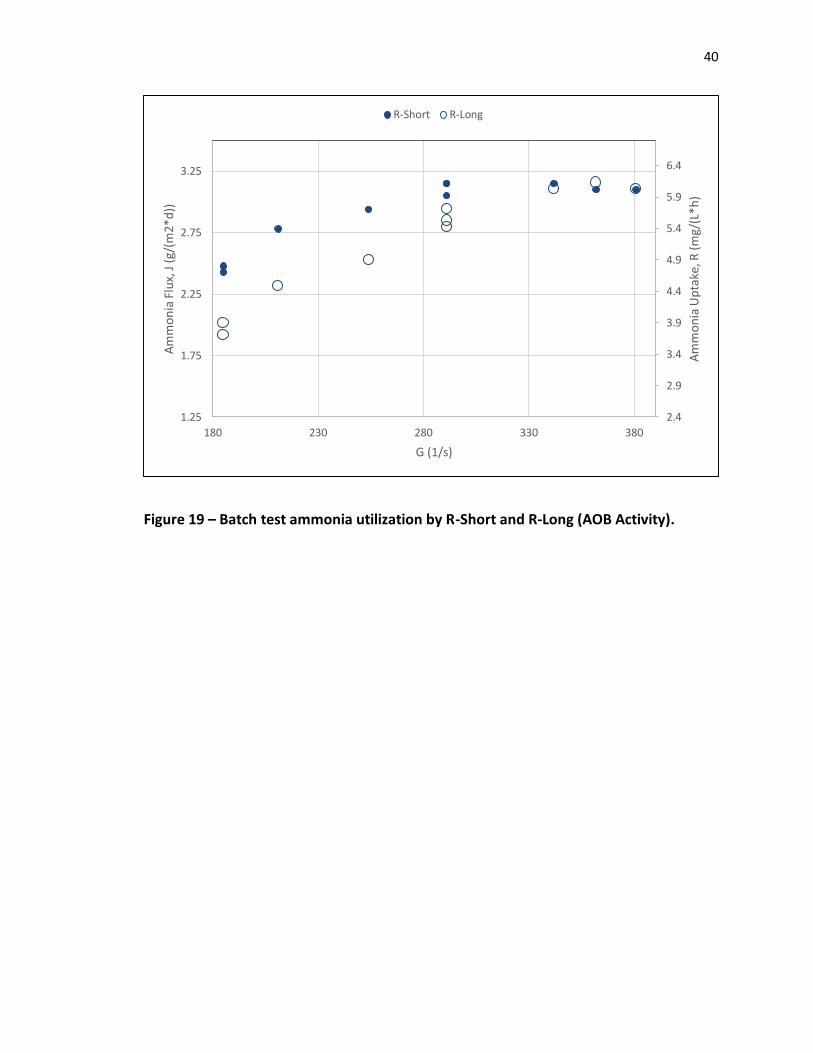
Nitrate production was also measured in R-Short and R-Long (Figure 20). Flux rates were
very similar between R-Short and R-Long ranging from 0.98 to 1.50 g/m2•d from lowest
39
to highest G values. However, this test was likely nitrite limited, the batch test starting
nitrite concentration was 0 mg/ L NO2--N, and therefore prompted further NOB activity
testing, the results of which are described in subsequent sections.
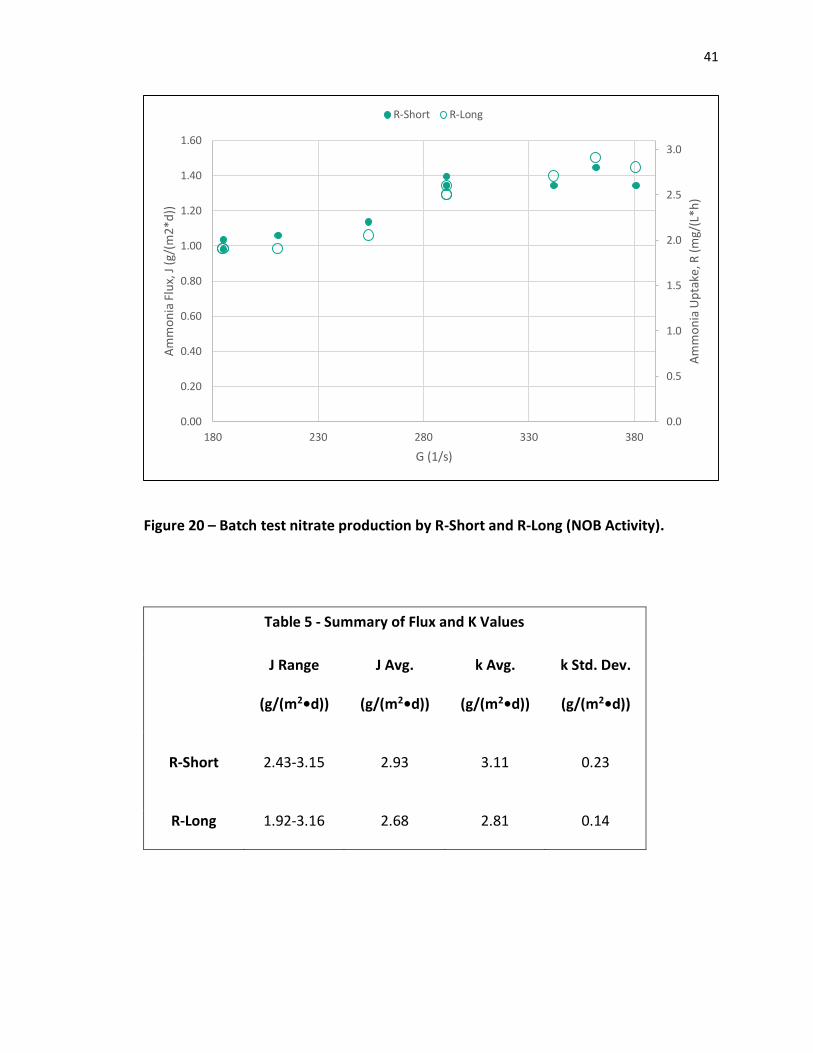
Melcer and Schuler, 2014, reported flux rates on the same order of magnitude to those
in Figure 19, with one MBBR yielding a flux rate range of 1.2-2.4 g/m2•d and a second
MBBR yielding the range of 1-4.2 g/m2•d for G values of 180 to 381 s-1. These rates are
comparable to R-Long and R-Short flux of 2.46 to 3.10 g/m2•d and 1.97 to 3.11 g/m2•d
respectively over the same range of G values.
Melcer and Schuler, 2014, also reported media coefficient values (k), based on their half
order empirical model for ammonia flux, for both media types which are on the same
order of magnitude as the k values for R-Short and R-Long media (Table 5). Despite
these lower k values, R-Short and R-Long achieved similar flux rates to the Melcer and
Schuler, 2014 study.
40
Figure 19 – Batch test ammonia utilization by R-Short and R-Long (AOB Activity).
2.4
2.9
3.4
3.9
4.4
4.9
5.4
5.9
6.4
1.25
1.75
2.25
2.75
3.25
180 230 280 330 380
Am
mo
nia
Up
take
, R (
mg/
(L*
h)
Am
mo
nia
Flu
x, J
(g/
(m2*
d))
G (1/s)
R-Short R-Long
41
Figure 20 – Batch test nitrate production by R-Short and R-Long (NOB Activity).
Table 5 - Summary of Flux and K Values
J Range
(g/(m2•d))
J Avg.
(g/(m2•d))
k Avg.
(g/(m2•d))
k Std. Dev.
(g/(m2•d))
R-Short 2.43-3.15 2.93 3.11 0.23
R-Long 1.92-3.16 2.68 2.81 0.14
0.0
0.5
1.0
1.5
2.0
2.5
3.0
0.00
0.20
0.40
0.60
0.80
1.00
1.20
1.40
1.60
180 230 280 330 380
Am
mo
nia
Up
take
, R (
mg/
(L*h
)
Am
mo
nia
Flu
x, J
(g/
(m2*
d))
G (1/s)
R-Short R-Long
42
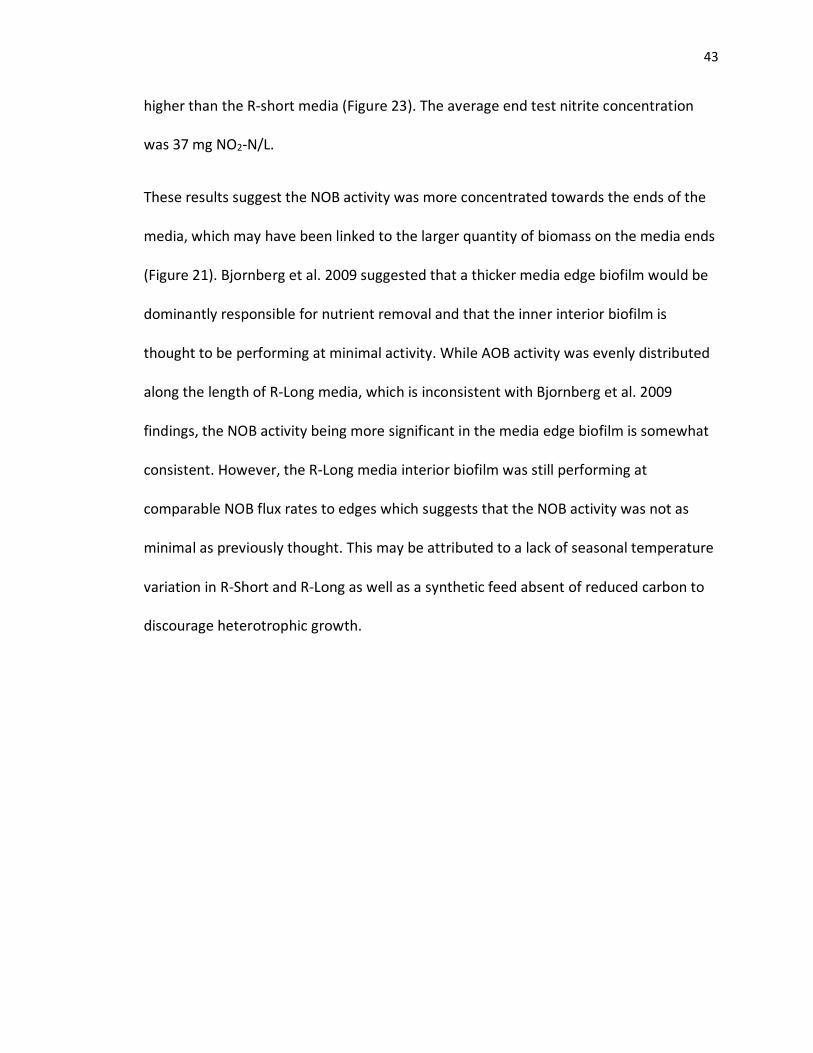
Variability along media length
Differences in biofilm mass and activity along the length of media were quantified by
sectioning the R-Long media into thirds, which were divided into “middle” and “end”
sections for further analyses. During the steady state period of biofilm mass (after day
59, Figure 16), the R-long end sections had on average of 0.134 mg VBS/cm2, or 27%
more biomass than the middle sections, which was a statistically significant difference (p
< 0.01) (Figure 21). The greater concentration of biomass on the outer portions of the
MBBR media was consistent with a previous report (Bjornberg et al. 2009), and may
have been due to lower substrate (ammonia or oxygen) concentrations in the media
interior.
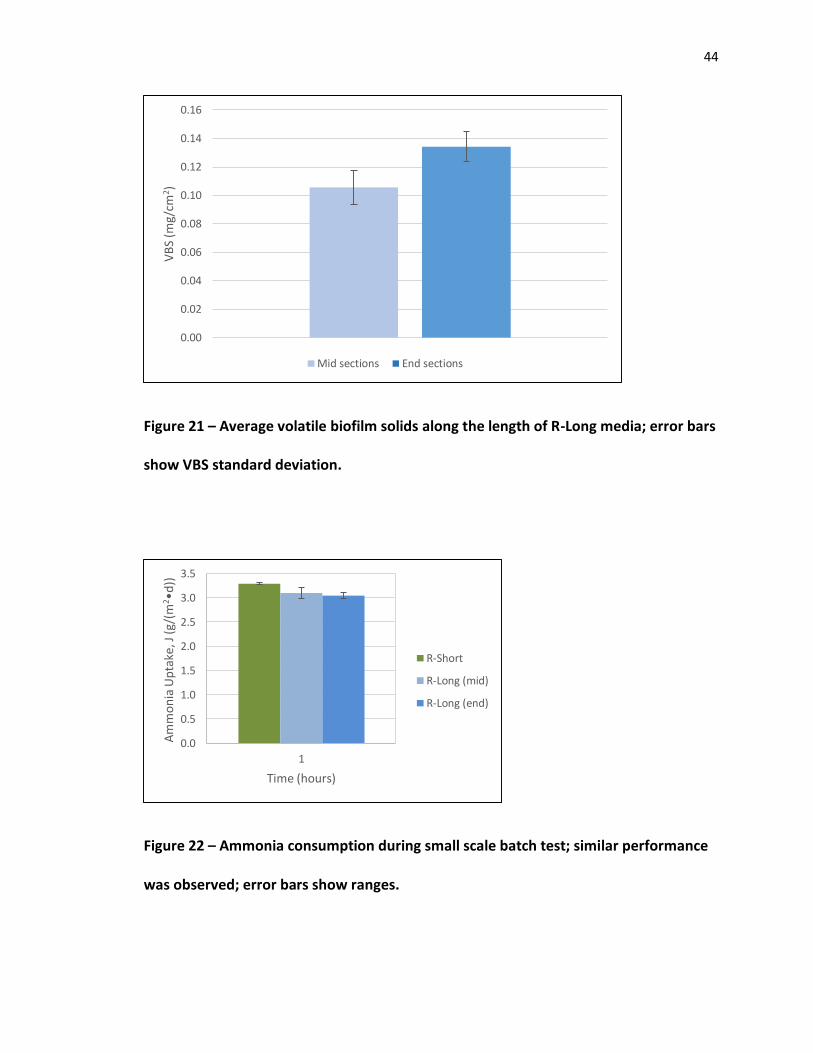
Batch tests were done of the media sections with added ammonia (to test AOB activity)
and nitrite (to test NOB activity), and an equal area quantity of R-short media was tested
as well for comparison. Ammonia uptake by the end and middle R-Long sections, and
also the R-short media were nearly identical (Figure 22), with an average flux over the
one hour test of 3.15 g/(m2*d). The end test ammonia concentration was
approximately 27 mg NH4-N/L.
This suggests that the AOB activity was distributed fairly evenly along the length of the
R-Long media, and that these were also similar to the R-short media, despite differences
in the biofilm quantities for the three biofilm sources (Figure 21). However, the nitrate
production by the R-Long end section flux rates were consistently greater than R-Long
mid sections and R-Short sections, and the R-Long mid sections had a flux rate slightly
43
higher than the R-short media (Figure 23). The average end test nitrite concentration
was 37 mg NO2-N/L.
These results suggest the NOB activity was more concentrated towards the ends of the
media, which may have been linked to the larger quantity of biomass on the media ends
(Figure 21). Bjornberg et al. 2009 suggested that a thicker media edge biofilm would be
dominantly responsible for nutrient removal and that the inner interior biofilm is
thought to be performing at minimal activity. While AOB activity was evenly distributed
along the length of R-Long media, which is inconsistent with Bjornberg et al. 2009
findings, the NOB activity being more significant in the media edge biofilm is somewhat
consistent. However, the R-Long media interior biofilm was still performing at
comparable NOB flux rates to edges which suggests that the NOB activity was not as
minimal as previously thought. This may be attributed to a lack of seasonal temperature
variation in R-Short and R-Long as well as a synthetic feed absent of reduced carbon to
discourage heterotrophic growth.
44
Figure 21 – Average volatile biofilm solids along the length of R-Long media; error bars
show VBS standard deviation.
Figure 22 – Ammonia consumption during small scale batch test; similar performance
was observed; error bars show ranges.
0.00
0.02
0.04
0.06
0.08
0.10
0.12
0.14
0.16
VB
S (m
g/cm
2 )
Mid sections End sections
0.0
0.5
1.0
1.5
2.0
2.5
3.0
3.5
1
Am
mo
nia
Up
take
, J (
g/(m
2 •d
))
Time (hours)
R-Short
R-Long (mid)
R-Long (end)
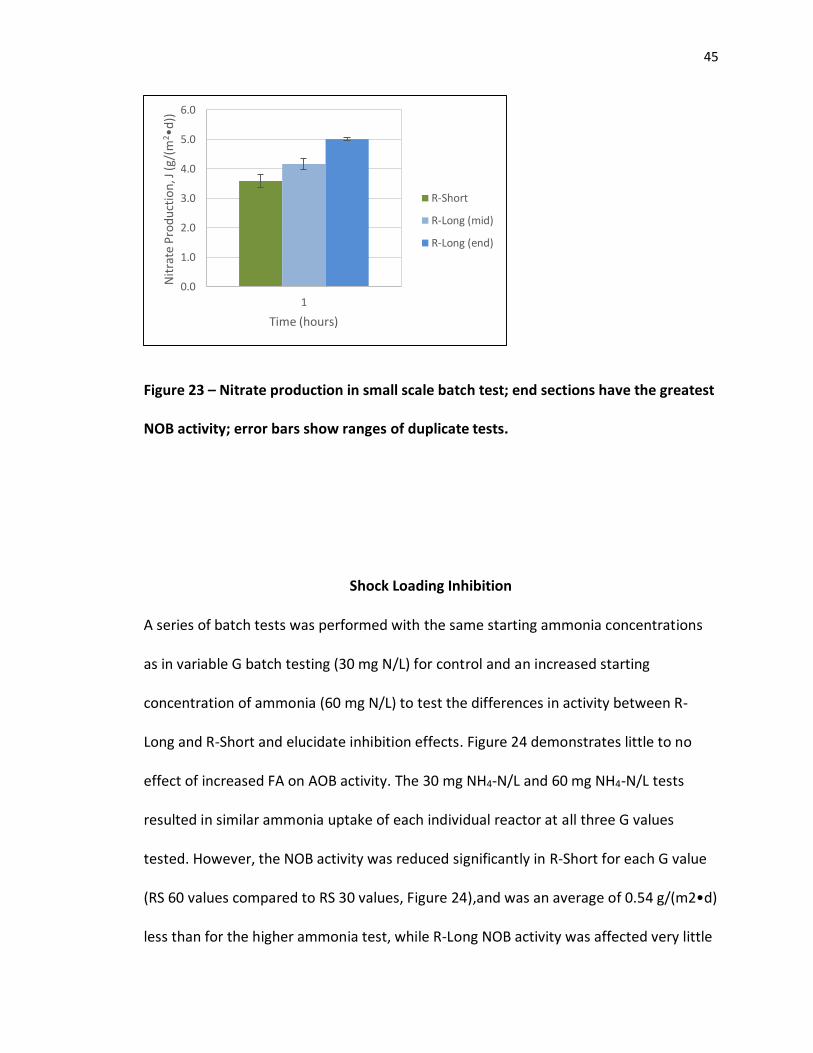
45
Figure 23 – Nitrate production in small scale batch test; end sections have the greatest
NOB activity; error bars show ranges of duplicate tests.
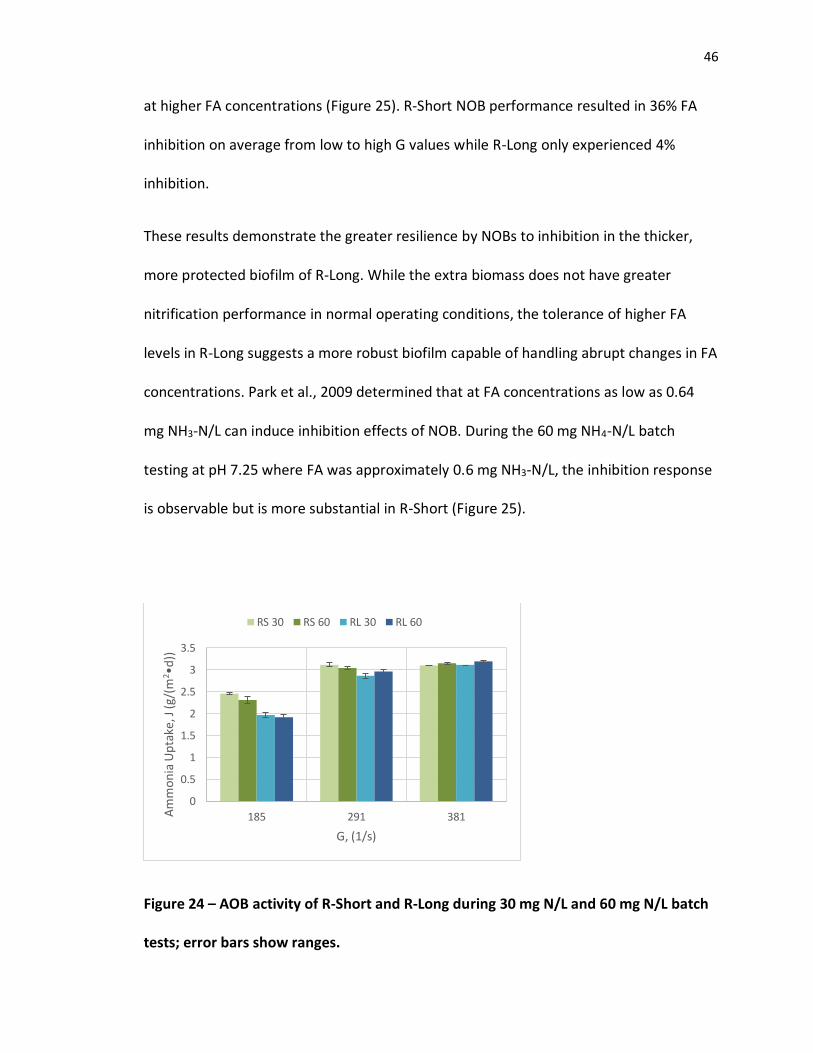
Shock Loading Inhibition
A series of batch tests was performed with the same starting ammonia concentrations
as in variable G batch testing (30 mg N/L) for control and an increased starting
concentration of ammonia (60 mg N/L) to test the differences in activity between R-
Long and R-Short and elucidate inhibition effects. Figure 24 demonstrates little to no
effect of increased FA on AOB activity. The 30 mg NH4-N/L and 60 mg NH4-N/L tests
resulted in similar ammonia uptake of each individual reactor at all three G values
tested. However, the NOB activity was reduced significantly in R-Short for each G value
(RS 60 values compared to RS 30 values, Figure 24),and was an average of 0.54 g/(m2•d)
less than for the higher ammonia test, while R-Long NOB activity was affected very little
0.0
1.0
2.0
3.0
4.0
5.0
6.0
1
Nit
rate
Pro
du
ctio
n, J
(g/
(m2 •
d))
Time (hours)
R-Short
R-Long (mid)
R-Long (end)
46
at higher FA concentrations (Figure 25). R-Short NOB performance resulted in 36% FA
inhibition on average from low to high G values while R-Long only experienced 4%
inhibition.
These results demonstrate the greater resilience by NOBs to inhibition in the thicker,
more protected biofilm of R-Long. While the extra biomass does not have greater
nitrification performance in normal operating conditions, the tolerance of higher FA
levels in R-Long suggests a more robust biofilm capable of handling abrupt changes in FA
concentrations. Park et al., 2009 determined that at FA concentrations as low as 0.64
mg NH3-N/L can induce inhibition effects of NOB. During the 60 mg NH4-N/L batch
testing at pH 7.25 where FA was approximately 0.6 mg NH3-N/L, the inhibition response
is observable but is more substantial in R-Short (Figure 25).
Figure 24 – AOB activity of R-Short and R-Long during 30 mg N/L and 60 mg N/L batch
tests; error bars show ranges.
0
0.5
1
1.5
2
2.5
3
3.5
185 291 381Am
mo
nia
Up
take
, J (
g/(m
2 •d
))
G, (1/s)
RS 30 RS 60 RL 30 RL 60
47
Figure 25 – NOB activity of R-Short and R-Long during 30 mg N/L and 60 mg N/L batch
tests; error bars show ranges.
pH Inhibition
After observing effects of inhibition on NOBs by FA, pH change was studied through
another series of batch tests. High pH 8.50 and low pH 6.00 batch tests were conducted
with added ammonia and nitrite to observe effects of pH induced speciation of
substrates. High pH batch tests resulted in an increase of unionized ammonia
(ammonium pKa = 9.25) while the low pH batch tests increased concentrations of nitrous
acid (nitrous acid pKa = 3.40).
The results shown in Figure 26 demonstrate the effect of FNA inhibition on AOB in R-
Short and R-Long. From neutral pH 7.25 to low pH 6.00, there was an effect of 49%
0
0.5
1
1.5
2
185 291 381Nit
rate
Pro
du
ctio
n, J
(g/
(m2 •
d))
G, (1/s)
RS 30 RS 60 RL 30 RL 60
48
inhibition for R-Short and 48% inhibition for R-Long. This similar flux rate reduction in
each reactor further suggests the uniform distribution of AOB along both media types
and suggests that neither is more protected in the biofilm despite the longer media
having a lower internal flow velocity than the shorter media. At higher pH the flux rate
for ammonia utilization increased by 13% for R-Short and 21% for R-Long. This is
attributed to lower concentrations of FNA at higher pH resulting in a very low inhibition
effect on AOB.
Effects of pH on NOB activity are shown in Figure 27. Nitratation rates were consistently
greater in R-Long than R-Short for all pH values. This is attributed to the greater free
ammonia concentrations in this series of batch tests affecting R-Short more than R-
Long. Continuous operation free ammonia concentrations were not inhibiting which is
why the same effect isn’t observed at steady state conditions. From neutral pH 7.25 to
high pH 8.50, R-Short had a substantial inhibition effect of 76% while R-Long only
exhibited 14% inhibition. The thicker biofilm in R-Long therefore appeared to provide
greater protection to the NOB to NH3 than the thinner R-Short biofilm. At low pH 6.00
the NOB in both systems had higher nitratation flux rates than at neutral pH 7.25 due to
the near absence of FA. See Table 6 for calculated amounts of FA per total ammonia
species at pH values in the range of this batch test series.
Since NOB sensitivity to FA inhibitionwas apparent, MBBR systems with shorter media
like R-Short would be more favorable in very stable (stable pH and influent ammonia
loading rates) full scale systems or full scale shortcut biological nitrogen removal
49
processes. These processes such as ANAMMOX and SHARON require nitrite
accumulation to be successful in nitrogen removal and to achieve this nitrite
accumulation the NOB activity needs to be completely suppressed; this can be achieved
with high FA concentrations (He et al., 2012; Hellinga et al., 1998; Park et al., 2010).
Figure 26 – AOB activity during variable pH batch tests; error bars show ranges.
0.0
0.5
1.0
1.5
2.0
2.5
3.0
3.5
Am
mo
nia
Up
take
, J (
g/(m
2 •d
))
RS (6.00) RS (7.25) RS (8.50) RL (6.00) RL (7.25) RL (8.50)
0.0
0.5
1.0
1.5
2.0
Nit
rate
Pro
du
ctio
n, J
(g/
(m2 •
d))
RS (6.00) RS (7.25) RS (8.50) RL (6.00) RL (7.25) RL (8.50)
50
Figure 27 – NOB activity during variable pH batch tests; error bars show ranges.
Table 6 – Calculated Ammonia and Nitrous Acid Speciation
pH [NH3]/[NH4+] % [HNO2]/[NO2-]
6 0.1% 0.3%
6.5 0.2% 0.1%
7 0.6% 0.0%
7.5 1.8% 0.0%
8 5.6% 0.0%
8.5 17.8% 0.0%
To ensure that inhibition effects were being driven by chemical speciation, rather than
simply pH, a series of batch tests was performed without any starting FA for NOB while
another series of tests was conducted without any starting FNA for AOB.
The AOB activity results are shown in Figure 28. Starting the batch test with no nitrite
kept FNA close to zero at neutral and low pH for the duration of the test. Some nitrite
was produced during the test but concentrations were low enough to prevent
significant FNA accumulation. Also worth noting are the ammonia flux rates for this test

51
of near 3 g/(m2•d) (Figure 28) were similar to the flux rates at neutral pH where
ammonia and nitrite were both added (Figure 26).
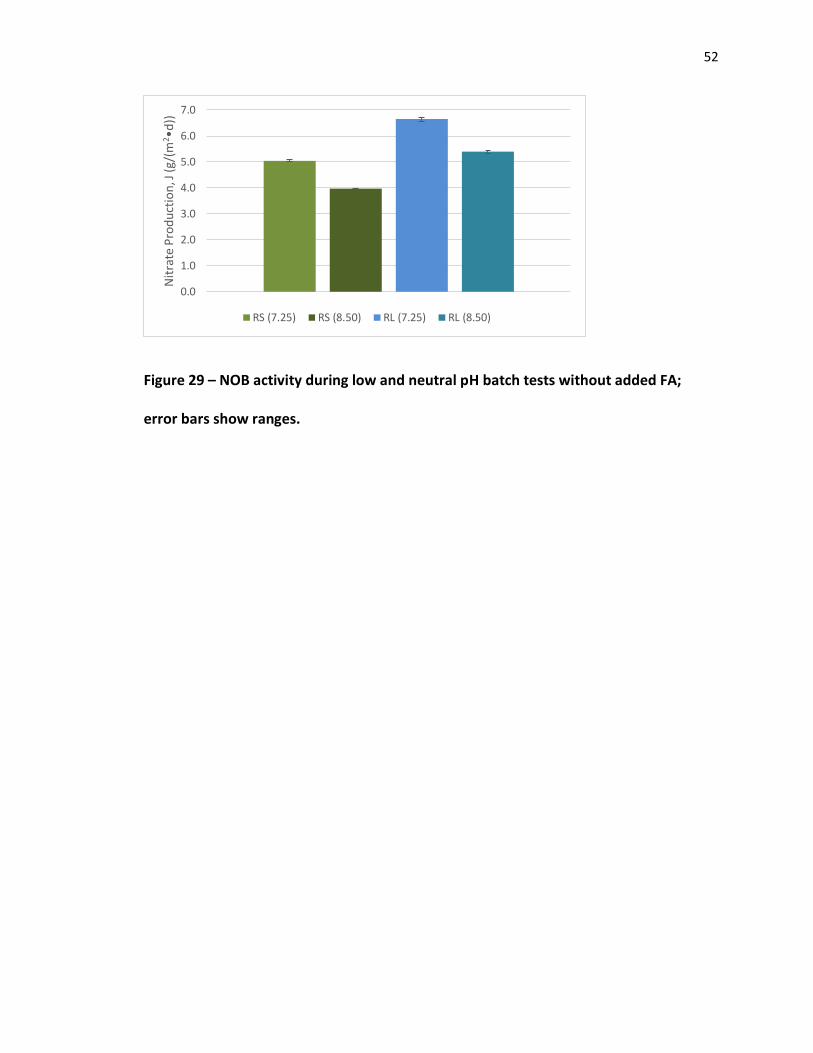
NOB activity was notably lower at pH 8.50 during the batch test series with no starting
ammonia (Figure 29). Again, R-Long nitratation rates were consistently greater than R-
Short nitratation rates across all pH values as in the previous test with starting ammonia
and nitrite. The flux rates in this test series were near double the flux rates for the pH
7.25 tests with added ammonia and nitrite (Figure 27) which suggests that FA was the
dominant cause of inhibition at higher pH, with even slight inhibition at neutral pH.
Figure 28 – AOB activity during low and neutral pH batch tests without added FNA;
error bars show ranges.
0.0
0.5
1.0
1.5
2.0
2.5
3.0
3.5
Am
mo
nia
Up
take
, J (
g/(m
2•d
))
RS (6.00) RS (7.25) RL (6.00) RL (7.25)
52
Figure 29 – NOB activity during low and neutral pH batch tests without added FA;
error bars show ranges.
0.0
1.0
2.0
3.0
4.0
5.0
6.0
7.0
Nit
rate
Pro
du
ctio
n, J
(g/
(m2•d
))
RS (7.25) RS (8.50) RL (7.25) RL (8.50)
53
CHAPTER 5 CONCLUSIONS
To our knowledge, this study has provided the first evaluation of nitrification in MBBR
systems with media size (length) being the primary independent variable rather than
morphology or specific area of carriers. With a startup time of about 100 days, MBBR
systems are relatively quick to upgrade and retrofit into an existing municipal
wastewater treatment plant. The following conclusions can be drawn from this study:
1. Media of different length have similar performance in a continuous MBBR system
assuming low (but not limiting) effluent ammonia and near neutral pH. Shorter media
has a greater performance on a per biomass basis which may be more desirable for full
scale operation due to the shorter startup time of growing less biomass.
2. Shorter media have greater nitrification rates at low to mid range G values. High
range G values render media length irrelevant to nitrification rates. This is due to an
increased internal flow velocity causing substrate concentration along the length of the
media to approach the bulk solution concentration. This effect is not as significant in
shorter media which may be the reason for the difference in performance at low to mid
range G values. Shorter media may be more energy efficient for full scale systems
aerating/mixing at low to mid range G values.
3. More biomass attachment on the inner edges of media is correlated with higher NOB
activity. Inner edges and inner interior, although variable in mass, have similar AOB
activity suggesting a more uniform distribution of AOB along media length.
54
4. The biofilms grown on different length media responded differently to inhibition.
They exhibited similar responses to FNA inhibition of AOB, but biofilms grown on longer
media are more tolerant to FA inhibition of NOB, suggesting that longer or more
protected media may aid in preventing inhibition of nitrification. Biofilms grown on
shorter media may be more favorable in full scale implementation for systems that have
little variation in influent concentrations and pH change; additionally shorter media
biofilms are more favorable for nitrite accumulation in shortcut biological nitrogen
removal processes such as ANAMMOX or SHARON due to their inherent sensitivity to
FNA inhibition of NOB.
Further research needs include the following:
• Determine the effect of concentration along the length of the media approaching bulk
media concentration as mixing intensity increases the advective flow through media.
• Determine whether these inhibition result are consistent with other inhibitors.
• Determine effectiveness of shorter media implemenation in shortcut biological
nitrogen removal systems or for other nitrite accumulation purposes.
55
REFERENCES
American Public Health Association, American Water Works Association, Water
Environment Federation (2012). Standard Methods for the Examination of Water and
Wastewater, 22nd Edition. American Water Works Association, Washington, D.C.
Anthonisen, A.C., Loehr, R.C., Prakasam, T.B.S., Srinath, E.G., 1976. Inhibition of
nitrification by ammonia and nitrous acid. Water Environment Federation 48 (5), 835-
852.
Bjornberg, C., Lin, W., and Zimmerman, R., 2009. Effect of temperature on
biofilm
growth dynamics and nitrification kinetics in a full-scale MBBR system. Proceedings of
the WEFTEC Conference. Water Environment Federation, Alexandria, Va.
Boltz, J.P., Morgenroth, E., Sen, D., 2010. Mathematical modelling of biofilms and
biofilm reactors for engineering design. Water Science and Technology 62 (1), 1821-
1836.
Chung, J., Bae, W., Lee, Y.W., Rittmann, B.E., 2007. Shortcut biological nitrogen
removal in hybrid biofilm/suspended growth reactors. Process Biochemistry 42 (1), 320-
328.
Eberl, H., Morgenroth, E., Noguera, D., Picioreanu, C., Rittmann, B., van Loosdrecht, M.,
and Wanner, O., (2006). Mathematical Modeling of Biofilms. Scientific and
TechnicalReport No. 18, IWA Publishing: London, England.
56
He, Y., Wendong, T., Ziyuan, W., Walid, S., 2012. Effects of pH and seasonal
temperature variation on simultaneous partial nitrification and anammox in free-water
surface wetlands. Journal of Environmental Management 110 (1), 103-109.
Hellinga C., Schellen A.A.J.C., Mulder J.W., van Loosdrecht M.C.M., Heijnen J.J.,
1998. The SHARON process: an innovative method for nitrogen removal from
ammonium-rich waste water. Water Science and Technology 37 (9), 135–42.
Hem, L.J., Rusten, B. and Ødegaard, H., (1994). Nitrification in a moving-bed
biofilm reactor. Water Research 28 (6), 1425–1433.
Henze, M., Van Loosdrecht, M.C.M., Ekama, G.A., and Brdjanovic, D., (2008).
Biological Wastewater Treatment: Principles, Modelling, and Design. IWA Publishing,
London, England.
Javid, A.H., Hassani, A.H., Ghanbari, B., Yaghmaeian, K., 2013. Feasibility of
utilizing movine bed biofilm reactor to upgrade and retrofit municipal wastewater
treatment plants. International Journal of Environmental Research 7 (4), 963-972.
Kim, D.J., Ahn, D.H., Lee, D.I., 2005. Effects of free ammonia and dissolved
oxygen on nitrification and nitrite accumulation in a biofilm airlift reactor. Journal of
Chemical Engineering 22 (1), 85-90.
McQuarrey, J.P., Boltz, J.P., 2011. Moving bed biofilm reactor technology:
process applications, design, and performance. Water Environment Research 83 (6),
560-575.
57
Melcer and Schuler. 2014. Mass Transfer Characteristics of Floating Media in
MBBR and IFAS Fixed-Film Systems. Project U4R11 Final Report. Water Environment
Research Foundation.
Ødegaard, H., Rusten, B., Westrum, T., 1994. A new moving bed bofilm reactor—
applications and results. Water Science and Technology 29 (10–11), 157–165.
Ødegaard, H., Gisvold, B., and Strickland, J., 2000. The influence of carrier size
and shape in the moving bed biofilm process. Water Science and Technology 41 (4-5),
383–391.
Ødegaard, H., 2006. Innovations in wastewater treatment: the moving bed
biofilm process. Water Science and Technology 53 (9), 17-33.
Okabe S., Satoh H., Watanabe Y., 1999. In situ analysis of nitrifying biofilms as
determined by in situ hybridization and the use of microelectrodes. Applied
Environmental Microbiology 65 (7), 3182–3191.
Park, S., Bae, W., 2009. Modeling kinetics of ammonium oxidation and nitrite
oxidation under simultaneous inhibition by free ammonia and free nitrous acid. Process
Biochemistry 44 (1), 631-640.
Park, S., Bae, W., Rittmann, B.E., 2010. Operational boundaries for nitrite
accumulation in nitrification based on minimum/maximum substrate concentrations
that include effects of oxygen limitation, pH, and free ammonia and free nitrous acid
inhibition. Environmental Science and Technology 44 (1), 335-342.
Parker, D.S., (2010). A consultant’s perspective on process design for biofilm
based wastewater treatment processes in North America. Proceedings of WEF-IWA
58
Biofilm Reactor Technology 2010 Conference, Portland, Ore., Water Environment
Federation: Alexandria, Va.
Rusten, B., Hem, L.J., and Ødegaard, H., 1995. Nitrification of municipal
wastewater in moving-bed biofilm reactors. Water Environment Research 67 (1), 75–86.
Rusten, B., McCoy, M., Proctor, R. and Siljudalen, J.G., 1998. The innovative
moving bed biofilm reactor/solids contact reaeration process for secondary treatment
of municipal wastewater. Water Environment Research 70 (5), 1083–1089.
Tchobanoglous, G., Franklin L.B., and H.D. Stensel. Wastewater Engineering:
Treatment and Reuse. Boston: McGraw-Hill, 2003. Print.
59
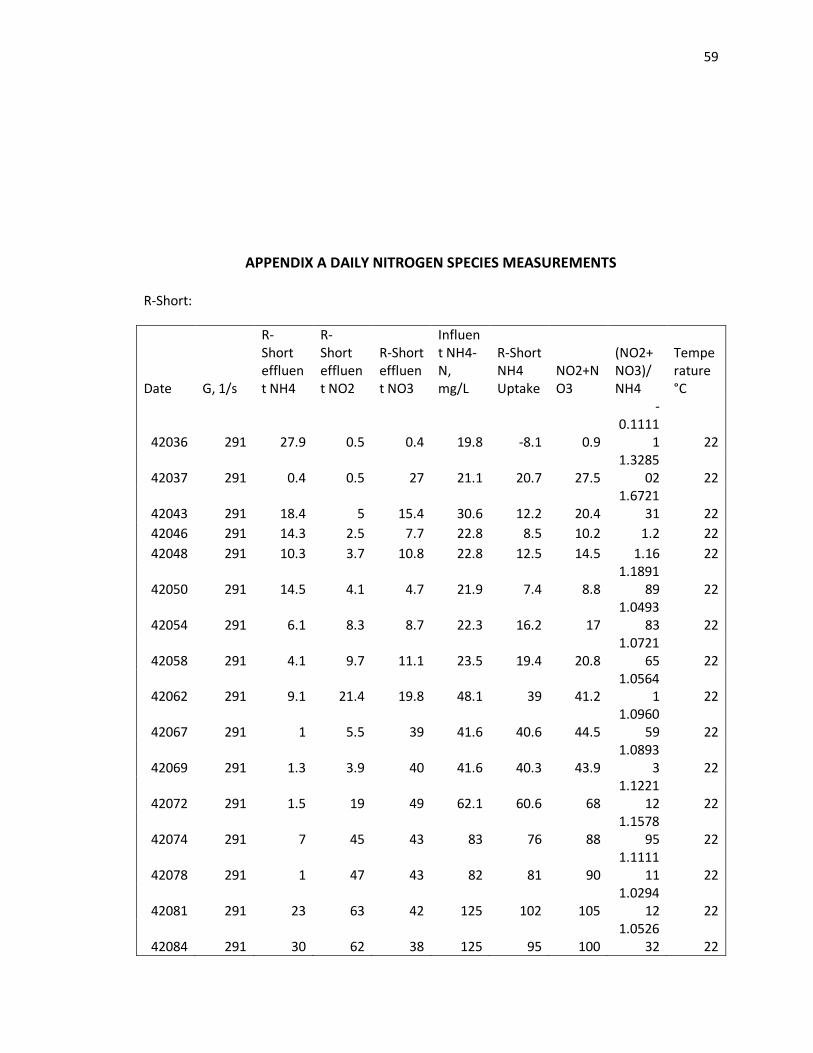
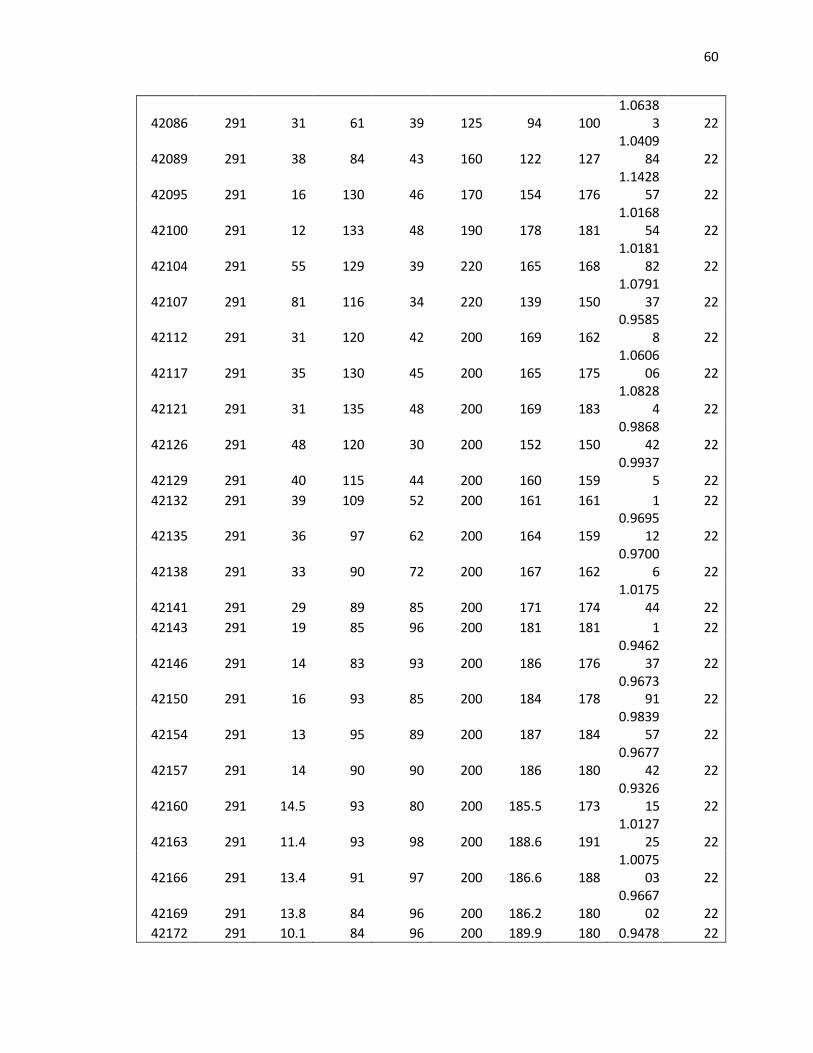
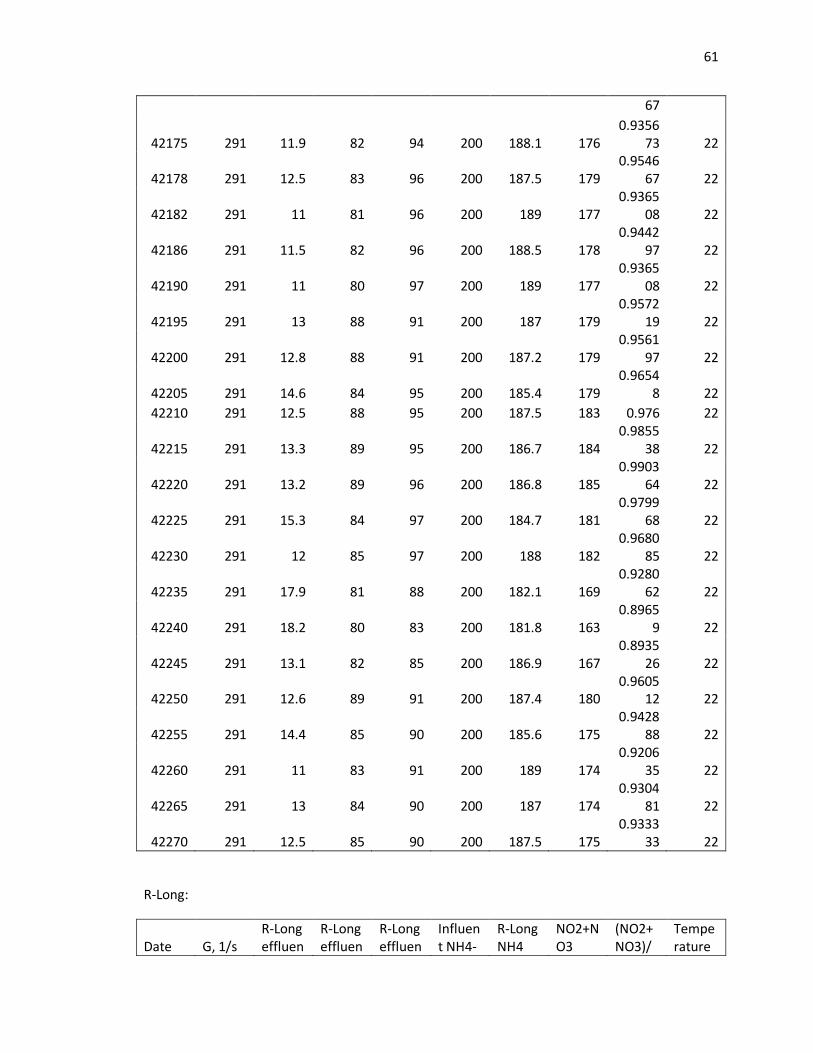
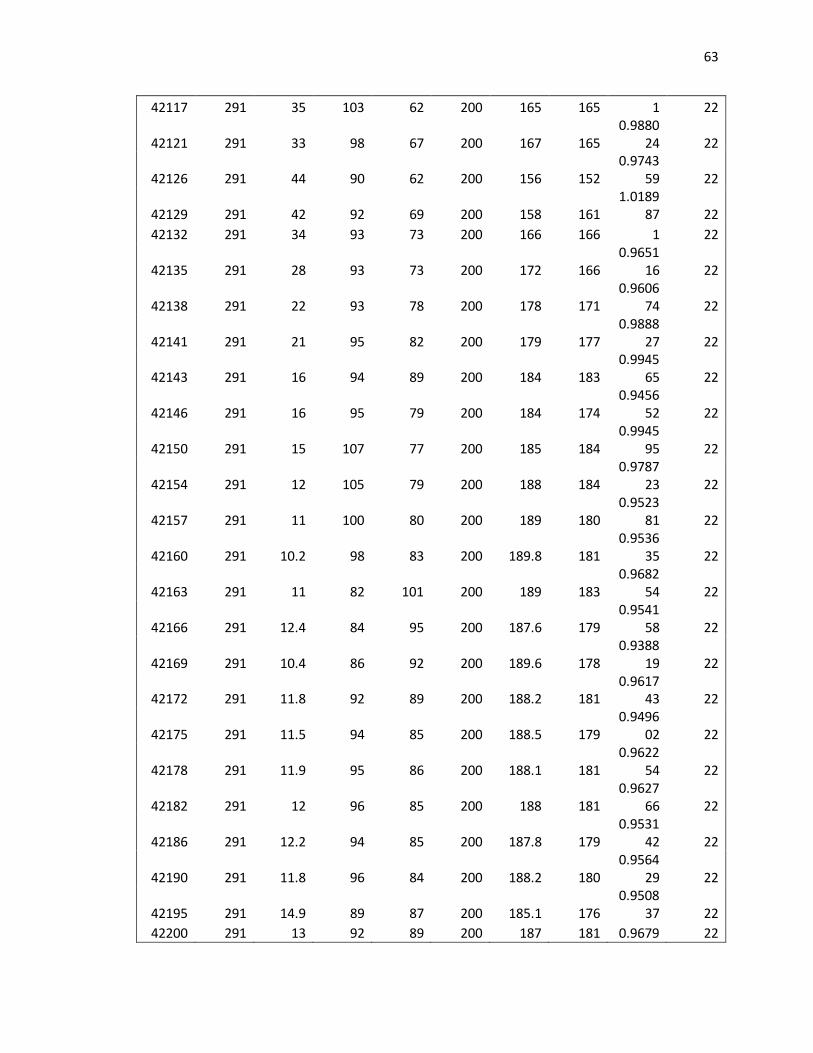
APPENDIX A DAILY NITROGEN SPECIES MEASUREMENTS
R-Short:
Date G, 1/s
R-Short effluent NH4
R-Short effluent NO2
R-Short effluent NO3
Influent NH4-N, mg/L
R-Short NH4 Uptake
NO2+NO3
(NO2+NO3)/NH4
Temperature °C
42036 291 27.9 0.5 0.4 19.8 -8.1 0.9
-0.1111
1 22
42037 291 0.4 0.5 27 21.1 20.7 27.5 1.3285
02 22
42043 291 18.4 5 15.4 30.6 12.2 20.4 1.6721
31 22
42046 291 14.3 2.5 7.7 22.8 8.5 10.2 1.2 22
42048 291 10.3 3.7 10.8 22.8 12.5 14.5 1.16 22
42050 291 14.5 4.1 4.7 21.9 7.4 8.8 1.1891
89 22
42054 291 6.1 8.3 8.7 22.3 16.2 17 1.0493
83 22
42058 291 4.1 9.7 11.1 23.5 19.4 20.8 1.0721
65 22
42062 291 9.1 21.4 19.8 48.1 39 41.2 1.0564
1 22
42067 291 1 5.5 39 41.6 40.6 44.5 1.0960
59 22
42069 291 1.3 3.9 40 41.6 40.3 43.9 1.0893
3 22
42072 291 1.5 19 49 62.1 60.6 68 1.1221
12 22
42074 291 7 45 43 83 76 88 1.1578
95 22
42078 291 1 47 43 82 81 90 1.1111
11 22
42081 291 23 63 42 125 102 105 1.0294
12 22
42084 291 30 62 38 125 95 100 1.0526
32 22
60
42086 291 31 61 39 125 94 100 1.0638
3 22
42089 291 38 84 43 160 122 127 1.0409
84 22
42095 291 16 130 46 170 154 176 1.1428
57 22
42100 291 12 133 48 190 178 181 1.0168
54 22
42104 291 55 129 39 220 165 168 1.0181
82 22
42107 291 81 116 34 220 139 150 1.0791
37 22
42112 291 31 120 42 200 169 162 0.9585
8 22
42117 291 35 130 45 200 165 175 1.0606
06 22
42121 291 31 135 48 200 169 183 1.0828
4 22
42126 291 48 120 30 200 152 150 0.9868
42 22
42129 291 40 115 44 200 160 159 0.9937
5 22
42132 291 39 109 52 200 161 161 1 22
42135 291 36 97 62 200 164 159 0.9695
12 22
42138 291 33 90 72 200 167 162 0.9700
6 22
42141 291 29 89 85 200 171 174 1.0175
44 22
42143 291 19 85 96 200 181 181 1 22
42146 291 14 83 93 200 186 176 0.9462
37 22
42150 291 16 93 85 200 184 178 0.9673
91 22
42154 291 13 95 89 200 187 184 0.9839
57 22
42157 291 14 90 90 200 186 180 0.9677
42 22
42160 291 14.5 93 80 200 185.5 173 0.9326
15 22
42163 291 11.4 93 98 200 188.6 191 1.0127
25 22
42166 291 13.4 91 97 200 186.6 188 1.0075
03 22
42169 291 13.8 84 96 200 186.2 180 0.9667
02 22
42172 291 10.1 84 96 200 189.9 180 0.9478 22
61
67
42175 291 11.9 82 94 200 188.1 176 0.9356
73 22
42178 291 12.5 83 96 200 187.5 179 0.9546
67 22
42182 291 11 81 96 200 189 177 0.9365
08 22
42186 291 11.5 82 96 200 188.5 178 0.9442
97 22
42190 291 11 80 97 200 189 177 0.9365
08 22
42195 291 13 88 91 200 187 179 0.9572
19 22
42200 291 12.8 88 91 200 187.2 179 0.9561
97 22
42205 291 14.6 84 95 200 185.4 179 0.9654
8 22
42210 291 12.5 88 95 200 187.5 183 0.976 22
42215 291 13.3 89 95 200 186.7 184 0.9855
38 22
42220 291 13.2 89 96 200 186.8 185 0.9903
64 22
42225 291 15.3 84 97 200 184.7 181 0.9799
68 22
42230 291 12 85 97 200 188 182 0.9680
85 22
42235 291 17.9 81 88 200 182.1 169 0.9280
62 22
42240 291 18.2 80 83 200 181.8 163 0.8965
9 22
42245 291 13.1 82 85 200 186.9 167 0.8935
26 22
42250 291 12.6 89 91 200 187.4 180 0.9605
12 22
42255 291 14.4 85 90 200 185.6 175 0.9428
88 22
42260 291 11 83 91 200 189 174 0.9206
35 22
42265 291 13 84 90 200 187 174 0.9304
81 22
42270 291 12.5 85 90 200 187.5 175 0.9333
33 22
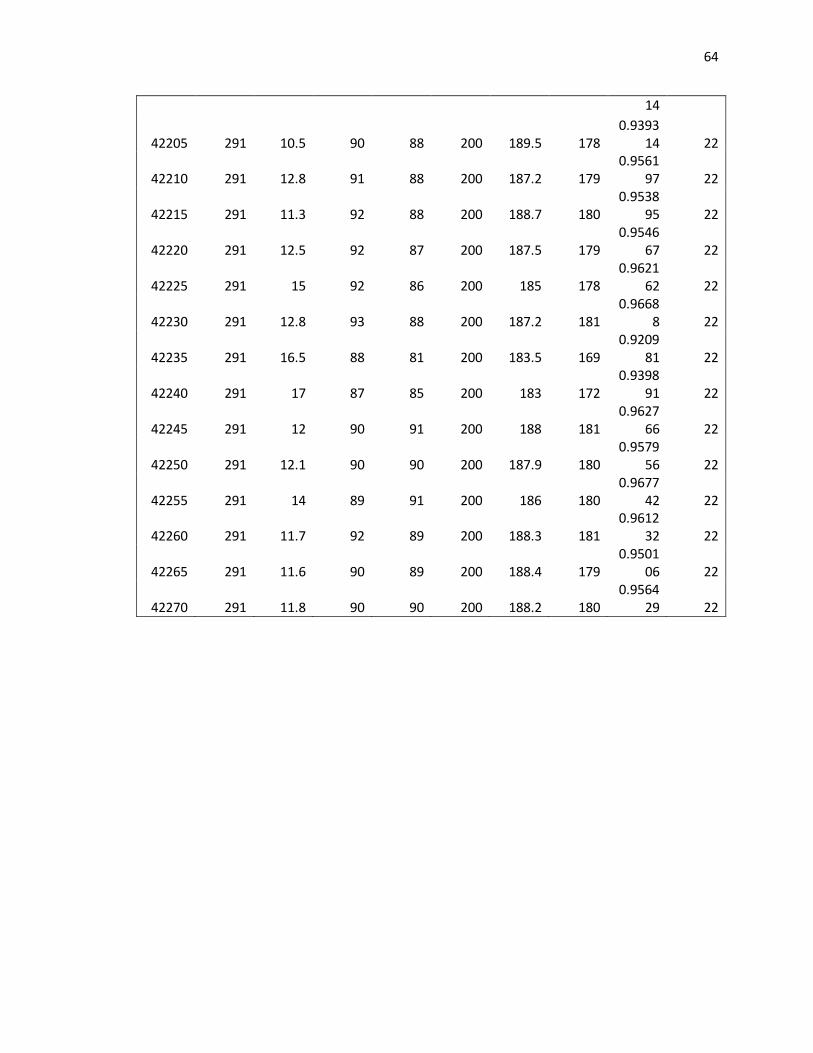
R-Long:
Date G, 1/s R-Long effluen
R-Long effluen
R-Long effluen
Influent NH4-
R-Long NH4
NO2+NO3
(NO2+NO3)/
Temperature
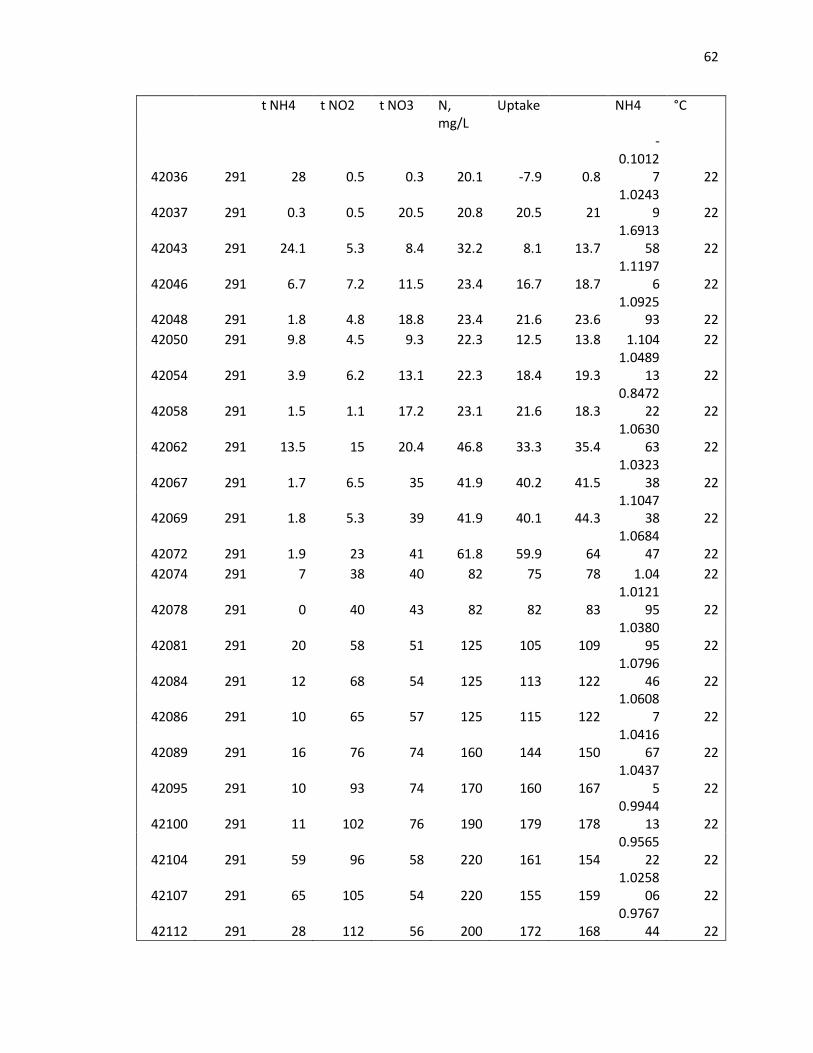
62
t NH4 t NO2 t NO3 N, mg/L
Uptake NH4 °C
42036 291 28 0.5 0.3 20.1 -7.9 0.8
-0.1012
7 22
42037 291 0.3 0.5 20.5 20.8 20.5 21 1.0243
9 22
42043 291 24.1 5.3 8.4 32.2 8.1 13.7 1.6913
58 22
42046 291 6.7 7.2 11.5 23.4 16.7 18.7 1.1197
6 22
42048 291 1.8 4.8 18.8 23.4 21.6 23.6 1.0925
93 22
42050 291 9.8 4.5 9.3 22.3 12.5 13.8 1.104 22
42054 291 3.9 6.2 13.1 22.3 18.4 19.3 1.0489
13 22
42058 291 1.5 1.1 17.2 23.1 21.6 18.3 0.8472
22 22
42062 291 13.5 15 20.4 46.8 33.3 35.4 1.0630
63 22
42067 291 1.7 6.5 35 41.9 40.2 41.5 1.0323
38 22
42069 291 1.8 5.3 39 41.9 40.1 44.3 1.1047
38 22
42072 291 1.9 23 41 61.8 59.9 64 1.0684
47 22
42074 291 7 38 40 82 75 78 1.04 22
42078 291 0 40 43 82 82 83 1.0121
95 22
42081 291 20 58 51 125 105 109 1.0380
95 22
42084 291 12 68 54 125 113 122 1.0796
46 22
42086 291 10 65 57 125 115 122 1.0608
7 22
42089 291 16 76 74 160 144 150 1.0416
67 22
42095 291 10 93 74 170 160 167 1.0437
5 22
42100 291 11 102 76 190 179 178 0.9944
13 22
42104 291 59 96 58 220 161 154 0.9565
22 22
42107 291 65 105 54 220 155 159 1.0258
06 22
42112 291 28 112 56 200 172 168 0.9767
44 22
63
42117 291 35 103 62 200 165 165 1 22
42121 291 33 98 67 200 167 165 0.9880
24 22
42126 291 44 90 62 200 156 152 0.9743
59 22
42129 291 42 92 69 200 158 161 1.0189
87 22
42132 291 34 93 73 200 166 166 1 22
42135 291 28 93 73 200 172 166 0.9651
16 22
42138 291 22 93 78 200 178 171 0.9606
74 22
42141 291 21 95 82 200 179 177 0.9888
27 22
42143 291 16 94 89 200 184 183 0.9945
65 22
42146 291 16 95 79 200 184 174 0.9456
52 22
42150 291 15 107 77 200 185 184 0.9945
95 22
42154 291 12 105 79 200 188 184 0.9787
23 22
42157 291 11 100 80 200 189 180 0.9523
81 22
42160 291 10.2 98 83 200 189.8 181 0.9536
35 22
42163 291 11 82 101 200 189 183 0.9682
54 22
42166 291 12.4 84 95 200 187.6 179 0.9541
58 22
42169 291 10.4 86 92 200 189.6 178 0.9388
19 22
42172 291 11.8 92 89 200 188.2 181 0.9617
43 22
42175 291 11.5 94 85 200 188.5 179 0.9496
02 22
42178 291 11.9 95 86 200 188.1 181 0.9622
54 22
42182 291 12 96 85 200 188 181 0.9627
66 22
42186 291 12.2 94 85 200 187.8 179 0.9531
42 22
42190 291 11.8 96 84 200 188.2 180 0.9564
29 22
42195 291 14.9 89 87 200 185.1 176 0.9508
37 22
42200 291 13 92 89 200 187 181 0.9679 22
64
14
42205 291 10.5 90 88 200 189.5 178 0.9393
14 22
42210 291 12.8 91 88 200 187.2 179 0.9561
97 22
42215 291 11.3 92 88 200 188.7 180 0.9538
95 22
42220 291 12.5 92 87 200 187.5 179 0.9546
67 22
42225 291 15 92 86 200 185 178 0.9621
62 22
42230 291 12.8 93 88 200 187.2 181 0.9668
8 22
42235 291 16.5 88 81 200 183.5 169 0.9209
81 22
42240 291 17 87 85 200 183 172 0.9398
91 22
42245 291 12 90 91 200 188 181 0.9627
66 22
42250 291 12.1 90 90 200 187.9 180 0.9579
56 22
42255 291 14 89 91 200 186 180 0.9677
42 22
42260 291 11.7 92 89 200 188.3 181 0.9612
32 22
42265 291 11.6 90 89 200 188.4 179 0.9501
06 22
42270 291 11.8 90 90 200 188.2 180 0.9564
29 22
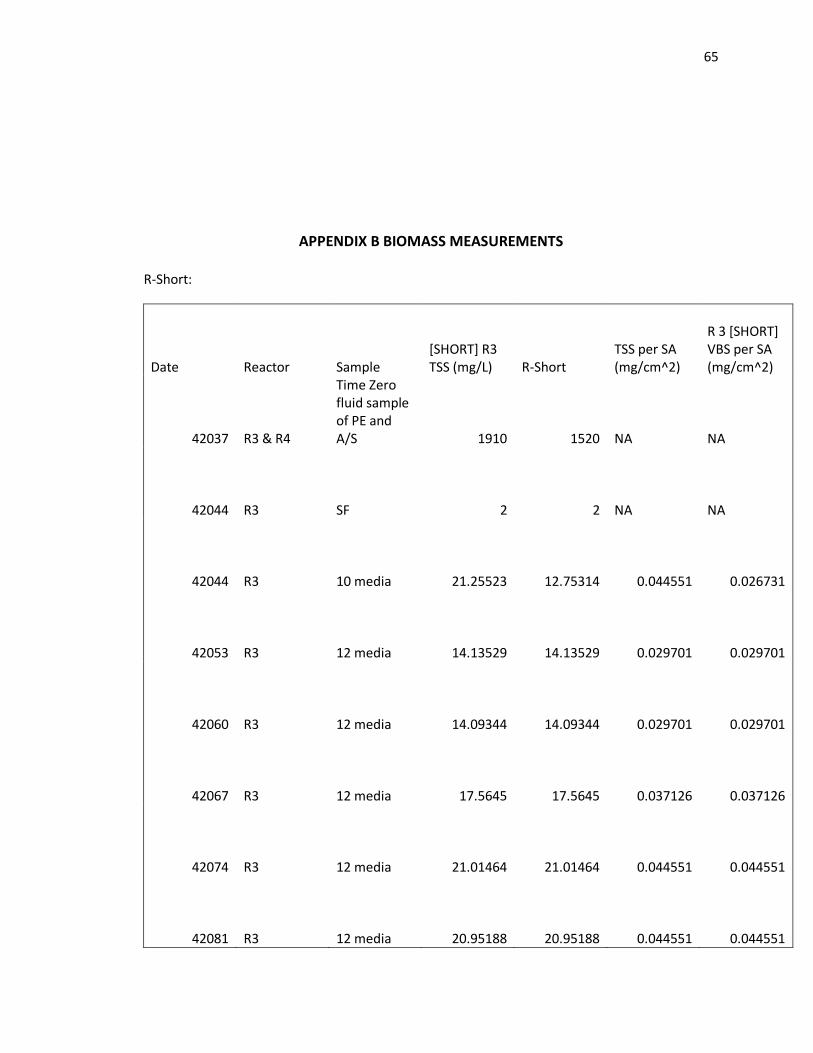
65
APPENDIX B BIOMASS MEASUREMENTS
R-Short:
Date Reactor Sample [SHORT] R3 TSS (mg/L) R-Short
TSS per SA (mg/cm^2)
R 3 [SHORT] VBS per SA (mg/cm^2)
42037 R3 & R4
Time Zero fluid sample of PE and A/S 1910 1520 NA NA
42044 R3 SF 2 2 NA NA
42044 R3 10 media 21.25523 12.75314 0.044551 0.026731
42053 R3 12 media 14.13529 14.13529 0.029701 0.029701
42060 R3 12 media 14.09344 14.09344 0.029701 0.029701
42067 R3 12 media 17.5645 17.5645 0.037126 0.037126
42074 R3 12 media 21.01464 21.01464 0.044551 0.044551
42081 R3 12 media 20.95188 20.95188 0.044551 0.044551
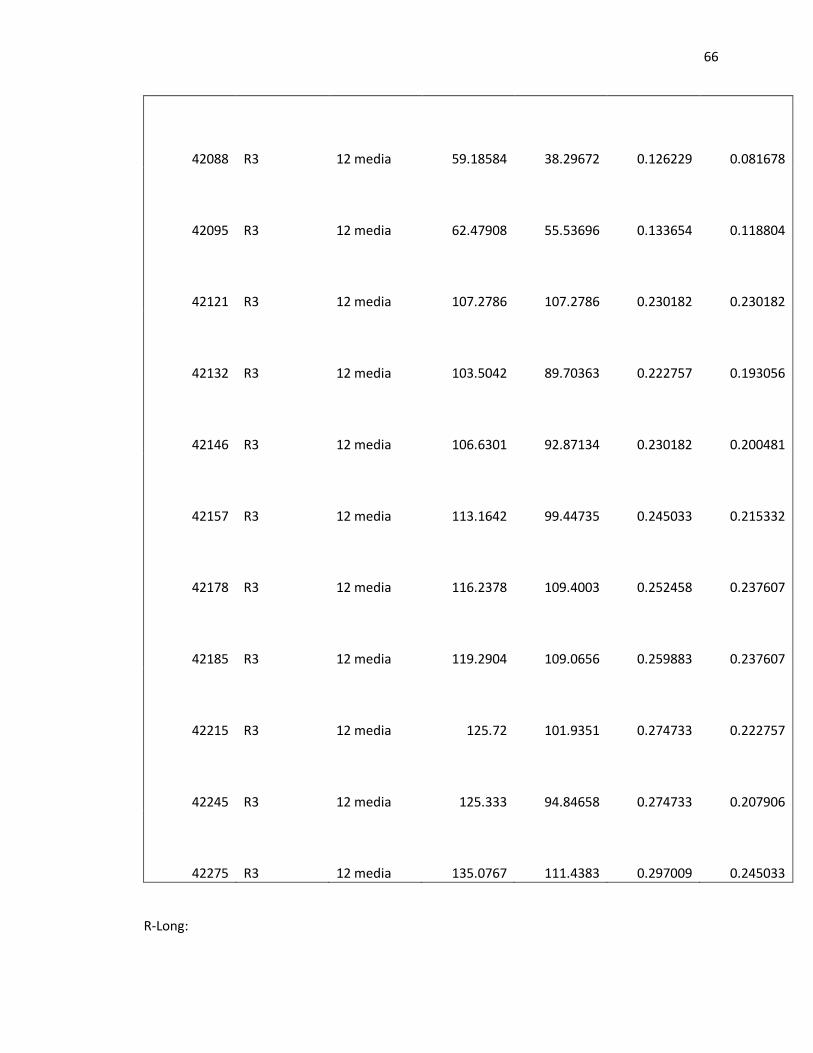
66
42088 R3 12 media 59.18584 38.29672 0.126229 0.081678
42095 R3 12 media 62.47908 55.53696 0.133654 0.118804
42121 R3 12 media 107.2786 107.2786 0.230182 0.230182
42132 R3 12 media 103.5042 89.70363 0.222757 0.193056
42146 R3 12 media 106.6301 92.87134 0.230182 0.200481
42157 R3 12 media 113.1642 99.44735 0.245033 0.215332
42178 R3 12 media 116.2378 109.4003 0.252458 0.237607
42185 R3 12 media 119.2904 109.0656 0.259883 0.237607
42215 R3 12 media 125.72 101.9351 0.274733 0.222757
42245 R3 12 media 125.333 94.84658 0.274733 0.207906
42275 R3 12 media 135.0767 111.4383 0.297009 0.245033
R-Long:
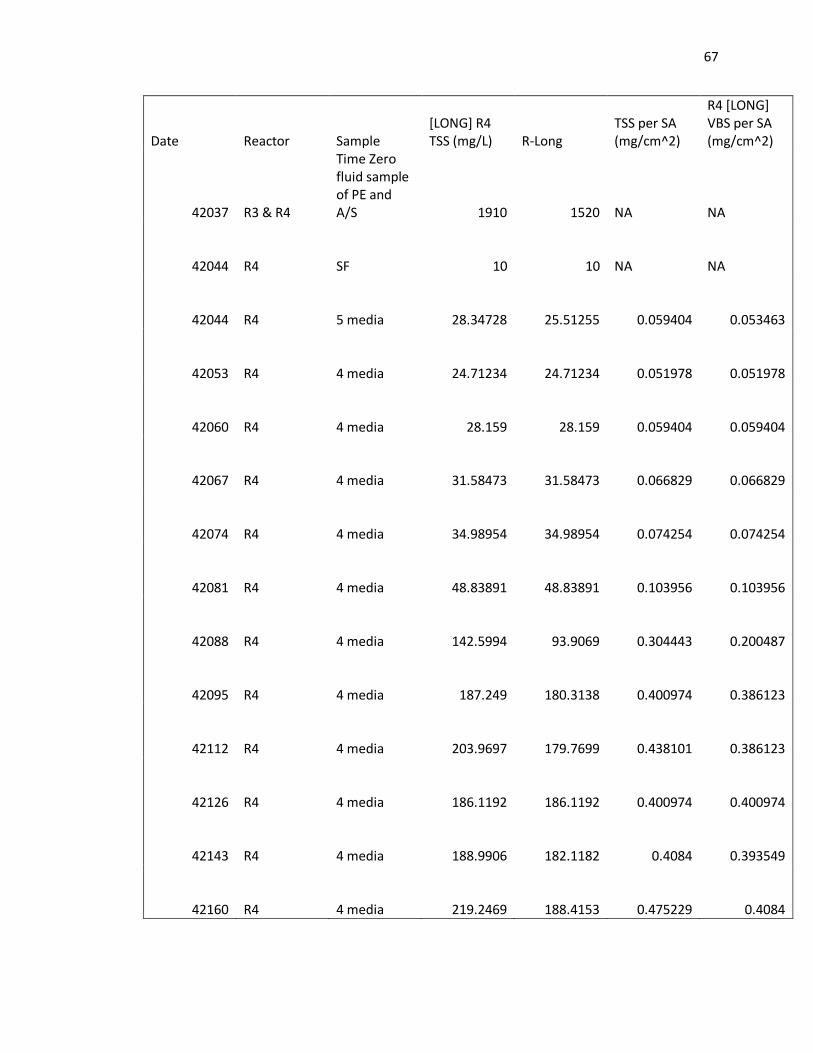
67
Date Reactor Sample [LONG] R4 TSS (mg/L) R-Long
TSS per SA (mg/cm^2)
R4 [LONG] VBS per SA (mg/cm^2)
42037 R3 & R4
Time Zero fluid sample of PE and A/S 1910 1520 NA NA
42044 R4 SF 10 10 NA NA
42044 R4 5 media 28.34728 25.51255 0.059404 0.053463
42053 R4 4 media 24.71234 24.71234 0.051978 0.051978
42060 R4 4 media 28.159 28.159 0.059404 0.059404
42067 R4 4 media 31.58473 31.58473 0.066829 0.066829
42074 R4 4 media 34.98954 34.98954 0.074254 0.074254
42081 R4 4 media 48.83891 48.83891 0.103956 0.103956
42088 R4 4 media 142.5994 93.9069 0.304443 0.200487
42095 R4 4 media 187.249 180.3138 0.400974 0.386123
42112 R4 4 media 203.9697 179.7699 0.438101 0.386123
42126 R4 4 media 186.1192 186.1192 0.400974 0.400974
42143 R4 4 media 188.9906 182.1182 0.4084 0.393549
42160 R4 4 media 219.2469 188.4153 0.475229 0.4084
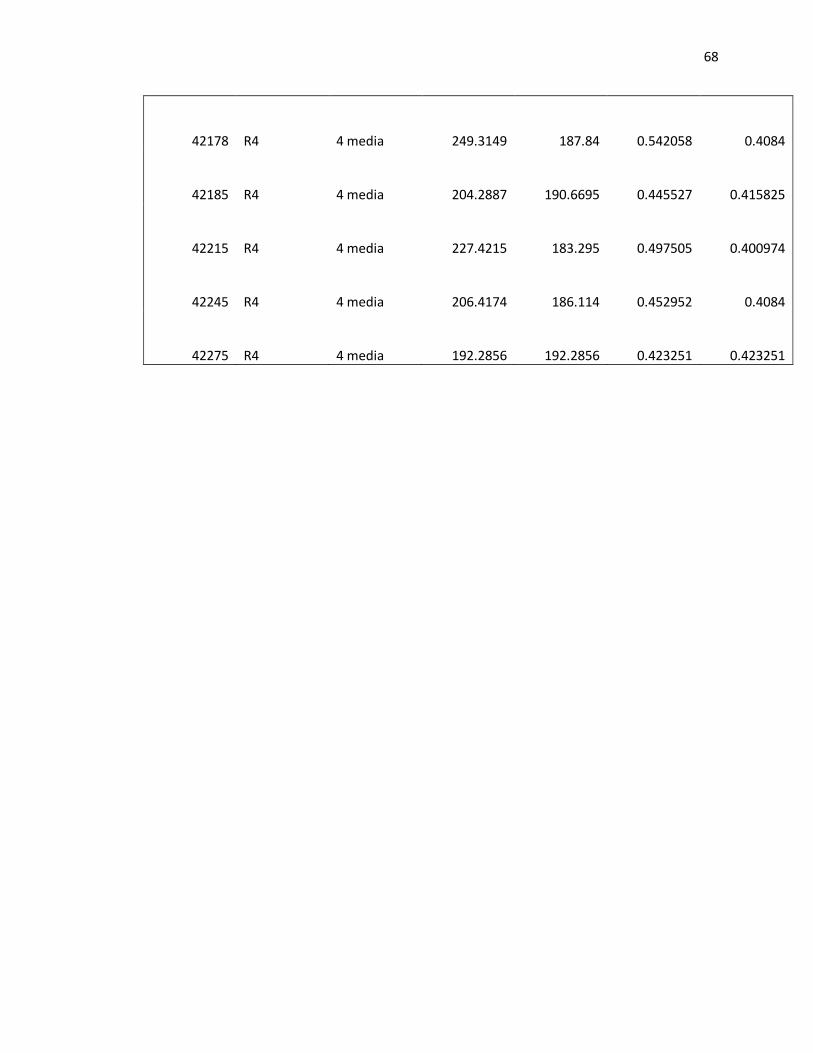
68
42178 R4 4 media 249.3149 187.84 0.542058 0.4084
42185 R4 4 media 204.2887 190.6695 0.445527 0.415825
42215 R4 4 media 227.4215 183.295 0.497505 0.400974
42245 R4 4 media 206.4174 186.114 0.452952 0.4084
42275 R4 4 media 192.2856 192.2856 0.423251 0.423251
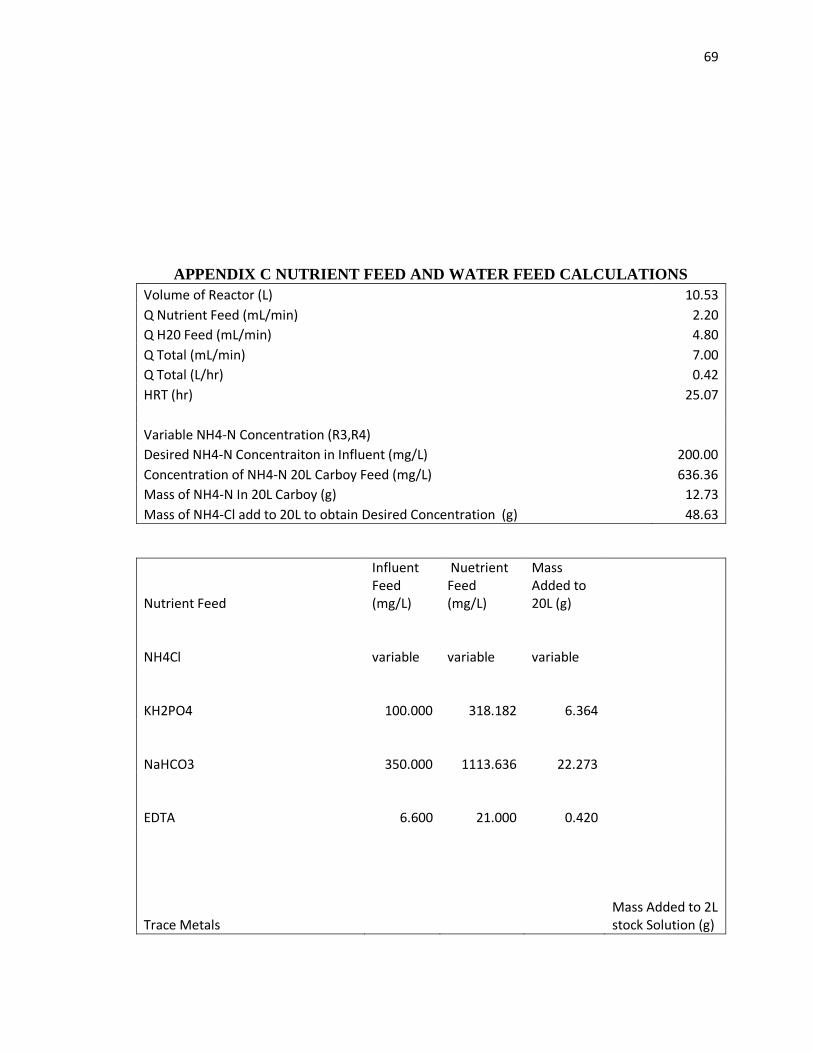
69
APPENDIX C NUTRIENT FEED AND WATER FEED CALCULATIONS
Volume of Reactor (L) 10.53
Q Nutrient Feed (mL/min) 2.20
Q H20 Feed (mL/min) 4.80
Q Total (mL/min) 7.00
Q Total (L/hr) 0.42
HRT (hr) 25.07
Variable NH4-N Concentration (R3,R4) Desired NH4-N Concentraiton in Influent (mg/L) 200.00
Concentration of NH4-N 20L Carboy Feed (mg/L) 636.36
Mass of NH4-N In 20L Carboy (g) 12.73
Mass of NH4-Cl add to 20L to obtain Desired Concentration (g) 48.63
Nutrient Feed
Influent Feed (mg/L)
Nuetrient Feed (mg/L)
Mass Added to 20L (g)
NH4Cl variable variable variable
KH2PO4 100.000 318.182 6.364
NaHCO3 350.000 1113.636 22.273
EDTA 6.600 21.000 0.420
Trace Metals
Mass Added to 2L stock Solution (g)
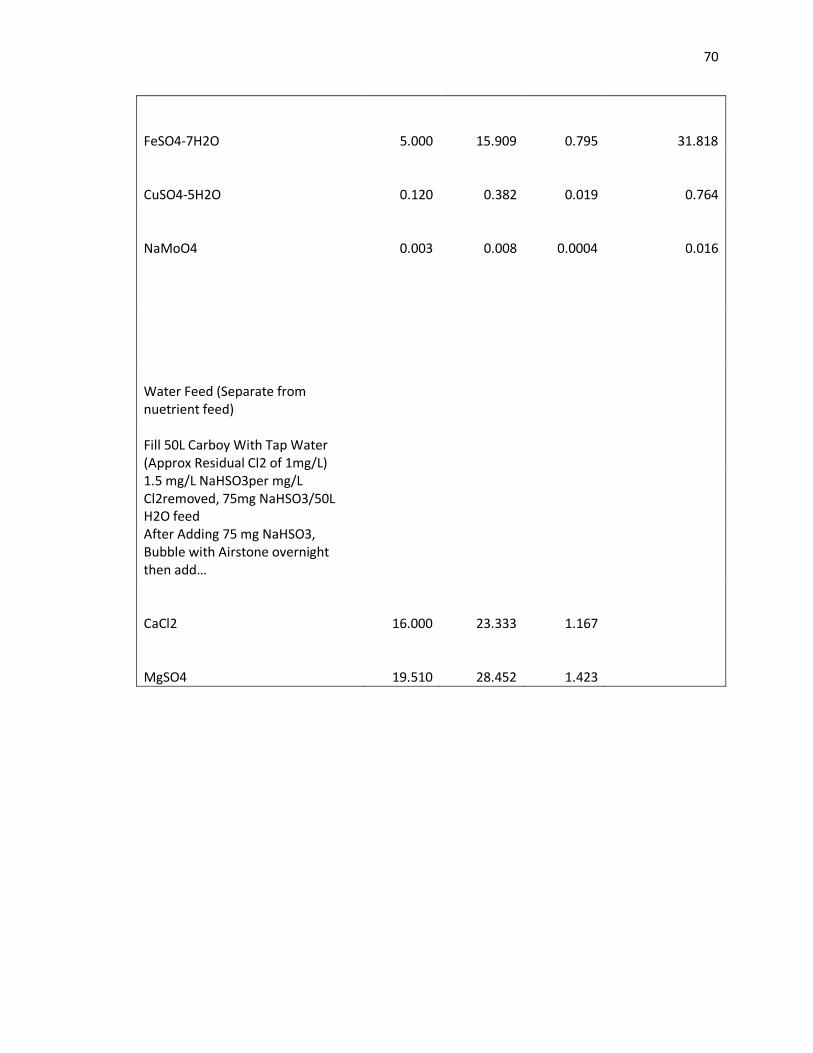
70
FeSO4-7H2O 5.000 15.909 0.795 31.818
CuSO4-5H2O 0.120 0.382 0.019 0.764
NaMoO4 0.003 0.008 0.0004 0.016
Water Feed (Separate from nuetrient feed)
Fill 50L Carboy With Tap Water (Approx Residual Cl2 of 1mg/L)
1.5 mg/L NaHSO3per mg/L Cl2removed, 75mg NaHSO3/50L H2O feed
After Adding 75 mg NaHSO3, Bubble with Airstone overnight then add…
CaCl2 16.000 23.333 1.167
MgSO4 19.510 28.452 1.423


![WELCOME [d3pcsg2wjq9izr.cloudfront.net]...- High-performance nitrification and denitrification - with suspended and robust carrier-bound immobilised organisms, - for the main stream](https://img.dokumen.tips/doc/110x75/5f9fe4d0bd4e012e7b7a3cbb/welcome-high-performance-nitrification-and-denitrification-with-suspended.jpg)