Embed Size (px)
Citation preview
The Effect of Bank Mergers on Loan Prices: Evidence from the U.S.
ISIL EREL∗
The Ohio State University
August 2006
Abstract Bank mergers will increase or decrease loan spreads, depending on whether the increased market power outweighs gains in operating efficiency. Using a proprietary loan-level data set for U.S. commercial banks, I find that, on average, mergers reduce loan spreads, and that the results are stronger for acquirers with larger declines in operating costs post merger. However, while the reduction in spreads is larger if the acquirer and the target have some market overlap and, consequently, more potential for cost savings, spreads widen when there is significant market overlap and, therefore, increased market power post merger. The findings are robust to using variation in dates of intrastate banking deregulation as an exogenous instrument for the timing of the in-market mergers. Furthermore, contrary to what might be expected, bigger acquirers do not impose less favorable terms on small businesses. Indeed, the average reduction in spreads is significant for small loans, showing that small borrowers typically pay lower interest rates to banks that have expanded during the previous few years through mergers.
∗ I am indebted to my advisors Stewart Myers, Steve Ross, and Antoinette Schoar for their encouragement, guidance, and very helpful discussions. Many thanks are due to Allen Berger and Dirk Jenter for valuable conversations and to Diana Hancock and Tom Brady for their help in getting access to the data set. I would also like to acknowledge helpful comments and suggestions from my discussants, Astrid Dick, Rich Rosen, and Tony Saunders, and also from Bob Avery, Bill Bassett, Nittai Bergman, Ron Borzekowski, Serdar Dinc, Alex Edmans, Mark Flannery, Tim Hannan, Eric Heitfield, Fadi Kanaan, Jiro Kondo, Kai Li, Volkan Muslu, Oguzhan Ozbas, Daniel Paravisini, Dimitris Papanikolaou, Mitch Petersen, Steve Pilloff, Robin Prager, Paola Sapienza, Amir Sufi, Haluk Unal, Egon Zakrajsek, seminar participants at the 2005 Bank Structure Conference of the Federal Reserve Bank of Chicago, the 5th Annual Banking Research Conference of the FDIC Center for Financial Research, 2005 FMA Annual Meetings, Bilkent University, Federal Reserve Bank of Chicago, Indiana University (Kelley), Koc University, MIT (Sloan), University of Michigan (Ross), The Ohio State University (Fisher), University of Oregon (Lundquist), University of Rochester (Simon), Sabanci University, UCLA (Andersen), UNC (Kenan-Flagler), UTD, and the University of Washington at Seattle. Laura Kawano provided excellent research assistance in obtaining the data. The research in this paper was conducted when the author was a dissertation intern at the Board of Governors of the Federal Reserve System. Results and conclusions expressed are those of the author, and do not necessarily reflect those of the Federal Reserve Board. All errors are the responsibility of the author. E-mail: [email protected]. Tel: 614-292-5174. Web: http://fisher.osu.edu/~erel_1
2
1. Introduction
During the 1990s, the number of commercial banks in the U.S. decreased from about
12,500 to about 8,000 primarily due to a wave of bank mergers that led to an increase in the
average size of banks.1 This paper analyzes the implications of bank mergers for borrowers in the
U.S. In particular, the paper investigates whether mergers create efficiency gains, which are
passed on to borrowers through reductions in loan rates or whether the enhanced market power
of the merged banks widens loan spreads. For this purpose, I use a proprietary loan-level data set
from the Federal Reserve Board, which covers the characteristics of the new commercial and
industrial (C&I) loan extensions of a stratified sample of U.S. commercial banks. Since the data
include nearly all of the largest acquirers, my merger sample spans 62% of all the acquirer assets
and 51% of all the target assets in the U.S. during 1990-2000.
Mergers may increase the efficiency of banks through synergy gains or through re-
optimization of the loan portfolios and risk diversification.2 Holding characteristics of the loans
constant, if the marginal cost savings due to economies of scale or scope are passed on to
borrowers, interest rates would be expected to decline after the mergers.3 However, if merging
banks have significant geographical overlap in their markets of operation, mergers can lead to an
increase in market power, which would in turn increase the cost of capital for borrowers.4 The
existing empirical literature on concentration in banking markets illustrates this positive
relationship between market concentration and prices on loan contracts (Hannan (1991)) and on
deposits (Berger and Hannan (1989)). The net effect on loan prices depends on whether the
market power or efficiency effect dominates (Williamson (1968, 1975)).
I find that acquiring banks, on average, reduce spreads on their new extensions of C&I
loans after a merger, provided that the merger does not significantly increase the concentration in
the banking markets. The average reduction in loan spreads, within three years after the merger,
is both larger and more persistent for the non-mega acquirers, with total gross assets less than
1 The data source is the Consolidated Reports of Condition and Income. See also Figure 1, showing a part of the Bank of America’s family tree, as a good representative of the banking consolidation during the 1990s. 2 See Akhavein et al. (1997), Berger et al. (1999), and Walter (2004) for detailed descriptions of different types of efficiency gains from bank mergers. 3 As shown by Farrell and Shapiro (1987), mergers must create economies of scale or cross-learning effects if the consolidated firms reduce the prices. 4 Rhoades (2000) documents that mergers are the main source of changes in banking structure and competition between 1990-1998 since newly chartered banks and bank failures are considerably smaller in number. Therefore, this paper concentrates only on mergers and their effect on banking concentration.
3
$10 billion. On average, mega acquirers reduce spreads within the first two years after the
mergers; nevertheless, this decline is reversed during the third year. These results suggest that the
largest banks might be engaging in competitive price cuts after the mergers to extend their
market share and then reversing these price reductions for some of the newly captured borrowers
in a classic “hold-up” (Rajan (1992)).
Surprisingly, the decline in spreads after the mergers is highly significant for small loans,
with loan sizes less than $1 million. This finding is particularly interesting since a number of
theoretical and empirical papers have suggested that large banks rely heavily on hard information
and, consequently, lend mostly to large and transparent borrowers while small banks better
utilize soft information and specialize in lending to small and opaque borrowers (see, e.g.
Petersen and Rajan (1994), Cole et al. (1999), Stein (2002), and Berger et al. (2005b)). Contrary
to what might be expected, bigger acquirers do not impose less favorable pricing terms for small
businesses. Indeed, my findings show that small borrowers typically pay lower interest rates to
banks that have expanded during the previous few years through mergers.
I find that the reduction in spreads is significantly greater for the acquirers with a larger
than median decline in their operating cost ratios. This suggests that operating efficiencies
explain the fall in loan spreads documented in this paper. Further, consistent with what theory
would imply, I find a non-monotonic relationship between loan spreads and the extent of market
overlap between the acquirer and target. The reduction in spreads is much larger after in-market
mergers where the acquirer and the target have some geographical overlap of markets before the
merger and, consequently, more potential for cost savings through consolidation of overlapping
operations. However, if the overlap is so extensive as to significantly increase concentration of
banking markets and, therefore, enhance the market power of the acquirer, the market power
effect seems to dominate and spreads on loans significantly increase after the mergers.
Out-of-market acquirers could exploit alternative sources of synergy, such as scale
efficiencies or risk diversification. Moreover, as argued by Sapienza (2002), acquirers might
have a very different strategy after out-of-market mergers: they might try to increase their share
of the new markets by strategically offering lower rates. After incorporating the structure of the
target’s markets into my regressions, I find that acquirers significantly reduce spreads on large
loans after the merger only if the new markets entered were dominated by larger banks. This
finding suggests that, in a market dominated by small banks, there is no need for a big acquirer to
4
strategically reduce loan spreads in order to gain market share since they are likely to be more
efficient and thus already more competitive than existing incumbents.
I further examine whether my results are driven by an after-merger improvement in the
quality of the acquirers’ loan portfolios. First, I show that there is no significant change in the
extent of nonperforming loans of the acquirer after the merger. Second, observable changes in
the loan characteristics of the bank’s portfolio suggest either no change or an adverse change in
borrower quality that would, in fact, bias my results in the opposite direction. Lastly, using risk
ratings of individual loans, which are available only for the later part of my sample period, I
show that there isn’t any change in the average or median risk rating of the loan portfolio post
mergers and my results still hold. Moreover, I also test whether findings of this paper are driven
by an after-merger decrease in demand for the quantity of services supplied by the merged bank.
Consistent with the operating efficiency argument, I find that, on average, the market share of the
acquirer after the merger is significantly larger than the market share of the pro-forma bank
(target plus acquirer before the merger).
In order to alleviate concerns about the endogeneity of the timing of mergers in my
sample, I use the removal of intrastate and interstate banking restrictions as an exogenous
instrument. As argued by Jayaratne and Strahan (1998), “states were just as likely to deregulate
branching restrictions during the downswings of the business cycles as during the upswings”
(p.259). I find that intrastate deregulation predicts in-market mergers, and post-merger reduction
in loan spreads on small loans is robust to using dates of intrastate banking deregulation as an
instrument for the timing of these mergers.
Lastly, I analyze the effect of bank mergers on small business lending of the merging
banks. For that purpose, bank-level data on the aggregate quantities of small business lending are
used. However, the data are available only after 1993, and are annual. Therefore, the tests
exploring the effect of bank mergers on credit availability are not as detailed as the tests on loan
spreads. Nonetheless, a simple mean difference test shows that, on average, the ratio of small
business lending to total assets of the acquirer after the merger is not significantly different than
the same ratio of the pro-forma bank (target plus acquirer) before the merger.
5
1.1. Relationship to Existing Literature The main contribution of this paper is to the literature focusing on the effect of mergers
on pricing terms for the borrowers. Due to data limitations, the literature exploring the effect of
bank mergers on loan prices is still developing.5 There exists some empirical evidence on the
unfavorable results of increased market concentration due to big bank mergers on deposit rates
(Hannan and Prager (1998))6, personal loan rates (Kahn et al. (2005)), and real-estate loan rates
(Garmaise and Moskowitz (2006)).7 On the other hand, Drucker (2005) shows that commercial
bank mergers among the 50 largest banks do not result in significant changes in the pricing of
their large syndicated loan contracts. However, he mainly concentrates on the effect of mergers
between commercial banks and investment banks on large syndicated loans.
Although some papers (see e.g. Akhavein et al (1997)) use aggregate bank-level data for
the U.S., to my knowledge, this is the first paper to use loan-level data for C&I loans of U.S.
banks to dynamically examine the effect of commercial bank mergers on loan prices. Sapienza
(2002) uses a loan-level data set for Italian banks, and concludes that in-market mergers
involving relatively small targets result in lower interest rates charged on loans. This paper is
similar to Sapienza (2002) in exploring the effect of mergers on loan prices by using loan-level
data. The main contributions of my paper are focusing on the interaction of bank mergers with
target’s market structure, relating post-merger reductions in loan spreads to gains in operating
efficiencies, and using intrastate deregulation as an exogenous instrument for the timing of the
in-market mergers.
Many existing papers use stock returns to measure efficiency gains from mergers and
find mixed evidence.8 However, insignificant results could be due to efficiency gains being
offset by a negative signal if stock is used to finance the merger (see, e.g. Houston and Ryngaert
(1997)) or simply because the time period under consideration (1980s) lacks sufficient “in-
market” mergers, which constitute the primary source of bank merger gains (Houston et al.
5 Theory on this topic is also scant. Park and Pennacchi (2005) concentrate on market extension mergers by large multi-market banks and show that these mergers increase the retail loan competition (benefiting borrowers), but reduce the retail deposit competition (harming depositors). 6 Focarelli and Panetta (2003), analyzing in-market mergers in Italy, find that adverse pricing effects on deposits are temporary and deposit rates, in fact, increase in the long run, after the efficiency gains are fully realized. 7 Kim and Singal (1993) show a similar adverse effect of mergers on prices in the airline industry. 8 See James and Weir (1987), Hannan and Wolken (1989), Cornett and Tehranian (1992), Houston and Ryngaert (1994), DeLong (1998), Kane (2000), Houston et al. (2001), and Karceski et al (2005), etc. Existing evidence on
6
(2001)).9 On the other hand, according to Calomiris and Karceski (1999), insignificant stock
returns to the combined bank could be because, in a competitive market, a significant portion of
the efficiency gains are passed on to customers. Therefore, interest rates might be more useful
measures of efficiency gains than stock prices. My findings provide evidence in support of their
critique of stock-return event studies and suggestions on better measures of efficiency gains.
This paper also adds to the literature exploring the potential effects of large bank mergers
on credit availability to small businesses. Large banks mostly specialize in “hard” (quantitative)
information-based loans to larger borrowers rather than “soft” (qualitative) information-based
relationship loans to smaller borrowers (see, e.g. Cole et al. (1999), and Berger et al. (2005b)).10
This could be due to the hierarchical structures of the large banks, where quantitative, easily
transferable information about potential borrowers is more valuable for the loan officers of lower
ranks (Stein (2002)) or to scope inefficiencies of lending to both large and small businesses,
which requires different lending technologies (Berger, Demsetz, and Strahan (1999)).11
Existing theories imply that, post mergers, large acquirers might significantly drop
relationship loans of the smaller-sized targets. Although Strahan and Weston (1998) find no
significant change in lending to small businesses, Keeton (1996), Peek and Rosengren (1996),
Berger et al. (1998), Sapienza (2002), and Degryse et al. (2005) give evidence of a significant
decline in the amount of small business lending after large bank mergers. Though my findings on
favorable pricing effect and credit availability may initially look inconsistent with these earlier
studies, they can be reconciled by taking into account that the late 1990s saw substantial
improvements in information technology and increased adoption of “credit scoring” models for
small business lending. This may have reduced large banks’ aversion to small business lending
by enabling them to acquire more “hard” information on small loans. Small business credit
scoring is a data processing technology about the firm and the credit history of its owner using
statistical methods and it creates opportunities for non-transparent small firms to borrow from
post-merger accounting performance is also mixed. (See, for instance, Berger and Humphrey (1992), Cornett and Tehranian (1992), Toevs (1992), Pilloff (1996), Akhavein et al. (1997), and Berger (1997).) 9 See also Penas and Unal (2004), who analyze the commercial bank mergers between 1991 and 1998 and shows that announcement-month returns of the bondholders of merging banks are significantly positive. 10 See Boot (2000) for its review of the relationship lending literature and also Berger and Udell (2002) and Petersen (2004) for detailed explanations of different types of lending and definitions of hard and soft information. 11 See Udell (1989), Nakamura (1993) and Berger and Udell (1995) for more discussion and evidence on differences in lending between large and small banks.
7
large banks.12 This paper, therefore, complements Petersen and Rajan (2002), who show that the
physical distance between small businesses and their banks has been increasing, providing
evidence for the possible weakening of large banks’ soft information constraints.13
The remainder of this paper is structured as follows. Section 2 describes the data and my
sample. Section 3 presents the statistical methodology, defines the variables, and shows the main
results as well as results for various subsamples of mergers and loans. In section 4, the market
overlap between the acquirer and the targets, and also the competitiveness of the targets’
markets, are incorporated into the analyses. Section 5 relates the findings to gains in operating
efficiency. Section 6 uses the variation in dates of banking deregulation as an exogenous
instrument for the timing of the mergers and Section 7 briefly explores the effect of mergers on
credit availability to small businesses. Section 8 concludes.
2. Data and Sample Description 2.1. Data
The primary data source for this paper is the Federal Reserve Board’s Survey of Terms of
Business Lending (STBL). STBL provides confidential data on the characteristics of individual
commercial and industrial (C&I) loan extensions of a stratified sample of roughly 300 U.S.
commercial banks and 50 branches of foreign banks. It covers all C&I loans (new loans,
takedowns under revolving credit agreements, and renewals) of a given bank with a face value of
at least $1000, disbursed within the first business week of February, May, August, and
November. To my knowledge, STBL is the only loan-level data source covering C&I loans of
different sizes and characteristics extended by a stratified sample of U.S. commercial banks.14
The flow nature of the data, covering new loans and renewals, is ideal for my analysis
since the effects of the merger would be reflected mostly in the new loans, rather than the entire
portfolio of existing loans. The information on loan characteristics is very detailed, including the
12 See Hand and Henley (1997) for a review of the statistical methods used in credit scoring and Berger et al. (2005a), Berger and DeYoung (2002), and DeYoung et al. (2005) for the effects of its application in the banking industry. 13 See also Black and Strahan (2002) showing that, after the banking deregulation, the rate of new incorporations in a state increases as the share of small banks decreases due to banking consolidation. 14 Loan Pricing Corporation’s Deal Scan provides loan-level information as well. However, Deal Scan covers only the large, syndicated loans of the largest U.S. banks. Besides, the share of each agent-bank within the syndication is blank in a considerable portion of the data.
8
stated rate of interest, loan size, total size of the commitment (line of credit) under which the
loan was extended, maturity, frequency of payments, whether the loan is secured or not, whether
the loan is fixed or floating-rate, etc. One limitation of the data is that it does not provide
information on characteristics of borrowing firms. Following the prior literature (see e.g. Berger
et al. (1998)), my analyses will proxy for the size of the borrower by the total amount of
commitment if the loan is drawn under commitment and by the face amount of the loan
otherwise.
The survey covers nearly all of the large banks in the U.S. and a sample of medium-sized
and small banks. If and when a bank decides not to report any more, another bank with similar
characteristics is chosen to replace it. The Federal Reserve System uses the survey to measure
the average cost of business borrowing in the U.S. economy. Therefore, concerns about reporting
biases and sample selection issues are alleviated by the fact that this survey is not used for
regulation purposes.
I matched the STBL to three other data sources. First, I use the quarterly Reports of
Condition and Income (Call Reports) for aggregate bank-level income statement and balance
sheet data. Small business loan data are from June Call Reports. Second, the Federal Deposit
Insurance Corporation’s branch-level Summary of Deposits data are used to determine which
local banking markets are served by the sample banks. The last data source is the National
Information Center (NIC) Data File, which provides information on the merging banks and the
dates of the mergers.
2.2. Sample Selection and Descriptive Statistics
Table I documents descriptive statistics of STBL banks between 1987 and 2003. The sum
of gross total assets of all surveyed banks has a mean of about $2.7 trillion over 68 quarters,
which corresponds, on average, to 53% of all banking assets. The median bank in the survey has
gross total assets of about $1.2 billion. However, the mean value of gross total assets is $9.8
billion, showing that the survey is biased towards larger banks. The net return on assets has a
mean and median of 1%, while the non-performing loans ratio is, on average, 2%. Panels B and
C of the same table describe respective descriptive characteristics of the acquirers and targets, as
of one quarter before the merger. Compared to the median bank in the sample, the median
acquirer is larger (with $6.1 billion of gross total assets) and the median target is smaller (with
9
about $184 million of gross total assets). Net return on assets for the median acquirer is 8.2%,
while it is 0.9% for the median target.
The merger sample of this paper covers the period between 1990 and 2000. I concentrate
on the 1990s because of the large increase in the number of bank mergers in this decade. This
increase is due to the removal of intrastate and interstate branching restrictions on banks in the
1980s and early 1990s, officially finalized by the Riegle-Neal Interstate Banking and Branching
Efficiency Act of 1994.15 Some researchers suggest that it might take up to three years for the
consolidating firms to fully realize efficiency gains (see e.g. Berger et al. (1995), Calomiris and
Karceski (2000), and Focarelli and Panetta (2003)). To address this issue, loan-level observations
of this paper span 68 quarters between 1987 and 2003, which include a three-year period before
the first and after the last merger in my sample. STBL covers in total 2,162,582 bank-loan-
quarter observations for this time period.
Table II presents summary statistics of the loan-level observations. The mean face value
of all loans is $727,143 while the mean value of the total commitment amount is about $5.3
million. Average spread (effective annual interest rate, net of the treasury rate of the same
duration as the loan) is 4.25%, but it declines to 2.75% when only large loans are considered.
Weighted by the loan size (which is equal to the total commitment amount if the loan is drawn
under commitment and to the face value of the loan otherwise), 82% of all loans is under
commitment, and this ratio increases to 96% for large loans of size above $25 million. On
average, 73% of the value of all loans is secured by some type of collateral while 75% is
floating-rate.
In this paper, I call any consolidation of two non-failing commercial banks a “merger” if
the charter of the target disappears and only the acquirer survives.16 After the banking
deregulation, one common type of merger is the consolidation of several branches of, in fact, the
same bank, which had to operate in different states with separate charters because of the
branching restrictions of the time period. These “within family” mergers are excluded from my
“merger” sample. Between 1990 and 2000, there were 2,274 commercial bank “mergers” in the
15 See, for instance, Berger et al. (1995), Jayaratne and Strahan (1998), Berger et al. (1999), and Kroszner and Strahan (1999) for more information on banking deregulation, its effect on bank mergers, and exact dates for each state. See also Andrade et al. (2001) for the argument that deregulation is the dominant factor in merger and acquisition activity during the 1990s. 16 This paper analyzes commercial banks rather than bank holding companies (BHCs) primarily because lending decisions are mostly made at the bank level rather than the BHC level.
10
U.S. For my empirical analyses, more than one merger of a given acquirer within the same
quarter is used as a single data-point. This reduces the number of mergers to 1,857 “merger-
quarters,” defined as quarters in which the acquirer merges with at least one target. STBL covers
263 of these “merger-quarters,” corresponding to 350 mergers by 121 banks.17 Since the survey
includes nearly all of the large banks, these 263 merger-quarters represent a very significant
portion of the mergers in the U.S.: 62% of all acquirers’ assets and 51% of all targets’ assets.
3. Dynamic Effect of Mergers on Loan Prices
This section will introduce the methodology of the paper and show the basic results. It
will explore how the interest rates charged on the C&I loan flow of an acquirer change after the
merger, after controlling for the size and other characteristics of these loans.
3.1. Basic Test and Variable Definitions
To analyze the effect of mergers on loan prices, I estimate the following before-after
regression for acquirers in the event time with a six year window around the merger:
iktkttktkitk
tkitktktktki
fdYMrgrSizeLoanSizereeAftrMrgrThoAftrMrgrTweAftrMrgrOnSpread
ελλβββββα
++++Χ++
++++=
−1,2,,1,5
,,4,3,2,1,,
The dependent variable, Spread, is the effective annual interest rate on loan i of bank k in
quarter t minus the Treasury rate of equal duration as the loan.18 For the fixed-rate loans, the
Treasury rate of equal duration as the loan is subtracted from the effective interest rate. For
floating-rate loans, the appropriate duration is the next re-pricing interval, but the data for this
variable are only available after 1997. However, for most of the floating-rate loans reported after
1997, the expected re-pricing interval is up to a month. Therefore, in order to normalize the
spreads for the floating-rate loans, I used either the one-month Treasury rate or (if the maturity is
less than a month) the Treasury rate corresponding to the maturity of the loan. I check the
17 Small acquirers with gross total assets of less than $100 million are deleted from the sample since they both have very short time series with many gaps, and loans that they reported per quarter are very small in number (only 1 in some quarters). Only 0.7% of all STBL loan-level observations and 4 merger-quarters are lost in this way; and including these observations both statistically and economically does not alter the loan-level coefficients reported, but could distort the bank-level regression results. 18 Effective annual interest rate is the ratio of the realized yield from compound interest for one year, to the amount of the loan. The data do not include fees charged on loans, but this could only bias my results if fees depend on certain characteristics of the borrowers, and if this dependence changes after the merger, which is very unlikely.
11
robustness of my results using alternative methods of calculating the spread, such as using a one-
day rate instead of the one-month rate to normalize floating-rate loans or using prime rate instead
of the Treasury rates in calculating spreads. As another robustness check, Treasury rates are also
replaced by LIBOR (London Inter Bank Offer Rate) and swap rates of equal duration since those
rates could reflect the funding costs of the banks better than the Treasury rates, especially in the
later periods of the data.19 The average spread per quarter for all the banks in the data other than
the acquiring banks was also checked to be included as a control. The results are both
economically and statistically unchanged.
I use three after-merger dummy variables which span three years before and after the
merger for the acquirers. AftrMrgrOne, AftrMrgrTwo, and AftrMrgrThree are dummy variables
equal to zero for twelve quarters before and after the merger, except that AftrMrgrOne is equal
to one for the first four quarters after the merger, AftrMrgrTwo is equal to one for the fifth to
eighth quarters after the merger, and AftrMrgrThree is equal to one for the ninth to twelfth
quarters after the merger.
Each regression includes LoanSize, the natural logarithm of the size of the loan as a
proxy for the size of the borrowing firms. Loan size is equal to the total commitment (line of
credit) amount if the loan is drawn under commitment and to the face amount of the loan
otherwise. That is because total commitment amount better proxies the size of the borrower than
the face value of the loan. Loan size is, in fact, endogenous since it could potentially be affected
by mergers, and one might actually think that including loan size over-controls for changes due
to the merger. MrgrSize is equal to the natural logarithm of the total size of the target as of one
quarter before the merger and is used to control for the size of the merger. For merger-quarters in
which an acquirer merges with more than one target, merger size corresponds to the sum of the
gross total assets of all these targets.
In addition to these main variables, regressions include some market-related as well as
firm- and loan-specific controls. Note that the basic tests include only the level of the merger size
and the market-related variables as controls instead of their interactions with the after-merger
Generally, large banks have certain policies on fee structure based on the size of the loan, and these policies do not systematically vary by borrower characteristics. 19 Treasury data used are one-, three-, six-month constant maturity Treasury bill rates, and one-, two-, three-, five-, seven-, ten-, twenty-year Treasury notes. The rates for maturities other than these are calculated by simple interpolation and extrapolation. One-, three-, and six-month LIBOR, in addition to one-, two-, three-, five-, seven-, ten-, and twenty-year swap rates, are used as for the robustness check.
12
dummy variables. That is because following sections of the paper will include extensive analyses
of these interactions. StateDummy is a dummy variable equal to 1 if the target and the acquirer
were in the same state before the merger. This variable is included because, as already explained,
elimination of intrastate restrictions was the most important reason for the increasing number of
mergers in the 1990s.20 MrktHHI is the natural logarithm of the average Herfindahl-Hirschman
Index of the markets which the acquirer serves.21 I also included a set of loan characteristics
(Xi,k,t) in addition to the loan size to control for their additional effect on interest rates. But, due
to the endogeneity of these characteristics, including them in the regressions might also over-
control for changes after the merger. These characteristics include DummyCommit, which is
equal to one if the loan is drawn under a formal or informal commitment, and zero otherwise.
DummyFixed is equal to one if the loan is a fixed-rate loan, and is equal to zero if it is a floating-
rate loan. DummySecured is equal to one if the loan is secured by collateral of any kind, and
zero otherwise. Moreover, each regression includes a set of bank-specific controls measured as
of t-1, Yk,t-1. These controls include the natural logarithm of the gross total assets of the acquirer
(AcquirerSize) and its nonperforming loans ratio (NonperformRatio), which is calculated as the
sum of loans over 90 days late and loans not accruing over total loans. Each regression includes
bank fixed effects (fk) in order to use the bank before the merger as a control for itself after the
merger. Moreover, I account for serial correlation by allowing for clustering of the error term at
the bank level.22 Lastly, dt corresponds to the 67 quarter dummies.
3.2. Main Results
Table III reports results of the basic regressions for the whole sample of loans and all
types of mergers.23 The first column shows the very basic regression results, including only the
lagged size of the acquirer in addition to three after-merger dummies, and the second column
20 All merger-quarters, which have both in-state and out-of state mergers of a given acquirer in a given quarter, are dropped; however, these types of merger-quarters were very few in number. I also checked to include a dummy variable equal to 1 if the state in which the acquirer operates was deregulated or not (both for intra and inter-state deregulation). The results were not altered. 21 The Herfindahl-Hirschman Index is calculated as the sum of the squares of the deposit market shares of all banks in a given market. It is based on deposits rather than loans, because there is no market-level data for bank loans. 22 See Petersen (2006) for a detailed explanation of why clustering might be essential even though each regression includes bank fixed-effects. 23 The differences in the total number of observations between columns are due to lack of data for a few observations of some variables. Besides, as explained before, the total number of observations declined by a few observations in regressions including StateDummy because of some dropped merger-quarters.
13
adds the loan size. The favorable effect on loan prices starts within the first year after the merger,
but becomes statistically much more significant in the second year. The coefficient on
AftrMrgrOne is equal to -7 basis points, and adding other controls does not alter this result
except that in the regressions including StateDummy it decreases to only -6 basis points. The
second-year dummy has a coefficient of -11 basis points without controlling the loan size and -7
basis points when we control for the loan size, and is always statistically significant at the 1%
level. As expected, LoanSize, which proxies the size of the borrower, has the expected negative
and statistically significant coefficient.
Regressions in columns three and four include the total assets of the target (MrgrSize),
and the results are unaltered. Besides, after the merger, gross total assets of the acquirer already
include the size of the target; therefore, when MrgrSize is used in addition to the size of the
acquirer (AcquirerSize), its marginal effect as a control is insignificant. The results are also
unaltered if the ratio of the size of the target to the size of the acquirer as of one period before the
merger is included as a control. In the rest of the paper the regressions will only include the size
of the acquirer before and after the merger.24 The significant reduction in spreads is robust to
including StateDummy and MrktHHI as well.
The coefficients in front of the dummies reflecting different characteristics of the loans
are consistent with existing empirical literature. Loans secured by collateral of any kind have
higher spreads than unsecured loans (Berger and Udell (1990)), while floating-rate loans have
higher spreads than the fixed-rate loans. Loans under commitment have lower spreads compared
to loans not under commitment.25 The interactions of the control variables with the after-merger
dummies are not included in the main set of results since each interaction will be extensively
analyzed by concentrating on different subsamples of mergers and loans in later sections.
Although Focarelli and Panetta (2003) mention a gestation period of about three years for
efficiency gains to be fully realized, my analysis shows that, on average, the average decline in
spreads starts within the first year after the merger and has its peak between the fifth and eighth
quarters after the merger. When the first year effect is decomposed into quarters, regressions
using quarter by quarter after merger dummies demonstrate that significant negative change is
24 However, I will always check whether or not including target size in addition to the acquirer size alters the results. 25 Since DummyCommit is highly correlated with SizeLoan, I excluded loan size from the regression including the commitment dummy. The significantly negative coefficient of DummyCommit is also robust to including the natural logarithm of the face value of each loan as a control.
14
coming in the third and fourth quarters post merger. Similarly, Sapienza (2002) finds that, in
Italy, the efficiency gains create favorable loan prices about six months after the mergers.26
3.3. Main Results with “After-Last-Merger” Dummies
Surveyed banks include many large acquirers, which may have many mergers within a
short time. In my sample, 39 of the 263 merger-quarters are the second merger quarter in a row,
and 98 are merger-quarters of the same bank which had at least one merger within the past year.
As a consequence, after-merger dummies could often overlap in taking the value of one within
their corresponding years after the merger. This possibility might reduce the variation in my
sample and bias the economic significance of my estimates downwards. In addition, one might
believe that the last merger in a succession of mergers might have the biggest effect. In order to
be able to compare the economic significance of coefficients, I created a set of new “After-Last-
Merger Dummies,” by modifying the variables AftrMrgrOne - AftrMrgrThree such that, in a
given quarter, the corresponding year’s after-merger dummy is switched on for only the very last
merger, ignoring all the other mergers even if they occurred within the last three years. For
instance, AftrMrgrTwo is equal to 1 in the fifth to eighth quarters after the merger only if those
1’s do not coincide with the first four quarters of another merger of the same bank; and
AftrMrgrThree is equal to 1 in the ninth to twelfth quarters after the merger only if those 1’s do
not coincide with the first eight quarters of another merger of the same bank. The first two
columns of Table IV compare the coefficients of the new “After-Last-Merger Dummies” to the
ones of the original after-merger dummies. The difference in the economic significance of the
coefficients is noticeable. The average decline in spread within both the first and second years
after the merger is 12 basis points if after-last-merger dummies are used, while the same decline
is only 7 basis points if the original overlapping after-merger dummies are used.27
26 Although unlikely, the significance of the t-statistics in the loan-level regressions might be a consequence of the large cross-sectional variation even though standard errors in all regressions are corrected for clustering of observations at the bank level. In order to address this concern, the same set of regressions was run by using bank-quarter-level observations as well. For that purpose, the mean of the interest rates charged on loans as well as their sizes at the bank-quarter level were used, after collapsing the loan-level data by bank, quarter, and some characteristics of these loans. The results were both economically and statistically unaltered. 27 In addition to using only the last merger in a series for a given acquirer, I also checked to focus on larger- or smaller-than-median mergers of the same acquirer by using the median target size of each acquirer. The number of observations declined by at most 110,000, meaning that concentrating only on the larger- or the smaller-than-median mergers of the same acquirer does not eliminate mergers totally from in between the successive mergers.
15
3.4. Results for Subsamples Based on Acquirer and Merger Sizes
In the regressions reported in Table III, the significance of the decline in spreads seems to
disappear within the third year after the merger, although the same decline is both statistically
and economically significant within the first and second year after the merger. This raises the
question of whether the decline in spreads is temporary or permanent. One might argue that if the
decline in spreads disappears after three years, it would not be accurate to conclude that
efficiency gains have been passed on to borrowers, but rather that there were only some strategic
price cuts, which are reversed later.
Panel B of Table IV focuses on mergers by acquirers which are non-mega banks, with
gross total assets of less than $10 billion (“Non-Mega Acquirers”). Acquirers, which became a
mega bank after a merger in the sample period, are also included in this subsample. As shown in
Column (3) of Table IV, when the effect of mega-mergers on loan spreads is excluded, mergers
result in, on average, about 15 (17) basis points decline for all loans within the third year after
the merger by using after-merger dummies (after-last-merger dummies), and this decline persists
after the third year.28 Although not reported, the regressions using the subsample of mega
acquirers result in a statistically significant decline in spreads within the first year and second
year, but an increase in spreads within the third year after the mergers. Consequently, some of
the largest acquirers might be strategically cutting the spreads within the first two years after the
merger in order to extend their market share and then “holding-up” some of the newly captured
borrowers by reversing these reductions (Rajan (2002)). Alternatively, since these mega
acquirers have many mergers in a row, some fundamental factors other than mergers that we
cannot control for, could be affecting their loan spreads after three years. In fact, as the event
window around the merger gets longer, it could be more difficult to control for factors other than
the merger itself.
Panel C of Table IV differentiates different sizes of mergers by non-mega acquirers,
based on the ratio of the gross total assets of the target to the assets of the acquirer as of one
period before the merger. For the merger subsample, where this size ratio is larger than the
median among all mergers (“Larger-than-Median Target to Acquirer Ratio”), the decline in
loan spreads, within the third year, is statistically significant 15 basis points. Mergers with
28 As shown in later sections, after subsamples of mergers with more potential for gains in operating efficiency, coefficients of third-year after-merger dummies also become both economically and statistically significant.
16
“Smaller-than-Median Target to Acquirer Ratio” result in a 6 basis points average reduction,
which is not statistically significant at the 10% level. The difference between these subsamples
suggest that as the size of the target relative to the size of the acquirer increase, there might be
more potential for marginal cost savings which can be passed on to borrowers. Moreover, these
results provide evidence supporting the argument by Focarelli and Panetta that it might take up
to three years for the efficiency effects to be realized.
3.5. Results for Subsamples Based on Loan Size
Estimation using a whole sample of loans is less than ideal; a very large loan drawn under
a large commitment should be analyzed separately from a very small loan of face value or
commitment size less than $100,000. In other words, loan size proxies for borrower size, and
commitments to very big companies should be differentiated from loans to small businesses
since they are made based on different lending technologies (see Section 1.1 for the discussion
on different lending technologies). Moreover, given that acquirers generally buy targets of much
smaller sizes, new additions to the acquirer’s loan portfolio would most likely be the smaller
loans of the target or the potential new customers of smaller firms in targets’ markets.
Furthermore, as shown in Tables II and III, the spreads on large commitments to the existing
borrowers of the acquirer are already much lower than on smaller sized loans. Therefore, any
gains due to diversification, scale, or scope economies are expected to be reflected more with
smaller borrowers.
Table V presents results for subsamples based on the loan size, which is equal to the total
commitment amount if the loan is drawn under commitment and to the face value of the loan
otherwise.29 Spreads on small loans with size less than $1 million decrease, on average, by 15
basis points (b.p.) within the first year, and 14 b.p. within the second year after the merger. If
“After-Last-Merger Dummies” are used instead of the original after-merger dummies as the
right-hand-side (RHS) variables, the first and second year declines in the spreads become 23 and
20 b.p., respectively. All these coefficients are significant at the 1% level.30 On the other hand,
29 Existing literature generally defines LoanSize of less than $1 million as the small loans; however, some papers use $250,000 or $100,000 as the cut-off dollar amounts for small loans. Although results for different subsamples of small loans are reported in Panel A of Table V, the rest of the paper will use $1 million cut-off for small loans. 30 The rest of the paper will report the results of the regressions using "After-Merger-Dummies," even though they have economically less significant coefficients than "After-Last-Merger Dummies," except for times when both are
17
the change in the spreads on large loans (of size larger than $1 million) is not statistically
different from zero. The largest decline in spreads within the first and second years after the
merger is for the smallest borrowers. It amounts to 23 and 16 basis points for loans of size less
than $100,000, and 21 and 16 basis points for loans of size less than $250,000. All coefficients
are significant at the 1% level.
Panel C of Table V focuses on mergers of non-mega acquirers, as described in the
previous subsection. Spreads on small loans decline, on average, by 9 basis points within the first
and second years and by 16 basis points within the third year post merger. Large loans result in 9
basis points increase (which is significant at the 10% level) within the first year after the merger;
however, the coefficient of the third year after merger dummy is -11 basis points although it is
not statistically significant at the 10% level. In summary, when the mega-acquirers are excluded,
the results are again more persistent.
3.6. Results for Subsamples Based on Other Loan Characteristics
TableVI shows the results of the regressions for two different subsamples based on loan
characteristics.31 In Panel A, our original set of regressions were run first including only the
loans drawn under commitment (“Loans under Commitment”) and then for loans that are not
under commitment (“Loans not under Commitment”). Although loans not under commitment
are much fewer in number compared to the loans under commitment, the decline in their spreads
is both economically and statistically more significant. This is probably because nearly all of the
non-commitment loans are small loans, of loan size less than $1 million, and mostly less than
$250,000. However, the difference in the statistical significance of the two subsamples for the
first year could be a data issue; for the loans under commitment, the initiation dates of the
commitments were not recorded for the time period used by my analysis. Therefore, the data
might include committed loans that were initiated before the merger. However, most of the loan
commitments are up to a year. Thus, the lack of initiation date for the commitment is almost
certainly not a problem for the second year and third years after the merger.
reported. That is because "After-Last-Merger Dummies” concentrate on only the last merger in a succession of mergers while "After-Merger-Dummies" include all of the mergers of an acquirer. 31 Same subsample analyses were also made based on some other characteristics of loans, such as whether the loan is a fixed vs. floating-rate loan, demand vs. non-demand loan, etc. The results are not reported because there was no interesting difference between these subsamples.
18
Panel B includes the same set of regressions for subsamples based on whether the loan is
secured or not (“Loans Secured by Collateral” vs. “Loans not Secured by Collateral”). Panel
B shows that secured loans are driving the main results, perhaps because unsecured loans are
generally larger in size, and fewer in number. When the unsecured loans are excluded from the
sample, the decline in spreads within the third year after the merger is statistically significant and
equal to 11 and 10 basis points for the all-loans sample and small loans, respectively.
3.7. Potential Changes in Loan Portfolios after the Mergers
One alternative explanation for the main results presented in Section 3.2. is a possible
change in the riskiness of the acquirer’s loan portfolio after the merger. Since STBL data do not
link loans and the firm characteristics of the borrowers, it is not possible to control for possible
changes in the characteristics of the loan portfolios after the merger, nor can we track existing
borrowers of the acquirer after the merger. In terms of control, loan or commitment size is used
as a proxy for the borrower size in all the regressions. Additionally, since targets are, on average,
much smaller and riskier than their acquirers, the additions to the acquirer’s portfolio after the
merger are expected to be relatively smaller and riskier borrowers; hence, if kept in the portfolio,
they are expected to increase the riskiness rather than decrease it.
However, using aggregate data, we can check whether there was any risk-shifting in the
loan portfolios of the acquirer after the merger. Changes in the nonperforming loans ratio are
used as a proxy for changes in the riskiness of the portfolio. If the alternative explanation were
correct, one would expect the nonperforming loans ratio of the acquirer to decline after the
merger. Following prior literature, the nonperforming loans ratio is calculated as the ratio of
loans more than 90 days late, plus loans not accruing, to the total loans. The results of regressing
nonperforming loans ratio on the three-year-after-merger dummies show that there is no
statistically significant change in the nonperforming loans ratio of the acquirer after the merger,
when compared to the same ratio before the merger. (The results are not reported since the
coefficients for all three years after the merger were both economically and statistically not
different from zero.) A possible longer-run change is checked by using five-year after-merger
dummies, as well, and the conclusions remain unaltered.
The literature emphasizes that loan characteristics could also affect the interest rates
charged on loans. (See, for instance, Berger and Udell (1990), arguing that collateral is most
19
often associated with higher-risk loans, and consequently with higher interest rates.) To check
this possibility, loan-level data was used to determine whether or not the volume of certain types
of loans within the acquirer’s portfolio changed after the merger. Table VII presents the results
for ratios based on three main characteristics within the portfolio of all loans as well as the
subsample of small loans.32 The main results of this paper could be similar if, given loan size, the
volume of secured loans, or fixed-rate loans, or loans under commitment were to increase in
banks’ portfolios after the merger. (See the signs of the coefficients of these loan characteristics
in Table III.) The dependent variable in Panel A is the ratio of secured loans in banks’ portfolios,
which is the total volume of loans secured by any type of collateral over the total loans of a given
bank in a given quarter. The only significant result is the positive coefficient in front of the first-
year after-merger dummy. As shown in Table III, loans secured by collateral are more risky, and
consequently have higher spreads given their size; therefore this positive coefficient would not
drive the results. On the contrary, it would bias first-year results in the opposite direction.33
Panels B and C present the results of the similar analyses for changes in the volume of
loans under commitment and the volume of floating-rate loans within the acquirer’s portfolio
after the merger. No coefficient of interest turned out to be significant in Panel B. The
significantly positive first-year coefficient in Panel C (following the same line of thought as for
ratio of secured-loans) was interpreted as evidence that would in fact bias first-year coefficients
of the main regressions in the opposite direction.
Although only one subsample of small loans is reported, changes in all these ratios were
analyzed within the subsample of large loans in addition to different subsamples of small loans,
along with changes in the natural logarithm of the face value or loan size within different size
categories post merger. The regression analyses show no significant change within the first two
years. Changes in the number of certain types of loans in addition to the volume of them within
the portfolio were also analyzed. All these robustness checks support that the reduction in the
spread is not driven by changes in the types of loans that the banks make.
32 Table VII presents only the results based on three main characteristics of loans. Changes in ratios based on different sizes and duration of loans were also checked, but not reported to save space. Moreover, all the regressions were run by excluding very short-term or very long-term loans as well as excluding demand loans with no stated maturity. All my results are robust to these checks. 33 As a side point, it should be noted that ratio of secured loans increases in the portfolio of new loan extensions within the first year after the merger. A possible explanation could be that, on average, more collateral is asked for in the restructuring phase after the merger because the acquirer might have some information disadvantage regarding the potential customers of the target.
20
Lastly, internal risk-ratings of individual loans, which the survey (STBL) started covering
in the second quarter of 1997, are used to check whether riskiness of acquirer portfolios changed
post mergers. Banks’ internal risk ratings are classified on a 1-5 scale, where a higher number
indicates greater risk. A rating of 1 refers to a loan with virtually no chance of resulting in a loss
while a rating of 5 refers to a work-out loan. I tested whether there is any change in average and
median risk rating as well as percentage of each rating category within the loan portfolio post
mergers, covering the time period when the risk rating data is available (There are only 100
mergers in my sample after the first quarter of 1997).34 Because of data limitations, regressions
are run leaving one-year period before the first and after the last merger. The coefficient of the
one-year after merger dummy is 0.05 (0.03) with a t-statistics of 0.49 (0.28) when mean
(median) rating is used as the dependent variable. Further, the coefficient of one-year after
merger dummy is also not statistically different than zero when percentages of each rating
category in loan portfolios are used as dependent variables. These results support our conclusion
that an improvement in borrower characteristics is unlikely to derive the results of this paper.
4. Market Overlap and Target’s Market Structure
The following two sections will differentiate types of mergers, based on the geographical
market overlap between the acquirer and the target as well as the structure of the target’s
markets.
4.1. In-Market vs. Out-of-Market Mergers
In-market mergers are defined as mergers of two banks which were serving at least one
common banking market before the merger. Out-of-market mergers, on the other hand, are
market-extension mergers, where target and acquirer did not have any market overlap. In-market
mergers produce much more potential for both exercising market power and creating efficiency
gains. First, compared to a merger of no market overlap, the concentration of the after-merger
banking market, hence the market power of the acquirer, is more likely to increase. Second, the
consolidated bank would have more offices to consolidate, more overlapping operations from
34 Using loan spread as the dependent variable, I rerun our basic regressions for this time period and the results remain unaltered.
21
which to choose the most efficient, more common local expertise to share, and consequently
more synergy to create.35
For the out-of-market acquirers, the potential for efficiency gains through consolidating
operations or closing the least efficient of overlapping branches does not exist. However, the
consolidated bank could enjoy other types of cost efficiencies, such as scale economies.
Moreover, acquirers might have a very different strategy after out-of-market mergers: in the new
markets they enter, they may try to create competition and gain more market share by offering
lower rates than the target and the rival banks used to offer before the merger.
Separating in-market mergers and market-extension mergers in the U.S. is a relatively
difficult task since most of the banks, especially the larger ones, operate in many markets. As a
consequence, the target and the acquirer can overlap in some markets while not overlapping in
others. Since branch-level loan data are not available for U.S. commercial banks, FDIC’s
Summary of Deposit data was used to get information on the deposit shares of banks instead of
loan shares in each market. Using deposits data implicitly assumes that banks generally make
loans in the same markets where they collect deposits. This is not an unreasonable assumption
since the Justice Department and banking authorities also use the deposit market shares of banks
to calculate the concentration in local banking markets (See e.g. Hannan and Prager (1998)). In
the U.S., a banking market is defined in antitrust analysis as the Metropolitan Statistical Area
(MSA) or non-MSA rural county. The market overlap between the acquirer and the target was
defined by the following formula:36
∑∑
+=
nTrgtAcq
nTrgtAcq
DepositDeposit
DepositDepositpMrktOverla
)(
),min(
where DepositAcq and DepositTrgt are, respectively, total deposits of the acquirer and the target in
n markets, in which either acquirer or target operate. MrktOverlap_Trgt is constructed by
35 See DeLong (1998) showing that mergers that increase geographical focus increase value. Houston and Ryngaert (1997) and Houston et al. (2001) also show that stock returns to the combined bank are positively correlated with the geographical overlap between the acquirer and the target while Kane (2000) show that gains of the shareholders of the large acquirers are larger after the in-state mergers. Moreover, Penas and Unal (2004), analyzing the commercial bank mergers between 1991 and 1998, find that, for an identical increase in size, gains to the bondholders of both the acquirer and the target around the merger announcement are higher if the merger is an in-state merger. 36 A very similar formula using number of branches instead of the total number of deposits is used in Houston and Ryngaert (1997) and Houston, James, and Ryngaert (2001) to identify market overlap.
22
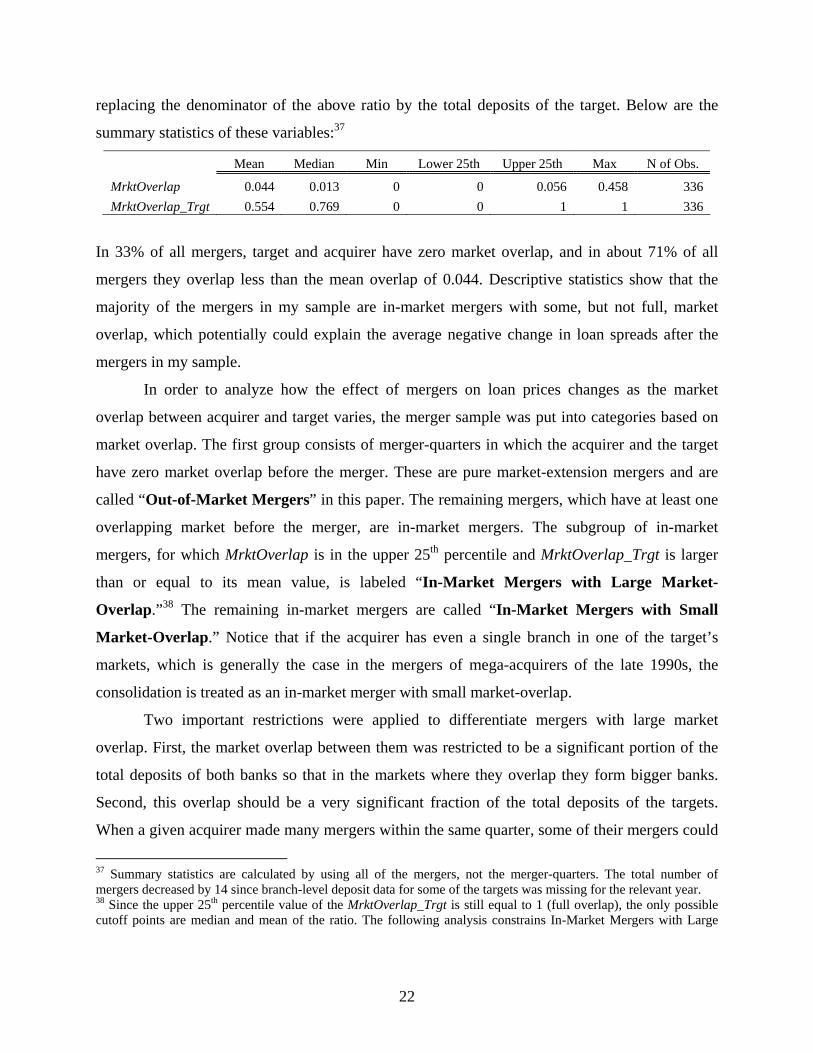
replacing the denominator of the above ratio by the total deposits of the target. Below are the
summary statistics of these variables:37
Mean Median Min Lower 25th Upper 25th Max N of Obs.
MrktOverlap 0.044 0.013 0 0 0.056 0.458 336 MrktOverlap_Trgt 0.554 0.769 0 0 1 1 336
In 33% of all mergers, target and acquirer have zero market overlap, and in about 71% of all
mergers they overlap less than the mean overlap of 0.044. Descriptive statistics show that the
majority of the mergers in my sample are in-market mergers with some, but not full, market
overlap, which potentially could explain the average negative change in loan spreads after the
mergers in my sample.
In order to analyze how the effect of mergers on loan prices changes as the market
overlap between acquirer and target varies, the merger sample was put into categories based on
market overlap. The first group consists of merger-quarters in which the acquirer and the target
have zero market overlap before the merger. These are pure market-extension mergers and are
called “Out-of-Market Mergers” in this paper. The remaining mergers, which have at least one
overlapping market before the merger, are in-market mergers. The subgroup of in-market
mergers, for which MrktOverlap is in the upper 25th percentile and MrktOverlap_Trgt is larger
than or equal to its mean value, is labeled “In-Market Mergers with Large Market-
Overlap.”38 The remaining in-market mergers are called “In-Market Mergers with Small
Market-Overlap.” Notice that if the acquirer has even a single branch in one of the target’s
markets, which is generally the case in the mergers of mega-acquirers of the late 1990s, the
consolidation is treated as an in-market merger with small market-overlap.
Two important restrictions were applied to differentiate mergers with large market
overlap. First, the market overlap between them was restricted to be a significant portion of the
total deposits of both banks so that in the markets where they overlap they form bigger banks.
Second, this overlap should be a very significant fraction of the total deposits of the targets.
When a given acquirer made many mergers within the same quarter, some of their mergers could
37 Summary statistics are calculated by using all of the mergers, not the merger-quarters. The total number of mergers decreased by 14 since branch-level deposit data for some of the targets was missing for the relevant year. 38 Since the upper 25th percentile value of the MrktOverlap_Trgt is still equal to 1 (full overlap), the only possible cutoff points are median and mean of the ratio. The following analysis constrains In-Market Mergers with Large
23
be in-market while the others could be out-of-market. I exclude from each subsample all merger-
quarters that have different types of mergers; however, these merger-quarters were only 12 in
number.
The mergers within a given quarter by the same acquirer were mostly either completely
in-market or completely out-of-market. However, an acquirer could have different types of
mergers following each other in a short time. In order to have a clean test of the effects of the
different types of mergers, an in-market merger (out-of-market merger) of a given acquirer was
included only if it was not less three years after its out-of-market merger (in-market merger). The
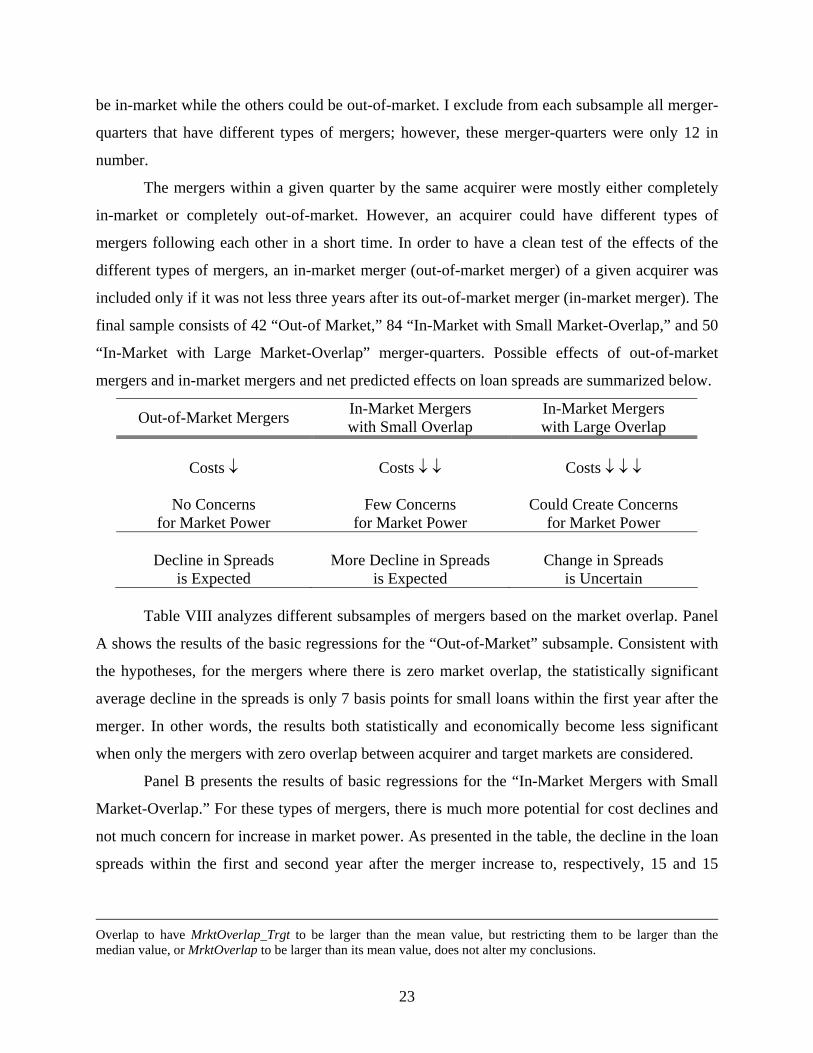
final sample consists of 42 “Out-of Market,” 84 “In-Market with Small Market-Overlap,” and 50
“In-Market with Large Market-Overlap” merger-quarters. Possible effects of out-of-market
mergers and in-market mergers and net predicted effects on loan spreads are summarized below.
Out-of-Market Mergers In-Market Mergers with Small Overlap
In-Market Mergers with Large Overlap
Costs ↓ Costs ↓ ↓ Costs ↓ ↓ ↓
No Concerns
for Market Power Few Concerns
for Market Power Could Create Concerns
for Market Power
Decline in Spreads is Expected
More Decline in Spreads
is Expected
Change in Spreads
is Uncertain
Table VIII analyzes different subsamples of mergers based on the market overlap. Panel
A shows the results of the basic regressions for the “Out-of-Market” subsample. Consistent with
the hypotheses, for the mergers where there is zero market overlap, the statistically significant
average decline in the spreads is only 7 basis points for small loans within the first year after the
merger. In other words, the results both statistically and economically become less significant
when only the mergers with zero overlap between acquirer and target markets are considered.
Panel B presents the results of basic regressions for the “In-Market Mergers with Small
Market-Overlap.” For these types of mergers, there is much more potential for cost declines and
not much concern for increase in market power. As presented in the table, the decline in the loan
spreads within the first and second year after the merger increase to, respectively, 15 and 15
Overlap to have MrktOverlap_Trgt to be larger than the mean value, but restricting them to be larger than the median value, or MrktOverlap to be larger than its mean value, does not alter my conclusions.
24
basis points for all loans and 20 and 19 basis points for small loans.39 These coefficients are
statistically significant at the 1% level, and they are also statistically different from the ones in
Panel A. Compared to the market-extension mergers, the reduction in spreads is, as expected,
much larger.
The last panel of Table VIII reports results of the subsample of “In-Market Mergers with
Large Market-Overlap.” As explained above, this subsample could include some mergers that
have so much overlap as to create some concerns for market power; however, at the same time
they enjoy much more potential for efficiency gains. First-, second-, and third-year after-merger
coefficients are, respectively, -5, -4, and -8 basis points for all loans, and -11, -12, and -19 basis
points for small loans. The decline in spreads within all three years after the merger is
statistically significant at the 5% level for small loans. That suggests the market power effect is,
on average, outweighed by the higher potential for efficiency gains. To check if the upper 25th
percentile cut-off (which is 0.056) for significant overlap is high enough to include only the
mergers with such significant overlap as to create concerns for market power, Table IX Panel A
shows the same regression results using the subsample of mergers where MrktOverlap is in the
upper 10th percentile. These mergers, which have much more potential to increase the
concentration of banking markets, result, on average, in 13 and 20 basis points higher spreads
within the first and third years after the merger, and this statistically significant increase is driven
by larger loans. Insignificant change in spreads on small loans is puzzling. One explanation
might be potential political pressure that banks would face if they increased interest rates for
small enterprises post mergers.40
4.2. The Effect of the Target’s Market Structure
This section will explore the effect of the target’s market structure on some strategic
decisions of the acquirer to reduce or increase the loan rates after the merger. As Sapienza (2002)
states, “If a bank’s motivation is to gain market share, then it can bring new, aggressive
competition to markets that were imperfectly competitive, and it can reduce the possibility of
39 Regressions using “After-Last-Merger Dummies” give coefficients that are economically much larger. See Appendix Table for the results. 40 Mergers having significant effects on market structure were also identified by calculating the pro forma change in the Herfindahl-Hirschmann Index (HHI) as described in the literature (see, for instance, Hannan and Prager (1998)). In my sample, there were only 9 mergers that produced a pro-forma increase in target-market HHI of at least 200
25
collusive behavior.” However, if a large acquirer is entering into a market dominated by small
banks, there would be no need to reduce spreads to gain market share since a big acquirer would
already be more efficient and therefore charging lower prices on a given loan than the prices of
the existing smaller competitors.41
Since STBL is biased towards larger banks, most of the acquirers in the sample are large
banks, although the size of the targets can vary widely. For all the target markets, using branch-
level Summary of Deposits data as of two quarters before the merger, the percentage of deposits
held by different sizes of banks is calculated (as in Berger et al. (2001)). “Small Banks’ Markets”
are defined as markets in which market shares of small and medium-sized banks (with gross total
assets less than $1 billion) are greater than their median market share (0.35) among all the
markets of the targets in my sample. “Large Banks’ Markets” are markets dominated by banks
with gross assets more than $1 billion.
Table X presents the results for two subsamples of “Out-of-Market” mergers: mergers
into “Small Banks’ Market” and into “Large Banks’ Market.” As shown in Panel A, when
out-of-market acquirers enter new markets where there was already large bank dominance, they
reduce spreads starting within the first year. This significant reduction within the first year is, on
average, 14 basis points for all loans and 19 basis points for large loans. Panel B shows the
results for market-extension mergers into Small Banks’ Market, where there is no significant
change in the spreads after the mergers.42
Second, the effect of the target’s market structure on the decision to exercise market
power is explored. In Panel B of Table IX, results for the “In-Market Mergers with Large
Overlap” (with overlap in the upper 25th percentile), but only for the “Small Banks’ Markets,”
are presented. Unlike the whole sample of in-market mergers with large (in the upper 25th
percentile) overlap, which was presented in Panel C of Table VIII, the market power effect
dominates the efficiency effect if the target markets are dominated by small banks. Spreads on all
points to a post-merger pro forma HHI of at least 1800. Regression analysis using these mergers also results in a statistically significant increase in spreads on large loans after the merger. 41 It is empirically shown that large banks charge lower interest rates even for their small business loans (Berger and Udell (1996)). 42 A similar analysis was made for in-market mergers with small overlap. The significant decline in spreads of small loans within the first two years after the merger is statistically very significant for these in-market mergers, independent of the target’s market structure. However, for large loans the change in spreads after these in-market mergers becomes statistically significant within the first year after the merger when the target’s market was dominated by large banks rather than small banks. This result might be interpreted as a strategic price cut, as well.

26
loans increase significantly, by 10 basis points, and on large loans by 17 basis points within the
first year following the merger; these results might be due to the lack of other large banks’
competition in the target’s markets. The existence of smaller banks rather than big ones could
make collusion among banks easier and enable a newly formed consolidated bank to increase
spreads. However, it is worth noting that this regression uses only 19 merger-quarters, which
constitutes a small fraction of the merger sample.43
4.3. Potential Changes in Loan Portfolios after In-Market and Out-of-Market Mergers
Changes in the riskiness of loan portfolios by using the nonperforming loans ratio as a
left-hand-side (LHS) variable as well as changes in ratios of loans with certain characteristics
within acquirer’s portfolio (as explained in Section 3.4) are checked by using only in-market
mergers and out-of-market mergers. Similar analyses are done for the subsample of mergers
based on market structure. Although results are not reported (to save space), the conclusions of
this section are in fact strengthened.
4.4. Within-Family Mergers
After the banking deregulation, one common type of merger is the consolidation of the
same banks’ branches, which served in different states as separate banks because of the
branching restrictions of the period. These “within-family” mergers that were separated out are
all out-of-market mergers. Given that these two banks (in fact, branches) are expected to share
the lending decisions of the same bank in different states before the merger, we do not expect to
see any change in their lending behaviors after the merger. This sample of “within-family”
mergers is analyzed but not reported in order to save space. The coefficients of all three after-
merger dummies are statistically not different from zero for basic regressions including all of the
loans and different subsamples of small business loans.
43 As a caveat, there could be some endogeneity issues regarding the type of the merger and the structure of the targets’ banking markets, and the results could be due to correlation instead of causation. For example, there could be unobservable variables that affect the type of the merger or the structure of the targets’ markets and the decline in spreads contemporaneously.
27
5. Is the Reduction in Spreads Due to Efficiency Gains? Findings based on the market overlap between the acquirer and the target are consistent
with what theories imply about the magnitude of the possible efficiency and market power
effects. However, analyses below aim to further test the hypothesis that the decline in the spreads
is due to efficiency gains reflected in loan rates and these reflections are not temporary.
5.1. Operating Efficiencies
As in Focaralli and Panetta (2003), operating-cost ratios for the merging banks were
analyzed to further test the hypothesis that the decline in the spreads is due to efficiency gains
reflected in loan rates. For that purpose, the operating-cost ratios (operating expense over
operating income) of the acquirers as of the second year-end after the merger were compared to
the operating-cost ratios of the pro-forma banks (targets plus acquirers) as of the year-end before
the merger.44 A decline in this cost ratio could be due to both reductions in operating costs (“cost
efficiencies”) and also increase in quantities given the prices (“profit efficiency”). As argued by
Akhavein et al. (1997), profit efficiencies must also be considered in evaluating merger gains
since operating efficiencies could be due to a higher value of output produced or lower value of
inputs consumed given the prices as well as cost efficiencies.45 Although analyzing changes in
the operating-cost ratio after the merger is not an ideal way to measurement of efficiency gains,
one would expect acquirers with a larger decline in operating-cost ratios to reduce spreads more
than the acquirers with less decline or even an increase in these cost ratios.
Table XI presents the results based on the subsample of mergers, after which “Operating
Cost Ratio Declined More than Median” and “Operating Cost Ratio Declined Less than
Median” decline in operating cost ratios among all the sample mergers.46 The decline in spreads
is both economically and statistically much larger for the subsample with larger than median
44 Mergers with the market overlap in the upper 10th mercantile are excluded from this sample since loan spreads, on average, widen after these mergers (as shown in Table IX Panel A). 45 As a robustness check, operating cost ratio is calculated by using total assets instead of the operating income in the denominator. Results were unaltered. 46 In order to have a clean test of the effects of these different types of mergers, in Table X, I included the mergers that create a larger than median decline in cost-ratios only if this merger is not within three years after another merger of the same acquirer that created a smaller than median decline in the cost ratio. The same criterion is used for the latter subsample as well. I ended up with 85 (81) mergers, after which operating cost ratios declined “more than the median” (“less than the median”).
28
decline in the operating cost ratios; and the difference between subsamples is highly significant.
For the acquirers with less-than-median decline in their cost ratios, the only significant reduction
in spreads is observed within the second year after the mergers, and it is -8 basis points
(significant at the 5% level). However, mergers with more-than-median decline in operating cost
ratio result in significant decline of 22 and 18 basis points (significant at the 1% level) for small
loans within, respectively, the first and second year after the merger as well as 17, 16 (significant
at the 1% level), and 11 (significant at the 10% level) basis points for all loans within,
respectively, first, second, and third year after the merger. More importantly, if the operating
efficiencies are higher, the effects of efficiencies are reflected in large loans as well. Acquirers
that enjoy larger than median decline in their operating costs reduce spreads by 14, 19
(significant at the 1% level), and 22 (significant at the 5% level) basis points within, respectively,
the first, second, and third year after their mergers.
A second check was constructed based on the following result. Penas and Unal (2004)
show that bondholders of merging banks realize the highest returns if the merging banks become
“too-big-to-fail” as the result of the merger while already “mega” banks earn relatively lower
adjusted returns. There were only 6 acquirers which became mega acquirers (with gross total
assets larger than $10 billion) after the mergers; however it is worth noting that the decline in the
spreads after the mergers of these banks are on average much larger than after other subsamples
of mergers. Large acquirers which become mega acquirers through the mergers reduce spreads
on small loans, on average, 42 basis points within the second year and 50 basis points within the
third year after the merger. Both of these coefficients are statistically significant at the 1% level.
It is also worth mentioning that the economic significance of the decline in spreads could
have been understated, since the data do not differentiate loans going to the target’s markets from
all other markets of the given acquirer after the merger. Although the technological
improvements of the last decade prevent large banks from price discrimination in different
banking markets, one would expect the effect on the spreads to be much larger for the targets’
markets than for any other banking market of the acquirer. The fact that the average after-merger
decline in spreads is both statistically and economically significant without differentiating
banking markets of the acquirer is also supporting the efficiency arguments.
29
5.2. Temporary vs. Persistent Decline in Spreads
As already discussed in Section 3.4, insignificant coefficients for the third-year after-
merger dummy in some of the regressions (for example, in Table III, including all types of
mergers) raises the question of whether the decline in spreads is temporary or permanent. One
might argue that if the decline in spreads disappears after three years, it would not be accurate to
conclude that efficiency gains have been passed on to the borrowers, but rather that there were
only some strategic price cuts, which are reversed later.
Panel A of Table XI clearly shows that when we concentrate on mergers after which the
operating cost ratio declines are larger than the median, third-year coefficients are both
statistically and economically significant for the all-loans sample as well as the large loans
subsample. Although statistically insignificant, the coefficient of the third-year after-merger
dummy in the small loans subsample is -7 basis points, as well. Similarly, subsample of “In-
Market Mergers with Large Overlap” (Table VIII, Panel C) result in both economically and
statistically significant decline in spreads within the third year after the merger. These results as
well as the findings when mega acquirers are excluded (Panels B and C of Table IV and Panel C
of Table V) constitute important evidence that declines in spreads do not disappear within the
third year after the merger. On the contrary, the effect is highly persistent after the mergers with
more potential for cost savings.
As an alternative, instead of focusing on only three years before and after the merger, the
same set of regressions were run by using a right-hand-side (RHS) variable (All-the-Way after-
merger dummy) that is, for a given acquirer, equal to 1 in all the quarters after its first merger,
without differentiating the type of the merger, and otherwise is zero. Although not reported,
regressions using this all-the-way after-merger dummy variable show a 10 basis points decline
(significant at 10% level) for small loans, with loan size less than $1 million, and 13 basis points
decline (significant at 5% level) for small loans, with loan size less than $250,000. These results
further support that, regardless of the length of the event window analyzed, spreads, on average,
decline after consolidation.
As a final check, average two-year and three-year after-merger dummies were examined
instead of year-by-year after-merger dummies. After controlling for the loan size, basic
regressions including all mergers result in average two-year declines of 12 basis points for all-
loans, and 19 basis points for small loans, and average three-year declines of 11 basis points for
30
all-loans and 20 basis points for small loans. All these coefficients are statistically significant at
the 1% level.
5.3. Changes in Quantity of Bank Services after the Mergers
I further examine whether results of this paper are driven by an after-merger decrease in
demand for the quantity of bank services. A demand-decreasing story would be consistent with
my findings if, for example, banks merged in response to an anticipation of a decrease in demand
for the merging banks. To distinguish between such a story and my argument of decreasing
marginal costs due to mergers, I test for changes in the quantity of bank services provided by the
merged bank. Using branch-level data on the deposit shares of banks from the FDIC’s Summary
of Deposit, I find that the average increase in the market share of the acquirer when compared to
the market share of the pro-forma bank (target plus acquirer before the merger) is 2.6%, which is
significant at the 1% level. Such an increase in bank services supplied by the merged bank is
consistent with lower marginal costs and resulting reductions in loan spreads due to mergers.
6. Deregulation as an Exogenous Instrument for the Timing of Mergers
As mentioned before, the merger sample spans 1990-2000 because of the large increase
in the number of mergers in this time period. This increase was mainly due to the removal of
intrastate and interstate banking restrictions during the 1980s and early 1990s. Banking literature
widely recognized deregulation as the main reason for the merger wave of the last decade (see,
for instance, Andrade et al. (2001) for the argument that deregulation is the dominant factor in
merger and acquisition activity during the 1990s). However, one might still argue that acquirers
could be timing their mergers before the declines in their average spreads. In order to alleviate
any concerns regarding the endogeneity of the timing of the mergers in the sample, the variation
in banking deregulation dates across states was used as an instrument for the dates of these
mergers. Since the results are driven mostly by in-market mergers, the date (year), in which each
state allowed “intrastate branching through mergers and acquisitions” was used as the instrument
for the timing of in-market mergers. (The dates of banking deregulation across states are taken
from Kroszner and Strahan (1999).) The following quote is from Jayaratne and Strahan (1998),
arguing that the timing of the banking deregulation was exogenous: “States were just as likely to
31
deregulate branching restrictions during the downswings of the business cycles as during the
upswings” (p.259).
The results of the first-stage regressions are presented in Panel A of Table XII. The
regressions are at the market (MSA or non-MSA county) - quarter level. WithinAfterMrgrThree
is an indicator variable equal to 1 in all the quarters within three years after an in-market merger
if the target operates in that given market, and is equal to zero within three years before the
merger. In other words, it spans three after-merger dummies that are used as the main
explanatory variables for in-market mergers in the previous sections. Mergers, where the
acquirer and the target have some geographical overlap of markets (MSA or non-MSA county)
before the merger, are defined as in-market mergers. Independent variable,
Aftr_IntraStateDeregulation, takes the value of 1 in all the quarters after a state is deregulated
(by allowing intrastate branching through mergers and acquisitions) if a given market is within
that deregulated state, and is zero otherwise.47 Each regression includes time fixed effects
(quarter dummies) as well as market fixed effects and standard errors are corrected for clustering
of observations at the state level.
As shown in Panel A of Table XII, the coefficient of WithinAfterMrgrThree is equal to
0.168, which is significant at the 5% level. The predicted values from the first stage
(Predicted_WithinAftrMrgrThree) are used as an independent variable in the second stage,
where the dependent variable is the average Spread per market, collapsed by incorporating some
characteristics of loans (whether the loan is secured or not, whether it is under commitment or
not, whether it is fixed-rate or not, and whether it is a small-business loan or not). Panel B of
Table XII shows these second-stage results: The decline in the average spread is about 7 basis
points within the third year after the merger but is not statistically significant. However, when
the same regression is run for small loans, coefficient of Predicted_WithinAftrMrgrThree
becomes -16.5 basis points, which is significant at the 5% level. These results show that
47 There were four different types of deregulation: intrastate branching through M&A, full intrastate branching permitted, interstate banking permitted, and multibank holding companies permitted (Kroszner and Strahan (1999)). The instrument used in this paper is the variation in deregulation of intrastate branching through M&A, that is, when states started allowing banks to expand statewide by acquiring other banks. In order to capture more state variation, I extended my data for a few more years and could capture 26 states that deregulated their “intrastate branching restrictions through mergers” in the time period between 1985 and 1994 (since my loan-level data go back to only 1985). This number reduces to, for example, 8 states if after-merger dummies were created only for the states deregulated starting 1990. As a robustness check, I rerun loan-level regressions of the previous sections for this time period and the results remain unaltered.
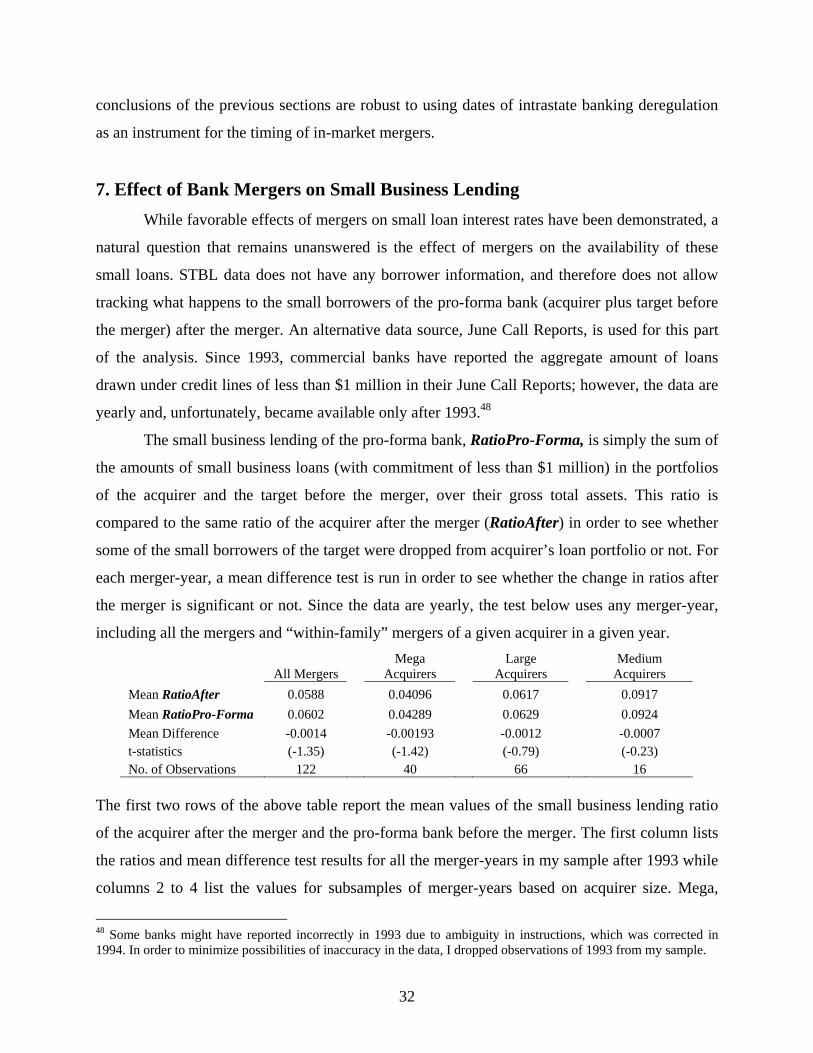
32
conclusions of the previous sections are robust to using dates of intrastate banking deregulation
as an instrument for the timing of in-market mergers.
7. Effect of Bank Mergers on Small Business Lending While favorable effects of mergers on small loan interest rates have been demonstrated, a
natural question that remains unanswered is the effect of mergers on the availability of these
small loans. STBL data does not have any borrower information, and therefore does not allow
tracking what happens to the small borrowers of the pro-forma bank (acquirer plus target before
the merger) after the merger. An alternative data source, June Call Reports, is used for this part
of the analysis. Since 1993, commercial banks have reported the aggregate amount of loans
drawn under credit lines of less than $1 million in their June Call Reports; however, the data are
yearly and, unfortunately, became available only after 1993.48
The small business lending of the pro-forma bank, RatioPro-Forma, is simply the sum of
the amounts of small business loans (with commitment of less than $1 million) in the portfolios
of the acquirer and the target before the merger, over their gross total assets. This ratio is
compared to the same ratio of the acquirer after the merger (RatioAfter) in order to see whether
some of the small borrowers of the target were dropped from acquirer’s loan portfolio or not. For
each merger-year, a mean difference test is run in order to see whether the change in ratios after
the merger is significant or not. Since the data are yearly, the test below uses any merger-year,
including all the mergers and “within-family” mergers of a given acquirer in a given year.
All Mergers Mega
Acquirers Large
Acquirers Medium
Acquirers Mean RatioAfter 0.0588 0.04096 0.0617 0.0917 Mean RatioPro-Forma 0.0602 0.04289 0.0629 0.0924 Mean Difference -0.0014 -0.00193 -0.0012 -0.0007 t-statistics (-1.35) (-1.42) (-0.79) (-0.23) No. of Observations 122 40 66 16
The first two rows of the above table report the mean values of the small business lending ratio
of the acquirer after the merger and the pro-forma bank before the merger. The first column lists
the ratios and mean difference test results for all the merger-years in my sample after 1993 while
columns 2 to 4 list the values for subsamples of merger-years based on acquirer size. Mega,
48 Some banks might have reported incorrectly in 1993 due to ambiguity in instructions, which was corrected in 1994. In order to minimize possibilities of inaccuracy in the data, I dropped observations of 1993 from my sample.
33
Large, and Medium Acquirers are the acquiring banks with gross total assets of at least $10
billion, between $1 billion and $10 billion, and between $100 million and $1 billion,
respectively. The mean difference test shows that the change in the mean ratios is negative, but
not statistically significant, even for the mega-acquirers subsample. Moreover, analyses of the
quantities of small business lending before and after the mergers show that the amount of small
business lending of the acquirer increased after the merger. In fact, for 37 of the total 122
merger-years, the change in ratios was positive, meaning that after the mergers some acquirers
increased small business lending beyond the small borrowers of the target. While these results
provide evidence that after merging with smaller targets, acquirers do not drop all the small
business lending of the target, it is possible that they drop very risky borrowers and keep the
relatively transparent ones or obtain new small borrowers through the target’s markets. The
reason for the increase in small business lending in acquirer’s portfolio could be shifts in lending
technologies after the merger, or diversification motives of the acquirer. Moreover, technological
improvements that create opportunities for small business owners to provide more “hard”
information about their companies could be the main reason for these small business loans to
stay in the large acquirers’ loan portfolios.
8. Conclusion
This paper shows evidence in support of the hypothesis that bank mergers, on average,
benefit borrowers through lower interest rates. The after-merger reductions in spreads seem to
be related to some efficiency gains that are passed on to the borrowers. These efficiencies could
be created by changes in lending technologies (clientele effect) and diversification of risk, which
could affect the spreads in a relatively short time after the merger. Additionally, the reduction in
spreads could be due to scale and/or scope efficiencies, which might take longer to be realized.
The decline in spreads is both economically and statistically stronger for the mergers with a
larger-than-median decline in their operating cost ratios than for the mergers with a smaller-than-
median decline in their operating cost ratios. Furthermore, compared to market extension
mergers, the decline in spreads is much larger for in-market mergers, in which the acquirer and
the target have market overlap before the merger and, consequently, more potential for cost
savings. However, the effect is not monotonically increasing with the market overlap: if the
34
geographical overlap between merging banks is so extensive as to significantly increase the
concentration in the banking markets, the spreads, on average, increase after the mergers.
My analyses compare the same acquirers before and after the mergers. Since targets have,
on average, smaller and riskier loans, the average interest rate in the acquirer’s portfolio is
expected to increase after this portfolio is consolidated with that of the target. However, after
controlling for the size and some other characteristics of the loans, empirical evidence shows that
acquirers, on average, charge lower rates on their new loan extensions, and this reduction is
highly significant for small loans. This latter finding is particularly important since it provides
evidence of favorable effects of bank mergers for small businesses.
Although these results provide significant evidence for efficiency gains passed on to
borrowers as a result of bank mergers, the loan size is used as a proxy for the borrower size,
instead of the borrower’s own asset size. This leaves open the possibility that the reduction in
spreads could be driven by shifts in borrower composition at a given loan size. However,
robustness checks do not find any significant change in the ratio of certain characteristics of
loans within a bank’s loan portfolio after the merger; therefore, borrower quality seems highly
unlikely to be driving results. On the contrary, given the loan size, the ratio of secured loans or
floating-rate loans within the acquirer’s portfolio are found to be significantly increasing within
the first year after the merger. This is likely to bias my results in the opposite direction, since
secured loans and floating-rate loans, on average, have higher spreads. Further, the mean and
median risk ratings of individual loans, which are available for the later part of my sample
period, as well as the nonperforming loans ratio of the acquirers do not change after the mergers
at all, ruling out any significant shifts in the riskiness of the loan portfolios.
In addition to the pricing effect of mergers, the effect of mergers on loan availability to
small businesses is also explored. After mergers, acquirers might drop all the risky, opaque
borrowers in the loan portfolio of the targets. However, I find that the amount of small business
lending of the acquirer increases after the merger. Additionally, the average change in the ratio
of small business lending of the acquirer after the merger compared to the same ratio of the pro-
forma bank (target plus acquirer) before the merger is not statistically significant at the 10%
level. The data for the quantities of small business lending are available only after 1993, and this
period mostly coincides with the implementation of credit scoring technologies for commercial
loans. Therefore, technological improvements applied to commercial lending could explain the
35
insignificance of the mean change in small business lending ratios because these improvements
have created opportunities for large banks to acquire more hard information about small
businesses.
In conclusion, contrary to expectations, bigger acquirers do not impose less favorable
pricing terms on small businesses seeking to borrow. Indeed, the findings of this paper show that
small borrowers typically pay lower interest rates to banks that have expanded during the
previous two years through mergers. The favorable effects of the mergers reflected in small loan
prices could be indicating that large banks now value small business lending much more in their
portfolios. However, DeYoung et al. (2005) provide empirical evidence that lenders that use
credit scoring models experience higher default rates, while Berger et al. (2005a) show that
credit scoring is associated with higher prices and more risk for the small loans with loan size
less than $100,000. How improvements in small-business-lending technologies will affect the
composition and the riskiness of large banks’ loan portfolios, is a topic that deserves further
research. In addition, as a future extension of this study, it would be interesting to identify the
precise effects of a merger that lead to bank efficiency, whether efficiencies are due to
diversification or cost savings through better use of the infrastructure and personnel, or,
alternatively, due to new technologies applied to commercial lending.
36
References: Akhavein, Jalal D., Allen N. Berger, and David B. Humphrey, 1997, The effects of mega-mergers on efficiency and prices: Evidence from a bank profit function, Review of Industrial Organization 12, 95-139. Andrade, Gregor, Mark Mitchell, and Erik Stafford, 2001, New evidence and perspectives on mergers, Journal of Economic Perspectives 15, 103-120. Berger, Allen N., 1997, The efficiency effects of bank mergers and acquisitions: A preliminary look at the 1990s data, in Y. Amihud and G. Miller eds.: Mergers of Financial Institutions (Homewood, Ill: Business One-Irwin). Berger, Allen N., Rebecca Demsetz, and Phillip Strahan, 1999, The consolidation of financial services industry: Causes, consequences and implications for the future, Journal of Banking and Finance 27 (2), 404-31. Berger, Allen N., and Robert DeYoung, 2002, Technological progress and the geographical expansion of the banking industry, Working Paper, Federal Reserve Bank of Chicago. Berger, Allen N., W. Scott Frame, and Nathan H. Miller, 2005a, Credit scoring and the availability, price, and risk of small business credit, Journal of Money, Credit and Banking 37, 191-222. Berger, Allen N., and Timothy H. Hannan, 1989, The price-concentration relationship in banking, Review of Economics and Statistics 71, 291-299. Berger, Allen N., and David B. Humphrey, 1992, Megamergers in banking and the use of cost efficiency as an antitrust devise, Antitrust Bulletin (fall), 541-600. Berger, Allen N. and Anil K. Kashyap, and Joseph M. Scalise, 1995, The transformation of the US banking industry: What a long, strange trip it’s been, Brookings Papers on Economic Activity 4, 55-218. Berger, Allen N., Nathan H. Miller, Mitchell A. Petersen, Raghuram G. Rajan, and Jeremy C. Stein, 2005b, Does functional follow organizational form? Evidence from the lending practices of large and small banks, Journal of Financial Economics 76, 237-269. Berger, Allen N., Richard J. Rosen, and Gregory F. Udell, 2001, The effect of market size structure on competition: The case of small business lending. Proceedings of the 37th Annual Conference on Bank Structure and Competition, Federal Reserve Bank of Chicago. Berger, Allen N., Anthony Saunders, Joseph M. Scalise, and Gregory F. Udell, 1998, The effects of bank mergers and acquisitions on small business lending, Journal of Financial Economics 50, 187-229.
37
Berger, Allen N., and Gregory F. Udell, 1990, Collateral, loan quality, and bank risk, Journal of Monetary Economics 25, 21-42. Berger, Allen N., and Gregory F. Udell, 1995, Relationship lending and lines of credit in small firm finance, Journal of Business 68/3, 351-381. Berger, Allen N., and Gregory F. Udell, 1996, Universal banking and future of small business lending, in A. Saunders and Ingo Walter eds.: Financial System Design: The Case for Universal Banking (Irwin Publishing, Homewood, IL). Berger, Allen N., and Gregory F. Udell, 2002, Small business credit availability and relationship lending: The importance of bank organizational structure, Economic Journal 112, F32-F53. Black, Sandra E., and Philip Strahan, 2002, Entrepreneurship and bank credit availability, Journal of Finance 57, 2807-2833. Boot, Arnoud W.A., 2000, Relationship lending: What do we know? Journal of Financial Intermediation 9, 7-25. Brealey, Richard A., Stewart C. Myers, and Franklin Allen, 2006, Principles of Corporate Finance, 8th ed. (McGraw-Hill/Irwin, New York) Calomiris, Charles W., and Jason Karceski, 2000, Is the bank merger wave of the 1990s efficient? Lessons from nine case studies, in S. Kaplan eds.: Mergers and Productivity (University of Chicago Press/ NBER, IL) Cole, Rebel A., Lawrence G. Goldberg, and Lawrence J. White, 1999, Cookie-cutter vs. character: The microstructure of small business lending by large and small banks, in J.L. Blanton, A. Williams and S.L.W. Rhine eds.: Business Access to Capital and Credit (Federal Reserve System Research Conference), 362-389. Cornett, Marcia M., and Hasan Tehranian, 1992, Changes in corporate performance associated with bank acquisitions, Journal of Financial Economics 31, 211-234. Degryse, Hans, Nancy Masschelein, and Janet Mitchell, 2005, SMEs and bank relationships: The impact of mergers, CEPR Discussion Paper. DeLong, Gayle L., 1998, Domestic and international bank mergers: the gains from focusing vs. diversifying, PhD Thesis, NYU. DeYoung, Robert, Dennis Glennon, and Peter Nigro, 2005, Borrower-lender distance, credit scoring, and the performance of small business loans, Working Paper, Federal Reserve Bank of Chicago. Drucker, Steven, 2005, Information asymmetries and the effects of banking mergers on firm-bank relationships, Working Paper, Columbia Business School.
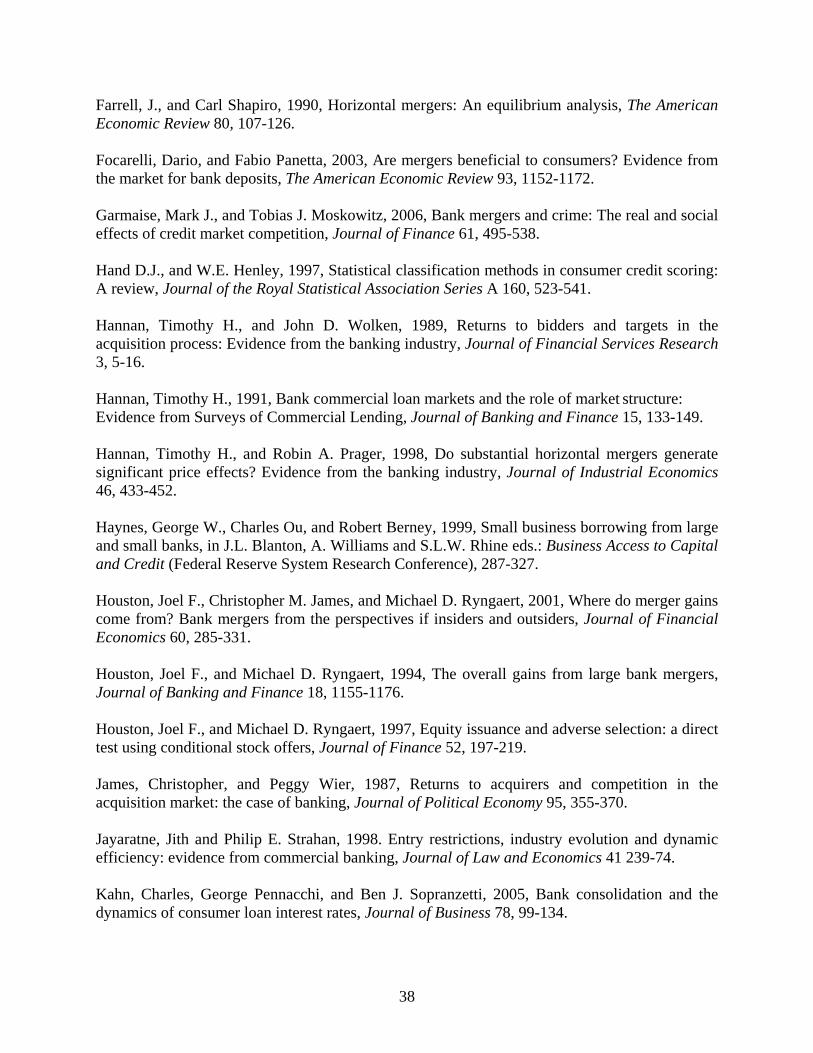
38
Farrell, J., and Carl Shapiro, 1990, Horizontal mergers: An equilibrium analysis, The American Economic Review 80, 107-126. Focarelli, Dario, and Fabio Panetta, 2003, Are mergers beneficial to consumers? Evidence from the market for bank deposits, The American Economic Review 93, 1152-1172. Garmaise, Mark J., and Tobias J. Moskowitz, 2006, Bank mergers and crime: The real and social effects of credit market competition, Journal of Finance 61, 495-538. Hand D.J., and W.E. Henley, 1997, Statistical classification methods in consumer credit scoring: A review, Journal of the Royal Statistical Association Series A 160, 523-541. Hannan, Timothy H., and John D. Wolken, 1989, Returns to bidders and targets in the acquisition process: Evidence from the banking industry, Journal of Financial Services Research 3, 5-16. Hannan, Timothy H., 1991, Bank commercial loan markets and the role of market structure: Evidence from Surveys of Commercial Lending, Journal of Banking and Finance 15, 133-149. Hannan, Timothy H., and Robin A. Prager, 1998, Do substantial horizontal mergers generate significant price effects? Evidence from the banking industry, Journal of Industrial Economics 46, 433-452. Haynes, George W., Charles Ou, and Robert Berney, 1999, Small business borrowing from large and small banks, in J.L. Blanton, A. Williams and S.L.W. Rhine eds.: Business Access to Capital and Credit (Federal Reserve System Research Conference), 287-327. Houston, Joel F., Christopher M. James, and Michael D. Ryngaert, 2001, Where do merger gains come from? Bank mergers from the perspectives if insiders and outsiders, Journal of Financial Economics 60, 285-331. Houston, Joel F., and Michael D. Ryngaert, 1994, The overall gains from large bank mergers, Journal of Banking and Finance 18, 1155-1176. Houston, Joel F., and Michael D. Ryngaert, 1997, Equity issuance and adverse selection: a direct test using conditional stock offers, Journal of Finance 52, 197-219. James, Christopher, and Peggy Wier, 1987, Returns to acquirers and competition in the acquisition market: the case of banking, Journal of Political Economy 95, 355-370. Jayaratne, Jith and Philip E. Strahan, 1998. Entry restrictions, industry evolution and dynamic efficiency: evidence from commercial banking, Journal of Law and Economics 41 239-74. Kahn, Charles, George Pennacchi, and Ben J. Sopranzetti, 2005, Bank consolidation and the dynamics of consumer loan interest rates, Journal of Business 78, 99-134.

39
Kane, Edward J, 2000, Incentives for banking megamergers: What motives might regulators infer from event study evidence? Journal of Money, Credit and Banking 32, 671-701. Karceski, Jason, Steven Ongena, and David C. Smith, 2005, The impact of bank consolidation on commercial borrower welfare, Journal of Finance 60, 2043-2082. Keeton, W., 1996, Do bank mergers reduce lending to businesses and farmers? New evidence from Tenth District States, Federal Reserve Bank of Kansas City Economic Review 81, 63-75. Kim, E. Han, and Vijay Singal, 1993, Mergers and market power: Evidence from the airline industry, The American Economic Review 83, 549-569. Kroszner, Randall S., and Phillip Strahan, 1999, What drives deregulation? Economics and politics of the relaxation of bank branching restrictions, Quarterly Journal of Economics 114/4. Nakamura, Leonard I., 1993, Commercial Bank Information: Implication for the structure of banking, in M. Klausner and L.J. White eds.: Structural Change in Banking (Irwin Publishing, Homewood, IL). Park, Kwangwoo, and George G. Pennacchi, 2005, Harming depositors and helping borrowers: The disparate impact of bank consolidation, AFA 2005 Philadelphia Meetings Paper. Peek, Joe, and Eric S. Rosengren, 1996, Small business credit Availability: How important is size of lender, in A. Saunders and Ingo Walter eds.: Financial System Design: The case for Universal Banking (Irwin Publishing, Homewood, IL). Peek, Joe, and Eric S. Rosengren, 1998, Bank consolidation and small business lending: It is not just bank size that matters, Journal of Banking and Finance 22, 799-820. Penas, Maria Fabiana, and Haluk Unal, 2004, Gains in bank mergers: Evidence from bond markets, Journal of Financial Economics, 1-31. Petersen, Mitchell, 2004, Information: Hard and Soft. Working Paper, Northwestern University. Petersen, Mitchell, 2006, Estimating Standard Errors in Finance Panel Data Sets: Comparing Approaches, Working Paper, Northwestern University. Petersen, Mitchell, and Raghuram G. Rajan, 1994, The benefits of lending relationships: Evidence from small business data, Journal of Finance 49, 3-37. Petersen, Mitchell, and Raghuram G. Rajan, 2002, Does distance still matter? The information revolution in small business lending, Journal of Finance 57, 2533-70. Pilloff, Steven J., 1996, Performance changes and shareholder wealth creation associated with mergers of publicly traded banking institutions, Journal of Money, Credit and Banking 28, 294-310.
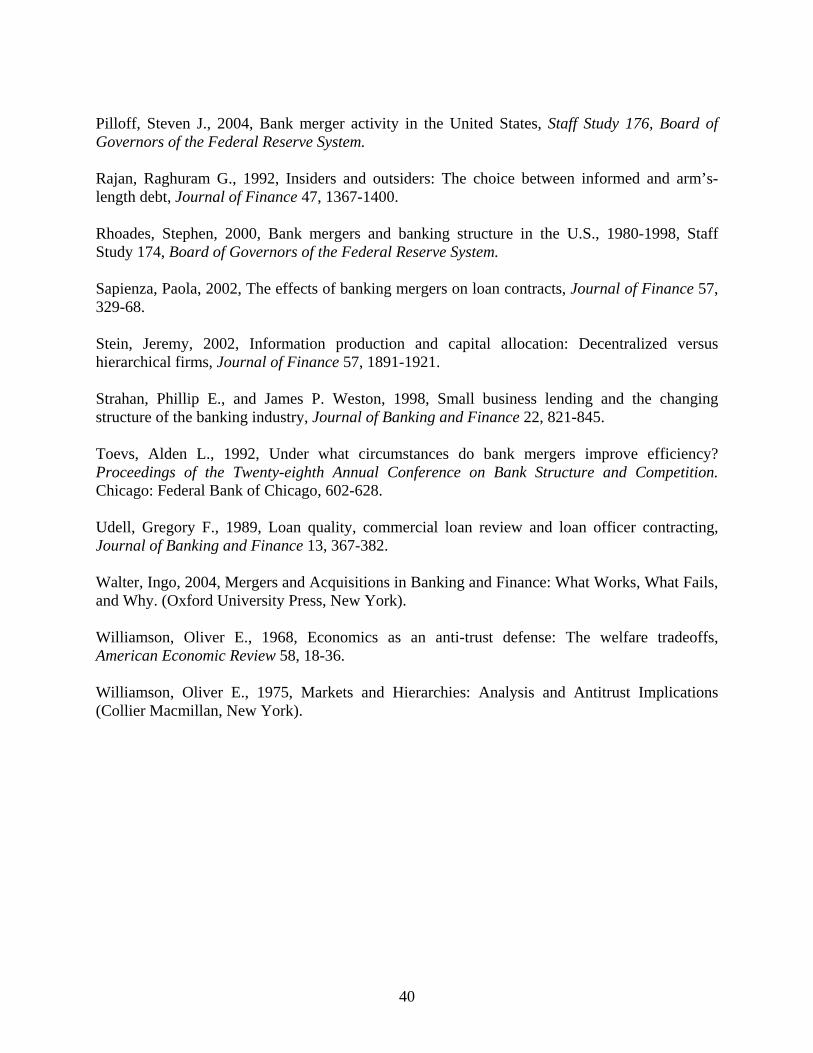
40
Pilloff, Steven J., 2004, Bank merger activity in the United States, Staff Study 176, Board of Governors of the Federal Reserve System. Rajan, Raghuram G., 1992, Insiders and outsiders: The choice between informed and arm’s-length debt, Journal of Finance 47, 1367-1400. Rhoades, Stephen, 2000, Bank mergers and banking structure in the U.S., 1980-1998, Staff Study 174, Board of Governors of the Federal Reserve System. Sapienza, Paola, 2002, The effects of banking mergers on loan contracts, Journal of Finance 57, 329-68. Stein, Jeremy, 2002, Information production and capital allocation: Decentralized versus hierarchical firms, Journal of Finance 57, 1891-1921. Strahan, Phillip E., and James P. Weston, 1998, Small business lending and the changing structure of the banking industry, Journal of Banking and Finance 22, 821-845. Toevs, Alden L., 1992, Under what circumstances do bank mergers improve efficiency? Proceedings of the Twenty-eighth Annual Conference on Bank Structure and Competition. Chicago: Federal Bank of Chicago, 602-628. Udell, Gregory F., 1989, Loan quality, commercial loan review and loan officer contracting, Journal of Banking and Finance 13, 367-382. Walter, Ingo, 2004, Mergers and Acquisitions in Banking and Finance: What Works, What Fails, and Why. (Oxford University Press, New York). Williamson, Oliver E., 1968, Economics as an anti-trust defense: The welfare tradeoffs, American Economic Review 58, 18-36. Williamson, Oliver E., 1975, Markets and Hierarchies: Analysis and Antitrust Implications (Collier Macmillan, New York).
Figure 1 – Part of Bank of America Family Tree (from Figure 32.1 in Brealey, Myers, and Allen (2006))
C&S Sovran
1991: $4.3 billion
Security Pacific
1991: $4.2 billion
First Gibraltar
1992: $7.5 billion
Continental
1994: $2.2 billion
Bank of America
BankSouth
1994: $1.6 billion 1996: $9.7 billion
Boatmen’s Bancshares Barnett Banks
1997: $14.8 billion
1998: $61.6 billion NationsBank Acquires Bank of AmericaKeeps Bank of America Name
Norstar Bancorp
1987: $1.3 billion 1991: bought out of bankruptcy; deal size N/A
Bank of New England NBB Bankcorp
1994: $420 million
1995: $3.9 billion
Shawmut National
2000: $7 billion
1999: $15.9 billion
Bank Boston
Summit Bankcorp 1995: $3.3 billion
NatWest Bancorp
2003: $49.2 billion Bank of America Acquires FleetBoston
Fleet Financial Group FleetBoston
Source: Thomson Financial SDC M&A Database
NationsBankNCNB Bank of America
Table I- Descriptive Statistics of Banks in Survey of Terms of Business Lending (STBL)
The descriptive statistics in Panel A refer to the entire sample of bank-quarters covered by Survey of Terms of Business Lending (STBL) from 1987 to 2003. Panels B and C list the summary statistics for the sample of acquirers in the STBL and their targets, as of one quarter before the merger. Total assets are gross total assets of the bank from Call Reports, and descriptive statistics refer to each bank-quarter. Sum of Total Assets is the quarterly sum of the gross total assets of STBL banks, and the ratio below this variable corresponds to this value expressed as a percentage of all banking assets in a given year. Total assets, total loans and total deposits are all expressed in 2003 dollars by using GDP price deflator. Capitalization is the ratio of equity to gross total assets. ROA is the net income over total assets at the end of the previous year. Non-performing Loans Ratio equals to the ratio of loans 90 days late plus loans not accruing, to the total loans.
PANEL A: All Banks in STBL
Mean Median Std. Dev. Minimum Maximum N of Obs.
Total Assets ($ million) 9,749 1,202 32,903 4.1 665,928 21,133 Sum of Total Assets ($ billion) 2,731 2,288 631.5 1,971 4,082 68 STBL Assets/ All Banks' Assets 0.53 0.52 0.03 0.46 0.6 68
Total Loans ($ million) 5,608 719 17,749 2 318,575 21,133 Sum of Total Loans ($ billion) 1,589 1,432 327.4 1,068 2,239 68 STBL Loans/ All Banks' Loans 0.52 0.52 0.03 0.44 0.58 68
Total Deposits ($ million) 6,582 977 20,884 3.9 381,235 21,133 Sum of Total Deposits ($ billion) 1,867 1,670 334 1,376 2,625 68 STBL Deposits/ All Banks' Deposits 0.50 0.49 0.04 0.43 0.58 68
Capitalization 0.08 0.08 0.028 0.0002 0.537 21,133 ROA 0.009 0.01 0.009 -0.18 0.0456 19,414 Non-Performing Loans Ratio 0.021 0.012 0.027 0 0.53 21,133 PANEL B: Acquirers in STBL
Mean Median Std. Dev. Minimum Maximum N of Obs. Total Assets ($ million) 16,014 6,100 24,922 145.3 177,083 263 Total Loans ($ million) 10,290 3,334 16,842 58.9 107,340 263 Total Deposits ($ million) 11,558 4,730 17,394 125.4 118,532 263 Capitalization 0.079 0.076 0.016 0.043 0.154 263 ROA 0.085 0.082 0.013 0.022 0.142 254 Non-Performing Loans Ratio 0.012 0.008 0.012 0.001 0.1 263 PANEL C: Targets of Acquirers in STBL
Mean Median Std. Dev. Minimum Maximum N of Obs. Total Assets ($ million) 1,419 184 5,738 13.4 43,642 333 Total Loans ($ million) 809 90.8 3,449 6.58 43,642 333 Total Deposits ($ million) 1,104 156 4,365 12.2 50,496 333 Capitalization 0.09 0.085 0.04 0.001 0.32 333 ROA 0.007 0.009 0.012 -0.18 0.05 321 Non-Performing Loans Ratio 0.015 0.009 0.019 0 0.13 333
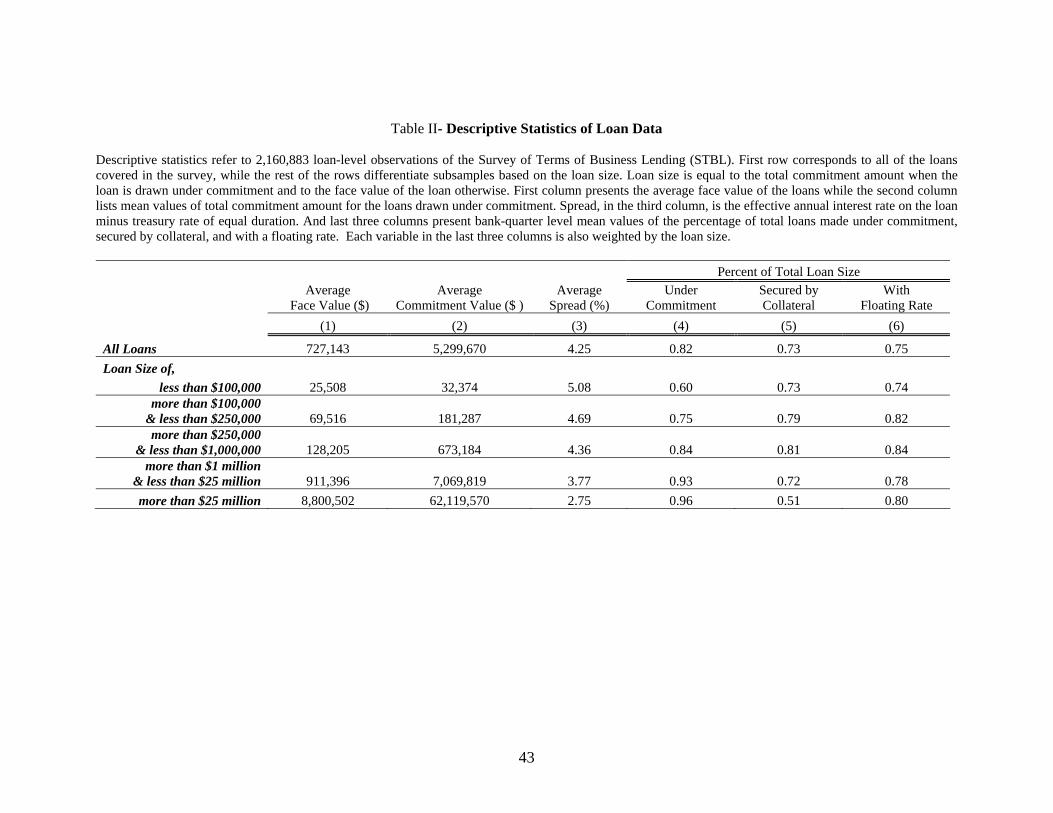
43
Table II- Descriptive Statistics of Loan Data
Descriptive statistics refer to 2,160,883 loan-level observations of the Survey of Terms of Business Lending (STBL). First row corresponds to all of the loans covered in the survey, while the rest of the rows differentiate subsamples based on the loan size. Loan size is equal to the total commitment amount when the loan is drawn under commitment and to the face value of the loan otherwise. First column presents the average face value of the loans while the second column lists mean values of total commitment amount for the loans drawn under commitment. Spread, in the third column, is the effective annual interest rate on the loan minus treasury rate of equal duration. And last three columns present bank-quarter level mean values of the percentage of total loans made under commitment, secured by collateral, and with a floating rate. Each variable in the last three columns is also weighted by the loan size.
Percent of Total Loan Size
Average
Face Value ($) Average
Commitment Value ($ ) Average
Spread (%) Under
Commitment Secured by Collateral
With Floating Rate
(1) (2) (3) (4) (5) (6)
All Loans 727,143 5,299,670 4.25 0.82 0.73 0.75 Loan Size of,
less than $100,000 25,508 32,374 5.08 0.60 0.73 0.74 more than $100,000
& less than $250,000 69,516 181,287 4.69 0.75 0.79 0.82 more than $250,000
& less than $1,000,000 128,205 673,184 4.36 0.84 0.81 0.84 more than $1 million
& less than $25 million 911,396 7,069,819 3.77 0.93 0.72 0.78 more than $25 million 8,800,502 62,119,570 2.75 0.96 0.51 0.80
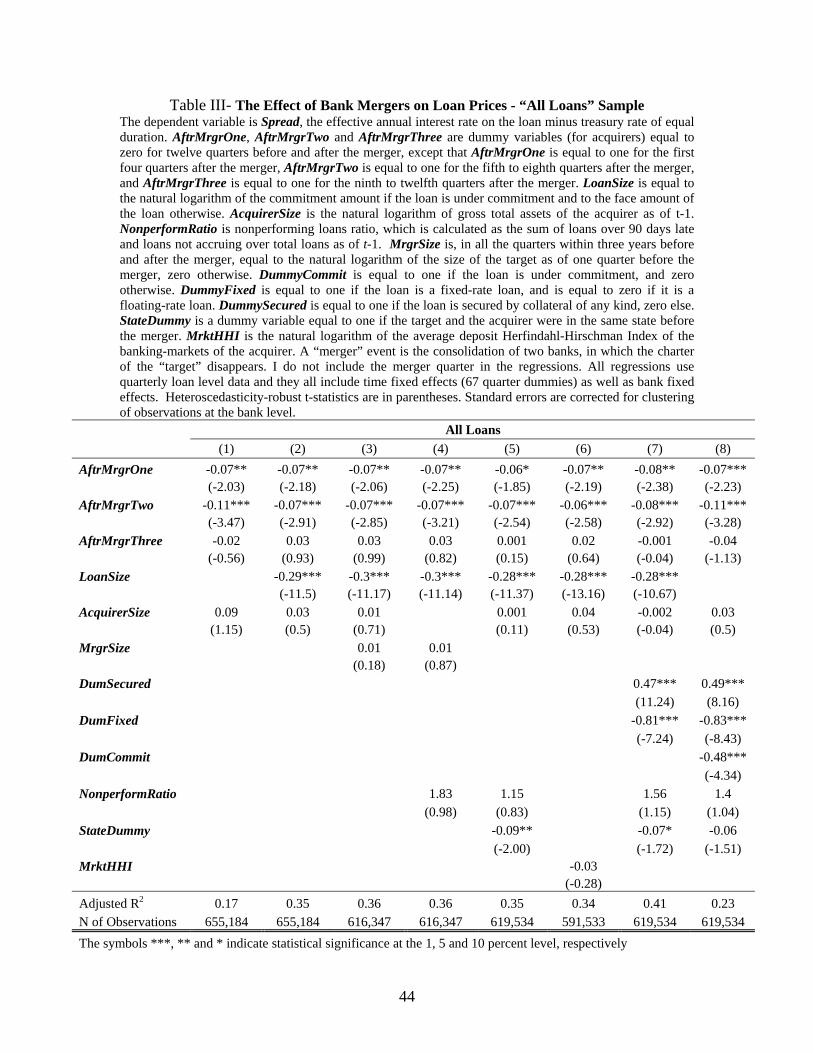
44
Table III- The Effect of Bank Mergers on Loan Prices - “All Loans” Sample The dependent variable is Spread, the effective annual interest rate on the loan minus treasury rate of equal duration. AftrMrgrOne, AftrMrgrTwo and AftrMrgrThree are dummy variables (for acquirers) equal to zero for twelve quarters before and after the merger, except that AftrMrgrOne is equal to one for the first four quarters after the merger, AftrMrgrTwo is equal to one for the fifth to eighth quarters after the merger, and AftrMrgrThree is equal to one for the ninth to twelfth quarters after the merger. LoanSize is equal to the natural logarithm of the commitment amount if the loan is under commitment and to the face amount of the loan otherwise. AcquirerSize is the natural logarithm of gross total assets of the acquirer as of t-1. NonperformRatio is nonperforming loans ratio, which is calculated as the sum of loans over 90 days late and loans not accruing over total loans as of t-1. MrgrSize is, in all the quarters within three years before and after the merger, equal to the natural logarithm of the size of the target as of one quarter before the merger, zero otherwise. DummyCommit is equal to one if the loan is under commitment, and zero otherwise. DummyFixed is equal to one if the loan is a fixed-rate loan, and is equal to zero if it is a floating-rate loan. DummySecured is equal to one if the loan is secured by collateral of any kind, zero else. StateDummy is a dummy variable equal to one if the target and the acquirer were in the same state before the merger. MrktHHI is the natural logarithm of the average deposit Herfindahl-Hirschman Index of the banking-markets of the acquirer. A “merger” event is the consolidation of two banks, in which the charter of the “target” disappears. I do not include the merger quarter in the regressions. All regressions use quarterly loan level data and they all include time fixed effects (67 quarter dummies) as well as bank fixed effects. Heteroscedasticity-robust t-statistics are in parentheses. Standard errors are corrected for clustering of observations at the bank level.
All Loans (1) (2) (3) (4) (5) (6) (7) (8)
AftrMrgrOne -0.07** -0.07** -0.07** -0.07** -0.06* -0.07** -0.08** -0.07*** (-2.03) (-2.18) (-2.06) (-2.25) (-1.85) (-2.19) (-2.38) (-2.23) AftrMrgrTwo -0.11*** -0.07*** -0.07*** -0.07*** -0.07*** -0.06*** -0.08*** -0.11*** (-3.47) (-2.91) (-2.85) (-3.21) (-2.54) (-2.58) (-2.92) (-3.28) AftrMrgrThree -0.02 0.03 0.03 0.03 0.001 0.02 -0.001 -0.04 (-0.56) (0.93) (0.99) (0.82) (0.15) (0.64) (-0.04) (-1.13) LoanSize -0.29*** -0.3*** -0.3*** -0.28*** -0.28*** -0.28*** (-11.5) (-11.17) (-11.14) (-11.37) (-13.16) (-10.67) AcquirerSize 0.09 0.03 0.01 0.001 0.04 -0.002 0.03 (1.15) (0.5) (0.71) (0.11) (0.53) (-0.04) (0.5) MrgrSize 0.01 0.01 (0.18) (0.87) DumSecured 0.47*** 0.49*** (11.24) (8.16) DumFixed -0.81*** -0.83*** (-7.24) (-8.43) DumCommit -0.48*** (-4.34) NonperformRatio 1.83 1.15 1.56 1.4 (0.98) (0.83) (1.15) (1.04) StateDummy -0.09** -0.07* -0.06 (-2.00) (-1.72) (-1.51) MrktHHI -0.03 (-0.28) Adjusted R2 0.17 0.35 0.36 0.36 0.35 0.34 0.41 0.23 N of Observations 655,184 655,184 616,347 616,347 619,534 591,533 619,534 619,534 The symbols ***, ** and * indicate statistical significance at the 1, 5 and 10 percent level, respectively
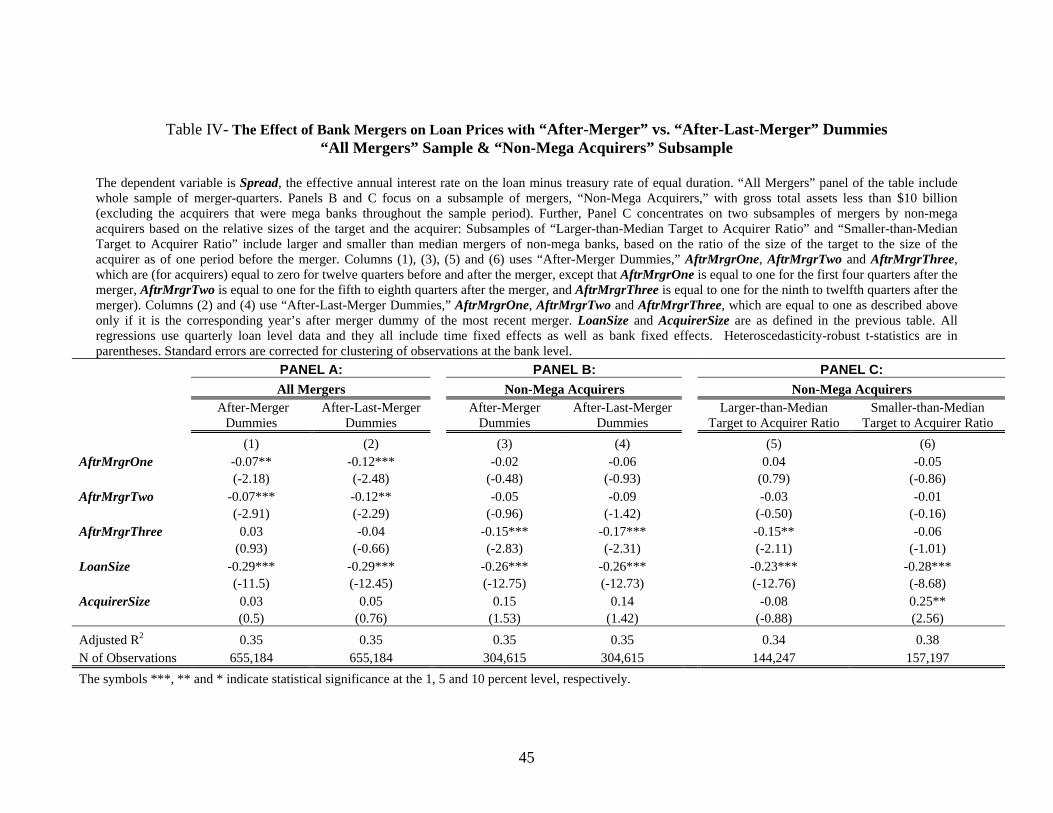
45
Table IV- The Effect of Bank Mergers on Loan Prices with “After-Merger” vs. “After-Last-Merger” Dummies “All Mergers” Sample & “Non-Mega Acquirers” Subsample
The dependent variable is Spread, the effective annual interest rate on the loan minus treasury rate of equal duration. “All Mergers” panel of the table include whole sample of merger-quarters. Panels B and C focus on a subsample of mergers, “Non-Mega Acquirers,” with gross total assets less than $10 billion (excluding the acquirers that were mega banks throughout the sample period). Further, Panel C concentrates on two subsamples of mergers by non-mega acquirers based on the relative sizes of the target and the acquirer: Subsamples of “Larger-than-Median Target to Acquirer Ratio” and “Smaller-than-Median Target to Acquirer Ratio” include larger and smaller than median mergers of non-mega banks, based on the ratio of the size of the target to the size of the acquirer as of one period before the merger. Columns (1), (3), (5) and (6) uses “After-Merger Dummies,” AftrMrgrOne, AftrMrgrTwo and AftrMrgrThree, which are (for acquirers) equal to zero for twelve quarters before and after the merger, except that AftrMrgrOne is equal to one for the first four quarters after the merger, AftrMrgrTwo is equal to one for the fifth to eighth quarters after the merger, and AftrMrgrThree is equal to one for the ninth to twelfth quarters after the merger). Columns (2) and (4) use “After-Last-Merger Dummies,” AftrMrgrOne, AftrMrgrTwo and AftrMrgrThree, which are equal to one as described above only if it is the corresponding year’s after merger dummy of the most recent merger. LoanSize and AcquirerSize are as defined in the previous table. All regressions use quarterly loan level data and they all include time fixed effects as well as bank fixed effects. Heteroscedasticity-robust t-statistics are in parentheses. Standard errors are corrected for clustering of observations at the bank level.
PANEL A: PANEL B: PANEL C: All Mergers Non-Mega Acquirers Non-Mega Acquirers
After-Merger
Dummies After-Last-Merger
Dummies After-Merger
Dummies After-Last-Merger
Dummies Larger-than-Median
Target to Acquirer Ratio Smaller-than-Median
Target to Acquirer Ratio (1) (2) (3) (4) (5) (6) AftrMrgrOne -0.07** -0.12*** -0.02 -0.06 0.04 -0.05 (-2.18) (-2.48) (-0.48) (-0.93) (0.79) (-0.86) AftrMrgrTwo -0.07*** -0.12** -0.05 -0.09 -0.03 -0.01 (-2.91) (-2.29) (-0.96) (-1.42) (-0.50) (-0.16) AftrMrgrThree 0.03 -0.04 -0.15*** -0.17*** -0.15** -0.06 (0.93) (-0.66) (-2.83) (-2.31) (-2.11) (-1.01) LoanSize -0.29*** -0.29*** -0.26*** -0.26*** -0.23*** -0.28*** (-11.5) (-12.45) (-12.75) (-12.73) (-12.76) (-8.68) AcquirerSize 0.03 0.05 0.15 0.14 -0.08 0.25** (0.5) (0.76) (1.53) (1.42) (-0.88) (2.56) Adjusted R2 0.35 0.35 0.35 0.35 0.34 0.38 N of Observations 655,184 655,184 304,615 304,615 144,247 157,197 The symbols ***, ** and * indicate statistical significance at the 1, 5 and 10 percent level, respectively.
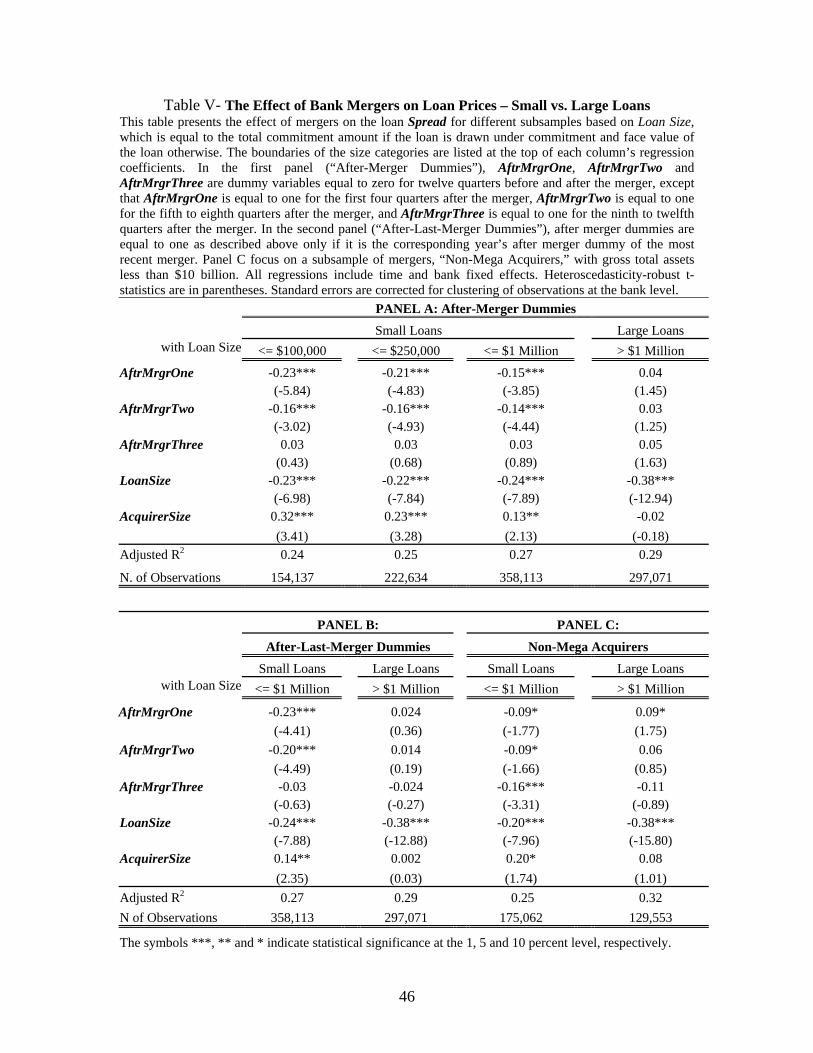
46
Table V- The Effect of Bank Mergers on Loan Prices – Small vs. Large Loans This table presents the effect of mergers on the loan Spread for different subsamples based on Loan Size, which is equal to the total commitment amount if the loan is drawn under commitment and face value of the loan otherwise. The boundaries of the size categories are listed at the top of each column’s regression coefficients. In the first panel (“After-Merger Dummies”), AftrMrgrOne, AftrMrgrTwo and AftrMrgrThree are dummy variables equal to zero for twelve quarters before and after the merger, except that AftrMrgrOne is equal to one for the first four quarters after the merger, AftrMrgrTwo is equal to one for the fifth to eighth quarters after the merger, and AftrMrgrThree is equal to one for the ninth to twelfth quarters after the merger. In the second panel (“After-Last-Merger Dummies”), after merger dummies are equal to one as described above only if it is the corresponding year’s after merger dummy of the most recent merger. Panel C focus on a subsample of mergers, “Non-Mega Acquirers,” with gross total assets less than $10 billion. All regressions include time and bank fixed effects. Heteroscedasticity-robust t-statistics are in parentheses. Standard errors are corrected for clustering of observations at the bank level. PANEL A: After-Merger Dummies
Small Loans Large Loans with Loan Size <= $100,000 <= $250,000 <= $1 Million > $1 Million
AftrMrgrOne -0.23*** -0.21*** -0.15*** 0.04 (-5.84) (-4.83) (-3.85) (1.45) AftrMrgrTwo -0.16*** -0.16*** -0.14*** 0.03 (-3.02) (-4.93) (-4.44) (1.25) AftrMrgrThree 0.03 0.03 0.03 0.05 (0.43) (0.68) (0.89) (1.63) LoanSize -0.23*** -0.22*** -0.24*** -0.38*** (-6.98) (-7.84) (-7.89) (-12.94) AcquirerSize 0.32*** 0.23*** 0.13** -0.02 (3.41) (3.28) (2.13) (-0.18) Adjusted R2 0.24 0.25 0.27 0.29
N. of Observations 154,137 222,634 358,113 297,071
PANEL B: PANEL C:
After-Last-Merger Dummies Non-Mega Acquirers Small Loans Large Loans Small Loans Large Loans
with Loan Size <= $1 Million > $1 Million <= $1 Million > $1 Million
AftrMrgrOne -0.23*** 0.024 -0.09* 0.09* (-4.41) (0.36) (-1.77) (1.75) AftrMrgrTwo -0.20*** 0.014 -0.09* 0.06 (-4.49) (0.19) (-1.66) (0.85) AftrMrgrThree -0.03 -0.024 -0.16*** -0.11 (-0.63) (-0.27) (-3.31) (-0.89) LoanSize -0.24*** -0.38*** -0.20*** -0.38*** (-7.88) (-12.88) (-7.96) (-15.80) AcquirerSize 0.14** 0.002 0.20* 0.08 (2.35) (0.03) (1.74) (1.01) Adjusted R2 0.27 0.29 0.25 0.32 N of Observations 358,113 297,071 175,062 129,553
The symbols ***, ** and * indicate statistical significance at the 1, 5 and 10 percent level, respectively.
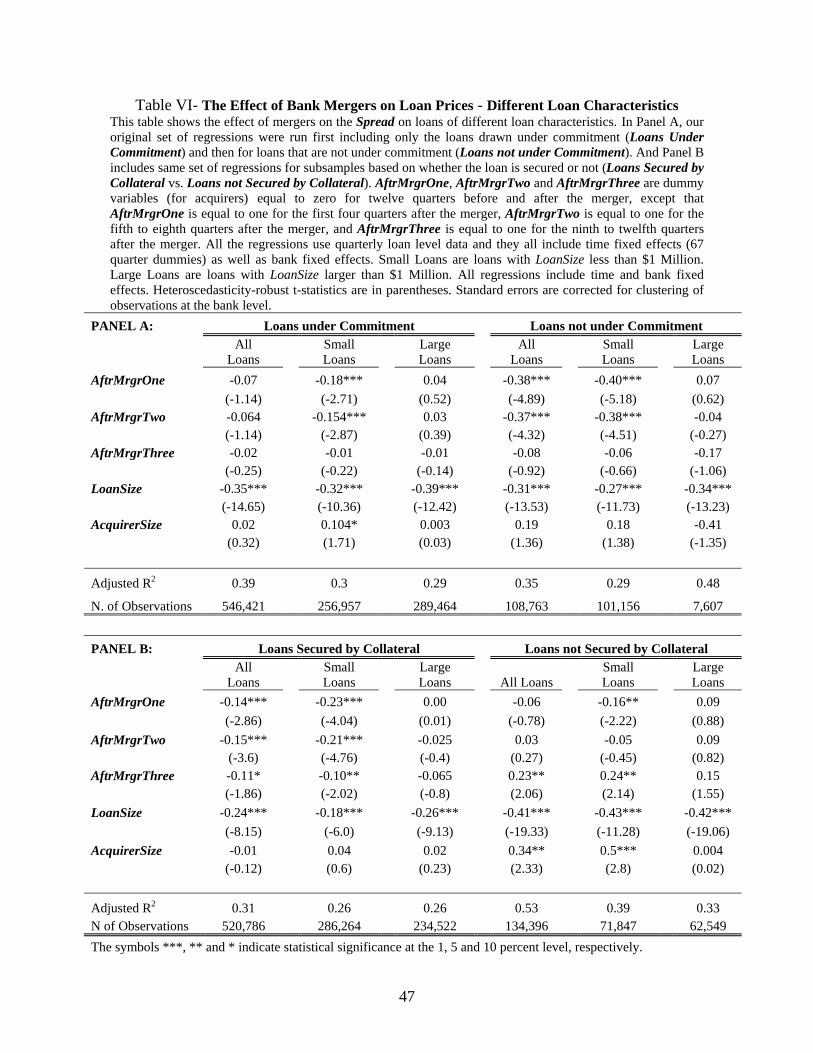
47
Table VI- The Effect of Bank Mergers on Loan Prices - Different Loan Characteristics This table shows the effect of mergers on the Spread on loans of different loan characteristics. In Panel A, our original set of regressions were run first including only the loans drawn under commitment (Loans Under Commitment) and then for loans that are not under commitment (Loans not under Commitment). And Panel B includes same set of regressions for subsamples based on whether the loan is secured or not (Loans Secured by Collateral vs. Loans not Secured by Collateral). AftrMrgrOne, AftrMrgrTwo and AftrMrgrThree are dummy variables (for acquirers) equal to zero for twelve quarters before and after the merger, except that AftrMrgrOne is equal to one for the first four quarters after the merger, AftrMrgrTwo is equal to one for the fifth to eighth quarters after the merger, and AftrMrgrThree is equal to one for the ninth to twelfth quarters after the merger. All the regressions use quarterly loan level data and they all include time fixed effects (67 quarter dummies) as well as bank fixed effects. Small Loans are loans with LoanSize less than $1 Million. Large Loans are loans with LoanSize larger than $1 Million. All regressions include time and bank fixed effects. Heteroscedasticity-robust t-statistics are in parentheses. Standard errors are corrected for clustering of observations at the bank level.
PANEL A: Loans under Commitment Loans not under Commitment
All
Loans Small Loans
Large Loans
All Loans
Small Loans
Large Loans
AftrMrgrOne -0.07 -0.18*** 0.04 -0.38*** -0.40*** 0.07 (-1.14) (-2.71) (0.52) (-4.89) (-5.18) (0.62) AftrMrgrTwo -0.064 -0.154*** 0.03 -0.37*** -0.38*** -0.04 (-1.14) (-2.87) (0.39) (-4.32) (-4.51) (-0.27) AftrMrgrThree -0.02 -0.01 -0.01 -0.08 -0.06 -0.17 (-0.25) (-0.22) (-0.14) (-0.92) (-0.66) (-1.06) LoanSize -0.35*** -0.32*** -0.39*** -0.31*** -0.27*** -0.34*** (-14.65) (-10.36) (-12.42) (-13.53) (-11.73) (-13.23) AcquirerSize 0.02 0.104* 0.003 0.19 0.18 -0.41 (0.32) (1.71) (0.03) (1.36) (1.38) (-1.35)
Adjusted R2 0.39 0.3 0.29 0.35 0.29 0.48
N. of Observations 546,421 256,957 289,464 108,763 101,156 7,607
PANEL B: Loans Secured by Collateral Loans not Secured by Collateral
All
Loans Small Loans
Large Loans All Loans
Small Loans
Large Loans
AftrMrgrOne -0.14*** -0.23*** 0.00 -0.06 -0.16** 0.09 (-2.86) (-4.04) (0.01) (-0.78) (-2.22) (0.88) AftrMrgrTwo -0.15*** -0.21*** -0.025 0.03 -0.05 0.09 (-3.6) (-4.76) (-0.4) (0.27) (-0.45) (0.82) AftrMrgrThree -0.11* -0.10** -0.065 0.23** 0.24** 0.15 (-1.86) (-2.02) (-0.8) (2.06) (2.14) (1.55) LoanSize -0.24*** -0.18*** -0.26*** -0.41*** -0.43*** -0.42*** (-8.15) (-6.0) (-9.13) (-19.33) (-11.28) (-19.06) AcquirerSize -0.01 0.04 0.02 0.34** 0.5*** 0.004 (-0.12) (0.6) (0.23) (2.33) (2.8) (0.02)
Adjusted R2 0.31 0.26 0.26 0.53 0.39 0.33 N of Observations 520,786 286,264 234,522 134,396 71,847 62,549 The symbols ***, ** and * indicate statistical significance at the 1, 5 and 10 percent level, respectively.
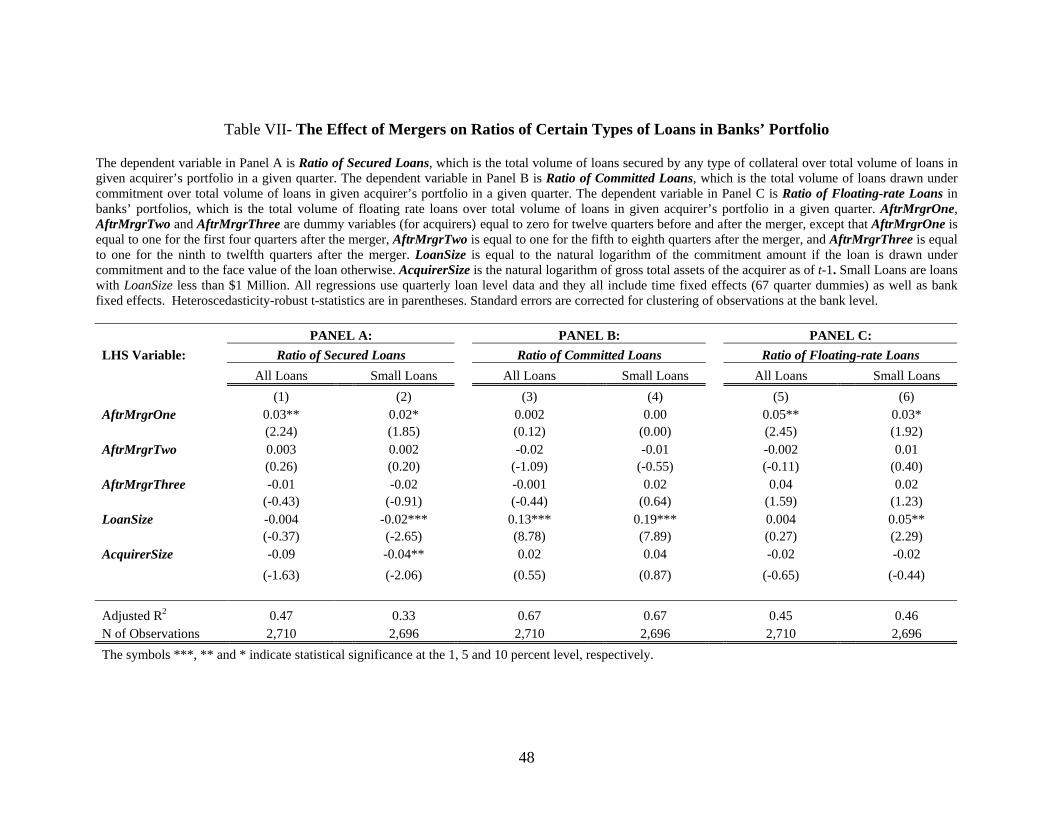
48
Table VII- The Effect of Mergers on Ratios of Certain Types of Loans in Banks’ Portfolio
The dependent variable in Panel A is Ratio of Secured Loans, which is the total volume of loans secured by any type of collateral over total volume of loans in given acquirer’s portfolio in a given quarter. The dependent variable in Panel B is Ratio of Committed Loans, which is the total volume of loans drawn under commitment over total volume of loans in given acquirer’s portfolio in a given quarter. The dependent variable in Panel C is Ratio of Floating-rate Loans in banks’ portfolios, which is the total volume of floating rate loans over total volume of loans in given acquirer’s portfolio in a given quarter. AftrMrgrOne, AftrMrgrTwo and AftrMrgrThree are dummy variables (for acquirers) equal to zero for twelve quarters before and after the merger, except that AftrMrgrOne is equal to one for the first four quarters after the merger, AftrMrgrTwo is equal to one for the fifth to eighth quarters after the merger, and AftrMrgrThree is equal to one for the ninth to twelfth quarters after the merger. LoanSize is equal to the natural logarithm of the commitment amount if the loan is drawn under commitment and to the face value of the loan otherwise. AcquirerSize is the natural logarithm of gross total assets of the acquirer as of t-1. Small Loans are loans with LoanSize less than $1 Million. All regressions use quarterly loan level data and they all include time fixed effects (67 quarter dummies) as well as bank fixed effects. Heteroscedasticity-robust t-statistics are in parentheses. Standard errors are corrected for clustering of observations at the bank level. PANEL A: PANEL B: PANEL C: LHS Variable: Ratio of Secured Loans Ratio of Committed Loans Ratio of Floating-rate Loans All Loans Small Loans All Loans Small Loans All Loans Small Loans (1) (2) (3) (4) (5) (6) AftrMrgrOne 0.03** 0.02* 0.002 0.00 0.05** 0.03* (2.24) (1.85) (0.12) (0.00) (2.45) (1.92) AftrMrgrTwo 0.003 0.002 -0.02 -0.01 -0.002 0.01 (0.26) (0.20) (-1.09) (-0.55) (-0.11) (0.40) AftrMrgrThree -0.01 -0.02 -0.001 0.02 0.04 0.02 (-0.43) (-0.91) (-0.44) (0.64) (1.59) (1.23) LoanSize -0.004 -0.02*** 0.13*** 0.19*** 0.004 0.05** (-0.37) (-2.65) (8.78) (7.89) (0.27) (2.29) AcquirerSize -0.09 -0.04** 0.02 0.04 -0.02 -0.02 (-1.63) (-2.06) (0.55) (0.87) (-0.65) (-0.44)
Adjusted R2 0.47 0.33 0.67 0.67 0.45 0.46 N of Observations 2,710 2,696 2,710 2,696 2,710 2,696 The symbols ***, ** and * indicate statistical significance at the 1, 5 and 10 percent level, respectively.
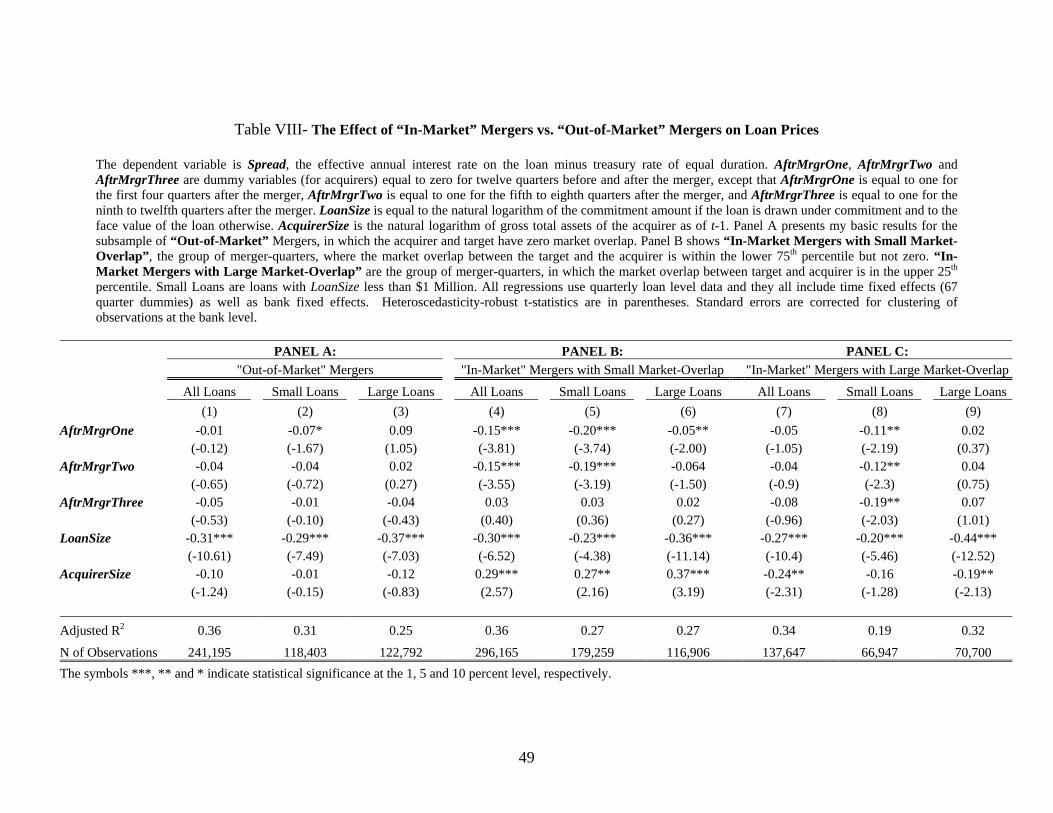
49
Table VIII- The Effect of “In-Market” Mergers vs. “Out-of-Market” Mergers on Loan Prices
The dependent variable is Spread, the effective annual interest rate on the loan minus treasury rate of equal duration. AftrMrgrOne, AftrMrgrTwo and AftrMrgrThree are dummy variables (for acquirers) equal to zero for twelve quarters before and after the merger, except that AftrMrgrOne is equal to one for the first four quarters after the merger, AftrMrgrTwo is equal to one for the fifth to eighth quarters after the merger, and AftrMrgrThree is equal to one for the ninth to twelfth quarters after the merger. LoanSize is equal to the natural logarithm of the commitment amount if the loan is drawn under commitment and to the face value of the loan otherwise. AcquirerSize is the natural logarithm of gross total assets of the acquirer as of t-1. Panel A presents my basic results for the subsample of “Out-of-Market” Mergers, in which the acquirer and target have zero market overlap. Panel B shows “In-Market Mergers with Small Market-Overlap”, the group of merger-quarters, where the market overlap between the target and the acquirer is within the lower 75th percentile but not zero. “In-Market Mergers with Large Market-Overlap” are the group of merger-quarters, in which the market overlap between target and acquirer is in the upper 25th percentile. Small Loans are loans with LoanSize less than $1 Million. All regressions use quarterly loan level data and they all include time fixed effects (67 quarter dummies) as well as bank fixed effects. Heteroscedasticity-robust t-statistics are in parentheses. Standard errors are corrected for clustering of observations at the bank level.
PANEL A: PANEL B: PANEL C: "Out-of-Market" Mergers "In-Market" Mergers with Small Market-Overlap "In-Market" Mergers with Large Market-Overlap
All Loans Small Loans Large Loans All Loans Small Loans Large Loans All Loans Small Loans Large Loans (1) (2) (3) (4) (5) (6) (7) (8) (9) AftrMrgrOne -0.01 -0.07* 0.09 -0.15*** -0.20*** -0.05** -0.05 -0.11** 0.02 (-0.12) (-1.67) (1.05) (-3.81) (-3.74) (-2.00) (-1.05) (-2.19) (0.37) AftrMrgrTwo -0.04 -0.04 0.02 -0.15*** -0.19*** -0.064 -0.04 -0.12** 0.04 (-0.65) (-0.72) (0.27) (-3.55) (-3.19) (-1.50) (-0.9) (-2.3) (0.75) AftrMrgrThree -0.05 -0.01 -0.04 0.03 0.03 0.02 -0.08 -0.19** 0.07 (-0.53) (-0.10) (-0.43) (0.40) (0.36) (0.27) (-0.96) (-2.03) (1.01) LoanSize -0.31*** -0.29*** -0.37*** -0.30*** -0.23*** -0.36*** -0.27*** -0.20*** -0.44*** (-10.61) (-7.49) (-7.03) (-6.52) (-4.38) (-11.14) (-10.4) (-5.46) (-12.52) AcquirerSize -0.10 -0.01 -0.12 0.29*** 0.27** 0.37*** -0.24** -0.16 -0.19** (-1.24) (-0.15) (-0.83) (2.57) (2.16) (3.19) (-2.31) (-1.28) (-2.13) Adjusted R2 0.36 0.31 0.25 0.36 0.27 0.27 0.34 0.19 0.32
N of Observations 241,195 118,403 122,792 296,165 179,259 116,906 137,647 66,947 70,700 The symbols ***, ** and * indicate statistical significance at the 1, 5 and 10 percent level, respectively.
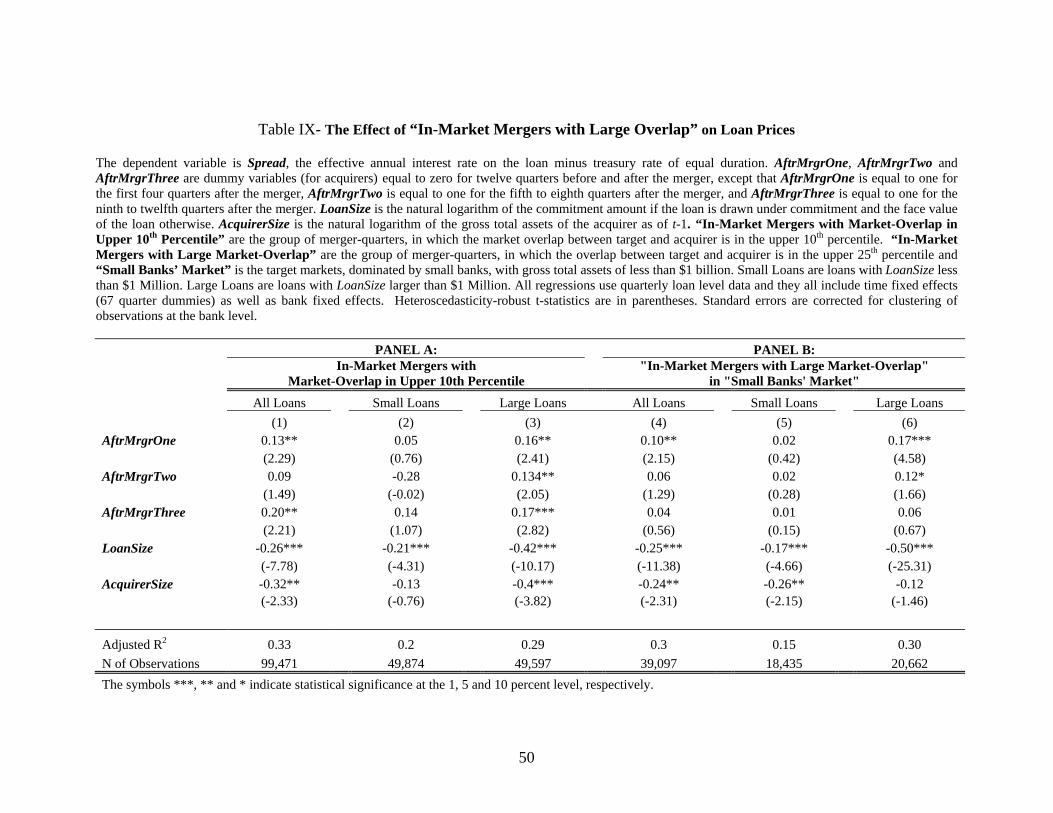
50
Table IX- The Effect of “In-Market Mergers with Large Overlap” on Loan Prices The dependent variable is Spread, the effective annual interest rate on the loan minus treasury rate of equal duration. AftrMrgrOne, AftrMrgrTwo and AftrMrgrThree are dummy variables (for acquirers) equal to zero for twelve quarters before and after the merger, except that AftrMrgrOne is equal to one for the first four quarters after the merger, AftrMrgrTwo is equal to one for the fifth to eighth quarters after the merger, and AftrMrgrThree is equal to one for the ninth to twelfth quarters after the merger. LoanSize is the natural logarithm of the commitment amount if the loan is drawn under commitment and the face value of the loan otherwise. AcquirerSize is the natural logarithm of the gross total assets of the acquirer as of t-1. “In-Market Mergers with Market-Overlap in Upper 10th Percentile” are the group of merger-quarters, in which the market overlap between target and acquirer is in the upper 10th percentile. “In-Market Mergers with Large Market-Overlap” are the group of merger-quarters, in which the overlap between target and acquirer is in the upper 25th percentile and “Small Banks’ Market” is the target markets, dominated by small banks, with gross total assets of less than $1 billion. Small Loans are loans with LoanSize less than $1 Million. Large Loans are loans with LoanSize larger than $1 Million. All regressions use quarterly loan level data and they all include time fixed effects (67 quarter dummies) as well as bank fixed effects. Heteroscedasticity-robust t-statistics are in parentheses. Standard errors are corrected for clustering of observations at the bank level. PANEL A: PANEL B:
In-Market Mergers with
Market-Overlap in Upper 10th Percentile "In-Market Mergers with Large Market-Overlap"
in "Small Banks' Market" All Loans Small Loans Large Loans All Loans Small Loans Large Loans (1) (2) (3) (4) (5) (6)
AftrMrgrOne 0.13** 0.05 0.16** 0.10** 0.02 0.17*** (2.29) (0.76) (2.41) (2.15) (0.42) (4.58) AftrMrgrTwo 0.09 -0.28 0.134** 0.06 0.02 0.12* (1.49) (-0.02) (2.05) (1.29) (0.28) (1.66) AftrMrgrThree 0.20** 0.14 0.17*** 0.04 0.01 0.06 (2.21) (1.07) (2.82) (0.56) (0.15) (0.67) LoanSize -0.26*** -0.21*** -0.42*** -0.25*** -0.17*** -0.50*** (-7.78) (-4.31) (-10.17) (-11.38) (-4.66) (-25.31) AcquirerSize -0.32** -0.13 -0.4*** -0.24** -0.26** -0.12 (-2.33) (-0.76) (-3.82) (-2.31) (-2.15) (-1.46)
Adjusted R2 0.33 0.2 0.29 0.3 0.15 0.30 N of Observations 99,471 49,874 49,597 39,097 18,435 20,662 The symbols ***, ** and * indicate statistical significance at the 1, 5 and 10 percent level, respectively.

51
Table X- The Effect of “Out-of-Market” Mergers on Loan Prices - Incorporating the Targets’ Market Structure
The dependent variable is Spread, the effective annual interest rate on the loan minus treasury rate of equal duration. AftrMrgrOne, AftrMrgrTwo and AftrMrgrThree are dummy variables (for acquirers) equal to zero for twelve quarters before and after the merger, except that AftrMrgrOne is equal to one for the first four quarters after the merger, AftrMrgrTwo is equal to one for the fifth to eighth quarters after the merger, and AftrMrgrThree is equal to one for the ninth to twelfth quarters after the merger. LoanSize is the natural logarithm of the commitment amount if the loan is drawn under commitment and the face value of the loan otherwise. AcquirerSize is the natural logarithm of gross total assets of the acquirer as of t-1. “Out-of-Market” mergers are market extension mergers where the acquirer and target have zero market overlap before the merger. Panel A shows the results for the subsample of out-of-market mergers into “Large Banks' Market”, where target’s markets were dominated by large banks, with gross total assets of at least $1 billion. The regression results of mergers into “Small Banks’ Market”, the target markets dominated by small banks with gross total assets of less than $1 billion, are shown in Panel B. Small Loans are loans with LoanSize less than $1 Million. Large Loans are loans with LoanSize larger than $1 Million. All regressions use quarterly loan level data and they all include time fixed effects (67 quarter dummies) as well as bank fixed effects. Heteroscedasticity-robust t-statistics are in parentheses. Standard errors are corrected for clustering of observations at the bank level.
PANEL A: PANEL B: "Out-of-Market" Mergers into Large Banks' Market "Out-of-Market" Mergers into Small Banks' Market
All Loans Small Loans Large Loans All Loans Small Loans Large Loans (1) (2) (3) (4) (5) (6) AftrMrgrOne -0.14** -0.07 -0.19*** 0.04 -0.003 0.13 (-2.17) (-1.38) (-3.11) (0.49) (-0.03) (1.37) AftrMrgrTwo -0.07 -0.04 -0.09 -0.05 -0.10 0.06 (-0.81) (-0.56) (-1.18) (-1.04) (-1.48) (0.70) AftrMrgrThree -0.12 -0.02 -0.20 -0.003 0.06 -0.05 (-0.65) (-0.17) (-1.14) (-0.05) (1.36) (-0.42) LoanSize -0.33*** -0.44*** 0.28*** -0.26*** -0.24*** -0.31*** (-9.4) (-8.11) (-5.64) (-7.69) (-8.25) (-2.53) AcquirerSize -0.08 -0.02 -0.03 -0.27* -0.02 -0.36* (-0.54) (-0.17) (-0.20) (-1.66) (-0.17) (-1.82)
Adjusted R2 0.45 0.31 0.38 0.22 0.18 0.19 N of Observations 92,651 46,438 46,213 124,537 67,671 56,866
The symbols ***, ** and * indicate statistical significance at the 1, 5 and 10 percent level, respectively.

52
Table XI- Operating Efficiencies
The dependent variable is Spread, the effective annual interest rate on the loan minus treasury rate of equal duration. AftrMrgrOne, AftrMrgrTwo and AftrMrgrThree are dummy variables (for acquirers) equal to zero for twelve quarters before and after the merger, except that AftrMrgrOne is equal to one for the first four quarters after the merger, AftrMrgrTwo is equal to one for the fifth to eighth quarters after the merger, and AftrMrgrThree is equal to one for the ninth to twelfth quarters after the merger. LoanSize is the natural logarithm of the commitment amount if the loan is drawn under commitment and the face value of the loan otherwise. AcquirerSize is the natural logarithm of the gross total assets of the acquirer as of t-1. This table is constructed by comparing the operating-cost ratio (operating expense over operating income) of the acquirer as of the second year end after the merger to the operating-cost ratio of the pro-forma bank (target plus acquirer as of the year end before the merger). Panel A covers the mergers, after which “Cost Ratio Declined More than Median” decline in operating cost ratio among all the mergers in the sample. Panel B shows the regression results for the mergers, after which “Cost Ratio Declined Less than Median” decline in operating cost ratio among all the mergers in the sample. Small Loans are loans with LoanSize less than $1 Million. Large Loans are loans with LoanSize larger than $1 Million. All regressions use quarterly loan level data and they all include time fixed effects (67 quarter dummies) as well as bank fixed effects. Heteroscedasticity-robust t-statistics are in parentheses. Standard errors are corrected for clustering of observations at the bank level. PANEL A: PANEL B: Mergers after which Operating Cost Ratio Declined More than Median vs. Operating Cost Ratio Declined Less than Median
All Loans Small Loans Large Loans All Loans Small Loans Large Loans (1) (2) (3) (4) (5) (6)
AftrMrgrOne -0.174*** -0.22*** -0.14*** 0.03 -0.01 0.10 (-5.16) (-4.49) (-3.23) (0.54) (-0.17) (1.33) AftrMrgrTwo -0.164*** -0.18*** -0.19*** -0.10* -0.08** -0.08 (-3.14) (-3.04) (-3.26) (-1.89) (-1.96) (-1.56) AftrMrgrThree -0.11* -0.07 -0.22** 0.024 0.08 0.00 (-1.95) (-1.01) (-2.29) (0.25) (0.98) (0.01) LoanSize -0.30*** -0.23*** -0.39*** -0.28*** -0.23*** -0.36*** (-6.51) (-3.87) (-16.84) (-11.62) (-9.41) (-5.58) AcquirerSize 0.07 0.10 0.16** -0.034 0.13 -0.10 (1.17) (1.23) (2.27) (-0.33) (1.53) (-0.81)
Adjusted R2 0.36 0.27 0.28 0.33 0.25 0.26 N of Observations 327,874 180,861 147,013 290,963 165,857 125,106 The symbols ***, ** and * indicate statistical significance at the 1, 5 and 10 percent level, respectively.
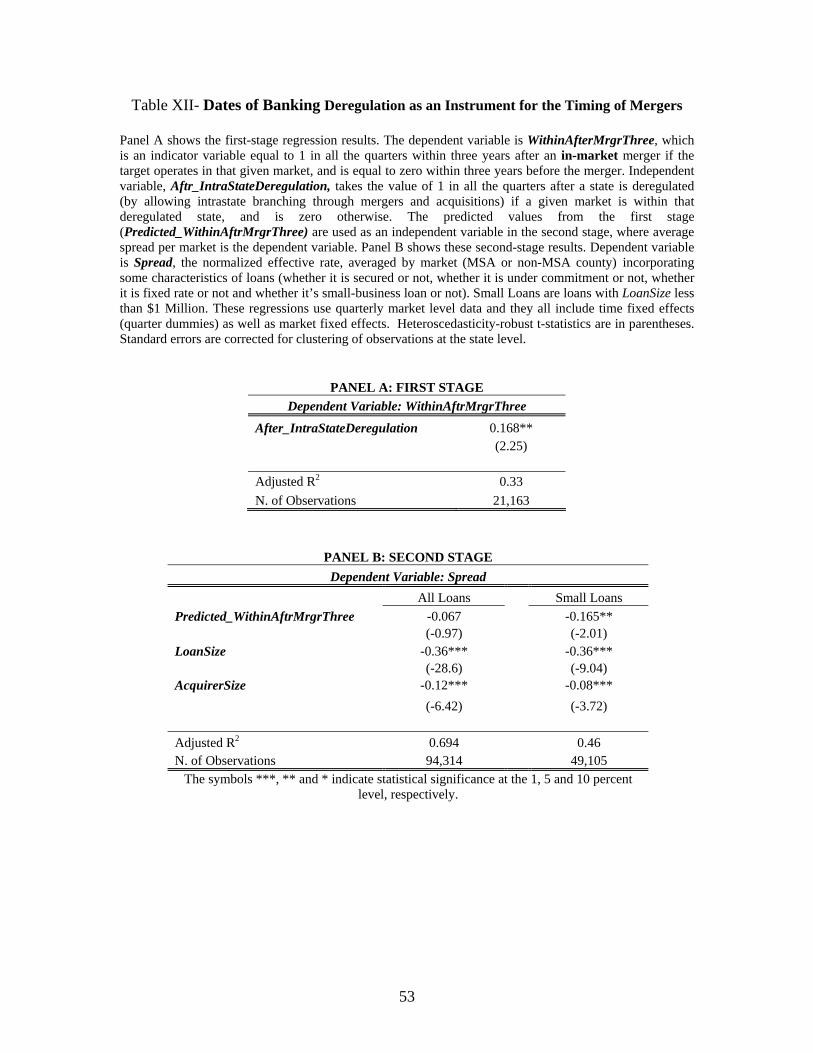
53
Table XII- Dates of Banking Deregulation as an Instrument for the Timing of Mergers
Panel A shows the first-stage regression results. The dependent variable is WithinAfterMrgrThree, which is an indicator variable equal to 1 in all the quarters within three years after an in-market merger if the target operates in that given market, and is equal to zero within three years before the merger. Independent variable, Aftr_IntraStateDeregulation, takes the value of 1 in all the quarters after a state is deregulated (by allowing intrastate branching through mergers and acquisitions) if a given market is within that deregulated state, and is zero otherwise. The predicted values from the first stage (Predicted_WithinAftrMrgrThree) are used as an independent variable in the second stage, where average spread per market is the dependent variable. Panel B shows these second-stage results. Dependent variable is Spread, the normalized effective rate, averaged by market (MSA or non-MSA county) incorporating some characteristics of loans (whether it is secured or not, whether it is under commitment or not, whether it is fixed rate or not and whether it’s small-business loan or not). Small Loans are loans with LoanSize less than $1 Million. These regressions use quarterly market level data and they all include time fixed effects (quarter dummies) as well as market fixed effects. Heteroscedasticity-robust t-statistics are in parentheses. Standard errors are corrected for clustering of observations at the state level.
PANEL A: FIRST STAGE Dependent Variable: WithinAftrMrgrThree
After_IntraStateDeregulation 0.168** (2.25) Adjusted R2 0.33 N. of Observations 21,163
PANEL B: SECOND STAGE Dependent Variable: Spread
All Loans Small Loans Predicted_WithinAftrMrgrThree -0.067 -0.165** (-0.97) (-2.01) LoanSize -0.36*** -0.36*** (-28.6) (-9.04) AcquirerSize -0.12*** -0.08***
(-6.42) (-3.72)
Adjusted R2 0.694 0.46 N. of Observations 94,314 49,105
The symbols ***, ** and * indicate statistical significance at the 1, 5 and 10 percent level, respectively.
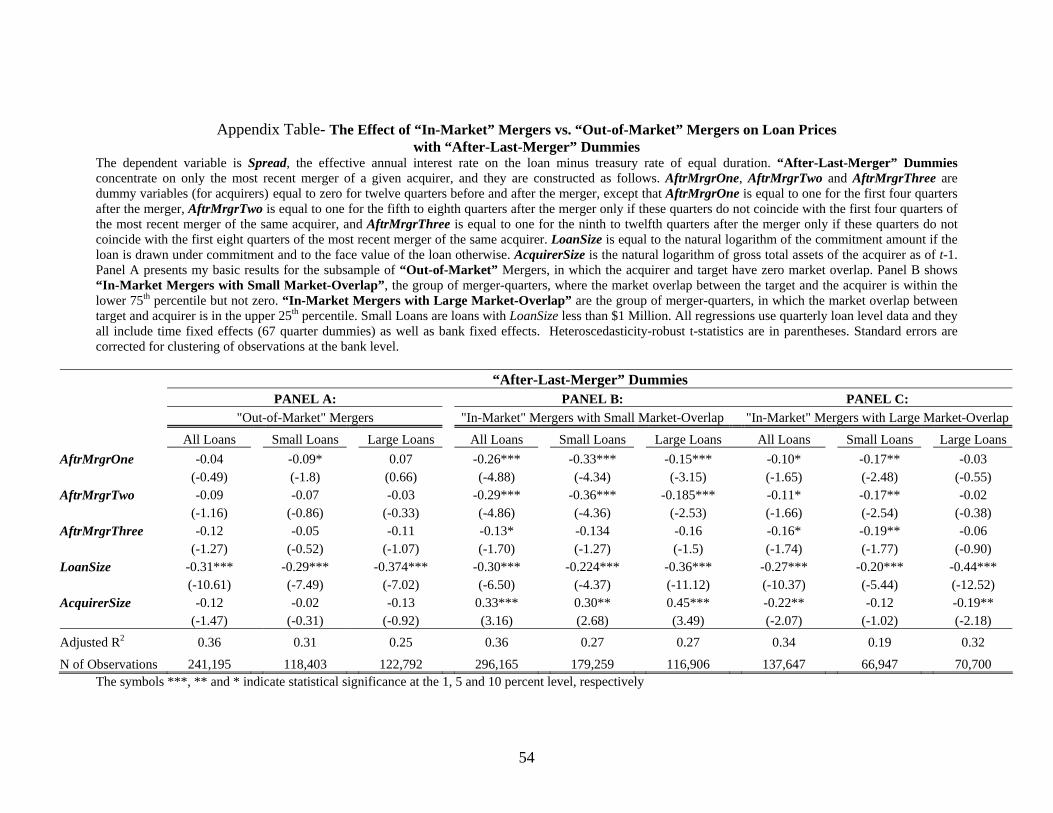
54
Appendix Table- The Effect of “In-Market” Mergers vs. “Out-of-Market” Mergers on Loan Prices with “After-Last-Merger” Dummies
The dependent variable is Spread, the effective annual interest rate on the loan minus treasury rate of equal duration. “After-Last-Merger” Dummies concentrate on only the most recent merger of a given acquirer, and they are constructed as follows. AftrMrgrOne, AftrMrgrTwo and AftrMrgrThree are dummy variables (for acquirers) equal to zero for twelve quarters before and after the merger, except that AftrMrgrOne is equal to one for the first four quarters after the merger, AftrMrgrTwo is equal to one for the fifth to eighth quarters after the merger only if these quarters do not coincide with the first four quarters of the most recent merger of the same acquirer, and AftrMrgrThree is equal to one for the ninth to twelfth quarters after the merger only if these quarters do not coincide with the first eight quarters of the most recent merger of the same acquirer. LoanSize is equal to the natural logarithm of the commitment amount if the loan is drawn under commitment and to the face value of the loan otherwise. AcquirerSize is the natural logarithm of gross total assets of the acquirer as of t-1. Panel A presents my basic results for the subsample of “Out-of-Market” Mergers, in which the acquirer and target have zero market overlap. Panel B shows “In-Market Mergers with Small Market-Overlap”, the group of merger-quarters, where the market overlap between the target and the acquirer is within the lower 75th percentile but not zero. “In-Market Mergers with Large Market-Overlap” are the group of merger-quarters, in which the market overlap between target and acquirer is in the upper 25th percentile. Small Loans are loans with LoanSize less than $1 Million. All regressions use quarterly loan level data and they all include time fixed effects (67 quarter dummies) as well as bank fixed effects. Heteroscedasticity-robust t-statistics are in parentheses. Standard errors are corrected for clustering of observations at the bank level.
“After-Last-Merger” Dummies PANEL A: PANEL B: PANEL C: "Out-of-Market" Mergers "In-Market" Mergers with Small Market-Overlap "In-Market" Mergers with Large Market-Overlap
All Loans Small Loans Large Loans All Loans Small Loans Large Loans All Loans Small Loans Large Loans AftrMrgrOne -0.04 -0.09* 0.07 -0.26*** -0.33*** -0.15*** -0.10* -0.17** -0.03 (-0.49) (-1.8) (0.66) (-4.88) (-4.34) (-3.15) (-1.65) (-2.48) (-0.55) AftrMrgrTwo -0.09 -0.07 -0.03 -0.29*** -0.36*** -0.185*** -0.11* -0.17** -0.02 (-1.16) (-0.86) (-0.33) (-4.86) (-4.36) (-2.53) (-1.66) (-2.54) (-0.38) AftrMrgrThree -0.12 -0.05 -0.11 -0.13* -0.134 -0.16 -0.16* -0.19** -0.06 (-1.27) (-0.52) (-1.07) (-1.70) (-1.27) (-1.5) (-1.74) (-1.77) (-0.90) LoanSize -0.31*** -0.29*** -0.374*** -0.30*** -0.224*** -0.36*** -0.27*** -0.20*** -0.44*** (-10.61) (-7.49) (-7.02) (-6.50) (-4.37) (-11.12) (-10.37) (-5.44) (-12.52) AcquirerSize -0.12 -0.02 -0.13 0.33*** 0.30** 0.45*** -0.22** -0.12 -0.19** (-1.47) (-0.31) (-0.92) (3.16) (2.68) (3.49) (-2.07) (-1.02) (-2.18) Adjusted R2 0.36 0.31 0.25 0.36 0.27 0.27 0.34 0.19 0.32
N of Observations 241,195 118,403 122,792 296,165 179,259 116,906 137,647 66,947 70,700 The symbols ***, ** and * indicate statistical significance at the 1, 5 and 10 percent level, respectively