Embed Size (px)
Citation preview

The Economy and Enlisted Retention in the Navy
Volume I: Main Report
Jane K. Pinelis • Jared M. Huff
DRM-2014-U-007301-Final June 2014

Approved for distribution: June 2014
Henry S. Griffis Defense Workforce Analyses Team Resource Analysis Division
This document contains the best opinion of CNA at the time of issue. It does not necessarily represent the opinion of the Sponsor.
Distribution unlimited. Specific authority: N00014-11-D-0323. Copies of this document can be obtained through the Defense Technical Information Center at www.dtic.mil or contact CNA Document Control and Distribution Section at 703-824-2123.
Copyright © 2014 CNA This work was created in the performance of Federal Government Contract Number N00014-11-D-0323. Any copyright in this work is subject to the Government's Unlimited Rights license as defined in DFARS 252.227-7013 and/or DFARS 252.227-7014. The reproduction of this work for commercial purposes is strictly prohibited. Nongovernmental users may copy and distribute this document in any medium, either commercially or noncommercially, provided that this copyright notice is reproduced in all copies. Nongovernmental users may not use technical measures to obstruct or control the reading or further copying of the copies they make or distribute. Nongovernmental users may not accept compensation of any manner in exchange for copies. All other rights reserved.

Used to identify Classification level
i
Contents Executive summary ............................................................................ 1
Approach ........................................................................................... 1 Results ................................................................................................ 2
Finding 1: Unemployment and Treasury rate principal component ........................................................................... 2
Finding 2: Retention in bellwether ratings ............................ 3 Finding 3: Retention responsiveness to changes in SRBs ..... 3 A corollary recommendation .................................................. 3
Introduction ....................................................................................... 5 Complicating factors ........................................................................ 6
Describing the economy: The national unemployment rate and beyond ............................................................................................ 9
Effect of unemployment on retention: previous estimates .......... 9 The need to supplement the unemployment rate ...................... 10 Augmenting the unemployment rate ........................................... 13
Econometric model of retention ...................................................... 15 Addressing multicollinearity with principal components
analysis (PCA) ............................................................................. 16 Resulting principal components ................................................... 17
The empirical relationship between retention and the economy ...... 21 Zone A ............................................................................................. 22 Zone B ............................................................................................. 26
Findings ............................................................................................ 29 Finding 1: Unemployment and Treasury rate principal
component .................................................................................. 29 Finding 2: Retention in bellwether ratings .................................. 31 Finding 3: Responsiveness to changes in SRBs ............................ 32 Additional recommendation: Keep track of the composition
of the force .................................................................................. 36 Conclusion ...................................................................................... 39

ii
References ....................................................................................... 40
List of figures ................................................................................... 42
List of tables .................................................................................... 44

1
Executive summary At the end of their service obligations, sailors decide whether to reen-list or enter the civilian workforce. Their decisions depend on many factors, including the opportunities that they expect to find in the ci-vilian economy. The implications of their decisions are important for the Navy, which relies on retention to maintain and grow its ranks. Retention forecasts are thus crucial for effective planning.
This report focuses on the relationship between the economy and reenlistment decisions. Our goal is to identify changing external conditions that will inform Navy leaders about when to adjust reten-tion budgets and policies.
Approach
We examined the relationship between the civilian economy and re-tention using data from 1992 to 2012. The recent variation in eco-nomic variables allowed us to establish a close link between retention and the economy, but we encountered several complicating factors.
Our literature review showed that the unemployment rate alone is an inadequate measure of the civilian economy’s strength. To supple-ment, we used Blue Chip Economic Indicators (BCEI) because they come with reliable quarterly forecasts and are already used by econ-omists on N1’s staff.
Using BCEI, however, presented another complicating factor: multi-collinearity. The variables in BCEI are highly correlated with each other, which complicates our modeling choices because multicolline-arity can introduce bias in our results. We address this by combining 11 BCEI variables into three principal components that are inde-pendent by construction. This gives us measures of three facets of the civilian economy. We label the resulting principal components ac-cording to the variables that most heavily influence their values:
unemployment and Treasury rate component

2
production growth component
price index component
Our analysis was also complicated by the mitigation measures that the Navy uses to allay large swings in retention. Historically, the Navy’s primary mitigation measure has been to change selective reenlist-ment bonuses (SRBs). Researchers have an established method to address this issue in analysis, but the extreme economic conditions of the past years led to a more drastic mitigation measure: Perform-to-Serve (PTS). Unlike previous policies, PTS greatly reduced the rela-tionship between changes in a sailor’s desire to reenlist and whether he or she actually reenlists: some otherwise-qualified sailors who wanted to reenlist were not allowed to do so. To control for this con-founding effect, we allow the economic principal components and other sailor characteristics to have different effects on retention in different periods. This allows us to interpret the results based on good and bad economic times and on whether sailor retention was significantly affected by a force-shaping policy.
After resolving these complicating factors, we built a model that can be used to forecast sailor retention as a function of the economic vari-ables in BCEI and of sailors’ military and demographic characteristics.
Results
The three main results of our research follow.
Finding 1: Unemployment and Treasury rate principal component
Our first finding is based on the principal components from our econometric model. We found a close link between the unemploy-ment and Treasury rate principal component and sailor retention. Our estimates indicate, for example, that holding other model ele-ments constant, a 1-standard-deviation increase in the unemployment and Treasury rate principal component is correlated with an 8.4-percentage-point drop in retention for Zone A men. Because this statement assumes that all other factors are held constant, which is unlikely, we are building a spreadsheet tool for N1 that will make it easier to use our model to forecast changes in retention behavior as a function of force characteristics and BCEI forecasts.

3
Finding 2: Retention in bellwether ratings
Previous CNA work identified a set of bellwether ratings, defined as those ratings or Enlisted Management Communities (EMCs) that had low retention (or needed SRBs) until the recent recession but that did not need an SRB during the recession. We build on this work, finding that changes in retention in bellwether ratings lead to changes in retention for all other ratings by several months. Heavy implementation of PTS caused this relationship to break down, around the end of 2009; however, because force-shaping policy use has declined, we suggest that bellwether ratings be monitored again to determine whether their potential as a leading indicator can be recovered.
Finding 3: Retention responsiveness to changes in SRBs
The third finding is heightened responsiveness to new (or changes to existing) SRBs. Our model estimates greater effects of SRB on sailor retention during moderate economic times (4.3 percent) than dur-ing weak or strong economic times (3.3 and 3.6 percent, respective-ly). We recommend that the Navy monitor sailor responsiveness to changes in SRBs for several months after the introduction or increase of an SRB; this may serve as a signal of changes in sailors’ underlying tastes for Navy service.
A corollary recommendation
Over the course of our analysis, we found two attributes of the force that should be tracked and further studied because they may repre-sent delayed effects of the economy on retention.
The first is sailor quality, which, as a result of poor civilian economic conditions, is substantially higher than at any other time in the past four decades. The increased quality may come with a future cost, however; we find that high-quality sailors reenlist at lower rates than do non-high-quality sailors. Furthermore, some of the high-quality sailors who enlisted during the recession may have done so primarily for income or job security reasons. If so, they may have a lower taste for service than sailors who would have been recruited otherwise. As such, improving civilian economic conditions may lead these sailors to leave the Navy at a greater rate than has previously been the case.

4
The second attribute that merits tracking is paygrade at the reenlist-ment decision point. One consequence of greater retention is slower advancement beyond E-3 for first-term sailors due to a more congest-ed promotion pipeline. As a consequence, sailors are facing reenlist-ment at lower paygrades, which we find is correlated with substantially lower rates of retention. As such, if the congestion of the promotion pipeline changes with a lag to changes in the economy, retention may suffer by more than would be expected to accompany the changing economy.
Our data allowed us a limited look at these two attributes since most of the sailors have not yet reached the reenlistment decision point. Going forward, however, the Navy should monitor force composition and connect it to retention forecasts.

5
Introduction At the end of their service obligations, sailors decide whether to stay in the Navy or enter the civilian workforce. A variety of factors influ-ence their decisions, such as personal preferences, military career characteristics, and the state of the civilian economy. The aggregate of these individual decisions constitutes an important outcome for the Navy—sailor retention.1
Because the Navy is a closed labor force, sailor retention is critical; the Navy relies primarily on retention to maintain its ranks and grow senior leadership. Retention forecasts, therefore, affect planning of all personnel functions, including readiness, advancements, recruit-ing, and training. For these reasons, it is important for the Navy to anticipate changes in retention behavior so that any negative conse-quences can be mitigated. Mitigation is often accomplished by chang-ing retention incentives.
Large increases in sailor retention in combination with the recent weak civilian economy suggest that civilian economic conditions are an important factor in sailors’ decisions to reenlist or leave the Navy. Intuitively, a decline in the economy is correlated with high reten-tion; conversely, during times of economic expansion, the Navy struggles to retain sailors. Little is known, however, about the actual nature of this relationship. As a result, drafting future personnel poli-cies or accurately budgeting for retention incentives is challenging. For this reason, VCNO and N1 asked CNA to analyze the relationship between enlisted retention and the economy with an eye toward fore-casting retention as a function of existing economic forecasts. They also asked us to identify external conditions that will indicate to Navy leaders when they should start budgeting for and executing retention policies.
1. Because retention is a result of sailors’ decisions to reenlist in the Navy,
we use the terms retention and reenlistment interchangeably through-out this report.

6
Complicating factors
In analyzing these issues, we first examined the state of the economy over the past 20 years, noting significant variation in numerous eco-nomic indicators.2 Such variation is a boon for our analysis because our ability to model the effect of these indicators on sailor retention depends on observing how the predictors and the response vary to-gether. In short, variation clarifies the picture. Even with this ad-vantage, however, we encountered four complicating factors when evaluating retention trends as a function of the economy. The para-graphs that follow discuss these complicating factors.
First, our literature search revealed that most previous studies use the unemployment rate (national or state) to adjust for the effect of the economy. But, as we saw in the latest recession, the unemployment rate alone is not a sufficient measure of the civilian economy. For ex-ample, the unemployment rate does not take into account those who are no longer in the labor force (or actively looking for work), which has been particularly important in the current recession.
To address this problem, we supplement the traditional analysis with several other economic indicators. We use Blue Chip Economic Indi-cators (BCEI) because they come with a reliable forecast and because N1, our sponsor, already collects and uses these data. We describe BCEI, how we use them to address the first complicating factor, and relevant literature in the first section of the report.
The second complicating factor follows from the first: since we know that the unemployment rate alone isn’t enough, we supplement it with other measures of the economy. However, this too is problematic because many economic indicators are strongly correlated with each other. This problem—commonly called “multicollinearity”—can re-sult in biased findings.
2. For example, December 2007 marked the start of the deepest economic
decline since the depression was ushered in by the 1929 stock market crash. The unemployment rate hit 5 percent and increased to its maxi-mum—about 10 percent—in late 2009. It rebounded to about 7 percent in 2013. Other measures of the civilian economy varied considerably over the period as well.

7
To address multicollinearity, we use principal components analysis (PCA). PCA allows us to transform the information from the 11 BCEI variables into three independent components that measure different aspects of the state of the civilian economy. We describe our data and modeling technique further in the second section. A more detailed description of the model is included in the accompanying technical appendixes (Volume II of this report).
The third complicating factor relates to what can actually be observed in the data. To describe the dependencies between sailor retention decisions and the economy, we would have to isolate the sailors’ “raw” reactions to the economy—that is, their decisions would have to be made without being affected by anything else. But that isn’t possible: the Navy always moderates retention with policy levers to ensure that retention never gets too high or too low. Some of these policies (e.g., selective reenlistment bonuses) are well documented and easy to ad-just for in analysis, but others introduce complicated analytical problems. Force-shaping policies can obscure the link between sail-ors’ desire to reenlist and the actual reenlistment outcomes, which we try to model. In the case of our study, a force-shaping policy called Perform-to-Serve (PTS) severely inhibits our ability to accurately measure the effect of the economy on retention.3 A fuller discussion of PTS and its effects on our estimates is available in appendix E of the accompanying technical appendixes.
The fourth complicating factor stems from the fact that individual sailor decisions are affected by unmeasurable quantities, such as re-tention climate. For example, an improvement in the economy after a long recession will cause some sailors to leave the Navy because they see new opportunities outside. However, sailors who follow may leave simply because their peers are leaving, even though their opportuni-ties may not be the same as their peers who left earlier (because they have a different job specialty, for example). In this case, lower
3. During PTS, many sailors who desired to reenlist could not; their reen-
listment requests were denied. Moreover, those who were denied reen-list-ment are not accurately recorded in our data. Consequently, varia-bles that change a sailor’s desire to reenlist, and would thus usually have a direct impact on reenlistment, may not have that direct link to the sailor’s actual reenlistment status while PTS is in effect.
8
retention would be caused by poor retention climate in conjunction with the economy—not by the economy by itself. So, it is possible that the effect of the same state of the economy on retention can vary, de-pending on how sailors perceive their options based on whether their peers are successful in the civilian job market.
To address these third and fourth factors, we need to adjust for sailor characteristics, isolate the effects of retention policies, such as bonus-es and PTS, and adjust for such potential issues as retention climate. To do this, we use a statistical technique called segmented regression as part of our econometric retention model. This technique (de-scribed in the third section) allows us to estimate different effects for the economic components before the recession, before PTS, and af-ter PTS. We find that PTS in particular eliminates our ability to make sensible predictions of retention based on the civilian economy.
At the end of our report, we present three findings that Navy leader-ship can use to identify when retention policies may need to be changed. These findings are informed by our analysis of the data as well as by previous economic research on forecasting retention.

9
Describing the economy: The national unemployment rate and beyond
Recall from the introduction that we resolve our first complicating factor—the fact that the unemployment rate is not a sufficient meas-ure of the economy—by supplementing it with other economic indi-cators. In this section, we discuss why the unemployment rate is unable to fully capture the state of the civilian labor market, particu-larly as it pertains to those seeking new jobs. We first review estimates of the effect of unemployment on retention from previous studies, discussing how those studies model the effects of the economy on re-tention. We show how the estimates from those studies are good benchmarks for our estimates. We then touch on work that establish-es the need to look beyond the unemployment rate, at indicators such as civilian wages, as a measure of the civilian economy.4 At the end of the section, we present the principal components that we use in our analysis. Our challenge is to find components that are not only descriptive but also simple and forecastable.
Effect of unemployment on retention: previous estimates
Few studies attempt to isolate the effect of the economy on retention. Exceptions are studies that are either dated [1]or do not apply to the Navy’s active component [2, 3], which is the focus of our analysis.
Beyond these exceptions, estimates of the relationship between civilian economic conditions and retention are mostly incidental, such as the
4. The econometric models used to estimate the effect of these variables
differ across the literature in meaningful ways. For a discussion of possi-ble retention models and an explanation of our decision to estimate a reduced-form regression, see appendix A of the technical appendixes that accompany this document.
10
inclusion of an unemployment rate (and civilian wage adjustment5) in the estimation of the effect of selective reenlistment bonuses (SRBs). As we show below, reliance on the unemployment rate is problematic for various reasons. First, however, we present the major finding of the literature to this point.
Estimates from extant studies show apparent declines in the relation-ship between the economy and retention. While older studies (e.g., [1, 6]) produced estimates of several percentage-point changes in re-tention in response to a 1-percentage-point change in unemploy-ment, more recent studies have found more conservative effects. In particular, studies that use data since the end of the Cold War have typically estimated effects no greater than 1:1 despite the use of a va-riety of location-level unemployment rates (e.g., [3, 7, 8]). These es-timates, however, do not completely reveal the effect of the economy on retention for at least two reasons:
The unemployment rate does not fully capture a sailor’s per-ceptions of the labor market. This can be seen in part by lack of a consensus on which unemployment rate to use: national (e.g., [1, 9]), regional (e.g., [7, 8, 10]), or local (e.g., [2, 11]).
The tendency of different economic variables (such as the un-employment rate and civilian wages) to change at the same time inhibits the isolation of the effect of any one variable on retention.
In the rest of this section, we focus on more fully establishing our first point—the inability of the unemployment rate to fully capture the ci-vilian economic climate. We address the tendency for multiple measures of the economy to move together in the next section, which is dedicated to our econometric model of retention.
The need to supplement the unemployment rate
Previous CNA research has shown that the unemployment rate paints only a partial picture of civilian economic conditions. We show an
5. The wage adjustments often take the form of a military-civilian wage ra-
tio or Annualized Cost of Leaving (ACOL) adjustment (see [4, 5] for an overview).

11
example of this in figure 1. We update the plot from CNA scientific analyst work by Griffis and McIntosh6 to reflect data through October 2013. The conclusions that they drew still hold: historically, trends in initial unemployment claims (IUC) (blue line) have led trends in the unemployment rate (green line). However, after the recent recession (after the last black rectangle in the plot), the lines’ trajectories di-verge slightly even though the decrease in the unemployment rate has followed the decline in IUC. The fact that the unemployment rate is taking longer to recover than the IUC indicates that the un-employment rate is not a sufficient measure of the economy.
Figure 1. Initial unemployment claims and unemployment rate
6. Scientific analyst work is not generally releasable to the public. To in-
quire about obtaining a copy, please contact one of the authors of this paper.
0
2
4
6
8
10
12
150
250
350
450
550
650
Jan-
70
Jan-
72
Jan-
74
Jan-
76
Jan-
78
Jan-
80
Jan-
82
Jan-
84
Jan-
86
Jan-
88
Jan-
90
Jan-
92
Jan-
94
Jan-
96
Jan-
98
Jan-
00
Jan-
02
Jan-
04
Jan-
06
Jan-
08
Jan-
10
Jan-
12
Seas
onal
ly a
djus
ted
unem
ploy
men
t rat
e (in
per
cent
)
Seas
onal
ly a
djus
ted
initi
al u
nem
ploy
men
t cla
ims
(wee
kly
aver
ages
in 1
,000
s)
Initial unemployment claims Unemployment rate Recessions

12
To further illustrate this point, consider figure 2. We continue to ex-tend the analysis, this time looking at the labor force participation rate and the job creation rate. On one hand, since 2009, the unem-ployment rate has been decreasing in parallel with the labor force participation rate. In other words, people are stopping their job search (presumably because they are discouraged) and dropping out of the labor force. This causes a decline in the unemployment rate, but it doesn’t mean that people are finding jobs. On the other hand, the job opening rate has recovered to its long-term average, which is encouraging. Taken together, these indicators show that different dimensions of the economy tell different stories about recession and recovery—all the more reason to measure the economy through a combination of indicators rather than one.
Figure 2. Labor force participation and job openings
61
62
63
64
65
66
67
68
0
2
4
6
8
10
12
Jan-
01
Jan-
02
Jan-
03
Jan-
04
Jan-
05
Jan-
06
Jan-
07
Jan-
08
Jan-
09
Jan-
10
Jan-
11
Jan-
12
Jan-
13
Seas
onal
ly a
djus
ted
labo
r fo
rce
part
icip
atio
n ra
te
(in p
erce
nt)
Seas
onal
ly a
djus
ted
unem
ploy
men
t and
job
open
ings
rat
es
(in p
erce
nt)
Unemployment rate Job openings rateLabor force participation rate Recessions

13
Augmenting the unemployment rate
Since the unemployment rate alone is not a sufficient measure of the state of the civilian economy, we now describe the other aspects of the economy that we chose to supplement the unemployment rate.
In selecting additional economic measures, we set two basic criteria. First, and most obvious, the measure had to capture more than the unemployment rate, and, second, it had to be forecastable. The latter is a fairly significant restraint; for instance, we are not aware of pro-fessional forecasts of the IUC and the job openings rate that are pro-duced regularly and have a reputation for being reliable. Instead, to augment our measure of the economy beyond the unemployment rate, we look to Blue Chip Economic Indicators (BCEI). The BCEI include the unemployment rate and several other economic measures. These measures are forecasted quarterly for the current and following calendar years. In addition to meeting our criteria de-scribed earlier, we chose BCEI for several reasons. First, the indicators are produced by top business economists and have been in use and well regarded for almost 40 years. In addition, our sponsor, N1, al-ready collects and uses data from BCEI in its forecasts,7 so this choice is convenient for N1 for future work. Of the 12 variables included in the BCEI, we use all but 1:8
1. Real Gross Domestic Product (GDP) (growth rate)
2. GDP price index (growth rate)
3. Consumer price index (growth rate)
4. Producer price index (growth rate)
5. Total industrial production (growth rate)
6. Real disposable personal income (growth rate) 7. Whereas our sponsor currently monitors BCEI, this work will help them
use BCEI systematically for retention forecasts via an econometric model.
8. Our analysis of the 12th variable (net exports) showed that its inclusion would require the creation of an additional component; the resulting four components were less stable across time than the components used in this analysis.

14
7. Real personal consumption expenditures (growth rate)
8. 3-month Treasury bill rate (level)
9. 10-year Treasury note yield (level)
10. Unemployment rate9 (level)
11. Change in business inventories (level)
These variables represent a range of economic activities that have the potential to capture information about many aspects of the civilian economy. Including a broad set of variables will increase the proba-bility that a change in the civilian economic environment is detected (signaled, perhaps, by changes in some variables but not in others).
From a modeling perspective, however, these variables ultimately re-flect facets of the same subject—the economy—which presents our second challenge, multicollinearity. In the next section, we analyze these variables and show that, through the use of principal compo-nents analysis (PCA), the information they contain can be distilled into three components that are uncorrelated.
9. We use the national unemployment rate in our analysis. A number of al-
ternative unemployment rates are available (e.g., the youth unemploy-ment rate or an unemployment rate that includes discouraged workers); however, the correlation between the national unemployment rate and these unemployment rates generally exceeds 0.99. Combined with the lack of professional forecasts of these rates, this suggests that use of one unemployment rate (the national unemployment rate) is sufficient for this analysis.

15
Econometric model of retention In the previous section, we noted two issues encountered when using the unemployment rate in retention analyses:
The unemployment rate provides an incomplete picture of the civilian economic environment.
The tendency for different economic variables to change at the same time inhibits the isolation of the effects of any one of the variables.
We discussed the first point at length and introduced other economic variables that help provide a richer picture of the economic envi-ronment. We selected a set of 11 variables (including the unemploy-ment rate) that is professionally forecasted each quarter through the end of the following calendar year (BCEI variables). This choice serves both to account for a range of economic activity and to provide forecasts that the Navy can use to predict future retention.
Here, we address the second point, illustrating the degree of correla-tion between different economic variables, describing why this is a problem for estimation (and why this problem is relevant to the Na-vy), and introducing our solution: a set of economic indices that combine the information from the economic variables to offer three independent views of aspects of the economy. These indices also pro-vide the principal inputs to our retention forecasting model.
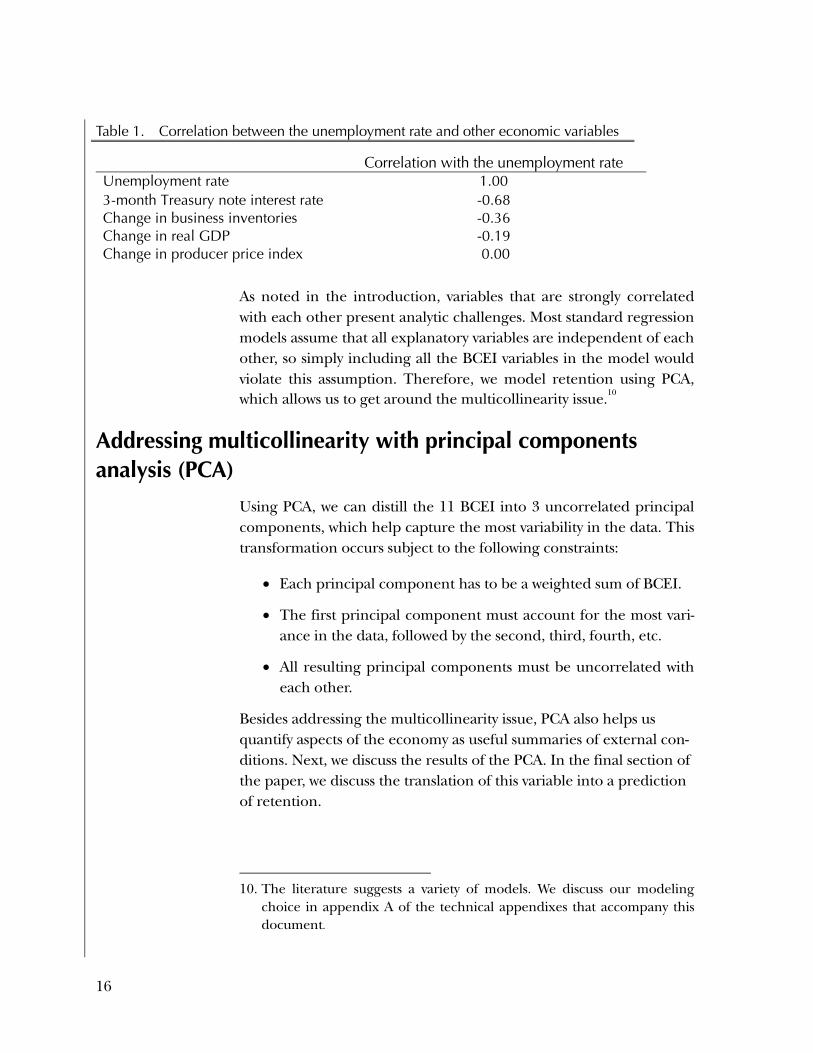
We begin by showing that some of the BCEI variables identified in the previous section are correlated with the unemployment rate (see table 1). Correlations range from -1 to 1; numbers farther from zero imply larger correlations (for our purpose here, the sign of the corre-lation is inconsequential). By definition, the unemployment rate is perfectly correlated with itself. It is also strongly correlated with the 3-month Treasury note interest rate and somewhat correlated with changes in real business inventories and real GDP, but uncorrelated with changes in the producer price index.
16
Table 1. Correlation between the unemployment rate and other economic variables
Correlation with the unemployment rate Unemployment rate 1.00 3-month Treasury note interest rate -0.68 Change in business inventories -0.36 Change in real GDP -0.19 Change in producer price index 0.00
As noted in the introduction, variables that are strongly correlated with each other present analytic challenges. Most standard regression models assume that all explanatory variables are independent of each other, so simply including all the BCEI variables in the model would violate this assumption. Therefore, we model retention using PCA, which allows us to get around the multicollinearity issue.10
Addressing multicollinearity with principal components analysis (PCA)
Using PCA, we can distill the 11 BCEI into 3 uncorrelated principal components, which help capture the most variability in the data. This transformation occurs subject to the following constraints:
Each principal component has to be a weighted sum of BCEI.
The first principal component must account for the most vari-ance in the data, followed by the second, third, fourth, etc.
All resulting principal components must be uncorrelated with each other.
Besides addressing the multicollinearity issue, PCA also helps us quantify aspects of the economy as useful summaries of external con-ditions. Next, we discuss the results of the PCA. In the final section of the paper, we discuss the translation of this variable into a prediction of retention.
10. The literature suggests a variety of models. We discuss our modeling
choice in appendix A of the technical appendixes that accompany this document.
17
Resulting principal components
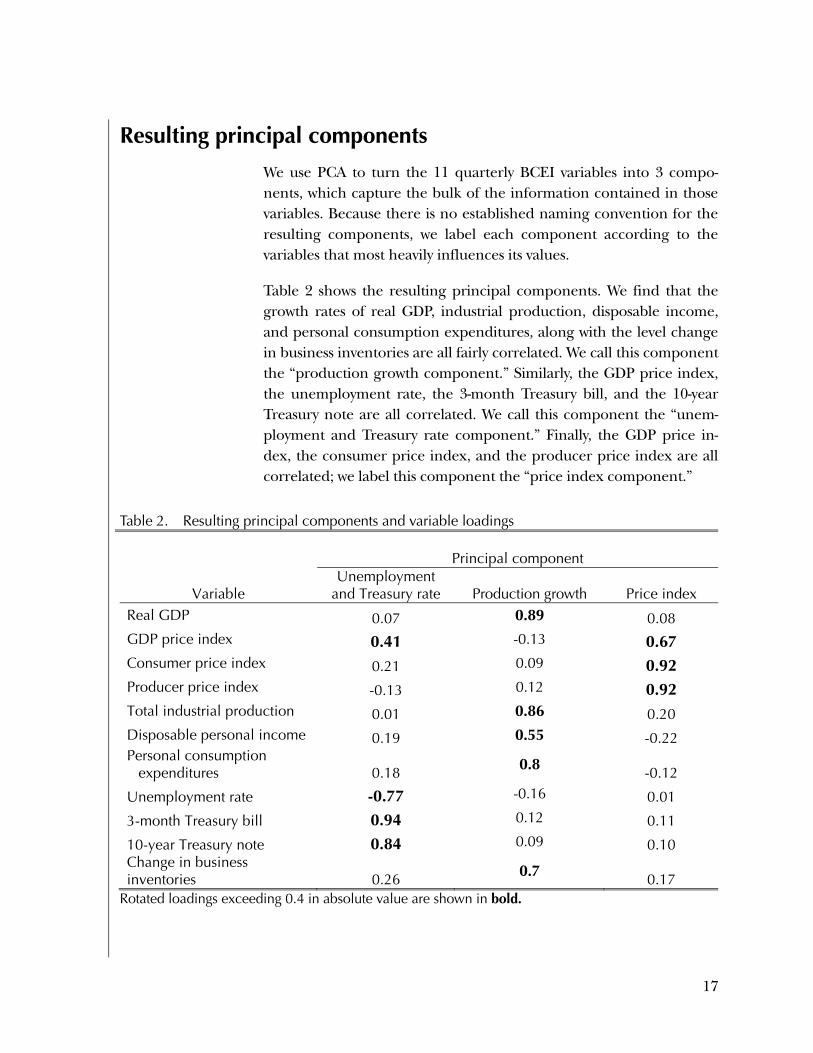
We use PCA to turn the 11 quarterly BCEI variables into 3 compo-nents, which capture the bulk of the information contained in those variables. Because there is no established naming convention for the resulting components, we label each component according to the variables that most heavily influences its values.
Table 2 shows the resulting principal components. We find that the growth rates of real GDP, industrial production, disposable income, and personal consumption expenditures, along with the level change in business inventories are all fairly correlated. We call this component the “production growth component.” Similarly, the GDP price index, the unemployment rate, the 3-month Treasury bill, and the 10-year Treasury note are all correlated. We call this component the “unem-ployment and Treasury rate component.” Finally, the GDP price in-dex, the consumer price index, and the producer price index are all correlated; we label this component the “price index component.”
Table 2. Resulting principal components and variable loadings
Variable
Principal component Unemployment
and Treasury rate Production growth Price index Real GDP 0.07 0.89 0.08 GDP price index 0.41 -0.13 0.67 Consumer price index 0.21 0.09 0.92 Producer price index -0.13 0.12 0.92 Total industrial production 0.01 0.86 0.20 Disposable personal income 0.19 0.55 -0.22 Personal consumption expenditures 0.18 0.8 -0.12
Unemployment rate -0.77 -0.16 0.01
3-month Treasury bill 0.94 0.12 0.11
10-year Treasury note 0.84 0.09 0.10 Change in business inventories 0.26 0.7 0.17
Rotated loadings exceeding 0.4 in absolute value are shown in bold.

18
Because the principal components are a combination of information from several variables, they will not perfectly mimic any of the indi-vidual variables. Figure 3 shows the difference between the (negative) unemployment and Treasury rate component and the normalized quarterly unemployment rate. While the two show similar trends, the differences are often substantial (in particular, see 1990–1992 and 2002–2005). Furthermore, the principal component suggests less of an improvement in the economy between 2011 and 2013 than im-plied by the change in the unemployment rate.
Figure 3. The normalized unemployment rate and the unemployment and Treasury rate component
One benefit of using a range of economic variables in the construc-tion of our principal components is that much of the information contained in other variables that do not have professional forecasts is already captured in our model. For instance, the unemployment and Treasury rate component is also highly correlated with the labor force participation rate (LFPR), as shown in figure 4.

19
Figure 4. The labor force participation rate and the unemployment and Treasury rate component
Now that we have identified the three components, forecasting them through the end of the following calendar year is straightforward: we apply the same linear transformation to the professional forecasts of the variables as was applied to their historical values.11 Projected val-ues for each of the components through the end of 2015 are shown as dashed lines in figure 5.
11. This implies that the relationships between economic variables are rela-
tively stable across time (i.e., that the variables move together similarly in a recession as they do in normal economic times). In appendix B of the technical appendixes that accompany this document, we estimate the re-lationship between economic variables at different points in time and find that the economic variables consistently form the same components that we report here.

20
Figure 5. Principal components with projections
Current projections suggest that each of the three components will rise through the end of 2015. For the production growth component as well as the price index component, this is in line with recent levels. For the unemployment and Treasury rate component, this represents an increase over recent levels, although it will still be well below the “average” economy (represented by a value of “0”).
Now that we have calculated the projected values for the compo-nents, we estimate the relationship between the components and re-tention; doing so will allow us to project future retention. We generate these estimates in the following section.

21
The empirical relationship between retention and the economy
In the previous section, we described how we used PCA to get around multicollinearity among BCEI in our econometric model of reten-tion. In this section, we report the estimates of the relationship be-tween the economic components and the retention of Zone A and Zone B sailors, based on that model. There are three main findings:
The unemployment and Treasury rate component is strongly correlated with the retention of sailors, and the effect is fairly robust to the inclusion or exclusion of sailors who may have been subjected to PTS.
— The estimated effect can be combined with projections of this component to identify a changing external condition that signals a change in the retention environment.
The estimated relationships between the other economic indi-ces and retention are substantially different when sailors who may have been subjected to PTS are included in the retention model than when they are excluded.
There is evidence to suggest that large changes in the produc-tion growth component may also be accompanied by changes in retention. Changes in this component may serve as a general signal of changes in the retention environment.
Before we discuss how we got our results, however, we briefly summa-rize our data to put the results in context. While the bulk of the crite-ria that we impose on our data are shown in appendix C of the technical appendixes that accompany this document, we note a few key characteristics here:
We exclude short-term extensions because we view this as a de-lay of the reenlistment decision.
We include those marked “ineligible to reenlist” as decision-makers because we learned in discussions with Navy personnel

22
that this designation may not be accurate, particularly during PTS.
We include reenlistment decisions between January 1992 and September 2012.
Our starting assumption is that many of the explanatory variables that we include may have different effects on retention for sailors, by gen-der and zone, so we build separate models for men and women reen-listing in Zones A and B. While our focus is on the estimated relationship between the economic indices and retention, we are also interested in forecasting retention. As such, we also include a wide va-riety of individual and Navy characteristics that previous studies have shown to be correlated with retention. These characteristics are de-scribed in detail in appendix C of the technical appendixes that ac-company this document, with the estimated effects shown in appendix D of the same volume. By accounting for changes in Navy policy or sailor characteristics that may have also occurred during this period (e.g., changes in SRB and sailor quality), we better isolate the effect of the economic indices on retention. We begin with Zone A sailors be-cause they account for the majority of reenlistment decisions.
Zone A
Overall, the results for Zone A sailors show that the unemployment and Treasury rate component is a good predictor for what will hap-pen with retention in the Navy. That is, we find a large relationship between this component and retention. In addition, the production growth component may also be a good indicator of future retention, but this result is not robust to the inclusion of sailors who may have been affected by PTS.
Table 3 shows the estimated relationships between the economy and retention for Zone A sailors, presented as percentage-point changes in retention associated with a 1-unit increase in the economic com-ponent.12 The strong negative relationship between retention and the unemployment and Treasury rate component overshadows any
12. Here, a 1-unit increase represents an increase of 1 standard deviation of
the data. This can be directly mapped into an expected frequency of see-ing an economy at least this bad/good, as shown in table 4.

23
effects the other components may have on retention. Indeed, a 1-unit increase in the unemployment and Treasury rate component is corre-lated with 8.4- and 8.7-percentage-point decreases in retention for Zone A men and women, respectively. The effect sizes are no greater than 1 percentage point for the other components.
Table 3. The economy and Zone A retention
Unemployment and Treasury rate component
Production growth component
Price index component
Men -8.4% 0.0% 1.0% [-8.6%, -8.2%] [-0.2%, 0.2%] [0.8%, 1.2%]
Women -8.7% 0.2% 0.2% [-9.2%, -8.1%] [-0.2%, 0.6%] [-0.3%, 0.7%]
Point estimates are in bold and represent percentage-point changes. 95% confidence intervals are in brackets.
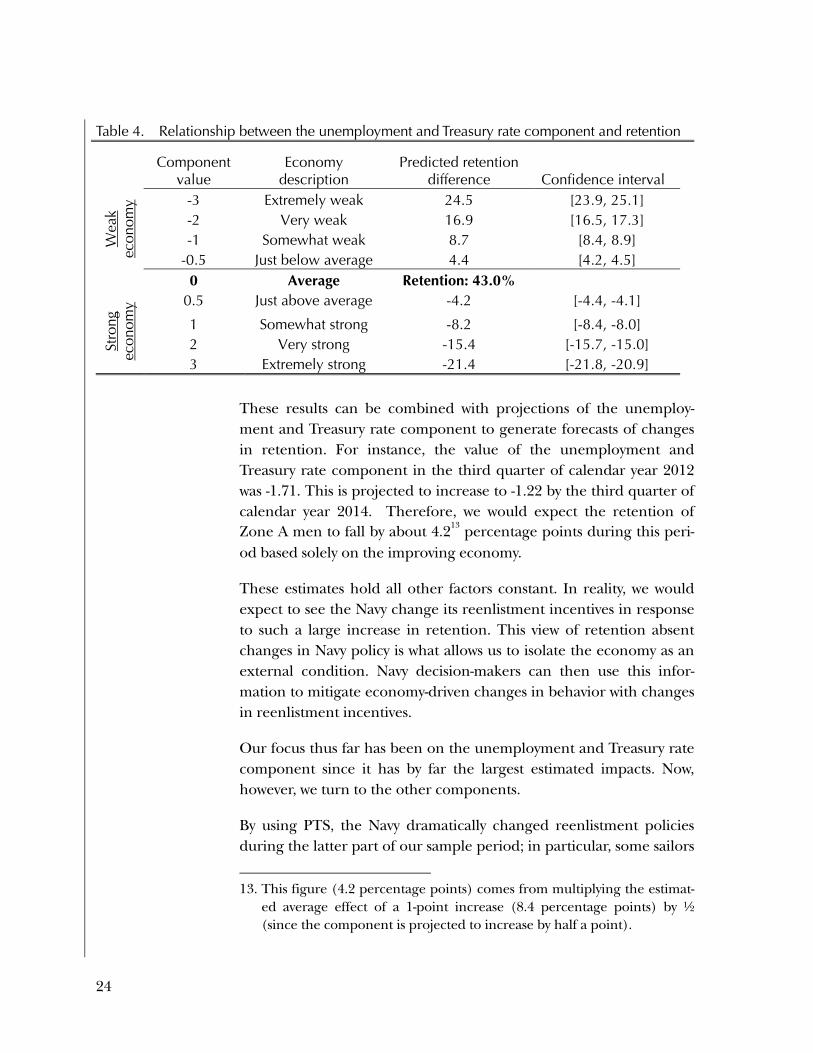
A 1-unit change in our component does not have an immediately in-tuitive meaning, so we translate the effect of the unemployment and Treasury rate component into a measure that is more intuitive. In ta-ble 4, we show the predicted effects on retention of different levels of the unemployment and Treasury rate principal component. The first column shows potential values of the component; larger positive numbers indicate a stronger civilian economy and larger negative numbers indicate a weaker economy. The second column shows how the component values can be translated into statements about the economy. The third and fourth columns give estimates and confi-dence intervals of expected retention changes associated with an economy at this level.
For example, consider a neutral economy (component value of 0). In this economy, we expect 43 percent of Zone A men to reenlist. Now, suppose that the civilian economy became weaker, with a com-ponent value of -1 (still stronger than the calendar year 2013 econo-my). If the unemployment and Treasury rate component moved to this value from neutral, while the other variables remained constant, we would expect retention to rise by 8.7 percentage points (from 43 percent).
24
Table 4. Relationship between the unemployment and Treasury rate component and retention
Component value
Economy description
Predicted retention difference Confidence interval
Wea
k ec
onom
y -3 Extremely weak 24.5 [23.9, 25.1] -2 Very weak 16.9 [16.5, 17.3] -1 Somewhat weak 8.7 [8.4, 8.9]
-0.5 Just below average 4.4 [4.2, 4.5] 0 Average Retention: 43.0%
Stro
ng
econ
omy 0.5 Just above average -4.2 [-4.4, -4.1]
1 Somewhat strong -8.2 [-8.4, -8.0] 2 Very strong -15.4 [-15.7, -15.0] 3 Extremely strong -21.4 [-21.8, -20.9]
These results can be combined with projections of the unemploy-ment and Treasury rate component to generate forecasts of changes in retention. For instance, the value of the unemployment and Treasury rate component in the third quarter of calendar year 2012 was -1.71. This is projected to increase to -1.22 by the third quarter of calendar year 2014. Therefore, we would expect the retention of Zone A men to fall by about 4.213 percentage points during this peri-od based solely on the improving economy.
These estimates hold all other factors constant. In reality, we would expect to see the Navy change its reenlistment incentives in response to such a large increase in retention. This view of retention absent changes in Navy policy is what allows us to isolate the economy as an external condition. Navy decision-makers can then use this infor-mation to mitigate economy-driven changes in behavior with changes in reenlistment incentives.
Our focus thus far has been on the unemployment and Treasury rate component since it has by far the largest estimated impacts. Now, however, we turn to the other components.
By using PTS, the Navy dramatically changed reenlistment policies during the latter part of our sample period; in particular, some sailors
13. This figure (4.2 percentage points) comes from multiplying the estimat-
ed average effect of a 1-point increase (8.4 percentage points) by ½ (since the component is projected to increase by half a point).
25
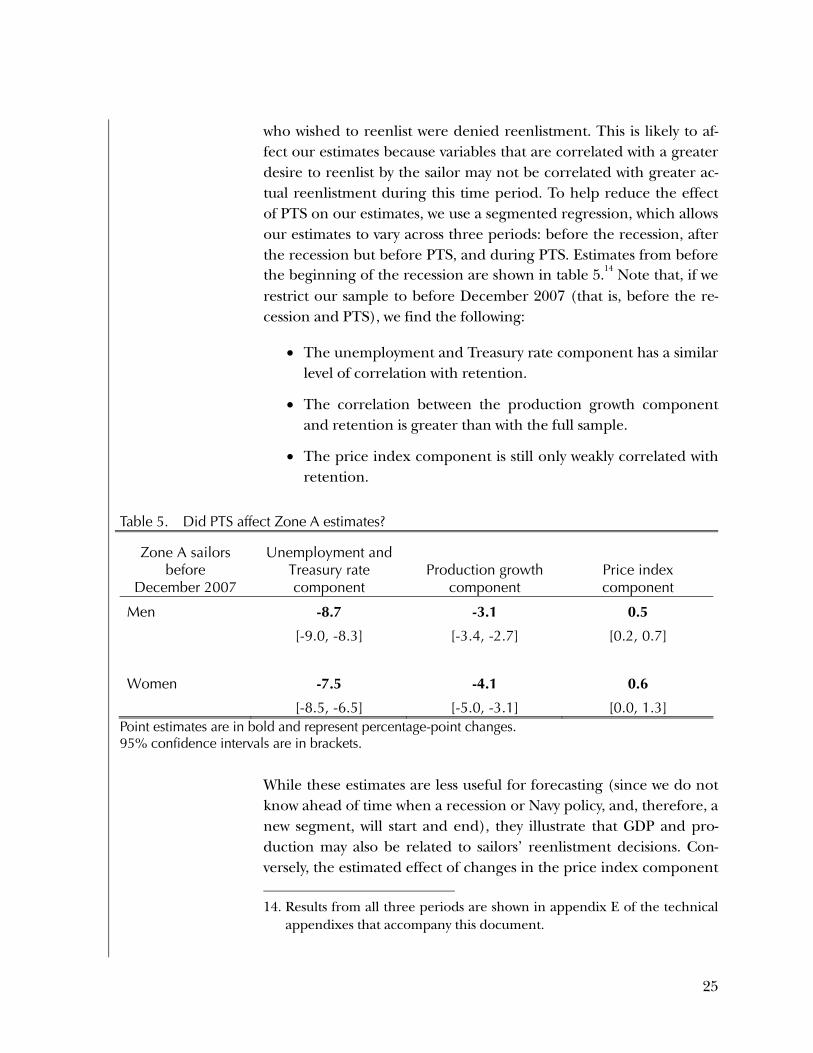
who wished to reenlist were denied reenlistment. This is likely to af-fect our estimates because variables that are correlated with a greater desire to reenlist by the sailor may not be correlated with greater ac-tual reenlistment during this time period. To help reduce the effect of PTS on our estimates, we use a segmented regression, which allows our estimates to vary across three periods: before the recession, after the recession but before PTS, and during PTS. Estimates from before the beginning of the recession are shown in table 5.14 Note that, if we restrict our sample to before December 2007 (that is, before the re-cession and PTS), we find the following:
The unemployment and Treasury rate component has a similar level of correlation with retention.
The correlation between the production growth component and retention is greater than with the full sample.
The price index component is still only weakly correlated with retention.
Table 5. Did PTS affect Zone A estimates?
Zone A sailors before
December 2007
Unemployment and Treasury rate component
Production growth component
Price index component
Men -8.7 -3.1 0.5
[-9.0, -8.3] [-3.4, -2.7] [0.2, 0.7]
Women -7.5 -4.1 0.6
[-8.5, -6.5] [-5.0, -3.1] [0.0, 1.3] Point estimates are in bold and represent percentage-point changes. 95% confidence intervals are in brackets.
While these estimates are less useful for forecasting (since we do not know ahead of time when a recession or Navy policy, and, therefore, a new segment, will start and end), they illustrate that GDP and pro-duction may also be related to sailors’ reenlistment decisions. Con-versely, the estimated effect of changes in the price index component 14. Results from all three periods are shown in appendix E of the technical
appendixes that accompany this document.
26
is still small; it is unlikely to substantively affect retention. Thus, pro-jections of both the unemployment and Treasury rate component and the production growth component (but not the price index component) can serve as summaries of external conditions that point to upcoming changes in the retention environment. To conclude, we find and recommend the following for Zone A sailors:
The unemployment and Treasury rate component has a large and predictable relationship with retention. The effects shown in table 4 could easily be combined with forecasts of this com-ponent to identify a changing external condition that signals a need to change Navy retention policies.
It is likely that the production growth component is also strongly correlated with retention. In this case, however, the Navy’s PTS policy inhibits our ability to estimate an effect that is consistent across time. We suggest that this component be monitored, with large changes likely signaling an upcoming change in the retention environment.
Zone B
Our results for Zone B sailors are similar to those for Zone A sailors. As table 6 shows, the unemployment and Treasury rate component again has the largest estimated relationship with retention; however, the magnitude of the relationship is roughly half of that for Zone A sailors.15 We estimate a stronger relationship between the price index component and retention for Zone B sailors than for Zone A sailors. As we show, however, this may be an artifact of the Navy’s PTS policy.
As before, we try to mitigate the effect of PTS on Zone B retention by allowing the coefficients on the economic indices to differ before the recession, after the recession but before PTS, and during PTS. Re-sults from the first of these are shown in table 7.
15. It is possible that Zone B sailors have a muted response to the economy
because they are closer to retirement, and because they have already shown some taste for military service by staying in the Navy at their first reenlistment point.

27
Table 6. The economy and Zone B retention
Sailors Unemployment and Treasury rate
component Production growth
component Price indexComponent
Men -3.8 0.6 -0.7 [-4.1, -3.4] [0.4, 0.9] [-1.0, -0.4]
Women -4.5 1.2 -2.4 [-5.3, -3.6] [0.6, 1.8] [-3.1, -1.7]
Point estimates are in bold and represent percentage-point changes. 95% confidence intervals are in brackets.
Table 7. Did PTS affect Zone B estimates?
Sailors before December 2007
Unemployment and Treasury rate component
Production growth
component Price index component
Men -4.8 -2.4 0.0
[-5.4, -4.2] [-3.1, -1.7] [-0.4, 0.5]
Women -5.0 -4.2 -1.7
[-6.7, -3.3] [-6.2, -2.1] [-2.9, -0.5] Point estimates are in bold and represent percentage-point changes. 95% confidence intervals are in brackets.
The estimated effect for the unemployment and Treasury rate com-ponent is still large. As with Zone A sailors, mitigating the effect of PTS results in a much larger estimated effect of the production growth component. In fact, it changes from the “wrong” sign (where stronger economies are correlated with greater retention) to the more intuitive sign (where stronger economies are correlated with less retention).
A notable difference between Zone A and Zone B sailors is the esti-mated effect of the price index component. While the estimated rela-tionship with retention was small, positive, and had mixed significance for Zone A sailors, there is more evidence that a higher price index component may be correlated with lower retention for Zone B sailors. Because we lack a robust estimated relationship, how-ever, we recommend monitoring the production growth and, to a

28
lesser extent, price index components as potential indicators of a changing retention environment.
In conclusion, our results for Zone B sailors are similar to those for Zone A sailors:
While the estimated relationship between retention and the economic and Treasury component for Zone B sailors is small-er than for Zone A sailors, the effect is still large and overshad-ows the effects of the other components.
— Combining these estimates with projections of this compo-nent can isolate a changing external condition that signals a change in the retention environment.
As before, the estimated relationship between the other indices and retention is substantially different when omitting sailors who may have been subjected to PTS.
Our results suggest (but do not conclusively show) that the production growth component also has a notable relationship with retention. Monitoring this component may reveal upcom-ing changes in the retention climate.

29
Findings The analysis and results described in this report brought to light three notable findings; we describe each in this section. These find-ings will help Navy leaders identify when to adjust retention budgets and policies.
We arrange them according to how forward-looking they are. The first finding can be used at the time of the forecast to look ahead through the next several calendar years; it will be helpful when the Navy is ready to budget for retention bonuses. The second finding will help Navy leaders identify when a retention change is a few months away, helping them prepare for retention policy implementa-tion. The third finding will signal that the retention behavior is cur-rently changing, so the Navy should consider an immediate retention policy.
Finding 1: Unemployment and Treasury rate principal com-ponent
Our first finding is based on the unemployment and Treasury rate principal component from our econometric model. Because it is based on BCEI, a monthly forecast of this component through the end of the next calendar year can easily be calculated. Thus, this find-ing is helpful as the Navy looks several months to two years ahead, giving leadership time to plan and budget for retention policies.
Table 8 shows predicted retention differences at different levels of the unemployment and Treasury rate principal component. The first column shows notional values of the component; larger positive numbers indicate a stronger civilian economy, and larger negative numbers indicate a weaker economy. The second and third columns give estimates and confidence intervals of the anticipated relation-ship with retention of these levels of the component, compared with a “normal” economy (component value zero) and assuming an SRB level of 1.

30
Table 8. Using the unemployment and Treasury rate principal component to anticipate changes in retention
Value Predicted retention difference
(in percentage points) Confidence interval
Wea
k ec
onom
y -3 24.5 [23.9, 25.1] -2.5 20.8 [20.3, 21.3] -2 16.9 [16.5, 17.3]
-1.5 12.8 [12.5, 13.2] -1 8.7 [8.4, 8.9]
-0.5 4.4 [4.2, 4.5] 0 Retention: 43.0%
Stro
ng e
cono
my 0.5 -4.2 [-4.4, -4.1]
1 -8.2 [-8.4, -8.0] 1.5 -11.9 [-12.2, -11.6] 2 -15.4 [-15.7, -15.0]
2.5 -18.5 [-18.9, -18.1] 3 -21.4 [-21.8, -20.9]
A moderately weak economy (represented by a value of -1) or worse is expected to occur in about 15.9 percent of the months.16 In this economy, we would expect retention to increase by 8.7 percentage points. An unusually weak economy (represented by a value of -2) or worse is expected to occur only 2.3 percent of the time, and we ex-pect retention to increase 16.9 percentage points in those months as compared with normal economic conditions. A very weak economy (represented by a value of -3) is expected to occur roughly just over 0.1 percent of the time; this is equivalent to roughly 1 month in every 62 years.
Even when we limit our focus to values that we expect to see (and are seeing in our sample), the anticipated relationship with retention can be quite large. For instance, we see that the difference between com-ponent values of -2 (unusually weak economy) and 0 is substantial: we expect retention in the unusually weak economy to exceed that of a normal economy by almost 17 percentage points. Likewise, an unu-sually good economy (component value of 2; seen in roughly 1 in
16. This and similar calculations are done based on the fact that the princi-
pal components follow a standard normal distribution.

31
44 months) is expected to be accompanied by retention that is 15.4 percentage points lower than normal.
Looking ahead, the Navy is particularly interested in anticipating changes in retention once the economy improves. We are currently approaching the -1 level of this component. We expect retention to decrease 8.7 percentage points as the component improves further to reach its normal level. If the economy continues to improve over the next few years, reaching, say to a level of 1 on this component, we ex-pect retention to fall another 8.2 percentage points, assuming no changes in the SRB.
We expect benefits from monitoring all three principal components together. But, because of the complexity of doing this, we are provid-ing a tool to N1 that will help compute predicted changes in reten-tion as a function of changes in BCEI.
Finding 2: Retention in bellwether ratings
So far, we have focused on using the economy to tell us what will happen to retention. However, our literature search revealed another option that may be of value to senior leaders: scrutinize changes in retention in certain Navy ratings. Previous work by CNA scientific an-alysts identified a set of bellwether ratings, defined as those ratings or Enlisted Management Communities (EMCs) that had low retention (or needed SRBs) until the recent recession but that did not need an SRB during the recession. These ratings are Machinist Mate, Opera-tions Specialist, Air Traffic Controlman, Aviation Ordnanceman, and Electronics Technician (Submarine Warfare). Retention behavior in these ratings historically has led retention behavior in other Navy rat-ings. Thus changes in retention in these ratings have historically led changes in retention in the Navy overall.
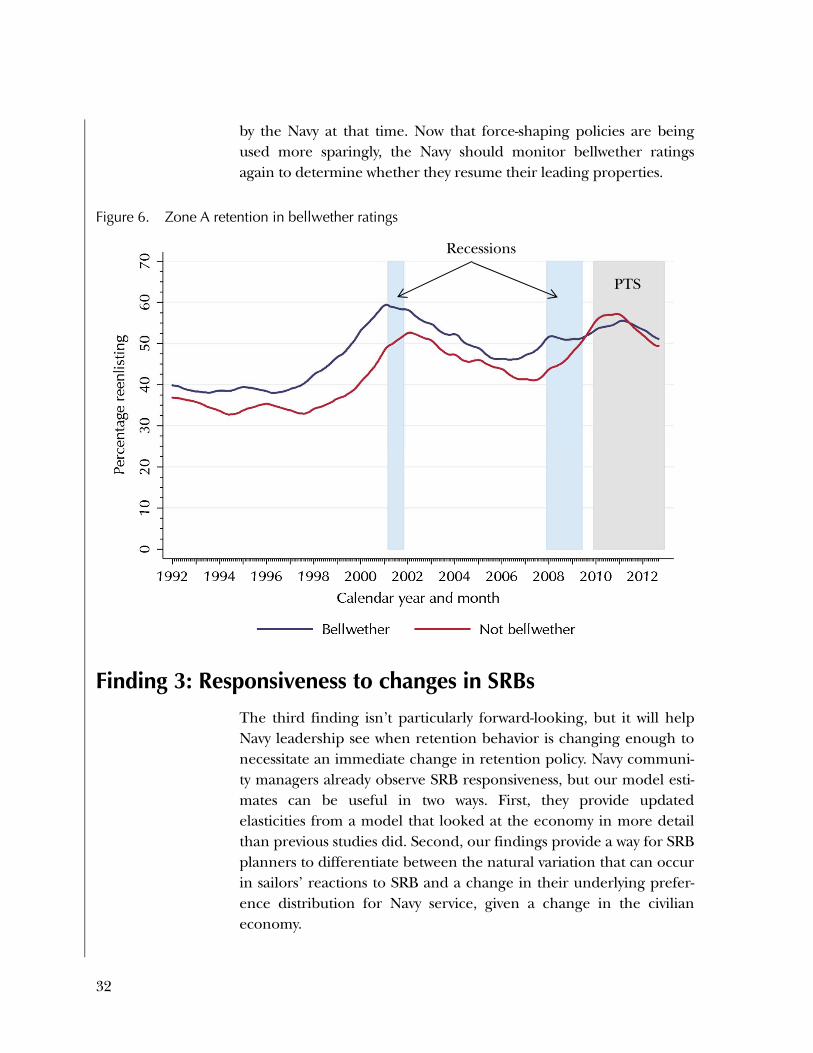
As shown in figure 6, during the recession in 2001, retention in bell-wether ratings decreased for several months before retention in the other ratings did. Similarly, before the most recent recession, reten-tion started to increase in bellwether ratings several months before it started to increase in the other ratings.
Under heavy use of PTS, however, the leading property of bellwether ratings disappeared. This is because reenlistments were heavily shaped
32
by the Navy at that time. Now that force-shaping policies are being used more sparingly, the Navy should monitor bellwether ratings again to determine whether they resume their leading properties.
Figure 6. Zone A retention in bellwether ratings
Finding 3: Responsiveness to changes in SRBs
The third finding isn’t particularly forward-looking, but it will help Navy leadership see when retention behavior is changing enough to necessitate an immediate change in retention policy. Navy communi-ty managers already observe SRB responsiveness, but our model esti-mates can be useful in two ways. First, they provide updated elasticities from a model that looked at the economy in more detail than previous studies did. Second, our findings provide a way for SRB planners to differentiate between the natural variation that can occur in sailors’ reactions to SRB and a change in their underlying prefer-ence distribution for Navy service, given a change in the civilian economy.
PTS
Recessions

33
Here, we consider whether changes in responsiveness to SRB act as indicators of a change in sailors’ underlying preferences for staying in the Navy. To do this, we add to our econometric retention model an interaction between SRB and the economy. This allows us to see how differently sailors respond to the same incentive given various eco-nomic conditions. We make the following assumptions:
Sailors have normally distributed differing tastes for military service.
These tastes can be expressed as a dollar amount of total mili-tary compensation needed to reenlist.
In general, people need to be paid more to reenlist in good ci-vilian economic conditions (when they have high-paying civilian job opportunities) than in poor civilian economic conditions (when they have low-paying civilian job opportunities).
We divide civilian economic conditions into three categories—weak, moderate, and strong—and show the respective reenlistment proba-bilities in the three curves in figure 7. At a fixed level of compensa-tion, the retention rate will be the highest in a weak economy, lowest in a strong economy, and in between in a moderate economy. The black lines in figure 7 denote this fixed level of compensation, and the grey shaded areas to the left of the black lines represent the cor-responding levels of retention.
Now, suppose that total compensation increases (through an increase in SRB, for instance). This is represented by the green vertical lines in figure 7. In this case, the increase in retention (represented by the green shaded area) is greatest in the moderate economy. In a weak economy, most sailors are willing to reenlist at the original compensa-tion level, so the actual change in the level of retention is fairly small. Conversely, in the strong economy, the new SRB picks up only those who have either the most preference for military life or the worst ci-vilian alternatives; the bulk of sailors in this case are still being com-pensated enough by civilian wages to leave the military. Finally, in a moderate economy, the Navy gets the most reenlistments for the in-crease in SRB because in a moderate economy the Navy has the biggest opportunity to sway sailors who are on the margin in their re-tention decision.

34
Figure 7. Compensation change and retention in different economic conditions
One direct implication of the case represented in figure 7 is that heightened responsiveness to new (or increases in existing) SRBs could be an indicator that the economy is moving from weak to moderate and, thus, could be followed by a negative change in the retention climate.17
The relevance of this situation need not be accepted without proof, however. The direct implication can be tested using historical reten-tion data. We separate our dataset into three distinct economic con-ditions based on the unemployment and Treasury rate component discussed earlier. All months that are one standard deviation below
17. It is possible for compensation to be so low that fewer than half of sailors
are willing to reenlist even in a bad economy. It is also possible for com-pensation to be high enough that most sailors are willing to enlist in a moderate economy. In these cases, the conclusions would be different.

35
zero (roughly the worst 17 percent of the months in our sample) are categorized as being in a bad economy. All months that are one standard deviation above zero (roughly the best 17 percent of the months in our sample) are categorized as being in a good economy. The remaining months are categorized as a moderate economy. We keep the same control variables as in our benchmark regressions but now allow the responsiveness to SRB to depend on the state of the economy. We show our results in table 9.
Table 9. Predicted effect of increasing SRB (from a multiplier of 1) on retention
Sailors Weak economy Moderate economy Strong economy
Zone A Men
3.3 4.3 3.6
[3.1, 3.5] [4.2, 4.4] [3.2, 3.9]
Women 3.5 5.4 5.3 [2.7, 4.2] [5.0, 5.7] [4.1, 6.5]
Zone B Men 3.2 3.7 3.3
[2.9, 3.6] [3.4, 3.9] [2.7, 3.9]
Women 3.5 4.2 2.4 [2.0, 5.0] [3.4, 4.9] [-0.5, 5.3]
Point estimates are in bold and represent percentage-point changes. 95% confidence intervals are in brackets.
As predicted, the effect of increasing the SRB multiplier (from a start-ing multiplier of 1) is highest in a moderate economy. This effect is strongest for Zone A men. The estimate in a moderate economy (an average increase in retention of 4.3 percentage points when increas-ing the multiplier by 1) is both larger than and statistically different from the strong economy and weak economy estimates. While some of the strong or weak economy estimates are not statistically different from the moderate economy estimate, the consistent pattern suggests that our predicted phenomenon does, in fact, hold.
The actionable consequence is this: when SRBs are reinstated in re-sponse to an improved civilian economy, attention should be paid to the sensitivity of the response to changes in these SRBs. Average
36
responsiveness that consistently exceeds 3.5 percentage points for men and 4.2 percentage points for women may signal a shift in the economy because these numbers represent the extremes of the 95-percent confidence intervals for a weak economy. When Navy leaders see this shift, they could then increase the SRB further to achieve de-sired retention levels.
Additional recommendation: Keep track of the composition of the force
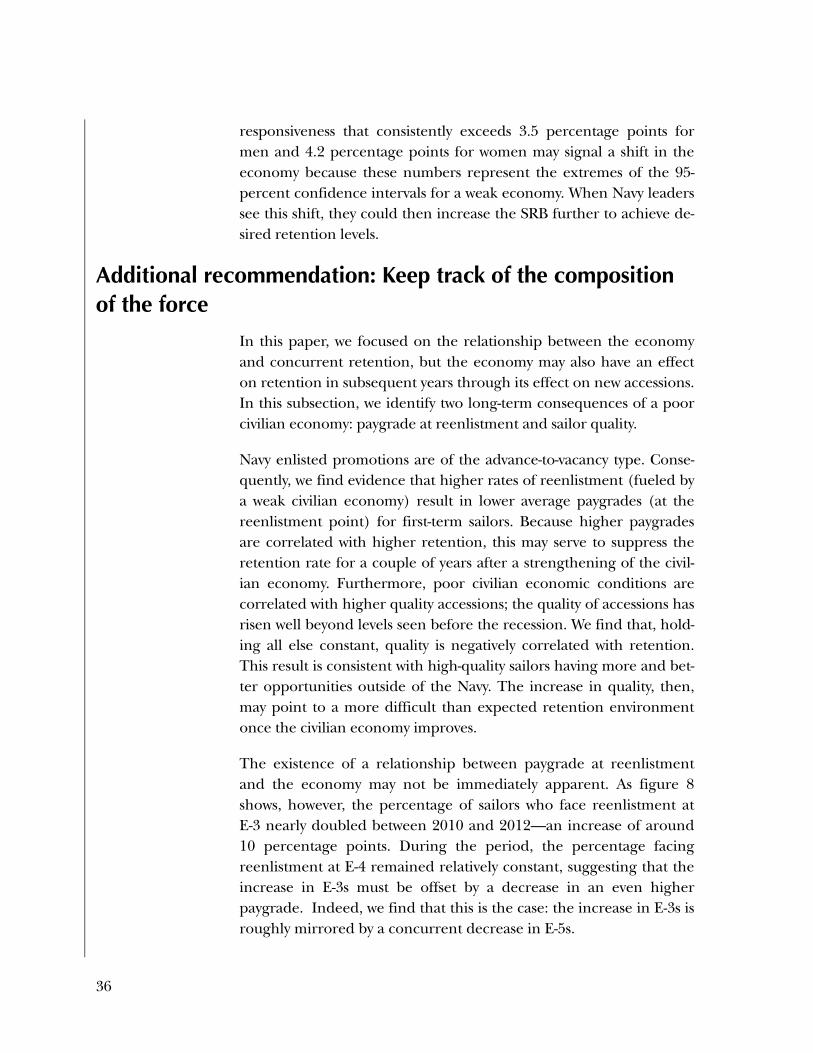
In this paper, we focused on the relationship between the economy and concurrent retention, but the economy may also have an effect on retention in subsequent years through its effect on new accessions. In this subsection, we identify two long-term consequences of a poor civilian economy: paygrade at reenlistment and sailor quality.
Navy enlisted promotions are of the advance-to-vacancy type. Conse-quently, we find evidence that higher rates of reenlistment (fueled by a weak civilian economy) result in lower average paygrades (at the reenlistment point) for first-term sailors. Because higher paygrades are correlated with higher retention, this may serve to suppress the retention rate for a couple of years after a strengthening of the civil-ian economy. Furthermore, poor civilian economic conditions are correlated with higher quality accessions; the quality of accessions has risen well beyond levels seen before the recession. We find that, hold-ing all else constant, quality is negatively correlated with retention. This result is consistent with high-quality sailors having more and bet-ter opportunities outside of the Navy. The increase in quality, then, may point to a more difficult than expected retention environment once the civilian economy improves.
The existence of a relationship between paygrade at reenlistment and the economy may not be immediately apparent. As figure 8 shows, however, the percentage of sailors who face reenlistment at E-3 nearly doubled between 2010 and 2012—an increase of around 10 percentage points. During the period, the percentage facing reenlistment at E-4 remained relatively constant, suggesting that the increase in E-3s must be offset by a decrease in an even higher paygrade. Indeed, we find that this is the case: the increase in E-3s is roughly mirrored by a concurrent decrease in E-5s.

37
Figure 8. Paygrade at the time of reenlistment decision for Zone A men
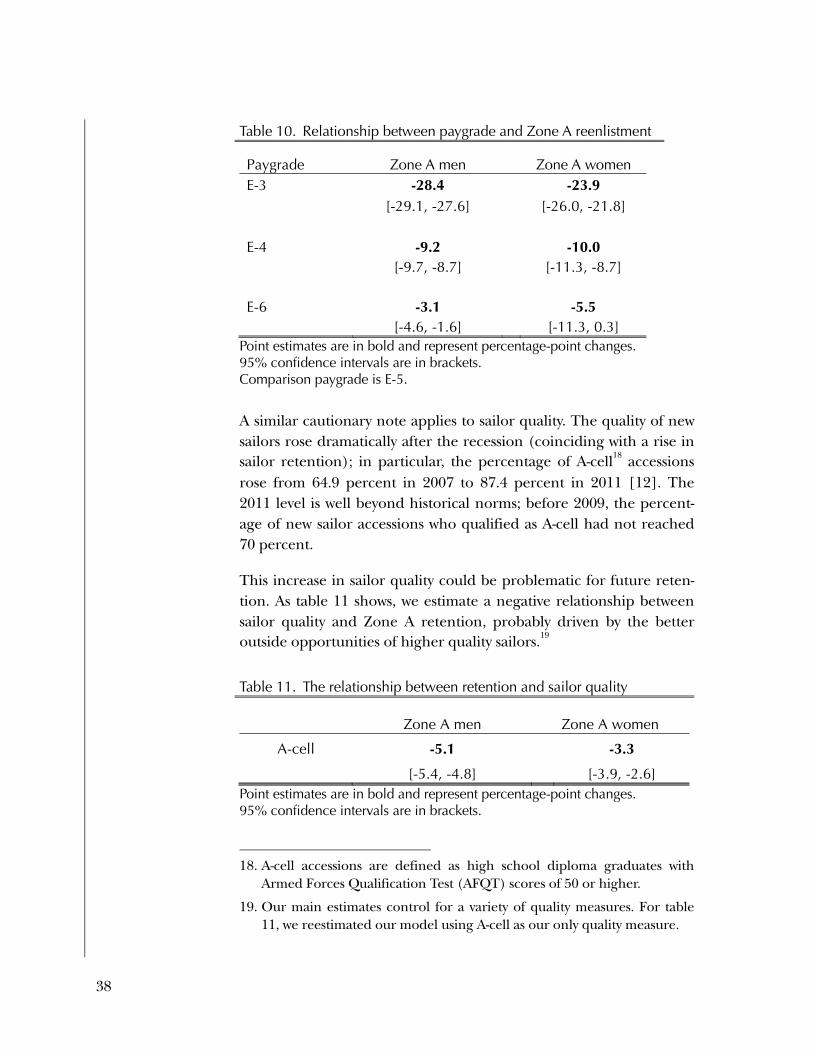
A change in the paygrade distribution need not be problematic for the Navy, however; what matters from a retention perspective is whether this has an ultimate impact on retention. Table 10 shows the estimated relationship between paygrade and reenlistment for Zone A sailors; the reference group includes those whose paygrade is E-5. Note that those who reenlist at E-3 are particularly less likely to reen-list than are those at E-5.
These results suggest a cautionary note for the Navy: a prolonged poor civilian economy may suppress the paygrade distribution of Zone A sailors because higher retention means that fewer “open” ad-vancement slots are available. In turn, this “bottleneck” (combined with minimum time-in-grade requirements for advancements) may mean that more Zone A sailors retain a lower paygrade for a year or more after the civilian economy improves. If so, this would lead to a worse-than-expected retention environment than would be predicted based on the economic conditions at the time.
38
Table 10. Relationship between paygrade and Zone A reenlistment
Paygrade Zone A men Zone A women E-3 -28.4 -23.9
[-29.1, -27.6] [-26.0, -21.8]
E-4 -9.2 -10.0 [-9.7, -8.7] [-11.3, -8.7]
E-6 -3.1 -5.5 [-4.6, -1.6] [-11.3, 0.3]
Point estimates are in bold and represent percentage-point changes. 95% confidence intervals are in brackets. Comparison paygrade is E-5.
A similar cautionary note applies to sailor quality. The quality of new sailors rose dramatically after the recession (coinciding with a rise in sailor retention); in particular, the percentage of A-cell18 accessions rose from 64.9 percent in 2007 to 87.4 percent in 2011 [12]. The 2011 level is well beyond historical norms; before 2009, the percent-age of new sailor accessions who qualified as A-cell had not reached 70 percent.
This increase in sailor quality could be problematic for future reten-tion. As table 11 shows, we estimate a negative relationship between sailor quality and Zone A retention, probably driven by the better outside opportunities of higher quality sailors.19
Table 11. The relationship between retention and sailor quality
Zone A men Zone A women
A-cell -5.1 -3.3
[-5.4, -4.8] [-3.9, -2.6] Point estimates are in bold and represent percentage-point changes. 95% confidence intervals are in brackets.
18. A-cell accessions are defined as high school diploma graduates with
Armed Forces Qualification Test (AFQT) scores of 50 or higher.
19. Our main estimates control for a variety of quality measures. For table 11, we reestimated our model using A-cell as our only quality measure.

39
Combining our estimates from table 11 with observed changes in ac-cession quality shows that a 20-percentage-point increase in A-cell re-cruits equates to roughly a 1-percentage-point decrease in retention for Zone A men. This impact is likely to be delayed to a greater ex-tent than the changes in paygrade mix: 2010 accessions are unlikely to make their Zone A reenlistment decisions until 2014 or 2015, with their Zone B reenlistment decisions coming even later. If the civilian economy has improved enough that widespread use of SRBs is war-ranted, this represents a costly consequence for the Navy.
Current estimates of the relationship between quality and retention may serve as a best-case scenario. Those high-quality recruits who en-listed in the Navy after the recession (and would not have done so otherwise) may be even less likely to reenlist. If there were recruits who joined the Navy in a poor economy but would not have in a stronger economy, they may have a lower taste for military service than earlier recruits. If so, this lower taste for reenlistment would be combined with the typical strong outside options for A-cell sailors, re-sulting in a more difficult than expected retention environment.
As we have discussed, these two issues—the paygrade of those making reenlistment decisions and the quality of recent Navy accessions—are of concern to the Navy. Recent changes in these characteristics (which are likely attributable to the poor civilian economy) may cause lower than expected retention once the civilian economy re-covers. If so, the need to moderate the fall in retention may result in greater levels of SRB and, thus, greater than expected costs to the Navy.
Conclusion
To summarize, we demonstrated that the unemployment rate is not a sufficient measure of the economy. However, we also showed that the 11 BCEI variables can be used, in a distilled fashion, to capture the effect of the economy on retention. And, we’ve illustrated how Navy leadership can use the BCEI, as well as other gauges, as summaries of external conditions to monitor when changes in the state of the civil-ian economy may necessitate adjustments of Navy retention levers.

40
References [1] M. S. Goldberg. New Estimates of the Effect of Unemployment on
Enlisted Retention. CNA Research Memorandum 85-51. Jul. 1985.
[2] S. E. Carrell. "The National Internal Labor Market Encounters the Local Labor Market: Effects in Employee Retention." Labour Economics 14, no. 5, Oct. 2007: 774–787.
[3] D. S. Lien and D. Gregory. Estimation and Evaluation of Unemployment Rate and Bonuses on Navy Selected Reserve Retention. CNA Research Memorandum D0025078.A1/Final. May 2011.
[4] J. T. Warner and B. J. Asch. "The Economics of Military Manpower." In K. Hartley and T. Sandler, eds., Handbook of Defense Economics, Volume 1. New York: Elsevier Science, 1995 (pp. 347–398).
[5] B. J. Asch, J. R. Hosek, and J. T. Warner. "New Economics of Manpower in the Post-Cold War Era." In T. Sandler and K. Hartley, eds., Handbook of Defense Economics, Volume 2: Defense in a Globalized World. Amsterdam, The Netherlands: Elsevier, 2007 (pp. 1075–1138).
[6] M. S. Goldberg and J. T. Warner. Determinants of Navy Reenlistment and Extension Rates. CNA Research Contribution 476. Dec. 1982.
[7] M. L. Hansen and J. W. Wenger. Why Do Pay Elasticity Estimates Differ? CNA Research Memorandum D0005644.A2/Final. Mar. 2002.
[8] C. J. Simon, S. Negrusa, and J. T. Warner. "Educational Benefits and Military Service: An Analysis of Enlistment, Reenlistment, and Veterans' Benefit Usage 1991–2005." Economic Inquiry 48, no. 4, Oct. 2010: 1008–1031.

41
[9] D. A. Smith, S. D. Sylwester, and C. M. Villa. "Army Reenlistment Models." In C. L. Gilroy, D. K. Horne, and D. A. Smith, eds., Military Compensation and Personnel Retention: Models and Evidence. Alexandria, VA: Army Research Institute, 1991 (pp. 43-173).
[10] D. S. Lien and C. M. McHugh. How Does Sea Duty Affect First-Term Reenlistment? An Analysis Using Post-9/11 Data. CNA Research Memorandum D0013608.A2/Final. May 2006.
[11] R. J. Buddin. Success of First-Term Soldiers: The Effects of Recruiting Practices and Recruit Characteristics. RAND Monograph MG-262-A. 2005.
[12] Office of the Under Secretary of Defense, Personnel and Readiness, 2012. Last accessed Jan. 30, 2014, at http:// prhome.defense.gov/rfm/MPP/ACCESSION%20POLICY/ PopRep2011.

42
List of figures Figure 1. Initial unemployment claims and unemployment rate .... 11
Figure 2. Labor force participation and job openings ...................... 12
Figure 3. The normalized unemployment rate and the unemployment and Treasury rate component ................ 18
Figure 4. The labor force participation rate and the unemployment and Treasury rate component ................ 19
Figure 5. Principal components with projections ............................. 20
Figure 6. Zone A retention in bellwether ratings .............................. 32
Figure 7. Compensation change and retention in different economic conditions ........................................................... 34
Figure 8. Paygrade at the time of reenlistment decision for Zone A men .......................................................................... 37

43
This page intentionally left blank

44
List of tables Table 1. Correlation between the unemployment rate and
other economic variables .................................................... 16
Table 2. Resulting principal components and variable loadings ... 17
Table 3. The economy and Zone A retention .................................. 23
Table 4. Relationship between the unemployment and Treasury rate component and retention ............................ 24
Table 5. Did PTS affect Zone A estimates? ....................................... 25
Table 6. The economy and Zone B retention .................................. 27
Table 7. Did PTS affect Zone B estimates? ....................................... 27
Table 8. Using the unemployment and Treasury rate principal component to anticipate changes in retention ................. 30
Table 9. Predicted effect of increasing SRB (from a multiplier of 1) on retention ................................................................ 35
Table 10. Relationship between paygrade and Zone A reenlistment .......................................................................... 38
Table 11. The relationship between retention and sailor quality .... 38

45
This page intentionally left blank


3003 Washington Boulevard ● Arlington, VA 22201
DRM-2014-U-007301-Final


![v OF THE IMPACT OF 'PEOPLE ENLISTED PE..(U) RESOURCES ... · 7 rd- a±]2l 665 analysis of the impact of 'people programs' upon v retention of enlisted pe..(u) resources research corp](https://img.dokumen.tips/doc/110x75/5ebabf027943b3338f29af7a/v-of-the-impact-of-people-enlisted-peu-resources-7-rd-a2l-665-analysis.jpg)