Embed Size (px)
Citation preview
Chapter TwoThe economic impacts of climate change mitigation policy
The EBRD region will have to play an important role in global efforts to mitigate climate change. But what are the likely costs and the potential benefits for the transition region, when embarking on ambitious climate change mitigation policies? Chapter 2 analyses the likely range of macroeconomic effects, alongside the structural changes that will be required to set the region’s economies on a decarbonisation path. Selected social implications of climate change mitigation policies are also discussed.
20
2
21
Chapter Two
The economic impacts of climate change mitigation policy
The world needs to reduce global emissions of greenhouse gases (GHGs) sharply and rapidly if the risks associated with human-induced climate change are to be kept under control. The speed with which emissions fall will determine the ultimate rise in global temperatures.
At the UN Climate Change Conference in Cancún in 2010, countries agreed that deep cuts in global greenhouse gas emissions are required as documented in the Fourth Assessment Report of the Inter-governmental Panel on Climate Change (IPCC), to reduce global greenhouse gas emissions so as to hold the increase in global average temperature below 2°C above pre-industrial levels, and that Parties should take urgent action to meet this goal. Global emissions currently stand at around 48 gigatonnes of CO2 equivalent (GtCO2e) per year. Judging by the projected relationship between cumulative GHG emissions and the probabilities of global temperature increases, this requires that global emissions peak before 2020, fall back to 40-48 GtCO2e per year by 2020 and continue to fall, to between 6 and 17 GtCO2e per year by 2050.1
Achieving significant and lasting reductions in GHG emissions on this scale requires policy actions on several fronts by all countries with significant levels of emissions, including those in the EBRD region. Without policy intervention, the incentives facing emitters and users of GHG-intensive products to change their behaviour will be inadequate. In most countries, emitters do not bear the social cost of GHG emissions; social returns for the development of low-emission technologies often exceed their private returns; and incomplete information and other barriers stand in the way of realising energy-saving opportunities.
If policy-makers start to take action now, it would allow a more measured response, early capture of various co-benefits of climate-change mitigation such as reduced local air pollution, and the timely reallocation of resources from the types of capital accumulation and innovation rendered inappropriate by the need to switch to low-GHG growth paths. Early action could position the EBRD region well in the energy-industrial revolution that the decarbonisation of the global economy is expected to bring. Instead of being in a catch-up situation, the EBRD region can and should propel itself to the forefront of technological progress in the green economy.
The required policy actions are likely to have significant economic consequences for transition countries. These include impacts
1 Bowen and Ranger (2009). The emission trajectories estimated would give a 50 per cent probability of keeping the global temperature change to 2°C or less.
2 Income after considering the effects of inflation on purchasing power.
on the value of aggregate output, the balance between consumption and investment over time, real wages,2 trade patterns, relative prices, the relative performance of different industry sectors, and long-run growth. Some of these impacts are likely to affect different households’ well-being differently.
This chapter reviews the likely economic consequences of ambitious long-term climate change mitigation targets in the EBRD region. It starts by drawing out some of the general lessons of the economic literature on climate change mitigation. It then considers what economic models suggest about the macroeconomic impacts in the EBRD regions. Next, it investigates some of the sectoral implications, drawing on results from a specially commissioned analysis using the World Induced Technical Change Hybrid (WITCH) integrated assessment model. Lastly, the chapter reviews some of the possible social implications of climate change policy for EBRD countries.
Model results such as those presented here are useful to highlight trends, sensitivities and the relative importance of different economic factors in understanding the costs of mitigation. The actual numerical results should, however, be viewed as illustrative only. Furthermore, they illustrate only of the trade-offs that are captured in the model. As a result, the interpretation of the results is almost as important as the results themselves, and will be a focus of discussion in this chapter.
Economic analysis of climate change mitigation
Modelling mitigation costsMacroeconomic modelling of climate change policy has tended to focus on the likely direct and indirect costs of reducing GHG emissions, and the structural changes in economies needed to minimise those costs. Costs are likely to be incurred for at least two classes of reasons.
First, “making the polluter pay” implies higher prices (relative to incomes), for three reasons:
• The price placed on GHG emissions increases costs for producers that buy GHG-intensive goods and services as inputs, and for consumers.
• The greater expense of such products is likely to induce some technology switching by producers, for example from carbon-intensive fossil fuels to renewable energy sources. These newly adopted low-GHG technologies are likely to be less efficient, at least initially, implying lower overall productivity.
• Consumers switch, to some extent, towards less GHG-intensive products, driving up their prices in turn.
Second, switching technologies entails the scrapping of some GHG-intensive plants, equipment and buildings, and new investment in capital that embodies low-GHG alternatives. For example, the International Energy Agency (IEA) has estimated that incremental energy-related investment of around US$10.5 trillion will be required between 2010 and 2030 (IEA, 2009). This additional investment may either crowd out consumption,
22

Special Report on Climate Change
thereby reducing well-being directly, or other investment, reducing future consumption opportunities.
Together these channels imply that climate change mitigation measures may have much the same effect as an adverse supply shock (for example, a sudden hike in the oil price) if introduced very rapidly. By sharply changing relative prices, for example introducing carbon pricing and inducing changes in the pattern of investment, mitigation measures risk disrupting economies and creating unemployment.
At the same time, it is important to underline that modeling mitigation policy like a “supply shock” constitutes a simplification which will tend to overestimate the costs and underestimate the benefits of mitigation policy, particularly in resource-rich countries in which legacies of wasteful energy use continue to exist, such as in the transition region.
For one, macroeconomic models generally assume that resources are fully utilised and allocated in a cost-minimising way. Hence, these models cannot capture the benefits of bringing into use idle workers or resources. They also do not capture mitigation through energy efficiency improvements that pay for themselves. However, bottom-up calculations suggest that the potential for such improvements could be very significant in the transition region (see Chapter 3).
In addition, the models do not take acount of the fact that climate change mitigation can generate significant co-benefits, such as reduced particulate pollution. Reducing GHG emissions in line with a 2oC global scenario would reduce air pollution control costs in Russia by US$2.2 billion per year by 2030, a reduction of 16 per cent relative to the reference scenario. The reduction for the new European Union (EU) member states would be around 7 per cent, and around 5 per cent for the rest of the transition region (IIASA, 2009).
Tackling other barriers inhibiting decarbonisation can also generate co-benefits. This is demonstrated by efforts to resolve the information and incentive problems that lead to inefficient and excessive use of energy.
Perhaps most importantly, de-carbonisation policies may increase long-run growth, through several channels. In many countries with large fossil fuel sectors, the dependence on these sectors is widely regarded as a growth obstacle, rather than a boon. This “resource curse”, which operates through both macroeconomic and institutional channels, is likely to apply particularly in countries with weaker institutional environments, which are typical for the transition region (see EBRD, 2009, Chapter 4). By creating incentives for reducing the size and economic significance of the natural resource sectors, climate change mitigation may also mitigate the “resource curse”, allow other sectors to develop, and help these countries attain higher growth in the long run.
Policies designed to encourage innovation in low-carbon technologies may also stimulate innovation and growth more widely. This possibility underpins the arguments of advocates of “green growth” strategies. A carbon-free economy will require a wholesale transformation of the technologies that underpin modern
economies today and this process of technological change may provide economic opportunities on the scale of an energy-industrial revolution. Countries and regions that fail to participate in this process may forego economic opportunities of historical proportions.
Top-down and bottom-up approachesFew quantitative studies have tried to capture all these aspects of climate change mitigation. Integrated assessment models have focused on the general equilibrium macroeconomic adjustments necessary. This “top-down” approach tends to emphasise the productivity, sectoral change and investment effects, with simplified representations of technological choice.
Recent modelling work of this kind has concentrated on the question of how much it would cost to keep the expected global temperature rise below the 2°C limit. Some have concluded that this would be infeasible3 while others have estimated that it would cost between 1 and 5 per cent of GDP per year.4 Clarke et al. (2009) have shown that the feasibility of achieving stringent climate policies depends to a significant degree on the architecture of international agreements and the commitment of developing countries. Tavoni and Tol (2010) have emphasised the role of negative emission technologies and highlighted the uncertainty associated with their large-scale deployment.
An alternative, “bottom-up” approach has looked in more detail at technological options for reducing the GHG content of a wide range of activities. The possibilities are summarised in the form of an “abatement cost curve” that describes the costs of mitigation measures for various sectors of the economy.5 Bottom-up approaches tend to pay less attention to economy-wide feedbacks such as interactions with labour and other markets, but pay more attention to the scope for correcting inefficient energy use. This has led to such studies usually suggesting that climate change mitigation is cheaper than top-down models project. McKinsey (2009a) concludes that “if the most economically rational abatement opportunities are pursued to their full potential … the total worldwide cost could be €200-350 billion annually by 2030”. This would amount to less than 1 per cent of annual gross world product. Chapter 3 investigates abatement cost curves for Russia and Turkey.
These studies provide important lessons for assessing the costs of climate change policy in the EBRD region. They draw attention to the importance of the stringency of the policy goal in determining costs. They also identify the other key factors that affect costs (and feasibility), which differ across countries. These factors include:
• the likely rate of growth of GHG emissions under “business as usual”. EBRD countries have the potential to grow more rapidly than the Organisation for Economic Co-operation and Development (OECD) countries.6 Faster economic growth will make any given emissions target more costly to hit and require faster improvements in carbon intensity.
• the resources devoted to innovation and the intellectual property rights regimes governing technology transfer. Some EBRD countries have insufficiently developed intellectual property rights regimes, judging by patenting arrangements.7 This may discourage rapid “green” technology transfers to EBRD countries.
3 See, for example, Tol (2009).4 See, for example, Knopf et al. (2009); Rao et al. (2008); Edenhofer et al. (2009).5 See, for example, McKinsey (2009a) and Chapter 3 of this report.6 See EBRD Transition Report 2010.7 See World Bank (2009).
23
Chapter Two The economic impacts of climate change mitigation policy
• the scope for demand-side adjustments by consumers and purchasers of inputs to production. EBRD countries have great opportunities to improve energy efficiency (even before considering changing the pattern of final production or substituting other inputs for energy). They have already taken advantage of this route to lower emissions in their efforts to modernise industry after the collapse of central planning (see Chapter 1), but substantial inefficiencies remain.8
• the level of energy subsidies. Many EBRD countries continue to have high rates of energy subsidies – energy-rich countries stand out. By correcting the distortions induced by subsidies, the net costs of emission-reduction policies will be reduced. International trade in emission-reduction permits would also help to correct distortions from this source.
• whether marginal abatement costs are equalised across firms, sectors (including – importantly – land use) and countries. Variations in marginal costs increase the overall cost of hitting any given target. Equalisation depends on policy design and is more likely to be achieved if policy results in a broadly uniform carbon price across the economy. At this point, energy subsidies in several EBRD countries are differentiated significantly by sector.9
• the response of labour markets. If labour is immobile among industry sectors and real wages are slow to adjust, climate change policies are likely to create sector-specific unemployment, especially in the energy sectors and energy-intensive industry.10 However, in situations where aggregate demand is inadequate, climate-change policies could create extra jobs and reduce unemployment by stimulating low-carbon investment.11
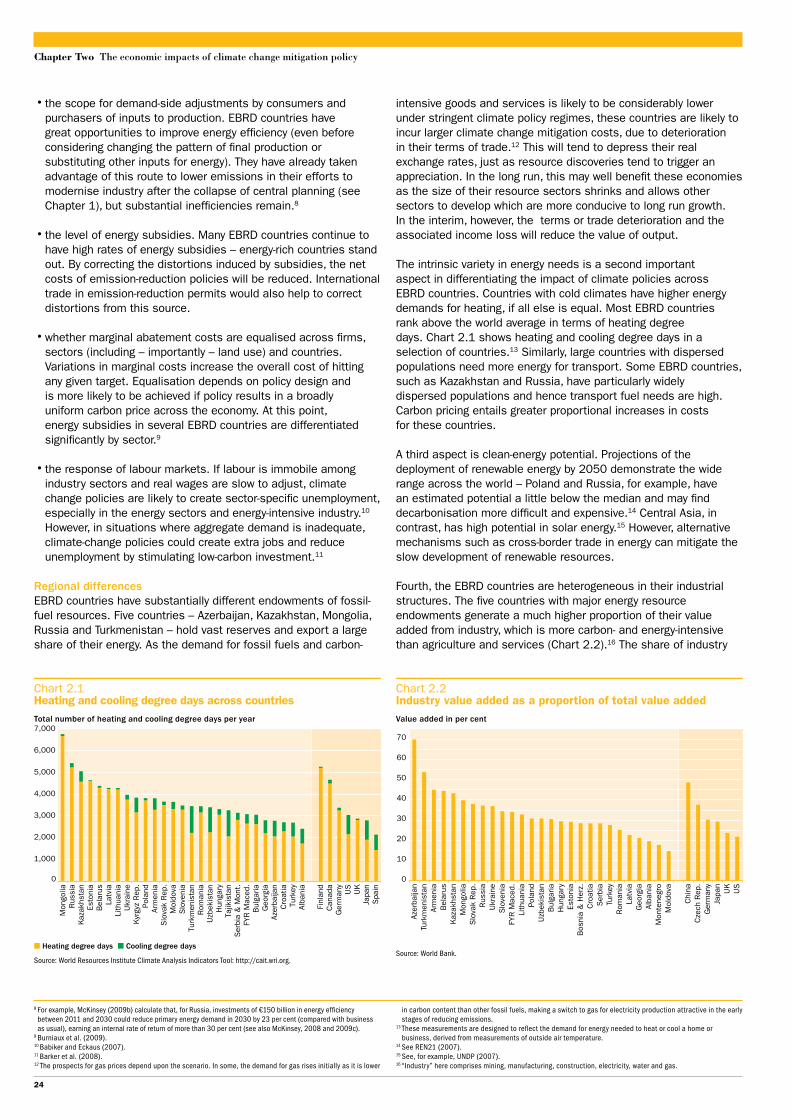
Regional differencesEBRD countries have substantially different endowments of fossil-fuel resources. Five countries – Azerbaijan, Kazakhstan, Mongolia, Russia and Turkmenistan – hold vast reserves and export a large share of their energy. As the demand for fossil fuels and carbon-
intensive goods and services is likely to be considerably lower under stringent climate policy regimes, these countries are likely to incur larger climate change mitigation costs, due to deterioration in their terms of trade.12 This will tend to depress their real exchange rates, just as resource discoveries tend to trigger an appreciation. In the long run, this may well benefit these economies as the size of their resource sectors shrinks and allows other sectors to develop which are more conducive to long run growth. In the interim, however, the terms or trade deterioration and the associated income loss will reduce the value of output.
The intrinsic variety in energy needs is a second important aspect in differentiating the impact of climate policies across EBRD countries. Countries with cold climates have higher energy demands for heating, if all else is equal. Most EBRD countries rank above the world average in terms of heating degree days. Chart 2.1 shows heating and cooling degree days in a selection of countries.13 Similarly, large countries with dispersed populations need more energy for transport. Some EBRD countries, such as Kazakhstan and Russia, have particularly widely dispersed populations and hence transport fuel needs are high. Carbon pricing entails greater proportional increases in costs for these countries.
A third aspect is clean-energy potential. Projections of the deployment of renewable energy by 2050 demonstrate the wide range across the world – Poland and Russia, for example, have an estimated potential a little below the median and may find decarbonisation more difficult and expensive.14 Central Asia, in contrast, has high potential in solar energy.15 However, alternative mechanisms such as cross-border trade in energy can mitigate the slow development of renewable resources.
Fourth, the EBRD countries are heterogeneous in their industrial structures. The five countries with major energy resource endowments generate a much higher proportion of their value added from industry, which is more carbon- and energy-intensive than agriculture and services (Chart 2.2).16 The share of industry
Chart 2.1Heating and cooling degree days across countries
Source: World Resources Institute Climate Analysis Indicators Tool: http://cait.wri.org.
Total number of heating and cooling degree days per year
0
1,000
2,000
3,000
4,000
5,000
6,000
7,000
Mon
golia
Rus
sia
Kaz
akhs
tan
Esto
nia
Bel
arus
Latv
iaLi
thua
nia
Ukr
aine
Kyr
gyz
Rep
.Po
land
Arm
enia
Slo
vak
Rep
.M
oldo
vaS
love
nia
Turk
men
ista
nR
oman
iaU
zbek
ista
nH
unga
ryTa
jikis
tan
Ser
bia
& M
ont.
FYR
Mac
ed.
Bul
garia
Geo
rgia
Azer
baija
nC
roat
iaTu
rkey
Alba
nia
Finl
and
Can
ada
Ger
man
yU
SU
KJa
pan
Spa
in
■ Heating degree days ■ Cooling degree days
Chart 2.2Industry value added as a proportion of total value added
Source: World Bank.
Value added in per cent
0
10
20
30
40
50
60
70
Azer
baija
nTu
rkm
enis
tan
Arm
enia
Bel
arus
Kaz
akhs
tan
Mon
golia
Slo
vak
Rep
.R
ussi
aU
krai
neS
love
nia
FYR
Mac
ed.
Lith
uani
aPo
land
Uzb
ekis
tan
Bul
garia
Hun
gary
Esto
nia
Bos
nia
& H
erz.
Cro
atia
Ser
bia
Turk
eyR
oman
iaLa
tvia
Geo
rgia
Alba
nia
Mon
tene
gro
Mol
dova
Chi
naC
zech
Rep
.G
erm
any
Japa
nU
KU
S
8 For example, McKinsey (2009b) calculate that, for Russia, investments of €150 billion in energy efficiency between 2011 and 2030 could reduce primary energy demand in 2030 by 23 per cent (compared with business as usual), earning an internal rate of return of more than 30 per cent (see also McKinsey, 2008 and 2009c).
9 Burniaux et al. (2009).10 Babiker and Eckaus (2007).11 Barker et al. (2008).12 The prospects for gas prices depend upon the scenario. In some, the demand for gas rises initially as it is lower
in carbon content than other fossil fuels, making a switch to gas for electricity production attractive in the early stages of reducing emissions.
13 These measurements are designed to reflect the demand for energy needed to heat or cool a home or business, derived from measurements of outside air temperature.
14 See REN21 (2007).15 See, for example, UNDP (2007).16 “Industry” here comprises mining, manufacturing, construction, electricity, water and gas.
24
Special Report on Climate Change
in value added in 2008 was, on average, just under 49 per cent in these countries, compared with 31 per cent for the new EU member states (very close to the average over all countries) and 28 per cent for the other EBRD countries. As a yardstick for comparison, the figures for the US and China are 21.8 per cent and 48.6 per cent, respectively.
Macroeconomic impacts on EBRD countries
The EBRD region as a whole is considerably more carbon-intensive per unit of GDP than the world, as described in Chapter 1. Many countries in the region have an economy based on fossil-fuel energy. Because of this, the economic impacts of climate change mitigation policy on EBRD countries could be larger, particularly in the absence of structural shifts away from the energy-based economy. If transition countries are to narrow the gap in income per head compared with the advanced economies, while adhering to ambitious international climate policy goals, their future growth
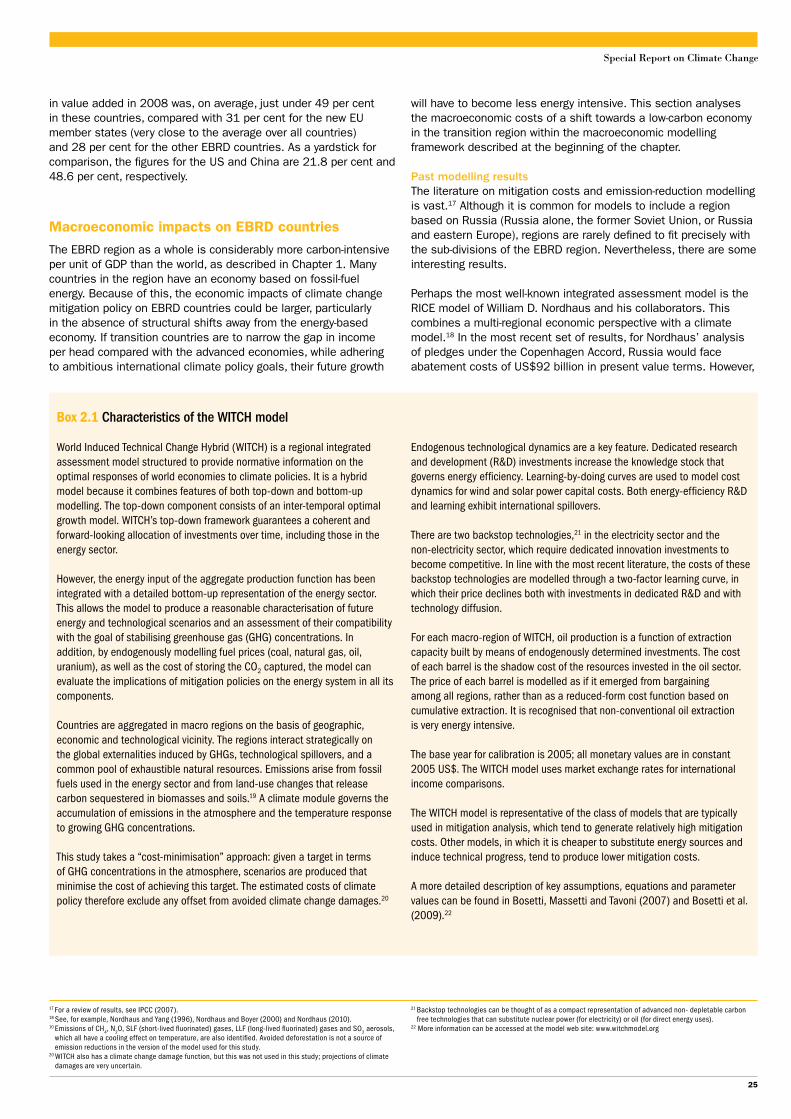
Box 2.1 Characteristics of the WITCH model
World Induced Technical Change Hybrid (WITCH) is a regional integrated assessment model structured to provide normative information on the optimal responses of world economies to climate policies. It is a hybrid model because it combines features of both top-down and bottom-up modelling. The top-down component consists of an inter-temporal optimal growth model. WITCH’s top-down framework guarantees a coherent and forward-looking allocation of investments over time, including those in the energy sector.
However, the energy input of the aggregate production function has been integrated with a detailed bottom-up representation of the energy sector. This allows the model to produce a reasonable characterisation of future energy and technological scenarios and an assessment of their compatibility with the goal of stabilising greenhouse gas (GHG) concentrations. In addition, by endogenously modelling fuel prices (coal, natural gas, oil, uranium), as well as the cost of storing the CO2 captured, the model can evaluate the implications of mitigation policies on the energy system in all its components.
Countries are aggregated in macro regions on the basis of geographic, economic and technological vicinity. The regions interact strategically on the global externalities induced by GHGs, technological spillovers, and a common pool of exhaustible natural resources. Emissions arise from fossil fuels used in the energy sector and from land-use changes that release carbon sequestered in biomasses and soils.19 A climate module governs the accumulation of emissions in the atmosphere and the temperature response to growing GHG concentrations.
This study takes a “cost-minimisation” approach: given a target in terms of GHG concentrations in the atmosphere, scenarios are produced that minimise the cost of achieving this target. The estimated costs of climate policy therefore exclude any offset from avoided climate change damages.20
Endogenous technological dynamics are a key feature. Dedicated research and development (R&D) investments increase the knowledge stock that governs energy efficiency. Learning-by-doing curves are used to model cost dynamics for wind and solar power capital costs. Both energy-efficiency R&D and learning exhibit international spillovers.
There are two backstop technologies,21 in the electricity sector and the non-electricity sector, which require dedicated innovation investments to become competitive. In line with the most recent literature, the costs of these backstop technologies are modelled through a two-factor learning curve, in which their price declines both with investments in dedicated R&D and with technology diffusion.
For each macro-region of WITCH, oil production is a function of extraction capacity built by means of endogenously determined investments. The cost of each barrel is the shadow cost of the resources invested in the oil sector. The price of each barrel is modelled as if it emerged from bargaining among all regions, rather than as a reduced-form cost function based on cumulative extraction. It is recognised that non-conventional oil extraction is very energy intensive.
The base year for calibration is 2005; all monetary values are in constant 2005 US$. The WITCH model uses market exchange rates for international income comparisons.
The WITCH model is representative of the class of models that are typically used in mitigation analysis, which tend to generate relatively high mitigation costs. Other models, in which it is cheaper to substitute energy sources and induce technical progress, tend to produce lower mitigation costs.
A more detailed description of key assumptions, equations and parameter values can be found in Bosetti, Massetti and Tavoni (2007) and Bosetti et al. (2009).22
will have to become less energy intensive. This section analyses the macroeconomic costs of a shift towards a low-carbon economy in the transition region within the macroeconomic modelling framework described at the beginning of the chapter.
Past modelling resultsThe literature on mitigation costs and emission-reduction modelling is vast.17 Although it is common for models to include a region based on Russia (Russia alone, the former Soviet Union, or Russia and eastern Europe), regions are rarely defined to fit precisely with the sub-divisions of the EBRD region. Nevertheless, there are some interesting results.
Perhaps the most well-known integrated assessment model is the RICE model of William D. Nordhaus and his collaborators. This combines a multi-regional economic perspective with a climate model.18 In the most recent set of results, for Nordhaus’ analysis of pledges under the Copenhagen Accord, Russia would face abatement costs of US$92 billion in present value terms. However,
17 For a review of results, see IPCC (2007).18 See, for example, Nordhaus and Yang (1996), Nordhaus and Boyer (2000) and Nordhaus (2010).10 Emissions of CH4, N2O, SLF (short-lived fluorinated) gases, LLF (long-lived fluorinated) gases and SO2 aerosols,
which all have a cooling effect on temperature, are also identified. Avoided deforestation is not a source of emission reductions in the version of the model used for this study.
20 WITCH also has a climate change damage function, but this was not used in this study; projections of climate damages are very uncertain.
21 Backstop technologies can be thought of as a compact representation of advanced non- depletable carbon free technologies that can substitute nuclear power (for electricity) or oil (for direct energy uses).
22 More information can be accessed at the model web site: www.witchmodel.org
25

Chapter Two The economic impacts of climate change mitigation policy
may be needed to encourage the region to participate in international action.
It is important to point out that these models simplify in several respects, as discussed at the beginning of this chapter. In particular, they assume optimising behaviour by economic decision-makers and do not incorporate market failures that result in unexploited energy-efficiency improvements with a positive social net present value (“free lunches”), even without any consideration of averted climate damages or carbon pricing. Bottom-up studies, such as those discussed in Chapter 3, argue that such opportunities are available. In addition, these models ignore the possibility that long run growth may increase as a result of climate change mitigation policies.
EBRD region-specific modelling using the WITCH modelTo explore the potential macroeconomic and sectoral impacts of global climate change policies on the EBRD countries, the EBRD commissioned a study from the Euro-Mediterranean Centre for Climate Change using the WITCH integrated assessment model. WITCH is a macro-economic model whose distinguishing features are the modelling of endogenous technical progress in energy technologies and a game theoretic set-up that allows for multiple externalities, including innovation market failures due to knowledge spillovers across countries. The key features of the WITCH model are described in Box 2.1.
To account for the likely differentiated effects due to fossil-fuel resource endowments, the study split the EBRD region 25 into three sub-regions:
• new EU member states (EU-10): the nine EU members of the EBRD region and the Czech Republic
• Transition Economies Energy Exporters (TEEX), which are all net energy exporters 26
these costs would be more than offset by the benefits from averted climate change damages and, more significantly, permit sales, which alone are estimated to be worth US$176 billion up to 2055.23 One reason for the relatively low abatement costs is that Nordhaus assumes a relatively low growth rate for Russia’s net national income, with an annual average of 1.73 per cent between 2005 and 2055, compared with a world average of 2.79 per cent.
Other studies24 also find a large potential for cheap emission reductions in Russia, often linked to the country’s huge biomass potential. But Russia (together with the Middle East and the US) will suffer worsened terms of trade related to its carbon-intensive exports. Russia loses large rents on fossil fuels in all policy scenarios described by Leimbach et al. (2009). This would increase its mitigation costs (consumption losses relative to the reference scenario) above 5 per cent of GDP, despite the fact that global losses average only around 1.5 per cent. The OECD (2009) agrees that Russia could lose from mitigation, both as a carbon-intensive economy and as a fossil-fuel producer. However, it expects Russia to benefit from permit trading, while mitigation costs for the other EBRD countries are also high.
The picture becomes more nuanced if the impacts of climate change are factored in. Burniaux et al. (2009) find that under a high-damages, low-discount-rate scenario, the new EU member states are likely to gain from global action by the middle of this century (an increase in consumption of around 0.8 per cent relative to business as usual), as averted climate damages outweigh the costs of mitigation. But the rest of the transition region, including Russia, still suffers a loss of around 2.7 per cent of business-as-usual consumption (the largest loss of any region except Africa).
Overall, the studies reinforce the point that the allocation of the global abatement burden is important, and that international transfers (for example, in the form of generous permit allocations)
Chart 2.4Estimated emission reduction paths relative to business as usual
Source: WITCH and EBRD.
GtCO2e
20
05
20
10
20
15
20
20
20
25
20
30
20
35
20
40
20
45
20
50
20
55
20
60
20
65
20
70
20
75
20
80
20
85
20
90
20
95
21
00
0.0
1.0
2.0
3.0
4.0
5.0
6.0
7.0
8.0
9.0
EBRD BaU EBRD 500-80 EU-10 BaU EU-10 500-80TENEX BaU TENEX 500-80 TEEX BaU TEEX 500-80
23 The qualitative results are similar for Nordhaus’ Eurasia region, which contains EBRD’s Central Asia countries and some of the European ones, among others.
24 For example, Knopf et al. (2009) and Leimbach et al. (2009).25 Bulgaria, Estonia, Hungary, Latvia, Lithuania, Poland, Romania, Slovak Republic, Slovenia.26 Azerbaijan, Kazakhstan, Mongolia, Russia and Turkmenistan.
27 Albania, Armenia, Belarus, Bosnia and Herzegovina, Croatia, Georgia, Kyrgyz Republic, FYR Macedonia, Moldova, Montenegro, Serbia, Tajikistan, Turkey, Ukraine, Uzbekistan.
28 Although slightly more lenient than the 450 ppm CO2e often discussed in policy debates, the 500 ppm scenario provides a slightly less than 50:50 chance of keeping warming below 2°C. This is similar to most of the paths currently under consideration. The IPCC’s “best guess” for the resultant global temperature increase
Chart 2.3Estimated gross GDP loss ranges relative to business as usual
Source: WITCH and EBRD.Note: The points denote mitigation scenarios with respect to the EBRD region’s mitigation targets, delays in the
availability of CCS technology and restrictions on carbon trading. WEURO - Western Europe; MENA - Middle East and North Africa; SSA - Sub-Saharan Africa; SASIA - South Asia, including India; LACA - Latin America, Mexico and the Caribbean.500-30, 500-40, 500-50, 500-80 - 30, 40, 50 and 80 per cent emission reduction target for the TEEX region only in the context of a global 500 ppm stabilisation target. 500-80 delayed CCS - a delay in the availability of CCS technology of 15 years. 500-80 limited trade - only 20 per cent of the carbon emission reduction can be imported from other regions and at least 80 per cent needs to be generated domestically in all world regions.In all scenarios US, WEURO, EU-10, TENEX have an 80 per cent emission reduction target. A discount rate of 5 per cent is used to derive the net present value.
Percentage of business as usual GDP in net present value (2010-2050)
■ 500-30 ■ 500-40 ■ 500-50 ■ 500-80 ■ 500-80 delayed CCS ■ 500-80 limited trade Median cost
-14%
-12%
-10%
-8%
-6%
-4%
-2%
0%
USA WEURO MENA SSA SASIA CHINA LACA EBRD WORLD
26
Special Report on Climate Change
Chart 2.3 shows the range of estimated GDP losses across the scenarios examined for different regions, compared with the hypothetical business-as-usual case, i.e. no emission-reduction targets and no climate change.
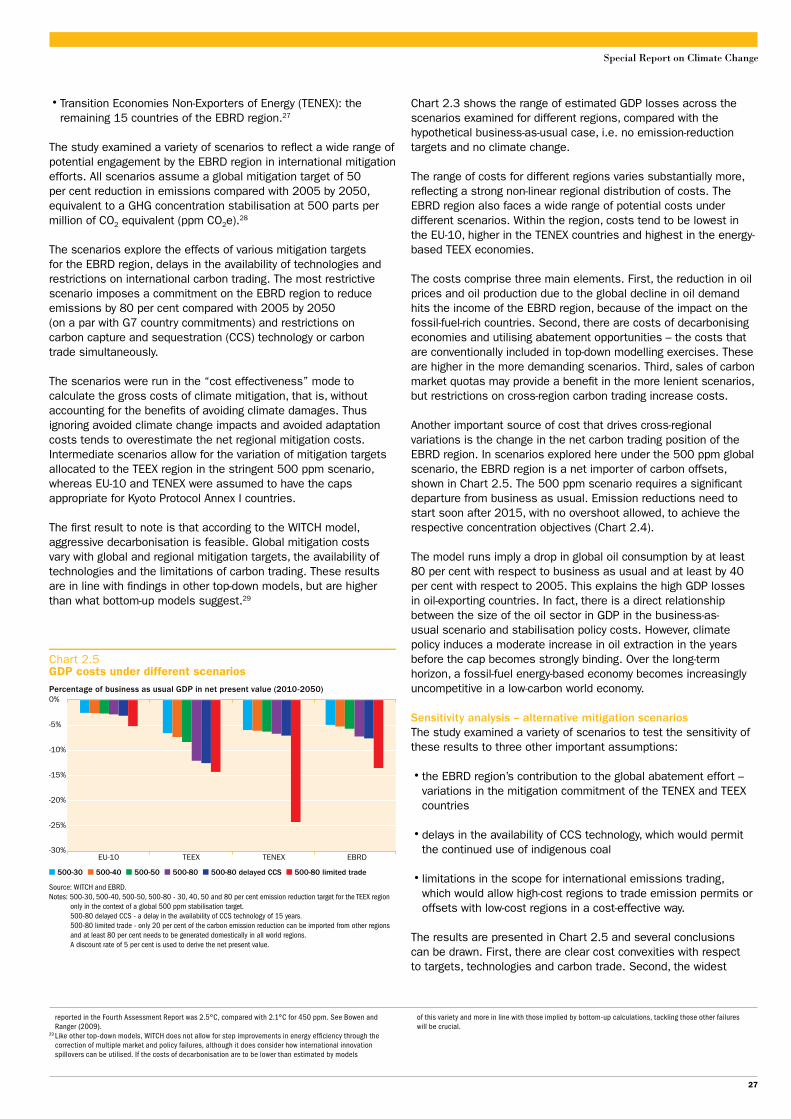
The range of costs for different regions varies substantially more, reflecting a strong non-linear regional distribution of costs. The EBRD region also faces a wide range of potential costs under different scenarios. Within the region, costs tend to be lowest in the EU-10, higher in the TENEX countries and highest in the energy-based TEEX economies.
The costs comprise three main elements. First, the reduction in oil prices and oil production due to the global decline in oil demand hits the income of the EBRD region, because of the impact on the fossil-fuel-rich countries. Second, there are costs of decarbonising economies and utilising abatement opportunities – the costs that are conventionally included in top-down modelling exercises. These are higher in the more demanding scenarios. Third, sales of carbon market quotas may provide a benefit in the more lenient scenarios, but restrictions on cross-region carbon trading increase costs.
Another important source of cost that drives cross-regional variations is the change in the net carbon trading position of the EBRD region. In scenarios explored here under the 500 ppm global scenario, the EBRD region is a net importer of carbon offsets, shown in Chart 2.5. The 500 ppm scenario requires a significant departure from business as usual. Emission reductions need to start soon after 2015, with no overshoot allowed, to achieve the respective concentration objectives (Chart 2.4).
The model runs imply a drop in global oil consumption by at least 80 per cent with respect to business as usual and at least by 40 per cent with respect to 2005. This explains the high GDP losses in oil-exporting countries. In fact, there is a direct relationship between the size of the oil sector in GDP in the business-as-usual scenario and stabilisation policy costs. However, climate policy induces a moderate increase in oil extraction in the years before the cap becomes strongly binding. Over the long-term horizon, a fossil-fuel energy-based economy becomes increasingly uncompetitive in a low-carbon world economy.
Sensitivity analysis – alternative mitigation scenariosThe study examined a variety of scenarios to test the sensitivity of these results to three other important assumptions:
• the EBRD region’s contribution to the global abatement effort – variations in the mitigation commitment of the TENEX and TEEX countries
• delays in the availability of CCS technology, which would permit the continued use of indigenous coal
• limitations in the scope for international emissions trading, which would allow high-cost regions to trade emission permits or offsets with low-cost regions in a cost-effective way.
The results are presented in Chart 2.5 and several conclusions can be drawn. First, there are clear cost convexities with respect to targets, technologies and carbon trade. Second, the widest
• Transition Economies Non-Exporters of Energy (TENEX): the remaining 15 countries of the EBRD region.27
The study examined a variety of scenarios to reflect a wide range of potential engagement by the EBRD region in international mitigation efforts. All scenarios assume a global mitigation target of 50 per cent reduction in emissions compared with 2005 by 2050, equivalent to a GHG concentration stabilisation at 500 parts per million of CO2 equivalent (ppm CO2e).28
The scenarios explore the effects of various mitigation targets for the EBRD region, delays in the availability of technologies and restrictions on international carbon trading. The most restrictive scenario imposes a commitment on the EBRD region to reduce emissions by 80 per cent compared with 2005 by 2050 (on a par with G7 country commitments) and restrictions on carbon capture and sequestration (CCS) technology or carbon trade simultaneously.
The scenarios were run in the “cost effectiveness” mode to calculate the gross costs of climate mitigation, that is, without accounting for the benefits of avoiding climate damages. Thus ignoring avoided climate change impacts and avoided adaptation costs tends to overestimate the net regional mitigation costs. Intermediate scenarios allow for the variation of mitigation targets allocated to the TEEX region in the stringent 500 ppm scenario, whereas EU-10 and TENEX were assumed to have the caps appropriate for Kyoto Protocol Annex I countries.
The first result to note is that according to the WITCH model, aggressive decarbonisation is feasible. Global mitigation costs vary with global and regional mitigation targets, the availability of technologies and the limitations of carbon trading. These results are in line with findings in other top-down models, but are higher than what bottom-up models suggest.29
Chart 2.5GDP costs under different scenariosPercentage of business as usual GDP in net present value (2010-2050)
■ 500-30 ■ 500-40 ■ 500-50 ■ 500-80 ■ 500-80 delayed CCS ■ 500-80 limited trade
-25%
-30%
-20%
-15%
-10%
-5%
0%
EU-10 TEEX TENEX EBRD
Source: WITCH and EBRD.Notes: 500-30, 500-40, 500-50, 500-80 - 30, 40, 50 and 80 per cent emission reduction target for the TEEX region
only in the context of a global 500 ppm stabilisation target.500-80 delayed CCS - a delay in the availability of CCS technology of 15 years. 500-80 limited trade - only 20 per cent of the carbon emission reduction can be imported from other regions and at least 80 per cent needs to be generated domestically in all world regions. A discount rate of 5 per cent is used to derive the net present value.
reported in the Fourth Assessment Report was 2.5°C, compared with 2.1°C for 450 ppm. See Bowen and Ranger (2009).
29 Like other top-down models, WITCH does not allow for step improvements in energy efficiency through the correction of multiple market and policy failures, although it does consider how international innovation spillovers can be utilised. If the costs of decarbonisation are to be lower than estimated by models
of this variety and more in line with those implied by bottom-up calculations, tackling those other failures will be crucial.
27
Chapter Two The economic impacts of climate change mitigation policy
Chart 2.6 summarises the economic impact of the different scenarios, providing a decomposition of the net present value of predicted economic losses to the EBRD region from 2005 to 2055. The overall GDP loss is split into foregone oil revenues, the costs of buying (or the profit from selling) carbon offsets, and the domestic costs of abatement (allowing for the benefits from international technology spillovers).
Chart 2.6 shows that the oil GDP loss is similar across scenarios. This follows from the fact that oil consumption is reduced significantly across all mitigation scenarios, given that global emissions are always significantly reduced. However, the economic impact of allowing international permit trading varies greatly across scenarios, given that net trading positions depend on regional levels of commitments. The domestic costs increase with the stringency of the mitigation goal, and are particularly high when carbon trading is restricted and the objective is ambitious, in which case they dominate the total policy cost. In the earlier periods (such as 2030), and for the milder scenarios only, the domestic costs are slightly negative because the benefits of the international technology spillovers outweigh the initially flat marginal abatement costs.
variation is generated by restrictions on carbon trading, which almost double the costs in percentage of GDP when all other parameters are held constant. Third, costs are non-linear in relation to the regional mitigation targets; this is most apparent for the energy-rich TEEX countries. Lastly, costs are larger for energy-based economies and increase the more decarbonised the world economy becomes. A more lenient mitigation target may have higher GDP costs in the TEEX region than an almost total decarbonisation of the EU-10 region in the ambitious global scenarios of 500 ppm.
The availability of CCS technology could affect mitigation costs in the transition region, given the abundant coal reserves there. In the main scenario, it was assumed that CCS would be available from the outset and meaningful scale deployment starts by about 2025. Delaying the arrival of CCS until 2040 would raise the price of emission allowances in 2025 by 17 per cent in the 500 ppm scenario. However, the relative penalty decreases over time. Overall, a delay in the deployment of CCS by 10 to 15 years would not hamper the ability of the EBRD region to comply with the low-carbon scenarios, but would increase costs.
Trading restrictions would affect the EU-10 and the TENEX region most heavily, as they are more actively involved in trading. TEEX would use most of its quotas itself, particularly under stringent emission-reduction and burden-sharing scenarios. However, oil exporters would be indirectly affected because delaying the use of international offsets also reduces global oil consumption. World regions that would have bought offsets would instead have to reduce emissions domestically and will further cut the use of fossil fuels.
Trade restrictions will also affect the global carbon price. In 2025 the price of emission allowances will be about 85 per cent lower than without trade restrictions. This is because the limit on global trading will affect the demand for allowances on the global market (from the world regions that have high marginal abatement costs) but not directly the supply of allowances (from the low-cost regions). The restrictions will decouple the carbon price from marginal abatement costs in all world regions.
Chart 2.6Decomposition of mitigation costs in the EBRD region
Source: WITCH and EBRD calculations.
Percentage of business as usual GDP in net present value (2010-2050)
■ Oil GDP loss ■ Offsets ■ Domestic costs increases ● GDP loss
50
0-3
0
50
0-4
0
50
0-5
0
50
0-8
0
50
0-8
0C
CS
50
0-8
0LT
-16
-14
-12
-10
-8
-6
-4
-2
0
2
Chart 2.7Oil production in the EBRD region
Source: WITCH.
Billion barrels
500-80 delayed CCS 500-80 limited trade
0.0
1.0
2.0
3.0
4.0
5.0
6.0
7.0
8.0
9.0
20
05
20
10
20
15
20
20
20
25
20
30
20
35
20
40
20
45
20
50
20
55
20
60
20
65
20
70
20
75
BaU 500-30 500-40 500-50 500-80
Table 2.1 The share of total GHG emissions in the EBRD region, world and OECD region
Source EBRD World OECD
Total energy 82.4 64.4 81.6
Electricity production and heat 38.2 28 34.2
Manufacturing and construction 12.4 11.9 11.4
Transport 9.6 12.2 20.9
Other fuel 11 8.5 12.1
Fugitive emissions 11.2 4 3
Industrial processes 2.8 4.2 4.3
Agriculture 8.8 13.8 8.1
Land-use change and forestry 2 12.2 0.1
Waste 3.3 3.2 2.6
Bunkers 0.7 2.1 3.2
Source: World Resources Institute Climate Analysis Indicators Tool (WRI CAIT).30
Note: Bunkers include the use of fuel in international maritime transport and international aviation.
30 http://cait.wri.org
28
Special Report on Climate Change
The main changes will be in energy systems. The largest share of GHG emissions in the EBRD region (as in the world as a whole) derives from the use of energy to provide electricity and heat (Table 2.1). This is particularly the case for the EU-10 and TEEX. The share accounted for by the use of energy in manufacturing and construction is also higher than average, especially in the TENEX region.
Energy for transport is also important, although noticeably less so (especially in TENEX) than in the developed countries of the OECD. Fugitive emissions (linked to gas pipeline leaks and the venting of associated gas) make a significantly larger contribution than they do in the rest of the world. Agriculture contributes fewer GHG emissions proportionally than in the rest of the world except in TENEX, while land-use change and forestry are also smaller contributors than in the world as a whole. The following sub-sections consider some of the transformations that will be necessary in the key sectors.
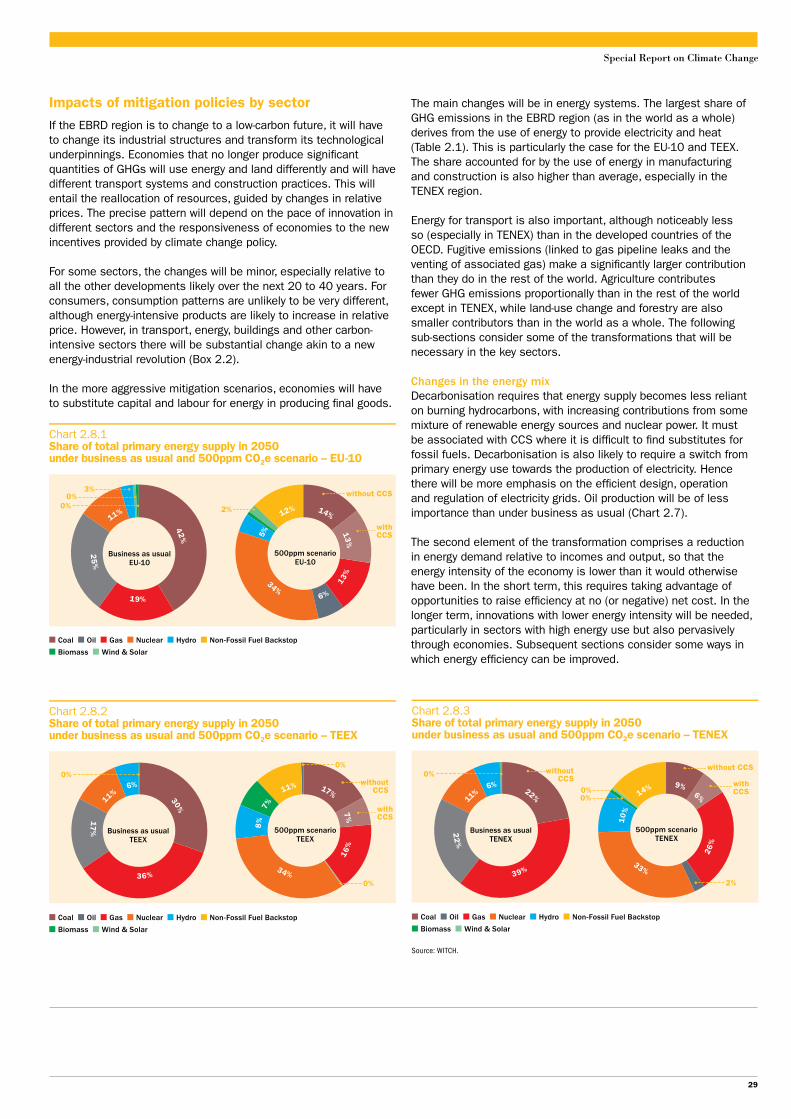
Changes in the energy mixDecarbonisation requires that energy supply becomes less reliant on burning hydrocarbons, with increasing contributions from some mixture of renewable energy sources and nuclear power. It must be associated with CCS where it is difficult to find substitutes for fossil fuels. Decarbonisation is also likely to require a switch from primary energy use towards the production of electricity. Hence there will be more emphasis on the efficient design, operation and regulation of electricity grids. Oil production will be of less importance than under business as usual (Chart 2.7).
The second element of the transformation comprises a reduction in energy demand relative to incomes and output, so that the energy intensity of the economy is lower than it would otherwise have been. In the short term, this requires taking advantage of opportunities to raise efficiency at no (or negative) net cost. In the longer term, innovations with lower energy intensity will be needed, particularly in sectors with high energy use but also pervasively through economies. Subsequent sections consider some ways in which energy efficiency can be improved.
Chart 2.8.1Share of total primary energy supply in 2050under business as usual and 500ppm CO2e scenario – EU-10
Source: WITCH and EBRD.
■ Coal ■ Oil ■ Gas ■ Nuclear ■ Hydro ■ Non-Fossil Fuel Backstop
■ Biomass ■ Wind & Solar
11% 42%
5%
12% 14% 13%
34% 6% 1
3%
25
% 19%
Business as usualEU-10
500ppm scenarioEU-10
0%0%
3%
2%
without CCS
withCCS
Chart 2.8.2Share of total primary energy supply in 2050under business as usual and 500ppm CO2e scenario – TEEX
Source: WITCH and EBRD.
■ Coal ■ Oil ■ Gas ■ Nuclear ■ Hydro ■ Non-Fossil Fuel Backstop
■ Biomass ■ Wind & Solar
0%
0%
0%
11% 6
% 30%
8%
7
%
11% 17% 7%
34%
16%
1
7%
36%
Business as usualTEEX
500ppm scenarioTEEX
withoutCCS
withCCS
Source: WITCH.
Chart 2.8.3Share of total primary energy supply in 2050under business as usual and 500ppm CO2e scenario – TENEX
Source: WITCH and EBRD.
withCCS
■ Coal ■ Oil ■ Gas ■ Nuclear ■ Hydro ■ Non-Fossil Fuel Backstop
■ Biomass ■ Wind & Solar
0%
2%
11% 6
% 22%
10%
14% 9% 6%
33%
26
%
2
2%
39%
Business as usualTENEX
500ppm scenarioTENEX
0%0%
withoutCCS
without CCS
Impacts of mitigation policies by sector
If the EBRD region is to change to a low-carbon future, it will have to change its industrial structures and transform its technological underpinnings. Economies that no longer produce significant quantities of GHGs will use energy and land differently and will have different transport systems and construction practices. This will entail the reallocation of resources, guided by changes in relative prices. The precise pattern will depend on the pace of innovation in different sectors and the responsiveness of economies to the new incentives provided by climate change policy.
For some sectors, the changes will be minor, especially relative to all the other developments likely over the next 20 to 40 years. For consumers, consumption patterns are unlikely to be very different, although energy-intensive products are likely to increase in relative price. However, in transport, energy, buildings and other carbon-intensive sectors there will be substantial change akin to a new energy-industrial revolution (Box 2.2).
In the more aggressive mitigation scenarios, economies will have to substitute capital and labour for energy in producing final goods.
29
Chapter Two The economic impacts of climate change mitigation policy
Changes in technology and the use of process by-products instead of conventional fuels have significant potential for negative-cost emission reductions in iron and steel (Box 2.3). The cement industry is another sector where huge improvements could be made cheaply or even at a profit. Russian cement production currently uses 50 per cent more primary energy per tonne produced than German cement production.
Aggressive climate policies around the world are likely to raise the relative prices of the most carbon-intensive industrial products and discourage their use. This makes it imperative that EBRD countries reduce the carbon content of currently carbon-intensive industrial products in which they have a comparative advantage. This will also mitigate the relative price increase. The most carbon-intensive products include mineral fuels, oil and distillation products, fertilisers, aluminium, paper, cement, inorganic chemicals, iron and steel.
A measure of “revealed comparative advantage” compares the share of a product in a country’s gross exports with the share of the same product in the rest of the world’s gross exports, using a measure running from 1 (when the given country is responsible for all of the product’s exports) to -1 (when the country exports none of the product). Using this method, nine EBRD countries score more than 0.3 for fertilisers, 15 for iron and steel, 16 for cement, four for inorganic chemicals, six for mineral fuels and distillates, and eight for aluminium. Only in the paper industry is no EBRD country a major exporter.
TransportTransport is the third-largest source of CO2 emissions in the transition region after energy and industry, and emission levels have grown faster than in all other sectors in the past decade. Road transport accounts for 88.5 per cent of transport-related CO2 emissions and air transport accounts for roughly 5.6 per cent. Some studies (for example, McKinsey, 2009b) suggest that without dedicated abatement measures, transport-related GHG emissions
In the simulations reported in the previous section, the importance of oil and other fossil fuels falls relative to the business-as-usual scenario, with significant implications for GDP, the domestic energy mix (Chart 2.8), employment and the allocation of investment.
Chart 2.8 demonstrates the impact of a demanding stabilisation target. For the EU-10, TEEX and TENEX regions, the chart shows the projected primary energy mix in 2050 under business as usual and under the 500 ppm target, with all transition countries taking on an 80 per cent reduction target.
Primary energy supply is much lower in the 500-80 ppm scenario (by 45 per cent, 39 per cent and 48 per cent respectively for EU-10, TEEX and TENEX). Oil supply is much lower, while renewables and nuclear power accounts for a much greater share. Coal’s share is still significant, partly because of the use of CCS. Under business as usual, there is virtually no use of CCS, but in the 500-80 ppm scenario, much of the coal used is combined with CCS (29 per cent in TEEX, 39 per cent in TENEX and 48 per cent in the EU-10 by 2050).
In the WITCH study, conventional renewable energy sources may play a smaller part in decarbonisation over this time horizon than nuclear power, but backstop technologies are important. Biomass plays some part in decarbonisation in the TEEX region, where Russia in particular has scope to increase the use of managed forests, and hydroelectricity is a larger share of a smaller total supply. But the big increases in the contribution of biomass will arrive in the second half of the century. Gas declines a little in importance but still accounts for a major share. WITCH does not envisage a significant contribution from wind and solar power in TEEX and TENEX, even by the end of the century. Hence the WITCH model suggests that the route to decarbonisation in the EBRD region will be through the expansion of CCs, nuclear power and backstop technologies.31
However, other studies suggest that there is a greater potential from renewables, even in the short to medium term.32 The new EU member states agreed targets for renewable energy by 2020 as part of their accession packages. Russia could increase the share of renewables in total power production from less than 1 per cent to over 6 per cent by 2030.33
The low-emissions scenarios will require aggressive policy action including, but not restricted to, strong carbon pricing. Otherwise, the scenarios with a larger contribution from renewables will be too costly compared with the alternatives. The replacement of obsolete plants (which has already happened in the new EU states as part of their preparation for EU membership) provides a good opportunity to improve energy efficiency in energy production sharply, as well as to adjust the mix of energy sources.
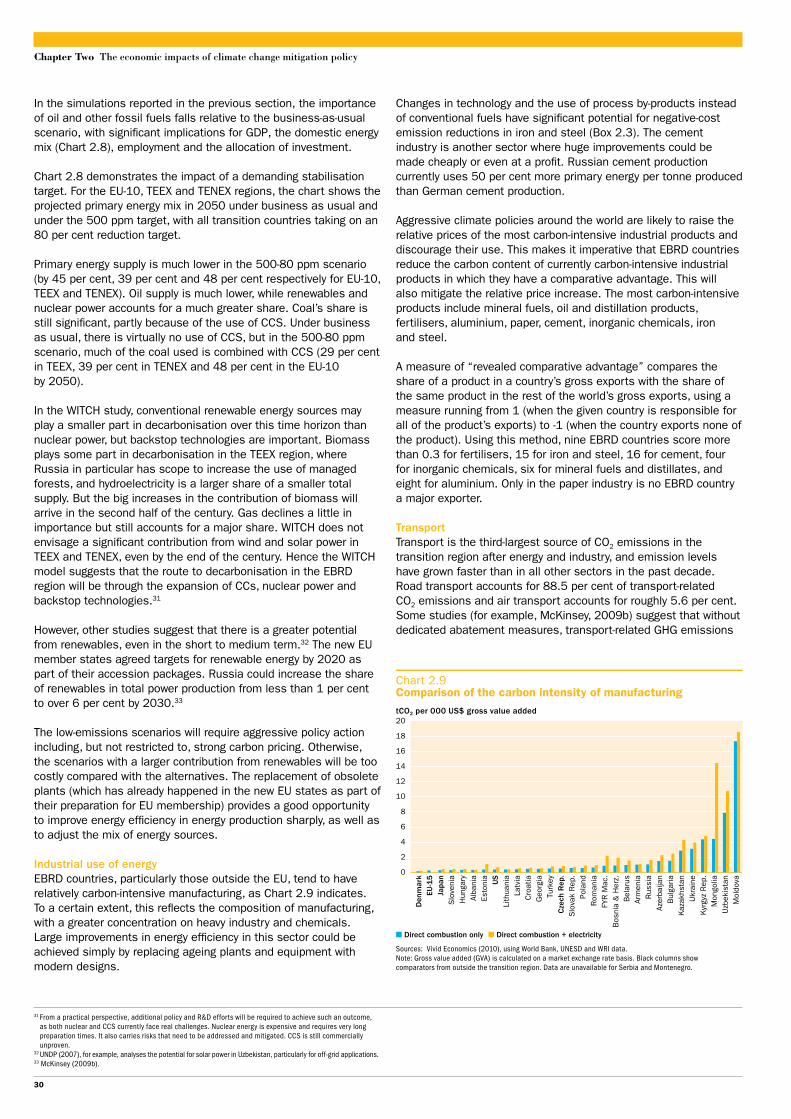
Industrial use of energyEBRD countries, particularly those outside the EU, tend to have relatively carbon-intensive manufacturing, as Chart 2.9 indicates. To a certain extent, this reflects the composition of manufacturing, with a greater concentration on heavy industry and chemicals. Large improvements in energy efficiency in this sector could be achieved simply by replacing ageing plants and equipment with modern designs.
Chart 2.9Comparison of the carbon intensity of manufacturing
Sources: Vivid Economics (2010), using World Bank, UN Economic and Social Development and WRI data. Note: Gross value added is calculated on a market exchange rate basis. Black columns show comparators from outside the transition region. Data are unavailable for Serbia and Montenegro.
tCO2 per 000 US$ gross value added
■ Direct combustion only ■ Direct combustion + electricity
0
2
4
6
8
10
12
14
16
18
20
Den
mar
kEU
-15
Japa
nS
love
nia
Hun
gary
Alba
nia
Esto
nia
US
Lith
uani
aLa
tvia
Cro
atia
Geo
rgia
Turk
eyCze
ch R
ep.
Slo
vak
Rep
.Po
land
Rom
ania
FYR
Mac
.B
osni
a &
Her
z.B
elar
usAr
men
iaR
ussi
aAz
erba
ijan
Bul
garia
Kaz
akhs
tan
Ukr
aine
Kyr
gyz
Rep
.M
ongo
liaU
zbek
ista
nM
oldo
va
Sources: Vivid Economics (2010), using World Bank, UNESD and WRI data. Note: Gross value added (GVA) is calculated on a market exchange rate basis. Black columns show comparators from outside the transition region. Data are unavailable for Serbia and Montenegro.
31 From a practical perspective, additional policy and R&D efforts will be required to achieve such an outcome, as both nuclear and CCS currently face real challenges. Nuclear energy is expensive and requires very long preparation times. It also carries risks that need to be addressed and mitigated. CCS is still commercially unproven.
32 UNDP (2007), for example, analyses the potential for solar power in Uzbekistan, particularly for off-grid applications.33 McKinsey (2009b).
30
Special Report on Climate Change
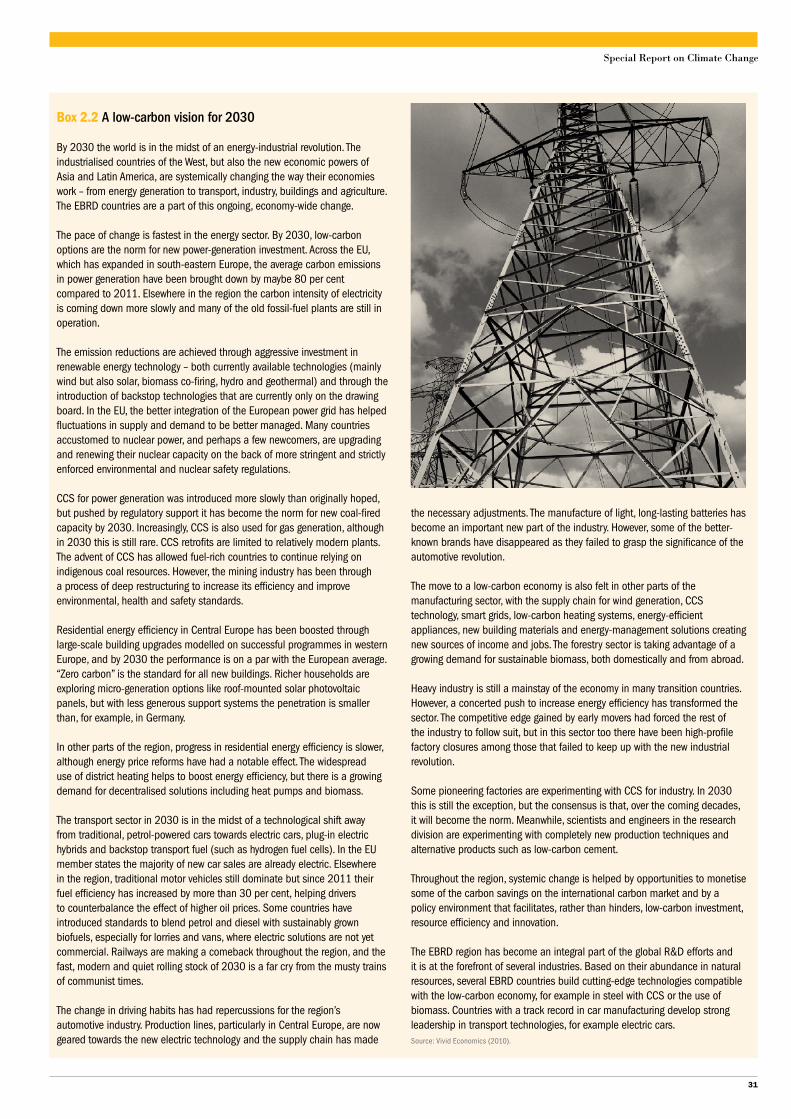
Box 2.2 A low-carbon vision for 2030
By 2030 the world is in the midst of an energy-industrial revolution. The industrialised countries of the West, but also the new economic powers of Asia and Latin America, are systemically changing the way their economies work – from energy generation to transport, industry, buildings and agriculture. The EBRD countries are a part of this ongoing, economy-wide change.
The pace of change is fastest in the energy sector. By 2030, low-carbon options are the norm for new power-generation investment. Across the EU, which has expanded in south-eastern Europe, the average carbon emissions in power generation have been brought down by maybe 80 per cent compared to 2011. Elsewhere in the region the carbon intensity of electricity is coming down more slowly and many of the old fossil-fuel plants are still in operation.
The emission reductions are achieved through aggressive investment in renewable energy technology – both currently available technologies (mainly wind but also solar, biomass co-firing, hydro and geothermal) and through the introduction of backstop technologies that are currently only on the drawing board. In the EU, the better integration of the European power grid has helped fluctuations in supply and demand to be better managed. Many countries accustomed to nuclear power, and perhaps a few newcomers, are upgrading and renewing their nuclear capacity on the back of more stringent and strictly enforced environmental and nuclear safety regulations.
CCS for power generation was introduced more slowly than originally hoped, but pushed by regulatory support it has become the norm for new coal-fired capacity by 2030. Increasingly, CCS is also used for gas generation, although in 2030 this is still rare. CCS retrofits are limited to relatively modern plants. The advent of CCS has allowed fuel-rich countries to continue relying on indigenous coal resources. However, the mining industry has been through a process of deep restructuring to increase its efficiency and improve environmental, health and safety standards.
Residential energy efficiency in Central Europe has been boosted through large-scale building upgrades modelled on successful programmes in western Europe, and by 2030 the performance is on a par with the European average. “Zero carbon” is the standard for all new buildings. Richer households are exploring micro-generation options like roof-mounted solar photovoltaic panels, but with less generous support systems the penetration is smaller than, for example, in Germany.
In other parts of the region, progress in residential energy efficiency is slower, although energy price reforms have had a notable effect. The widespread use of district heating helps to boost energy efficiency, but there is a growing demand for decentralised solutions including heat pumps and biomass.
The transport sector in 2030 is in the midst of a technological shift away from traditional, petrol-powered cars towards electric cars, plug-in electric hybrids and backstop transport fuel (such as hydrogen fuel cells). In the EU member states the majority of new car sales are already electric. Elsewhere in the region, traditional motor vehicles still dominate but since 2011 their fuel efficiency has increased by more than 30 per cent, helping drivers to counterbalance the effect of higher oil prices. Some countries have introduced standards to blend petrol and diesel with sustainably grown biofuels, especially for lorries and vans, where electric solutions are not yet commercial. Railways are making a comeback throughout the region, and the fast, modern and quiet rolling stock of 2030 is a far cry from the musty trains of communist times.
The change in driving habits has had repercussions for the region’s automotive industry. Production lines, particularly in Central Europe, are now geared towards the new electric technology and the supply chain has made
the necessary adjustments. The manufacture of light, long-lasting batteries has become an important new part of the industry. However, some of the better-known brands have disappeared as they failed to grasp the significance of the automotive revolution.
The move to a low-carbon economy is also felt in other parts of the manufacturing sector, with the supply chain for wind generation, CCS technology, smart grids, low-carbon heating systems, energy-efficient appliances, new building materials and energy-management solutions creating new sources of income and jobs. The forestry sector is taking advantage of a growing demand for sustainable biomass, both domestically and from abroad.
Heavy industry is still a mainstay of the economy in many transition countries. However, a concerted push to increase energy efficiency has transformed the sector. The competitive edge gained by early movers had forced the rest of the industry to follow suit, but in this sector too there have been high-profile factory closures among those that failed to keep up with the new industrial revolution.
Some pioneering factories are experimenting with CCS for industry. In 2030 this is still the exception, but the consensus is that, over the coming decades, it will become the norm. Meanwhile, scientists and engineers in the research division are experimenting with completely new production techniques and alternative products such as low-carbon cement.
Throughout the region, systemic change is helped by opportunities to monetise some of the carbon savings on the international carbon market and by a policy environment that facilitates, rather than hinders, low-carbon investment, resource efficiency and innovation.
The EBRD region has become an integral part of the global R&D efforts and it is at the forefront of several industries. Based on their abundance in natural resources, several EBRD countries build cutting-edge technologies compatible with the low-carbon economy, for example in steel with CCS or the use of biomass. Countries with a track record in car manufacturing develop strong leadership in transport technologies, for example electric cars. Source: Vivid Economics (2010).
31
Chapter Two The economic impacts of climate change mitigation policy
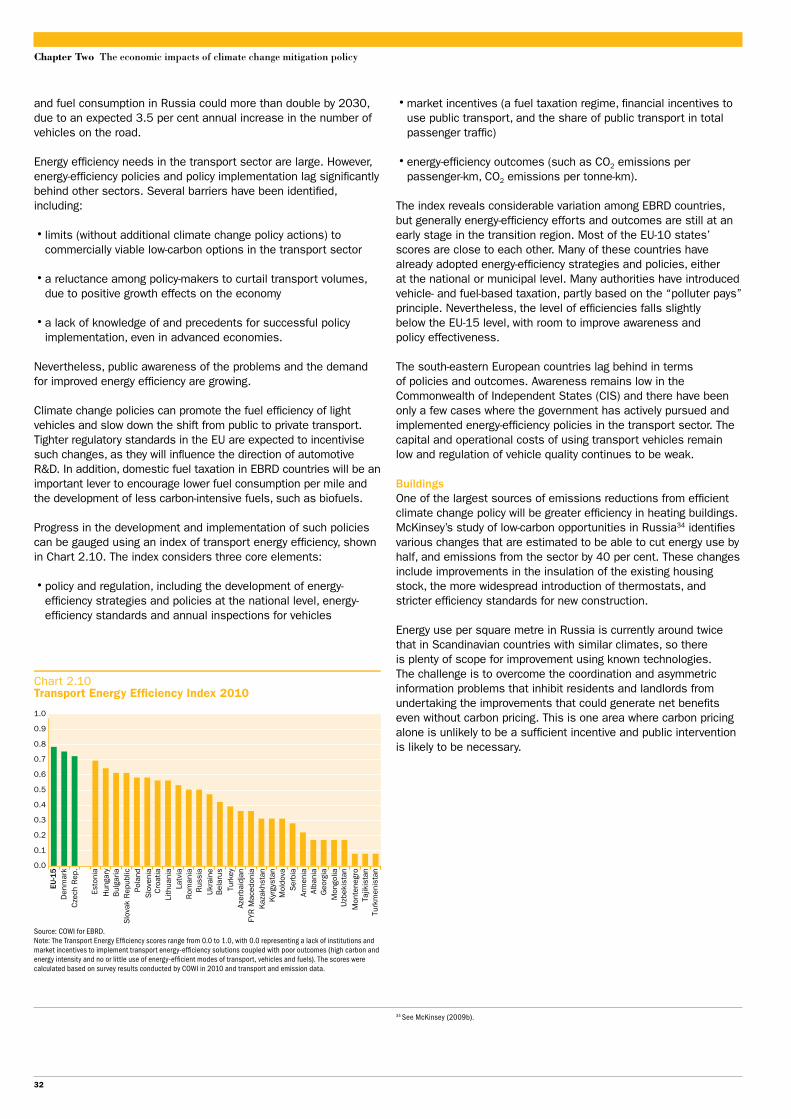
• market incentives (a fuel taxation regime, financial incentives to use public transport, and the share of public transport in total passenger traffic)
• energy-efficiency outcomes (such as CO2 emissions per passenger-km, CO2 emissions per tonne-km).
The index reveals considerable variation among EBRD countries, but generally energy-efficiency efforts and outcomes are still at an early stage in the transition region. Most of the EU-10 states’ scores are close to each other. Many of these countries have already adopted energy-efficiency strategies and policies, either at the national or municipal level. Many authorities have introduced vehicle- and fuel-based taxation, partly based on the “polluter pays” principle. Nevertheless, the level of efficiencies falls slightly below the EU-15 level, with room to improve awareness and policy effectiveness.
The south-eastern European countries lag behind in terms of policies and outcomes. Awareness remains low in the Commonwealth of Independent States (CIS) and there have been only a few cases where the government has actively pursued and implemented energy-efficiency policies in the transport sector. The capital and operational costs of using transport vehicles remain low and regulation of vehicle quality continues to be weak.
BuildingsOne of the largest sources of emissions reductions from efficient climate change policy will be greater efficiency in heating buildings. McKinsey’s study of low-carbon opportunities in Russia34 identifies various changes that are estimated to be able to cut energy use by half, and emissions from the sector by 40 per cent. These changes include improvements in the insulation of the existing housing stock, the more widespread introduction of thermostats, and stricter efficiency standards for new construction.
Energy use per square metre in Russia is currently around twice that in Scandinavian countries with similar climates, so there is plenty of scope for improvement using known technologies. The challenge is to overcome the coordination and asymmetric information problems that inhibit residents and landlords from undertaking the improvements that could generate net benefits even without carbon pricing. This is one area where carbon pricing alone is unlikely to be a sufficient incentive and public intervention is likely to be necessary.
and fuel consumption in Russia could more than double by 2030, due to an expected 3.5 per cent annual increase in the number of vehicles on the road.
Energy efficiency needs in the transport sector are large. However, energy-efficiency policies and policy implementation lag significantly behind other sectors. Several barriers have been identified, including:
• limits (without additional climate change policy actions) to commercially viable low-carbon options in the transport sector
• a reluctance among policy-makers to curtail transport volumes, due to positive growth effects on the economy
• a lack of knowledge of and precedents for successful policy implementation, even in advanced economies.
Nevertheless, public awareness of the problems and the demand for improved energy efficiency are growing.
Climate change policies can promote the fuel efficiency of light vehicles and slow down the shift from public to private transport. Tighter regulatory standards in the EU are expected to incentivise such changes, as they will influence the direction of automotive R&D. In addition, domestic fuel taxation in EBRD countries will be an important lever to encourage lower fuel consumption per mile and the development of less carbon-intensive fuels, such as biofuels.
Progress in the development and implementation of such policies can be gauged using an index of transport energy efficiency, shown in Chart 2.10. The index considers three core elements:
• policy and regulation, including the development of energy-efficiency strategies and policies at the national level, energy-efficiency standards and annual inspections for vehicles
Chart 2.10Transport Energy Efficiency Index 2010
Source: COWI for EBRD.Note: The Transport Energy Ef�ciency scores range from 0.0 to 1.0, with 0.0 representing a lack of institutions and market incentives to implement transport energy-ef�ciency solutions coupled with poor outcomes (high carbon and energy intensity and no or little use of energy-ef�cient modes of transport, vehicles and fuels). The scores were calculated based on survey results conducted by COWI in 2010 and transport and emission data.
0.0
0.1
0.2
0.3
0.4
0.5
0.6
0.7
0.8
0.9
1.0
EU-1
5
Cze
ch R
ep.
Den
mar
k
Esto
nia
Hun
gary
Bul
garia
Slo
vak
Rep
ublic
Pola
ndS
love
nia
Cro
atia
Lith
uani
a
Rom
ania
Latv
ia
Rus
sia
Ukr
aine
Bel
arus
Turk
eyAz
erba
idja
nFY
R M
aced
onia
Kaz
akhs
tan
Kyr
gyst
anM
oldo
vaS
erbi
aAr
men
iaAl
bani
aG
eorg
iaM
ongo
liaU
zbek
ista
nM
onte
negr
oTa
jikis
tan
Turk
men
ista
n
34 See McKinsey (2009b).
32
Special Report on Climate Change
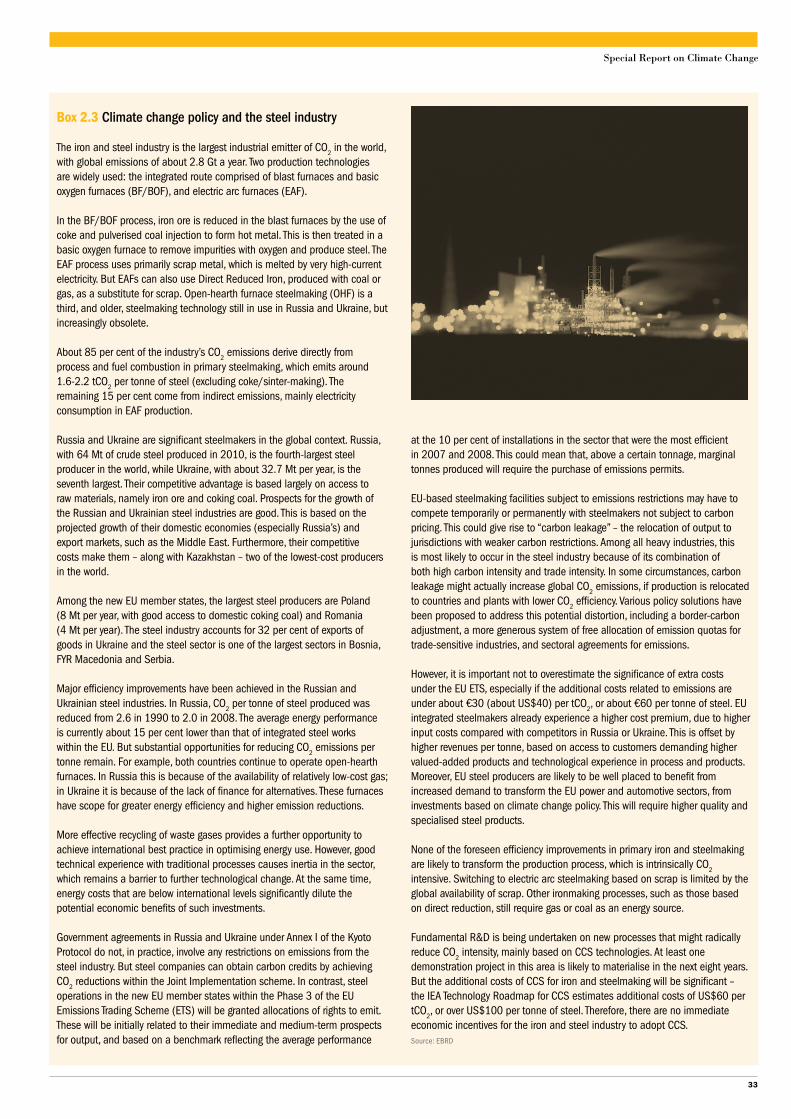
Box 2.3 Climate change policy and the steel industry
The iron and steel industry is the largest industrial emitter of CO2 in the world, with global emissions of about 2.8 Gt a year. Two production technologies are widely used: the integrated route comprised of blast furnaces and basic oxygen furnaces (BF/BOF), and electric arc furnaces (EAF).
In the BF/BOF process, iron ore is reduced in the blast furnaces by the use of coke and pulverised coal injection to form hot metal. This is then treated in a basic oxygen furnace to remove impurities with oxygen and produce steel. The EAF process uses primarily scrap metal, which is melted by very high-current electricity. But EAFs can also use Direct Reduced Iron, produced with coal or gas, as a substitute for scrap. Open-hearth furnace steelmaking (OHF) is a third, and older, steelmaking technology still in use in Russia and Ukraine, but increasingly obsolete.
About 85 per cent of the industry’s CO2 emissions derive directly from
process and fuel combustion in primary steelmaking, which emits around 1.6-2.2 tCO
2 per tonne of steel (excluding coke/sinter-making). The remaining 15 per cent come from indirect emissions, mainly electricity consumption in EAF production.
Russia and Ukraine are significant steelmakers in the global context. Russia, with 64 Mt of crude steel produced in 2010, is the fourth-largest steel producer in the world, while Ukraine, with about 32.7 Mt per year, is the seventh largest. Their competitive advantage is based largely on access to raw materials, namely iron ore and coking coal. Prospects for the growth of the Russian and Ukrainian steel industries are good. This is based on the projected growth of their domestic economies (especially Russia’s) and export markets, such as the Middle East. Furthermore, their competitive costs make them – along with Kazakhstan – two of the lowest-cost producers in the world.
Among the new EU member states, the largest steel producers are Poland (8 Mt per year, with good access to domestic coking coal) and Romania (4 Mt per year). The steel industry accounts for 32 per cent of exports of goods in Ukraine and the steel sector is one of the largest sectors in Bosnia, FYR Macedonia and Serbia.
Major efficiency improvements have been achieved in the Russian and Ukrainian steel industries. In Russia, CO
2 per tonne of steel produced was reduced from 2.6 in 1990 to 2.0 in 2008. The average energy performance is currently about 15 per cent lower than that of integrated steel works within the EU. But substantial opportunities for reducing CO
2 emissions per tonne remain. For example, both countries continue to operate open-hearth furnaces. In Russia this is because of the availability of relatively low-cost gas; in Ukraine it is because of the lack of finance for alternatives. These furnaces have scope for greater energy efficiency and higher emission reductions.
More effective recycling of waste gases provides a further opportunity to achieve international best practice in optimising energy use. However, good technical experience with traditional processes causes inertia in the sector, which remains a barrier to further technological change. At the same time, energy costs that are below international levels significantly dilute the potential economic benefits of such investments.
Government agreements in Russia and Ukraine under Annex I of the Kyoto Protocol do not, in practice, involve any restrictions on emissions from the steel industry. But steel companies can obtain carbon credits by achieving CO
2 reductions within the Joint Implementation scheme. In contrast, steel operations in the new EU member states within the Phase 3 of the EU Emissions Trading Scheme (ETS) will be granted allocations of rights to emit. These will be initially related to their immediate and medium-term prospects for output, and based on a benchmark reflecting the average performance
at the 10 per cent of installations in the sector that were the most efficient in 2007 and 2008. This could mean that, above a certain tonnage, marginal tonnes produced will require the purchase of emissions permits.
EU-based steelmaking facilities subject to emissions restrictions may have to compete temporarily or permanently with steelmakers not subject to carbon pricing. This could give rise to “carbon leakage” – the relocation of output to jurisdictions with weaker carbon restrictions. Among all heavy industries, this is most likely to occur in the steel industry because of its combination of both high carbon intensity and trade intensity. In some circumstances, carbon leakage might actually increase global CO
2 emissions, if production is relocated to countries and plants with lower CO
2 efficiency. Various policy solutions have been proposed to address this potential distortion, including a border-carbon adjustment, a more generous system of free allocation of emission quotas for trade-sensitive industries, and sectoral agreements for emissions.
However, it is important not to overestimate the significance of extra costs under the EU ETS, especially if the additional costs related to emissions are under about €30 (about US$40) per tCO
2, or about €60 per tonne of steel. EU integrated steelmakers already experience a higher cost premium, due to higher input costs compared with competitors in Russia or Ukraine. This is offset by higher revenues per tonne, based on access to customers demanding higher valued-added products and technological experience in process and products. Moreover, EU steel producers are likely to be well placed to benefit from increased demand to transform the EU power and automotive sectors, from investments based on climate change policy. This will require higher quality and specialised steel products.
None of the foreseen efficiency improvements in primary iron and steelmaking are likely to transform the production process, which is intrinsically CO
2 intensive. Switching to electric arc steelmaking based on scrap is limited by the global availability of scrap. Other ironmaking processes, such as those based on direct reduction, still require gas or coal as an energy source.
Fundamental R&D is being undertaken on new processes that might radically reduce CO
2 intensity, mainly based on CCS technologies. At least one demonstration project in this area is likely to materialise in the next eight years. But the additional costs of CCS for iron and steelmaking will be significant – the IEA Technology Roadmap for CCS estimates additional costs of US$60 per tCO
2, or over US$100 per tonne of steel. Therefore, there are no immediate economic incentives for the iron and steel industry to adopt CCS.Source: EBRD
33

Chapter Two The economic impacts of climate change mitigation policy
Social implications of climate change policy
Are climate policies regressive?Implementing climate policies through carbon pricing may have significant distributional effects for transition countries. One of the main concerns raised among policy-makers is that mitigation policies, by setting an explicit price on carbon and increasing energy costs, could be socially regressive and affect the poorest households disproportionately. There are no specific studies on the transition region, but findings from the empirical literature can be used to infer the potential distributional impact of mitigation policies, notably a carbon tax or price, in transition countries.
A carbon tax is likely to generate distributional effects by changing the product prices faced by households and by altering factor prices, thus affecting household incomes35. First, a carbon tax will raise the final price of fossil-fuel intensive products, such as natural gas, electricity, gasoline and heating fuel. This will affect consumers according to their spending on fossil-fuel intensive products. Since poorer households spend a higher share of their income on fossil-fuel intensive products, a carbon tax might be regressive.
Second, a carbon tax will affect the relative prices of the factors of production (labour or capital) used in carbon-intensive industries. The impact on factor prices will depend on how feasible and simple it is to substitute these production factors, and the relative factor intensity of carbon-intensive industries. A carbon tax will also increase returns from the factor that constitutes a better substitute for the polluting input.
Furthermore, a carbon tax will reduce the production of fossil-fuel intensive products. This will tend to reduce, to a relatively greater extent, returns from the factor intensively used in the sector. Carbon-intensive industries tend to be capital-intensive, so if capital is a better substitute for pollution than labour, a carbon tax might reduce wages. This will burden poor households particularly.
Most empirical studies on industrial countries conclude that climate change mitigation policies are likely to be regressive. Focusing on the impact of changes in relative prices on the real value of household spending, carbon pricing appears to be
Chart 2.12Affordability of natural gas for the average household in 2020
Source: EBRD calculations.
Percentage of household income
■ Business as usual ■ EBRD-WITCH ■ WITCH ■ REMIND ■ IMACLIM
0%
2%
4%
6%
8%
10%
12%
Bulgaria Hungary Poland Romania Russia Slovak Republic
Turkey
Chart 2.11Affordability of electricity for the average household in 2020
Source: EBRD calculations.
Percentage of household income
■ Business as usual ■ EBRD-WITCH ■ WITCH ■ REMIND ■ IMACLIM
0%
2%
4%
6%
8%
10%
12%
Bulgaria Hungary Poland Romania Russia Slovak Republic
Turkey
35 See Fullerton (2008) for a detailed review of the tax incidence literature.36 This conclusion emerges whether the studies are input–output table based, econometric or based on
calibrated general equilibrium models. See respectively Symons (2000), Barker and Kohler (1998) and Hasset et al. (2009).
37 See Fullerton and Heutel (2007) and Fullerton and Heutel (2010), who calibrate an analytical general equilibrium model for Japan and the US, respectively.
38 For example Shah and Larsen (1992) and Yusuf and Resosudarmo (2008).39 The price projections for electricity and natural gas for each country under the baseline are obtained
from Enerdata POLES. This is a partial equilibrium world model that estimates prices, taking into account projections of energy demand and supply by country.
regressive partly because energy comprises a larger part of poorer families’ expenditure.36 In addition, the few empirical contributions focusing on sources of income suggest that a carbon tax could also be regressive by depressing (unskilled) wages when emission-abatement measures are capital-intensive.37
However, the empirical literature on developing countries depicts a slightly different picture. Some studies suggest that the distributional effects of climate change policies might be progressive38, because the expenditure of low-income households is less sensitive to the price of energy-related commodities and a carbon price will favour unskilled rural workers.
Although specific studies of the tax incidence of climate change policies in the EBRD region have not yet been conducted, it seems likely that the effects of climate change mitigation policies in the EBRD region will, on balance, be regressive. Access to electricity supply is widespread in the transition region, relatively energy-intensive technologies are used in industry and heating, and the share of labour employed in agriculture is, for most EBRD countries, closer to that in the OECD than is the share among developing countries.
Climate change policies and affordabilityA narrower way of assessing the distributional impact of mitigation policies is to look at their effect on the affordability of household energy utility services. The World Bank (2009) defines affordability as households’ ability to purchase an adequate level of utility services without suffering undue financial hardship. Affordability is usually measured by the affordability ratio – the share of income or expenditure allocated to a specific good or service.
Moving to a low-carbon emission path may reduce the affordability of utility services: a positive carbon price would lead to higher prices for fossil-fuel intensive products, notably electricity and natural gas, thus tightening affordability constraints. However, anticipated energy-efficiency improvements, notably in housing, would ease affordability constraints by reducing the required consumption expenditures to achieve an adequate service level.
34
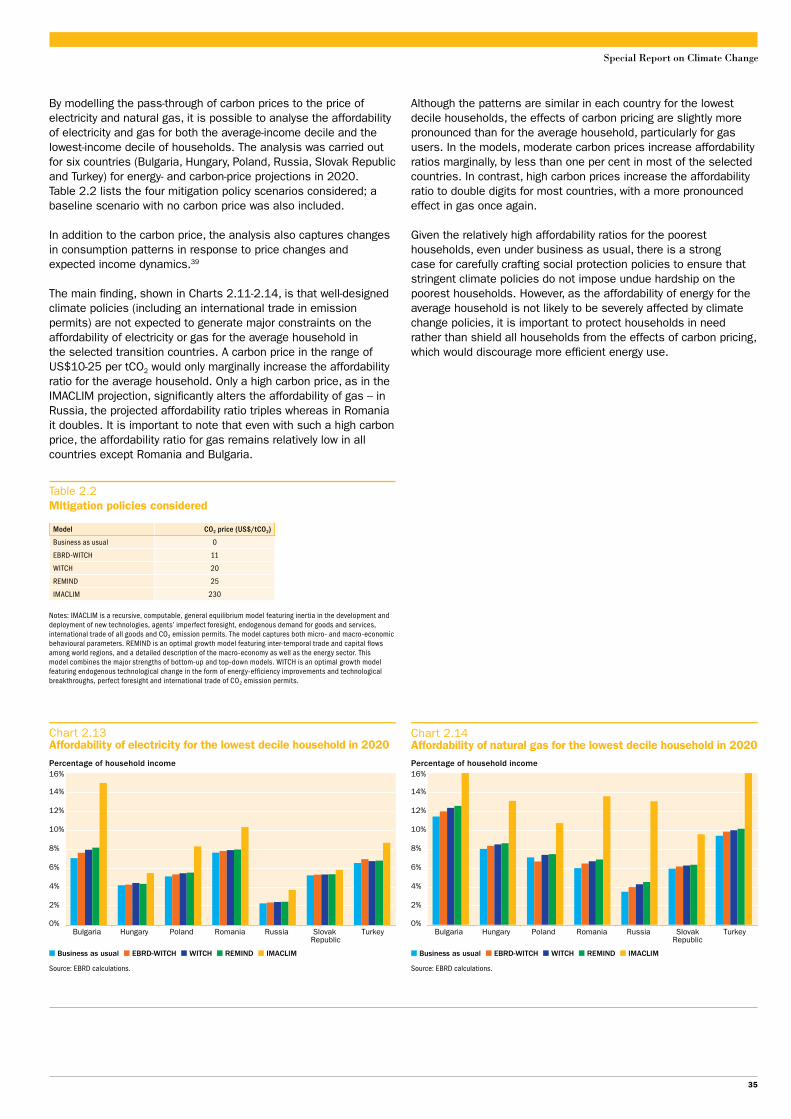
Special Report on Climate Change
Chart 2.14Affordability of natural gas for the lowest decile household in 2020
Source: EBRD calculations.
Percentage of household income
■ Business as usual ■ EBRD-WITCH ■ WITCH ■ REMIND ■ IMACLIM
0%Bulgaria Hungary Poland Romania Russia Slovak
RepublicTurkey
2%
4%
6%
8%
10%
12%
14%
16%
Chart 2.13Affordability of electricity for the lowest decile household in 2020
Source: EBRD calculations.
Percentage of household income
■ Business as usual ■ EBRD-WITCH ■ WITCH ■ REMIND ■ IMACLIM
0%Bulgaria Hungary Poland Romania Russia Slovak
RepublicTurkey
2%
4%
6%
8%
10%
12%
14%
16%
Table 2.2 Mitigation policies considered
Model CO2 price (US$/tCO2)
Business as usual 0
EBRD-WITCH 11
WITCH 20
REMIND 25
IMACLIM 230
Notes: IMACLIM is a recursive, computable, general equilibrium model featuring inertia in the development and deployment of new technologies, agents’ imperfect foresight, endogenous demand for goods and services, international trade of all goods and CO2 emission permits. The model captures both micro- and macro-economic behavioural parameters. REMIND is an optimal growth model featuring inter-temporal trade and capital flows among world regions, and a detailed description of the macro-economy as well as the energy sector. This model combines the major strengths of bottom-up and top-down models. WITCH is an optimal growth model featuring endogenous technological change in the form of energy-efficiency improvements and technological breakthroughs, perfect foresight and international trade of CO2 emission permits.
By modelling the pass-through of carbon prices to the price of electricity and natural gas, it is possible to analyse the affordability of electricity and gas for both the average-income decile and the lowest-income decile of households. The analysis was carried out for six countries (Bulgaria, Hungary, Poland, Russia, Slovak Republic and Turkey) for energy- and carbon-price projections in 2020. Table 2.2 lists the four mitigation policy scenarios considered; a baseline scenario with no carbon price was also included.
In addition to the carbon price, the analysis also captures changes in consumption patterns in response to price changes and expected income dynamics.39
The main finding, shown in Charts 2.11-2.14, is that well-designed climate policies (including an international trade in emission permits) are not expected to generate major constraints on the affordability of electricity or gas for the average household in the selected transition countries. A carbon price in the range of US$10-25 per tCO2 would only marginally increase the affordability ratio for the average household. Only a high carbon price, as in the IMACLIM projection, significantly alters the affordability of gas – in Russia, the projected affordability ratio triples whereas in Romania it doubles. It is important to note that even with such a high carbon price, the affordability ratio for gas remains relatively low in all countries except Romania and Bulgaria.
Although the patterns are similar in each country for the lowest decile households, the effects of carbon pricing are slightly more pronounced than for the average household, particularly for gas users. In the models, moderate carbon prices increase affordability ratios marginally, by less than one per cent in most of the selected countries. In contrast, high carbon prices increase the affordability ratio to double digits for most countries, with a more pronounced effect in gas once again.
Given the relatively high affordability ratios for the poorest households, even under business as usual, there is a strong case for carefully crafting social protection policies to ensure that stringent climate policies do not impose undue hardship on the poorest households. However, as the affordability of energy for the average household is not likely to be severely affected by climate change policies, it is important to protect households in need rather than shield all households from the effects of carbon pricing, which would discourage more efficient energy use.
35
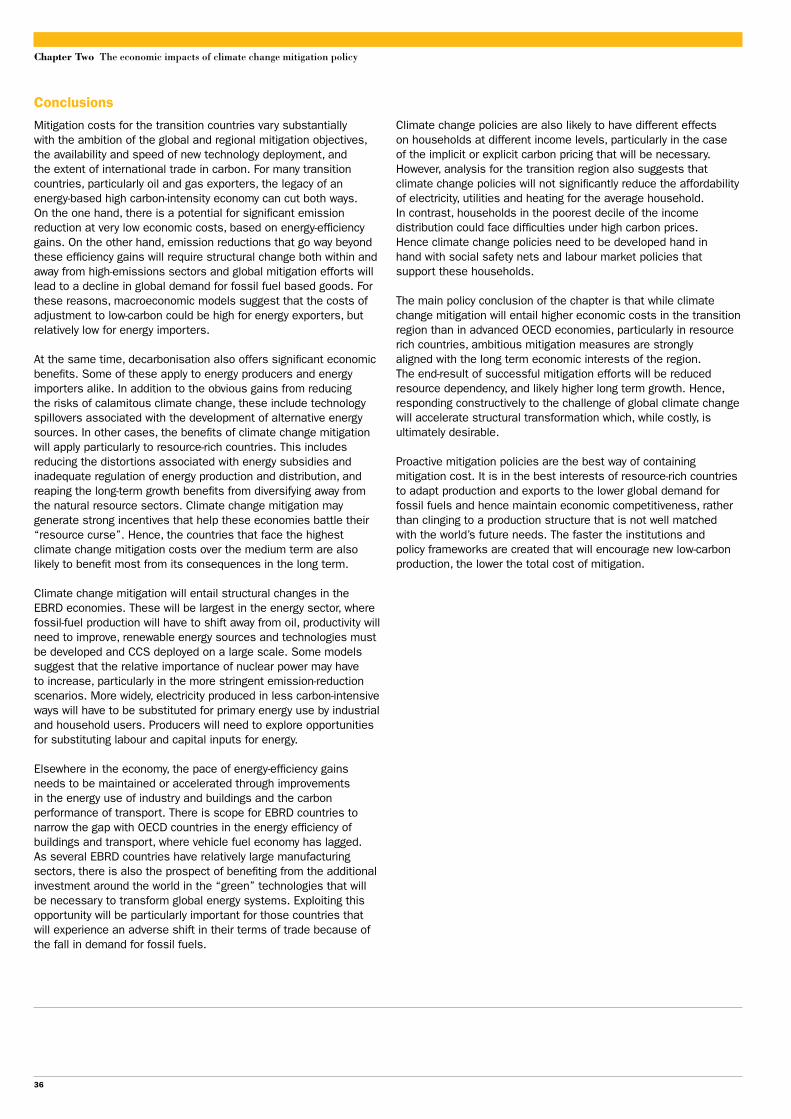
Chapter Two The economic impacts of climate change mitigation policy
Conclusions
Mitigation costs for the transition countries vary substantially with the ambition of the global and regional mitigation objectives, the availability and speed of new technology deployment, and the extent of international trade in carbon. For many transition countries, particularly oil and gas exporters, the legacy of an energy-based high carbon-intensity economy can cut both ways. On the one hand, there is a potential for significant emission reduction at very low economic costs, based on energy-efficiency gains. On the other hand, emission reductions that go way beyond these efficiency gains will require structural change both within and away from high-emissions sectors and global mitigation efforts will lead to a decline in global demand for fossil fuel based goods. For these reasons, macroeconomic models suggest that the costs of adjustment to low-carbon could be high for energy exporters, but relatively low for energy importers.
At the same time, decarbonisation also offers significant economic benefits. Some of these apply to energy producers and energy importers alike. In addition to the obvious gains from reducing the risks of calamitous climate change, these include technology spillovers associated with the development of alternative energy sources. In other cases, the benefits of climate change mitigation will apply particularly to resource-rich countries. This includes reducing the distortions associated with energy subsidies and inadequate regulation of energy production and distribution, and reaping the long-term growth benefits from diversifying away from the natural resource sectors. Climate change mitigation may generate strong incentives that help these economies battle their “resource curse”. Hence, the countries that face the highest climate change mitigation costs over the medium term are also likely to benefit most from its consequences in the long term.
Climate change mitigation will entail structural changes in the EBRD economies. These will be largest in the energy sector, where fossil-fuel production will have to shift away from oil, productivity will need to improve, renewable energy sources and technologies must be developed and CCS deployed on a large scale. Some models suggest that the relative importance of nuclear power may have to increase, particularly in the more stringent emission-reduction scenarios. More widely, electricity produced in less carbon-intensive ways will have to be substituted for primary energy use by industrial and household users. Producers will need to explore opportunities for substituting labour and capital inputs for energy.
Elsewhere in the economy, the pace of energy-efficiency gains needs to be maintained or accelerated through improvements in the energy use of industry and buildings and the carbon performance of transport. There is scope for EBRD countries to narrow the gap with OECD countries in the energy efficiency of buildings and transport, where vehicle fuel economy has lagged. As several EBRD countries have relatively large manufacturing sectors, there is also the prospect of benefiting from the additional investment around the world in the “green” technologies that will be necessary to transform global energy systems. Exploiting this opportunity will be particularly important for those countries that will experience an adverse shift in their terms of trade because of the fall in demand for fossil fuels.
Climate change policies are also likely to have different effects on households at different income levels, particularly in the case of the implicit or explicit carbon pricing that will be necessary. However, analysis for the transition region also suggests that climate change policies will not significantly reduce the affordability of electricity, utilities and heating for the average household. In contrast, households in the poorest decile of the income distribution could face difficulties under high carbon prices. Hence climate change policies need to be developed hand in hand with social safety nets and labour market policies that support these households.
The main policy conclusion of the chapter is that while climate change mitigation will entail higher economic costs in the transition region than in advanced OECD economies, particularly in resource rich countries, ambitious mitigation measures are strongly aligned with the long term economic interests of the region. The end-result of successful mitigation efforts will be reduced resource dependency, and likely higher long term growth. Hence, responding constructively to the challenge of global climate change will accelerate structural transformation which, while costly, is ultimately desirable.
Proactive mitigation policies are the best way of containing mitigation cost. It is in the best interests of resource-rich countries to adapt production and exports to the lower global demand for fossil fuels and hence maintain economic competitiveness, rather than clinging to a production structure that is not well matched with the world’s future needs. The faster the institutions and policy frameworks are created that will encourage new low-carbon production, the lower the total cost of mitigation.
36
Special Report on Climate Change
References
M.H. Babiker and R.S. Eckaus (2007)“Unemployment effects of climate policy” Environmental Science and Policy, Vol. 10, pp. 600-609.
M.B. Baettig, M. Wild and D.M. Imboden (2007)“A climate change index: where climate change may be most prominent in the 21st century”, Geophysical Research Letters, Vol. 34.
T. Barker, T. Foxon and S.S. Scrieciu (2008)“Achieving the G8 50 per cent target: modelling induced and accelerated technological change using the macro-econometric model E3MG”, Climate Policy, Vol. 8, Special Issue on ‘Modelling long-term scenarios for low-carbon societies’, pp. S30-S45.
F. Bosello, C. Carraro and E. de Cian (2010)“Climate policy and the optimal balance between mitigation, adaptation and unavoided damage”, Fondazione Eni Enrico Mattei (FEEM) Working Paper 32, 2010, February.
V. Bosetti, E. Massetti and M. Tavoni (2007)“The WITCH model: Structure, Baseline and Solutions”. FEEM Nota di Lavoro No. 10, 2007.
V. Bosetti, C. Carraro, R. Duval, A. Sgobbi and M. Tavoni (2009)“The role of R&D and technology diffusion in climate change mitigation: new perspectives using the WITCH model”, Economics Department Working Paper No. 664. OECD, Paris.
A. Bowen and N. Ranger (2009)“Mitigating Climate Change Through Reductions in Greenhouse Gas Emissions: The Science and Economics of Future Paths For Global Annual Emissions”, Policy Brief, Grantham Research Institute on Climate Change and the Environment, London School of Economics and Political Science.
J-M. Burniaux, J. Chateau, R. Dellink, R. Duval and S. Jamet (2009)“The economics of climate change mitigation: how to build the necessary global action in a cost-effective manner”, Economics Department Working paper No. 701, OECD, Paris.
L. Clarke, J. Edmonds, V. Krey, R. Richels, S. Rose and M. Tavoni (2009)“International climate policy architectures: overview of the EMF 22 international scenarios”, Energy Economics, Vol. 31, special supplement 2, pp. S64-S81.
D. Fullerton (2008)“Distributional Effects of Environmental and Energy Policy – An Introduction”, NBER Working Paper 14241.
D. Fullerton and G. Heutel (2007)“Who bears the burden of a tax on carbon emissions in Japan?”, Environmental Economics and Policy Studies, Vol. 8, pp. 225-270.
D. Fullerton and G. Heutel (2010)“Analytical General Equilibrium Effects of Energy Policy on Output and Factor Prices”, University of Illinois mimeo.
O. Edenhofer, C. Carraro, J-C. Hourcade, K. Neuhoff, G. Luderer, C. Flachsland, M. Jakob, A. Popp, J. Steckel, J. Strohschein, N. Bauer, S. Brunner, M. Leimbach, H. Lotze-Campen, V. Bosetti, E. de Cian, M. Tavoni, O. Sassi, H. Waisman, R. Crassous-Doerfler, S. Monjon, S. Dröge, H. van Essen, P. del Río and A. Türk (2009)“The economics of decarbonization. Report of the RECIPE project”, Potsdam Institute for Climate Impact Research, Potsdam.
European Bank for Reconstruction and Development (2009)“Transition Report 2009: Transition in crisis?”, EBRD, London.
European Bank for Reconstruction and Development (2010)“Transition Report 2010: recovery and reform”, EBRD, London.
International Energy Agency (2009)“World Energy Outlook 2009”, IEA/OECD, Paris.
International Institute for Applied Systems Analysis (2009)“Emissions of air pollutants for the World Energy Outlook 2009 energy scenarios: final report”, IIASA, Laxenburg.
Intergovernmental Panel on Climate Change (2007)“Climate Change 2007: Mitigation. Contribution of Working Group III to the Fourth Assessment Report of the Intergovernmental Panel on Climate Change”, (eds. B. Metz, O.R. Davidson, P.R. Bosch, R. Dave, L.A. Meyer), Cambridge University Press, Cambridge, UK and New York, NY, US.
B. Knopf and O. Edenhofer, T. Barker, N. Bauer, L. Baumstark, B. Chateau, P. Criqui, A. Held, M. Isaac, M. Jakob, E. Jochem, A. Kitous, S. Kypreos, M. Leimbach, B. Magné, S. Mima, W. Schade, S. Scrieciu, H. Turton and D. van Vuuren (2009)“The economics of low stabilisation: implications for technological change and policy”, Chapter 11 in Making Climate Change Work for Us (eds. M. Hulme and H Neufeldt), Cambridge University Press, Cambridge, UK.
M. Leimbach, N. Bauer, L. Baumstark and O. Edenhofer (2009)“Mitigation costs in a globalized world: climate policy analysis with REMIND-R”, Potsdam Institute for Climate Impact Reseach Working Paper, PIK, Potsdam.
McKinsey (2008)“Costs and potentials of greenhouse gas abatement in the Czech Republic: key findings”, McKinsey & Company.
McKinsey (2009a)“Pathways to a low-carbon economy”, McKinsey & Company.
McKinsey (2009b)“Pathways to an energy and carbon efficient Russia”, McKinsey & Company.
McKinsey (2009c)“Assessment of greenhouse gas emissions abatement potential in Poland by 2030”, McKinsey & Company.
W.D. Nordhaus (2010)“Economic aspects of global warming in a post-Copenhagen environment”, Proceedings of the National Academy of Sciences, June 2010.
W.D. Nordhaus and J. Boyer (2000)“Warming the world: economic modelling of global warming”, MIT Press, Cambridge, Massachusetts.
W.D. Nordhaus and Z. Yang (1996)“A regional dynamic general-equilibrium modelof alternative climate-change strategies”, American Economic Review, Vol. 86(4), pp. 741-765.
Organisation for Economic Co-operation and Development (2009)“The economics of climate change mitigation”, OECD, Paris.
S. Rao, K. Riahi, E. Stehfest, D. van Vuuren, C. Cho, M. den Elzen, M. Isaac and J. van Vliet (2008)“IMAGE and MESSAGE scenarios limiting GHG concentration to low levels”, Interim Report 08-020, International Institute for Applied Systems Analysis, Laxenburg.
Renewable Energy Policy Network for the 21st Century (2007)“Renewable energy potentials: opportunities for the rapid deployment of renewable energy in large energy economies”, Intermediate Report to the 3rd Ministerial Meeting of the Gleneagles Dialogue on Climate Change, Clean Energy and Sustainable Development, REN21, Paris.
M. Tavoni and R. Tol (2010)“Counting only the hits: the risk of underestimating the costs of stringent climate policies”, Climatic Change, Vol. 100, pp. 769-778.
R. Tol, (2009)“The feasibility of low concentration targets: an application of FUND” Economic and Social Research Institute Working Paper 285, ESRI, Dublin.
United Nations Framework Convention on Climate Change (2007)“Investment and financial flows to address climate change: background paper”, UNFCCC, Bonn.
United Nations Development Programme (2007)“The outlook for the development of renewable energy in Uzbekistan”, UNDP, Tashkent.
Vivid Economics (2010)“A low-carbon transition for the EBRD region of operation”, report for the EBRD, Vivid Economics, London.
World Bank (2009)“Adapting to climate change in Europe and Central Asia”, World Bank, Washington, D.C.
World Bank (2010)“The costs to developing countries of adapting to climate change. The global report of the economics of adaptation to climate change study”, The World Bank, Washington, D.C.
A. Yusuf (2008)“The distributional impact of environmental policy: the case of carbon cax and energy pricing reform in Indonesia”, Economy and Environment Program for Southeast Asia, Research Report 1.
37