Embed Size (px)
Citation preview

The Economic Cost of
Brain Waste in the U.S.
Jeanne Batalova, Senior Policy Analyst
Michael Fix, MPI President
Washington, DC
December 7, 2016
Who Was Involved
© 2016 Migration Policy Institute
Support and collaboration
New American Economy: Angela Marek, Pavel Dramski, and Kate Brick
World Education Services: Paul Feltman and Stacey Simon
The J.M. Kaplan Fund: Suzette Brooks Masters
Research team
Jeanne Batalova, Michael Fix, and Ariel Ruiz, MPI
Jim Bachmeier, Sociology Department, Temple University
Carl Davis and Meg Wiehe, Institute on Taxation and Economic Policy
Research Questions
© 2016 Migration Policy Institute
1. How many immigrants are underemployed
(i.e., in low-skilled jobs) or unemployed?
2. Profiles by nativity, place of education, and
legal status • Foreign born, foreign educated
• Foreign born, U.S. educated
• U.S. born, U.S. educated
3. What are the most important contributors to
immigrant underemployment?
Research Questions (Cont’d)
© 2016 Migration Policy Institute
4. What are the costs of underemployment in
terms of forgone earnings?
5. What are the costs of underemployment in
terms of forgone federal and state taxes?
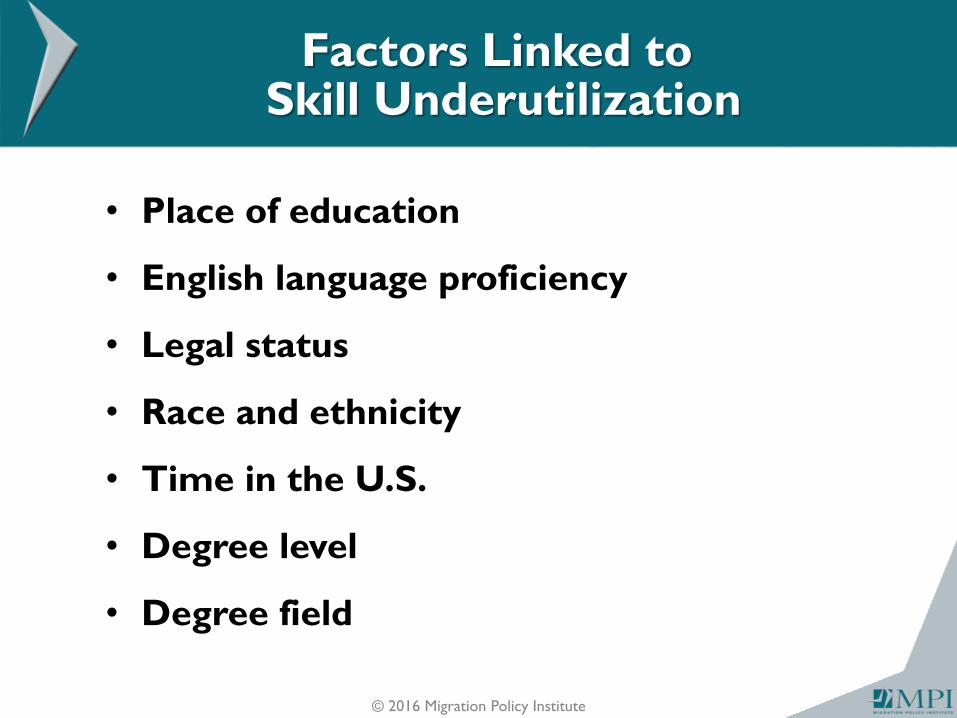
Factors Linked to Skill Underutilization
© 2016 Migration Policy Institute
• Place of education
• English language proficiency
• Legal status
• Race and ethnicity
• Time in the U.S.
• Degree level
• Degree field
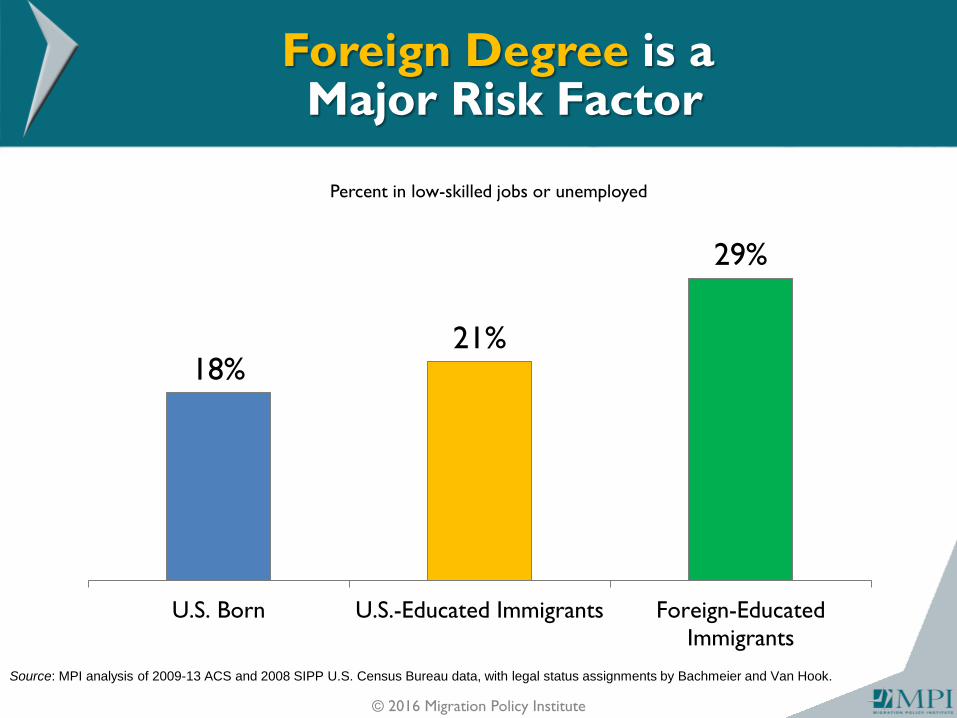
Foreign Degree is a Major Risk Factor
© 2016 Migration Policy Institute
18% 21%
29%
U.S. Born U.S.-Educated Immigrants Foreign-Educated
Immigrants
Percent in low-skilled jobs or unemployed
Source: MPI analysis of 2009-13 ACS and 2008 SIPP U.S. Census Bureau data, with legal status assignments by Bachmeier and Van Hook.
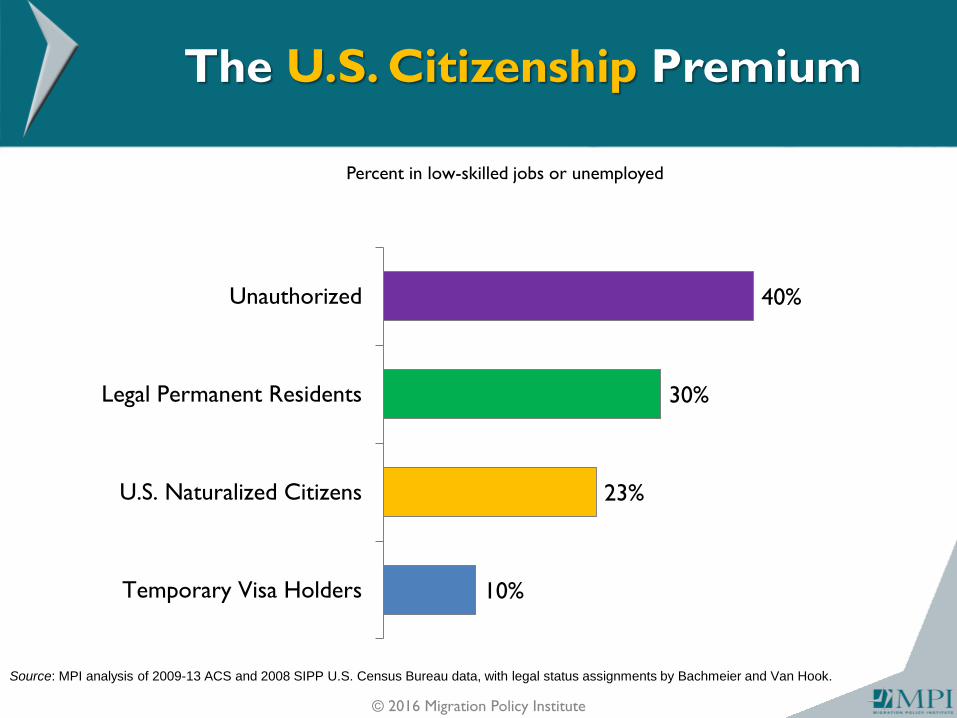
The U.S. Citizenship Premium
© 2016 Migration Policy Institute
10%
23%
30%
40%
Temporary Visa Holders
U.S. Naturalized Citizens
Legal Permanent Residents
Unauthorized
Percent in low-skilled jobs or unemployed
Source: MPI analysis of 2009-13 ACS and 2008 SIPP U.S. Census Bureau data, with legal status assignments by Bachmeier and Van Hook.

Immigrants from Latin America and Africa Have High Underutilization Rates
© 2016 Migration Policy Institute
0% 10% 20% 30% 40% 50%
Canada
European Union/EEA**
China
India
Middle East
Philippines
Africa
South America
Caribbean
Mexico
Percent in low-skilled jobs or unemployed
Source: MPI analysis of 2009-13 ACS and 2008 SIPP U.S. Census Bureau data, with legal status assignments by Bachmeier and Van Hook.
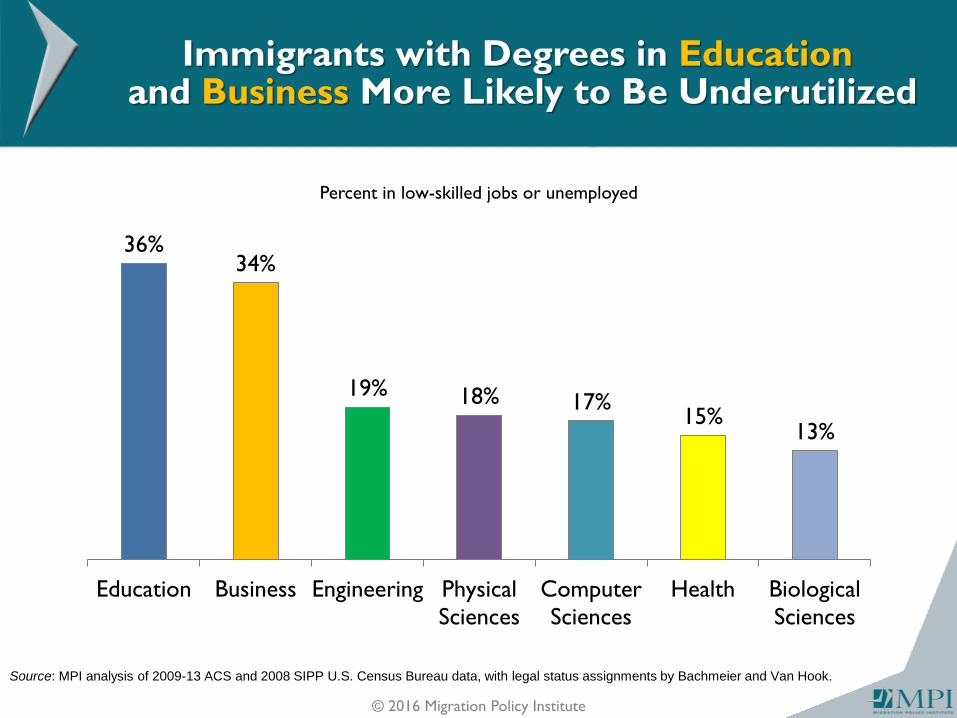
Immigrants with Degrees in Education and Business More Likely to Be Underutilized
© 2016 Migration Policy Institute
36% 34%
19% 18% 17% 15%
13%
Education Business Engineering Physical
Sciences
Computer
Sciences
Health Biological
Sciences
Percent in low-skilled jobs or unemployed
Source: MPI analysis of 2009-13 ACS and 2008 SIPP U.S. Census Bureau data, with legal status assignments by Bachmeier and Van Hook.
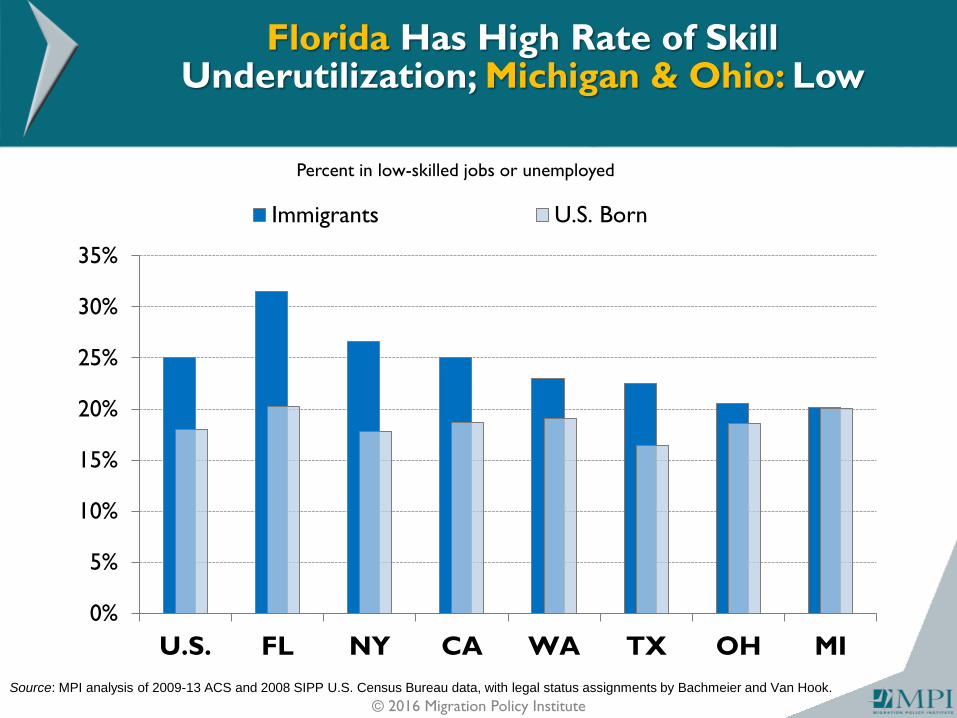
Florida Has High Rate of Skill Underutilization; Michigan & Ohio: Low
© 2016 Migration Policy Institute
Percent in low-skilled jobs or unemployed
Source: MPI analysis of 2009-13 ACS and 2008 SIPP U.S. Census Bureau data, with legal status assignments by Bachmeier and Van Hook.
0%
5%
10%
15%
20%
25%
30%
35%
U.S. FL NY CA WA TX OH MI
Immigrants U.S. Born

How Immigrant College Graduates in FL and MI Differ from the U.S.
© 2016 Migration Policy Institute
Characteristic
Florida Michigan
English proficiency Less likely More likely
With U.S. degrees Less likely Less likely
Advanced degree Less likely More likely
Temporary visa
holders Lower shares Higher shares
Age Older Similar
Top origin Caribbean and
South America Asia and
Europe

Economic Impact
© 2016 Migration Policy Institute
What are the costs of underemployment?
• Forgone earnings
• Forgone federal and state/local taxes
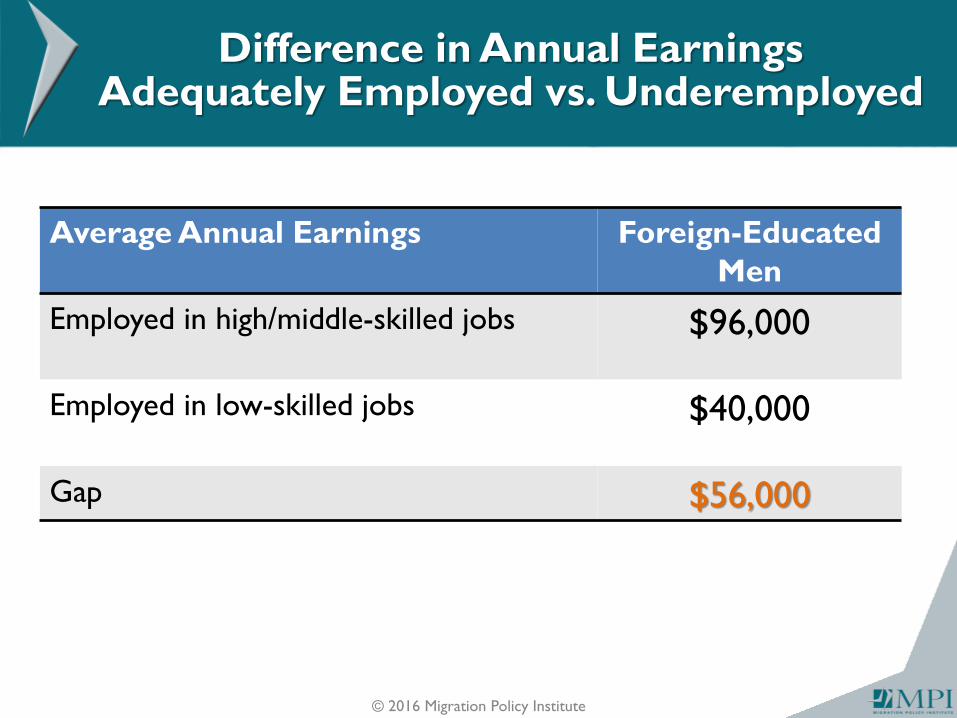
Difference in Annual Earnings Adequately Employed vs. Underemployed
© 2016 Migration Policy Institute
Average Annual Earnings
Foreign-Educated
Men
Employed in high/middle-skilled jobs
$96,000
Employed in low-skilled jobs
$40,000
Gap $56,000
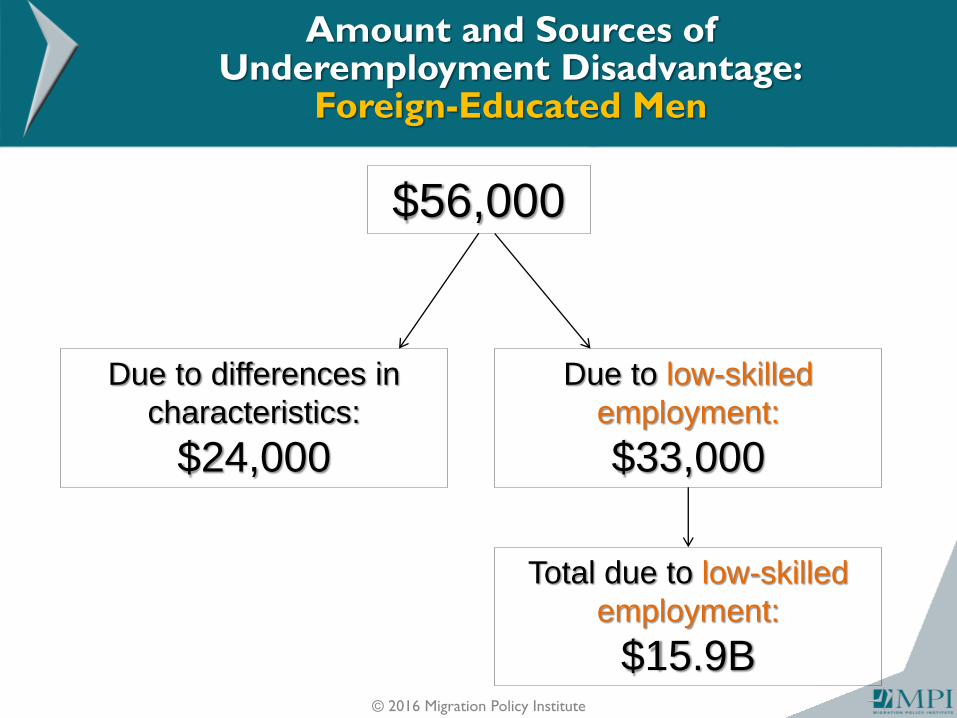
Amount and Sources of Underemployment Disadvantage:
Foreign-Educated Men
© 2016 Migration Policy Institute
$56,000
Due to differences in
characteristics:
$24,000
Due to low-skilled
employment:
$33,000
Total due to low-skilled
employment:
$15.9B
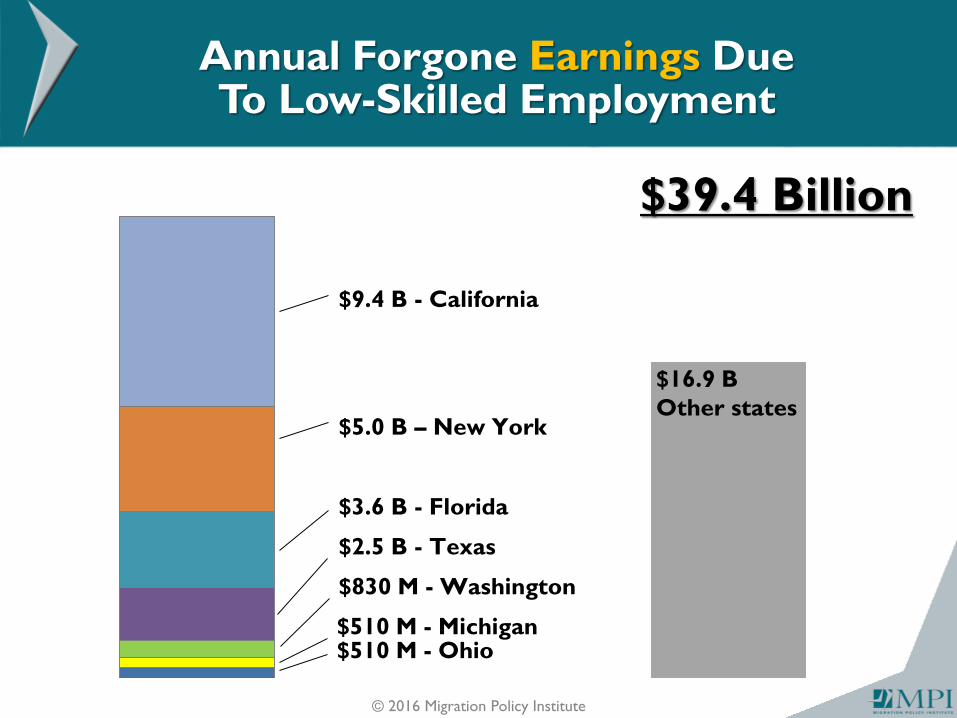
Annual Forgone Earnings Due To Low-Skilled Employment
$830 M - Washington
$510 M - Ohio $510 M - Michigan
$2.5 B - Texas
$5.0 B – New York
$9.4 B - California
$16.9 B
Other states
$3.6 B - Florida
© 2016 Migration Policy Institute
$39.4 Billion
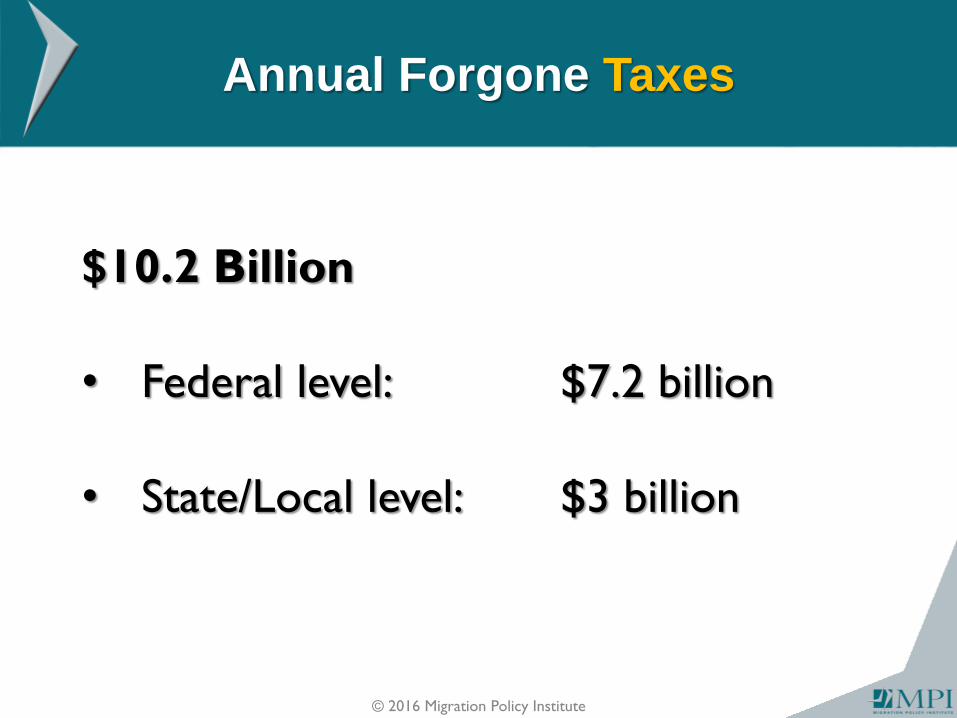
Annual Forgone Taxes
© 2016 Migration Policy Institute
$10.2 Billion
• Federal level: $7.2 billion
• State/Local level: $3 billion

Annual Forgone State and Local Taxes
State Forgone State & Local Taxes
California $694.8 M
New York $594.0 M
Florida $214.7 M
Texas $167.5 M
Washington $74.9 M
Ohio $53.0 M
Michigan $48.6 M
Total U.S. $3,033.6 M
© 2016 Migration Policy Institute
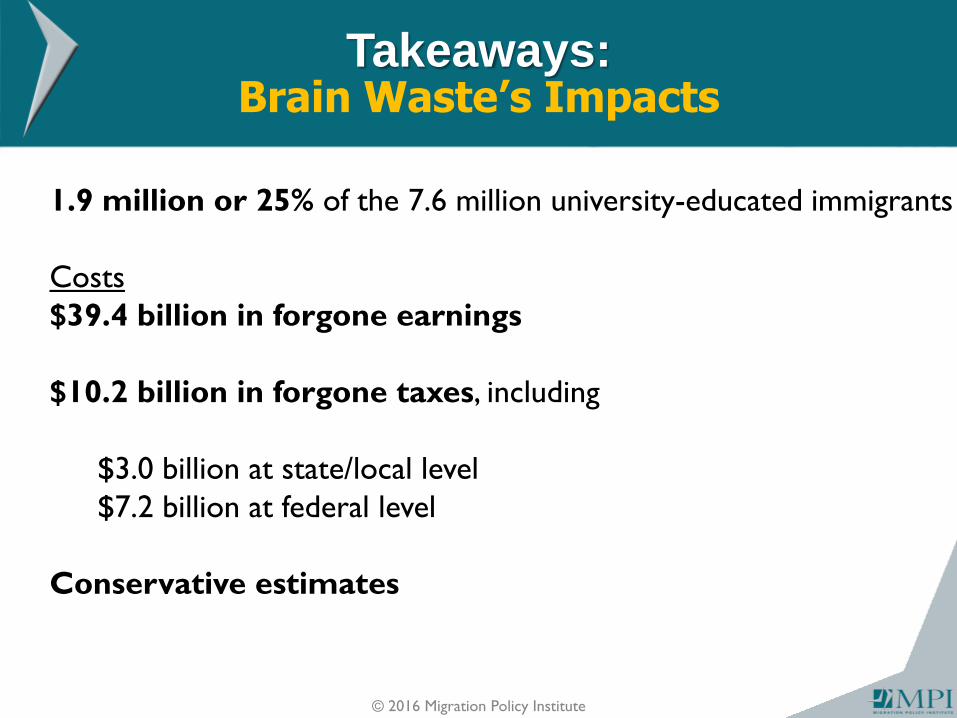
Takeaways: Brain Waste’s Impacts
© 2016 Migration Policy Institute
1.9 million or 25% of the 7.6 million university-educated immigrants
Costs
$39.4 billion in forgone earnings
$10.2 billion in forgone taxes, including
$3.0 billion at state/local level
$7.2 billion at federal level
Conservative estimates
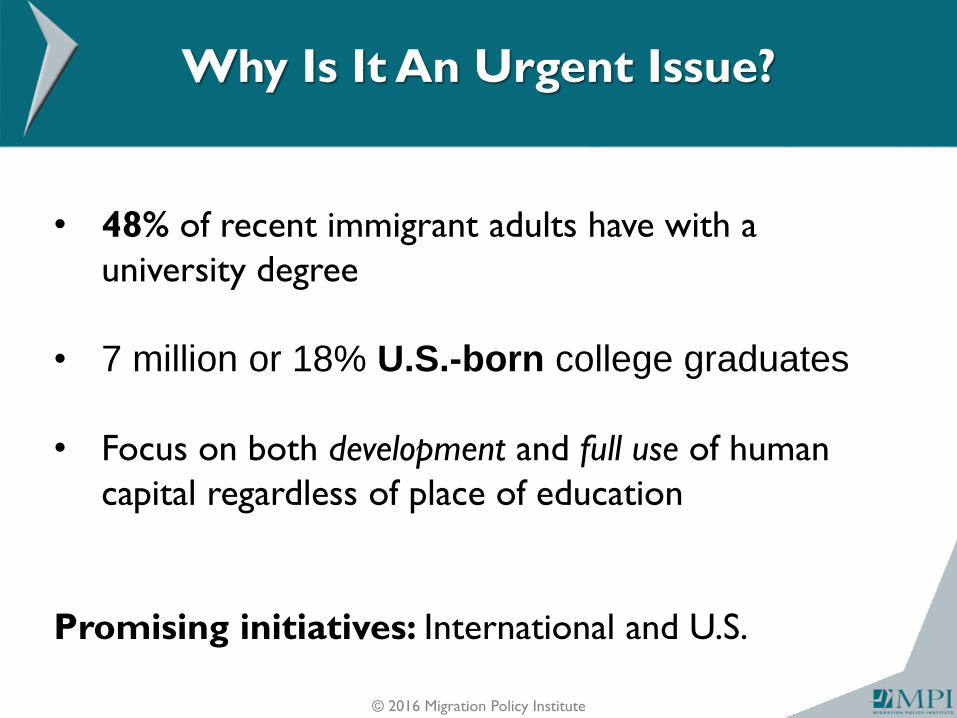
Why Is It An Urgent Issue?
© 2016 Migration Policy Institute
• 48% of recent immigrant adults have with a
university degree
• 7 million or 18% U.S.-born college graduates
• Focus on both development and full use of human
capital regardless of place of education
Promising initiatives: International and U.S.
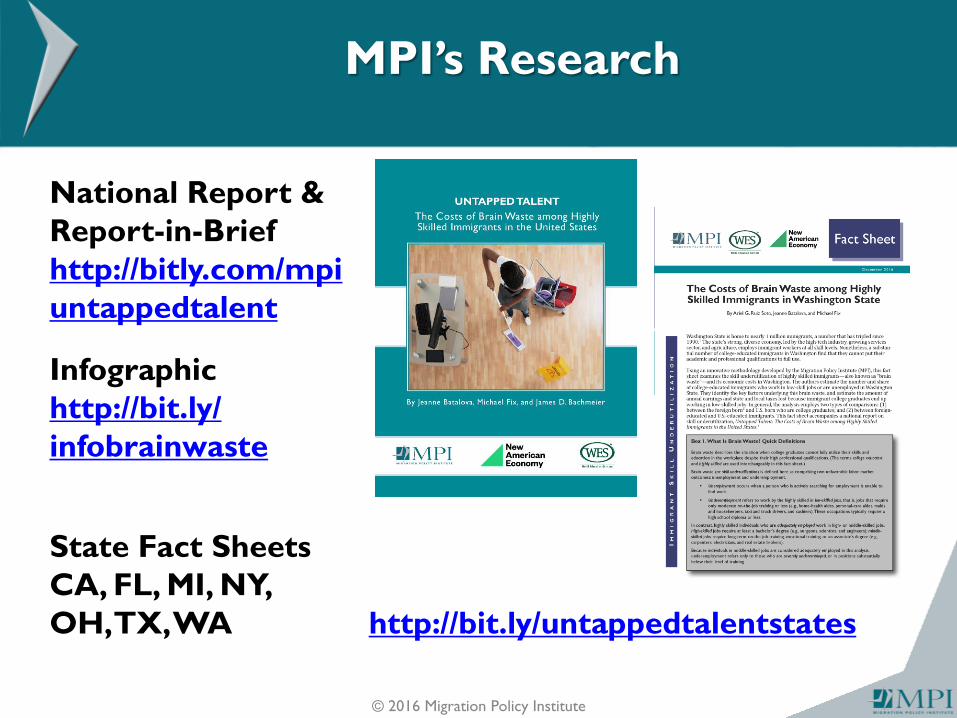
MPI’s Research
© 2016 Migration Policy Institute
National Report &
Report-in-Brief
http://bitly.com/mpi
untappedtalent
Infographic
http://bit.ly/
infobrainwaste
State Fact Sheets
CA, FL, MI, NY,
OH, TX, WA
http://bit.ly/untappedtalentstates
For More Information
© 2016 Migration Policy Institute
Contact us at
Jeanne Batalova, [email protected]
Michael Fix, [email protected]
Ariel Ruiz, [email protected]
Topic “Brain Waste and Credential Recognition:”
www.migrationpolicy.org/topics/brain-waste-credential-recognition
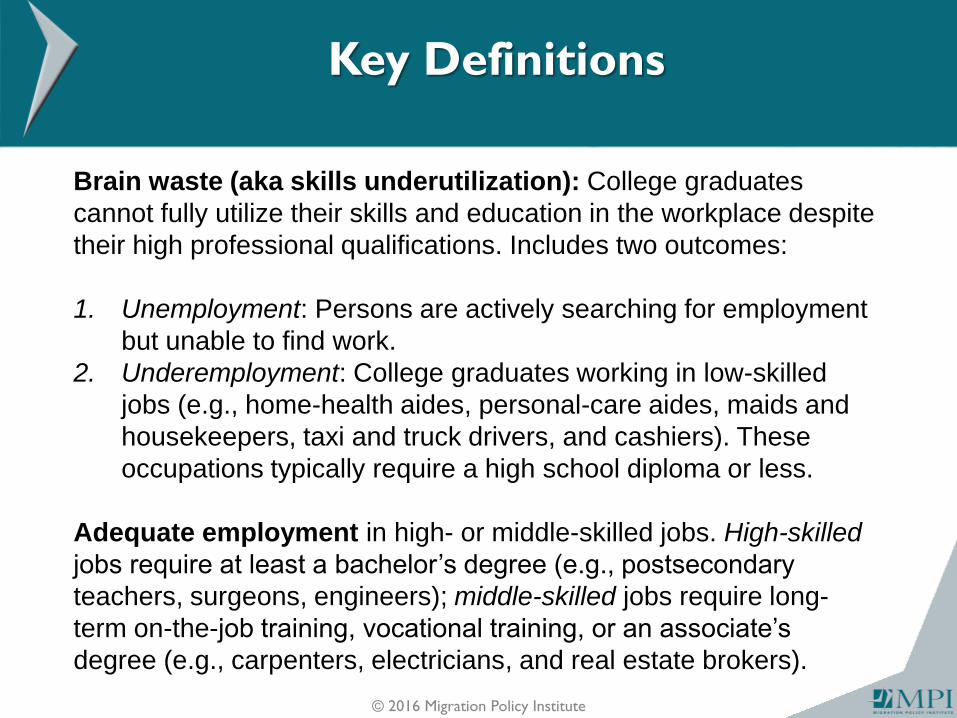
Key Definitions
© 2016 Migration Policy Institute
Brain waste (aka skills underutilization): College graduates
cannot fully utilize their skills and education in the workplace despite
their high professional qualifications. Includes two outcomes:
1. Unemployment: Persons are actively searching for employment
but unable to find work.
2. Underemployment: College graduates working in low-skilled
jobs (e.g., home-health aides, personal-care aides, maids and
housekeepers, taxi and truck drivers, and cashiers). These
occupations typically require a high school diploma or less.
Adequate employment in high- or middle-skilled jobs. High-skilled
jobs require at least a bachelor’s degree (e.g., postsecondary
teachers, surgeons, engineers); middle-skilled jobs require long-
term on-the-job training, vocational training, or an associate’s
degree (e.g., carpenters, electricians, and real estate brokers).
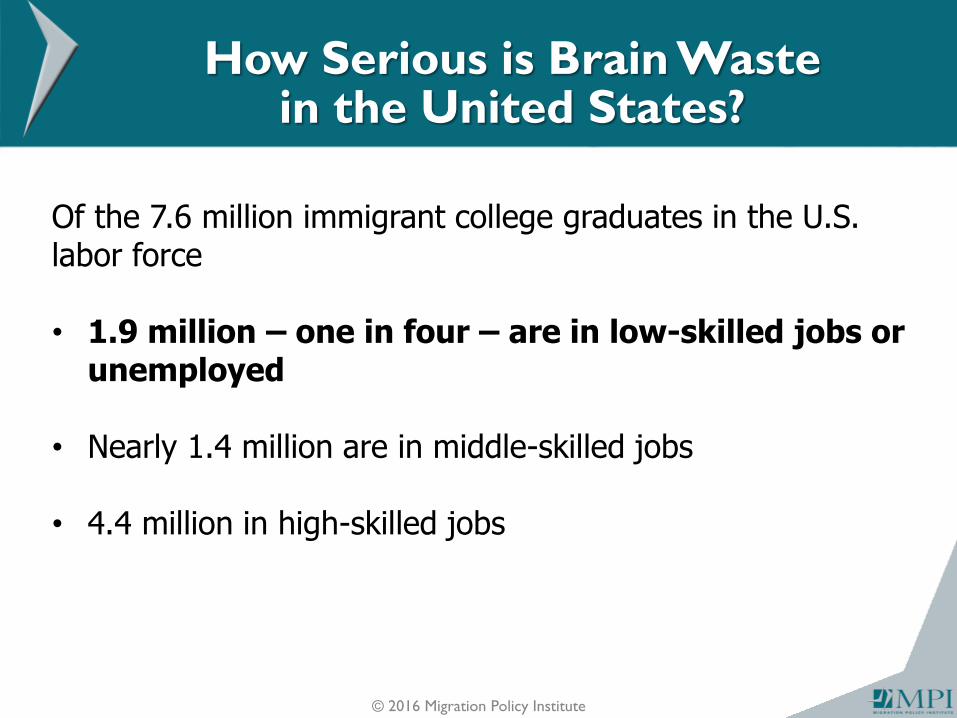
How Serious is Brain Waste in the United States?
© 2016 Migration Policy Institute
Of the 7.6 million immigrant college graduates in the U.S. labor force
• 1.9 million – one in four – are in low-skilled jobs or
unemployed • Nearly 1.4 million are in middle-skilled jobs
• 4.4 million in high-skilled jobs
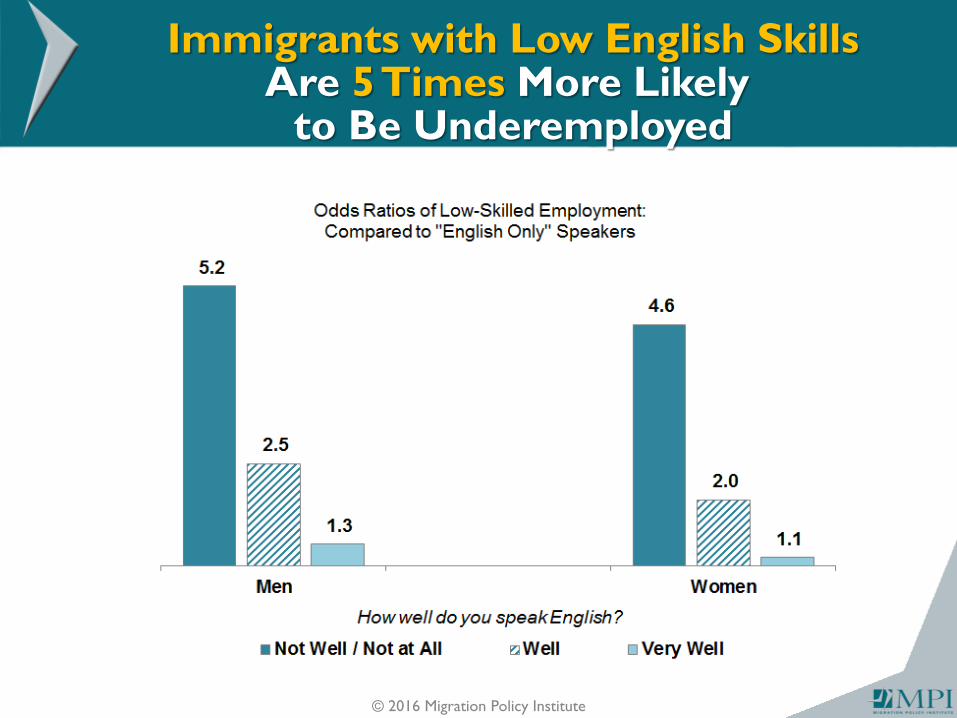
Immigrants with Low English Skills Are 5 Times More Likely
to Be Underemployed
© 2016 Migration Policy Institute
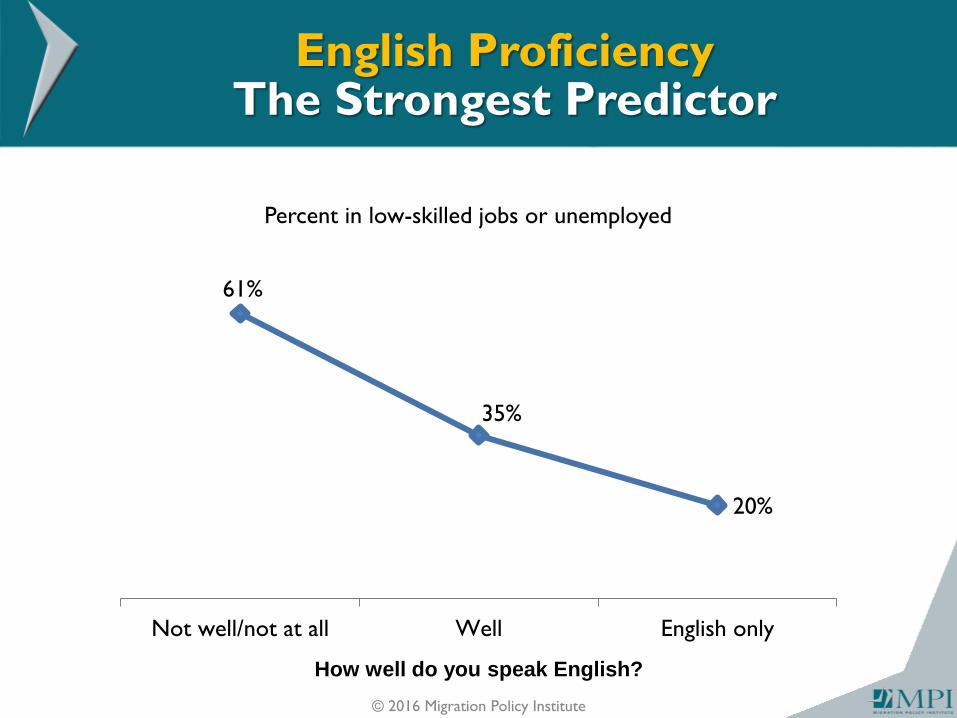
English Proficiency The Strongest Predictor
© 2016 Migration Policy Institute
61%
35%
20%
Not well/not at all Well English only
Percent in low-skilled jobs or unemployed
How well do you speak English?
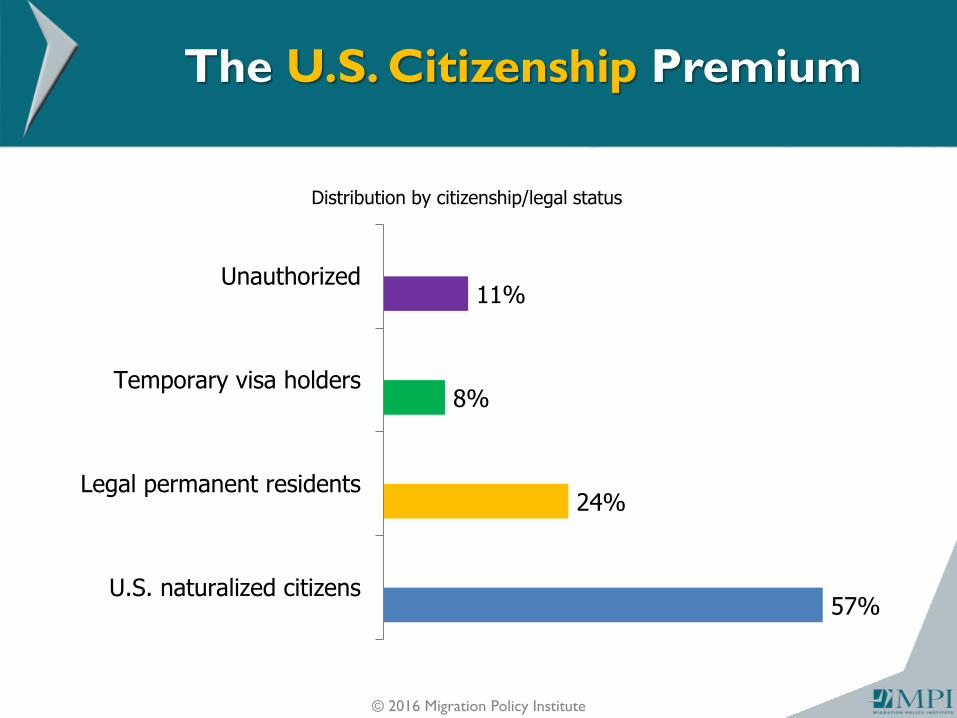
The U.S. Citizenship Premium
© 2016 Migration Policy Institute
57%
24%
8%
11%
U.S. naturalized citizens
Legal permanent residents
Temporary visa holders
Unauthorized
Distribution by citizenship/legal status

Immigrants with Degrees in Education and Business More Likely to Be Underutilized
© 2016 Migration Policy Institute
0%
5%
10%
15%
20%
25%
30%
35%
40%
Education Business Engineering Physical
Sciences
Computer
Sciences
Health Biological
Sciences
Immigrants U.S. Born
Percent in low-skilled jobs or unemployed