Embed Size (px)
Citation preview

The Economic Causes Of Crop Residue Burning in
Western Indo-Gangetic Plains∗
Ridhima Gupta†
Abstract
Biomass burning of agricultural field residue (stalks and stubble) during wheat andrice harvesting periods, in the Indo-Gangetic plains, has led to substantial emission oftrace gases and particles.This paper seeks to uncover the factors that explain on fieldresidue burning of rice residues in Indian Punjab. The results suggest that the use ofa Combine Harvester is the single most important determinant of the decision to burnrice residues. The decision to use the combine harvester in turn is determined by therice variety sown by a farmer. Coarse rice growers are more likely to use a CombineHarvester. Other factors which were considered important like size of livestock andtechnical ability of the farmer do not seem to have an impact on the decision to burnrice residues. These results have important implication for mitigation policies to reduceresidue burning in this region.
1 Introduction
Biomass burning of agricultural field residue (stalks and stubble) during wheat and
rice harvesting periods, in the Indo-Gangetic plains, is an important source of atmo-
spheric pollution in this region (Venkataraman et al., 2006). Consequently, regional
climate, and consequently crop output (Auffhammer et al., 2006), and the health
(Long et al., 1998) of the population are adversely affected. What factors explain
on field burning of crop residues in Indian Punjab? In this paper, I examine this
question in the context of rice residues; an extremely important issue given that
understanding why farmers burn is imperative to prescribing policy reforms. Hence
I hope to make a contribution to mitigation policies to reduce residue burning in
this region.
The ‘rice-wheat cropping system’ (RWCS) is the dominant cropping system in
South Asia spanning over an estimated 12 million hectares in 1991 and extending
over the four countries of Bangladesh, India, Nepal and Pakistan (Hobbs and Morris,
∗Financial support from the South Asian Network for Development and Environmental Economics (SANDEE) is grate-fully acknowledged. I am grateful to my supervisor Dr. E. Somanathan and Dr. Jean Marie Baland for their suggestions onthis research. I thank Harjit Singh and Shyam Kumar for excellent implementation of the surveys. Errors, if any, are my own.†Research Fellow,Indian Statistical Institute,Delhi. Email:[email protected]
1
1996). This system involves that rice and wheat be grown in rotation throughout the
year. Rice and wheat may be grown in the same plot in the same year or in different
plots in the same year or in the same plot in different years. In India the rice-wheat
system was spread over 9.1 million hectares in 1991(Hobbs and Morris, 1996).The
states of India with the largest areas under rice-wheat cropping systems are Uttar
Pradesh, Punjab, Haryana, Bihar, Madhya Pradesh, and Himachal Pradesh.
The residue to product ratio (RPR) indicates the amount of residue available
for each tonne of crop produce. Thus, an RPR of 2 would indicate that 2 tonne of
residue is produced for 1 tonne of crop produce. In case rice is cut at about 2 inches
above ground, the RPR of rice straw equals 1.75 whereas it falls to 0.452 if only the
top portion of the rice stem is cut (Koopmans and Koppejan, 1997). Using these
RPR values Koopmans and Koppejan (1997) estimated that about 507,837 thousand
tonnes of on field crop residue was generated in India during 1997 of which 43 percent
was rice and 23 percent wheat. The estimates from Streets et al. (2003) imply that
16 percent of this crop residue was burnt. The results from Venkataraman et al.
(2006) suggest that 116 million metric tonnes of crop residue was burnt in India in
2001, but with a strong regional variation. A majority of the fires occurred in the
western Indo-Gangetic plain during the months of May and October corresponding
to the two major harvesting seasons for rice and wheat. The authors’ conclude
that ‘the harvesting of cereal wastes and their field burning in major agricultural
states such as Punjab, Haryana and Western Uttar Pradesh is the largest potential
contributor to these emissions.’
Emissions from the burning of fossil fuels and biomass have led to the creation
of atmospheric brown clouds of black carbon and aerosols in various parts of the
world (Auffhammer et al., 2006). These clouds reduce surface radiation and rain-
fall(Auffhammer et al., 2006). Auffhammer et al. (2006) found that joint reductions
in brown clouds and greenhouse gases had complementary, positive impact on rice
harvests. The authors’ estimate that rice yield and the area harvested would have
increased by 14.4 percent during 1985-1998 if brown clouds and greenhouse gases
had been reduced. Gustafsson et al. (2009) employed radiocarbon analysis (14C)
as an atmospheric tracer to measure biomass and fossil-fuel contributions to the
South Asian atmospheric brown cloud. They found a much larger contribution of
biomass combustion to black carbon emissions (46% for elemental carbon and 68%
for soot carbon) than do other tracer techniques. Thus, they stipulated that ‘both
biomass combustion (such as residential cooking and agricultural burning) and fossil
fuel combustion should be targeted to mitigate climate effects and improve air qual-
2
ity’. Emissions of black carbon are the second most contribution to current global
warming, after carbon dioxide emissions Ramanathan and Carmichael (2008). The
authors’ claim that in the Himalayan region heating from black carbon at higher
elevations has as large an effect on the meting of snowpacks and glaciers as heating
due to greenhouse gases. Furthermore, when black carbon is deposited over snow
and sea ice, it darkens the snow thereby significantly enhancing solar absorption by
snow and ice leading to a retreat of the Arctic sea ice. It is also well established that
large concentration of aerosols lead to the creation of fog that reduces visibility. Low
visibility causes multiple accidents and delays in road, railway and air transport.
Long et al. (1998) studied the health consequences from burning of agricultural
residue. They surveyed 428 participants with underlying respiratory disorders and
exposure to pollution from burning of agricultural residues. The authors’ found that
people with underlying respiratory disorders were susceptible to the air pollution
caused by burning of agricultural residue.Underlying symptoms either became worse
or additional air pollution related symptoms were induced. In summary, biomass
combustion needs to be regulated to mitigate these health and climate effects. The
first step in this direction involves understanding why farmers burn. The objective
of this study is to try and provide an answer to this question and the setting is
Indian Punjab.
2 Literature Review
There is limited research examining the factors that influence the decision to burn
crop residues. Erenstein et al. (2007b) seek to understand the spatial and sea-
sonal diversity in farming practices across the Trans-Gangetic Plains (Punjab and
Haryana) particularly in terms of crop livestock interactions. The primary data
source for the study in Punjab is a village level survey with self selected groups
of informants from the district of Patiala. The authors’ find that the practice of
in-situ burning as a land preparation measure is present for both the rice and the
wheat crops. However, rice residues are burnt on a much larger scale than wheat
residues. Only rice residues from Basmati varieties are used as animal feed. Coarse
rice residues are not fed to livestock due to the perceived high silica content and
fear of reduced milk yields.
They contend that the choice of the harvesting mode (manual or combine) has
direct implications for crop residue management. Manual harvesting of cereal crops
allows for retrieval of crop by-products as crops are cut at near ground level. Com-
3
bine harvesters on the other hand make residue recovery difficult as the residue is
unevenly spread over the harvested fields. Despite this 85 percent of the surveyed
households in the Patiala cluster reported combine use. The authors’ attribute the
popularity of combine harvesters to potential cost savings, reduced labour man-
agement problems and enhanced timeliness. Manual harvesting is widespread for
Basmati varieties for reasons such as reduced breakage, more prone to lodging (re-
ducing effectiveness of mechanical harvesting), more limited field size and more
intensive residue use.
Gupta et al. (2004) attribute the open field burning of crop residues to combine
harvesters that leave a large amount of loose residue on the field. The authors’ assert
that a major constraint in a rice- wheat cropping system is the available short time
between rice harvesting (late October and early November) and sowing of wheat
(November). Given this short time, farmers find it difficult to utilise the residue
and hence opt for burning.
3 Study Area and Sampling
The state of Punjab, which is the site for this study, is in north-western India.
In 2006-2007, Punjab was the fourth largest producer of rice and second largest
producer of wheat in India, producing 11 percent of the country’s rice output and
19 percent of its wheat output (Ray, 2008). With rice and wheat yields of 3858 Kg
per hectare and 4179 Kg per hectare respectively in 2005-06, the state occupied the
top position in the country in terms of food grain yield (Ray, 2008). The ratio of
net irrigated area to net area sown stood at 0.95 in 2005-06 and is the highest in
the country (Ray, 2008).
Punjab is divided into 17 districts. The districts of Amritsar, Ludhiana and
Sangrur were purposively selected to undertake the survey. I chose these 3 districts
because I wanted to capture geographical variation across Punjab (see Appendix 1).
In the second stage, 10 villages were selected for sampling from each of the
districts, using the probability proportional to size technique. This technique ensures
that farmers in larger villages have the same probability of getting into the sample
as farmers in smaller villages and vice-versa.
The list of villages was obtained from the 2001 Census of India data. Within
a village voter lists constituted the sampling frame. A voter list assigns a unique
household number to each household in a village and specifies the names of all
household members who are at least 18 years of age at the time of the preparation
4

of the list. The decision to use the voter list as a sampling frame was taken after
conducting a census of a village. The census revealed that the voter list is not grossly
distorted. Consequently it was decided to use the voter list as a sampling frame.
Each village is bound to be populated by people who do not engage in any farming
activity. Hence on an average 40 households were randomly selected from each
voter list. If the first household amongst the 40 households was a farm household
it was included in the survey else it was dropped and the second household was
contacted. This procedure was followed until the enumerator was able to complete
10 interviews. However, 32 farm households were purposively surveyed and hence
had to be excluded from the analysis.
I define a farm household as a group of individuals related by blood or marriage
living on the same premises and sharing a kitchen and practising the rice-wheat
cropping system. The respondents to the questionnaire were men who were actively
involved in day to day farming activity.
Data were collected at plot level as a farm is not one consolidated unit. The
total farm area is distributed across plots and farmers follow different practices on
different plots. The size of a farm unit is arrived at by summing farm land owned
and farm land leased in and subtracting from this total farm land leased out. The
total number of plots for which data were collected are 604.
To sum up, I collected data on 604 plots belonging to 268 farm households from
30 villages across 3 districts of Punjab. I conducted this survey between January
and April in 2010.
4 Data and Descriptive Statistics
Farmers foremost decide on the rice variety to be sown and the area to be sown to
each variety. Rice is a Kharif1 crop hence it is sown in the months of June-July.
For 90 percent of the respondents the price and yield of various varieties during
the previous growing season were the key factors in arriving at this decision. The
Food Corporation of India (FCI) procures rice and wheat from the farmers for
which the minimum support price (MSP) is announced by the Government of India.
Farmers are free to sell any quantity of grain at this price. The fine grain (Basmati)
varieties do not fall under this scheme. The minimum support price was announced
on 20th August in 2009 hence farmers had to rely on the prices that had prevailed
during the previous season. The Food Corporation of India (FCI) further classifies
1There are 2 growing seasons in India i.e. Kharif and Rabi. Kharif crops are usually sown with the beginning of rains inJune- July, during the south west monsoon season.
5
Coarse varieties into grade A and common varieties. The minimum support prices
for grade A variety and common variety were fixed at 980 Rs per quintal ($21 per
quintal) and 950 Rs per quintal ($20 per quintal) respectively in 2009. The fine-
grain varieties are priced within the range of 2000-3500 Rs per quintal ($43-$75)
depending on its quality. During 2008-2009 the price of PUSA 1121 Basmati variety
was pegged at 2000 Rs per quintal2. This prompted farmers to increase the area
sown to this variety in the following season.3 Consequently, in my sample 75 percent
of the Basmati area is under the PUSA 1121 variety.
The survey results indicate that 21 percent of the respondents cultivate Basmati
varieties and 47 percent of the respondents cultivate Coarse varieties. 32 percent of
the respondents grow both type of varieties.
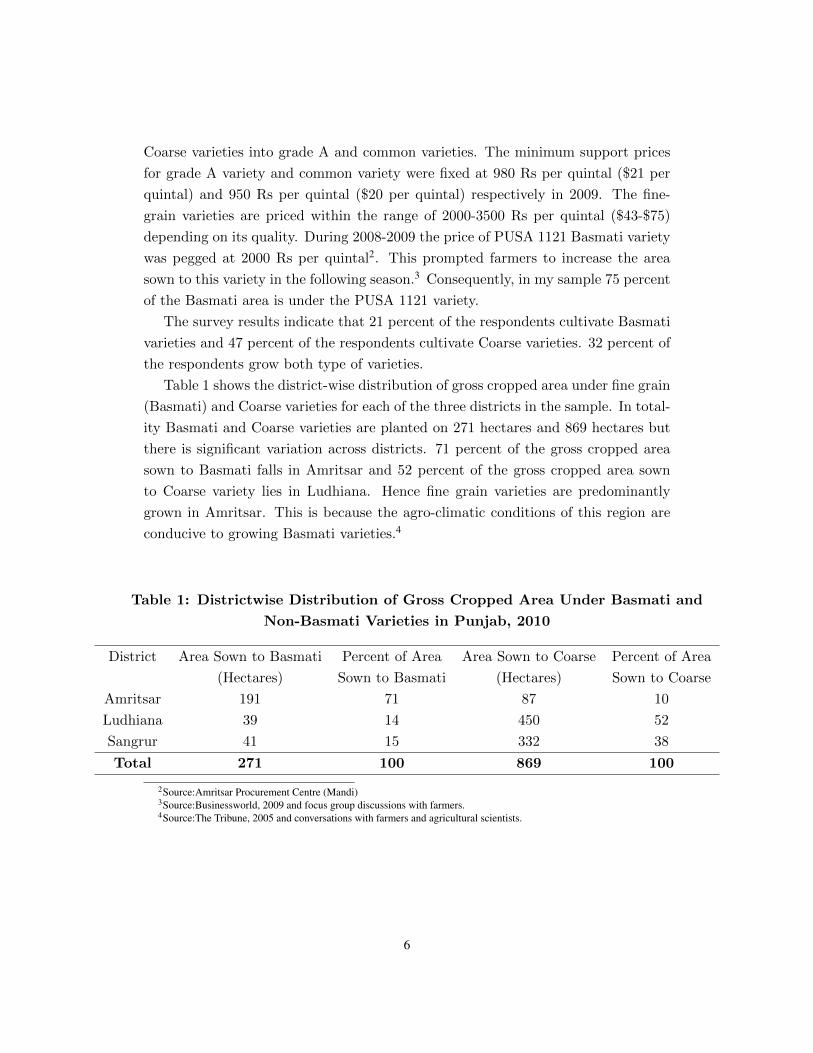
Table 1 shows the district-wise distribution of gross cropped area under fine grain
(Basmati) and Coarse varieties for each of the three districts in the sample. In total-
ity Basmati and Coarse varieties are planted on 271 hectares and 869 hectares but
there is significant variation across districts. 71 percent of the gross cropped area
sown to Basmati falls in Amritsar and 52 percent of the gross cropped area sown
to Coarse variety lies in Ludhiana. Hence fine grain varieties are predominantly
grown in Amritsar. This is because the agro-climatic conditions of this region are
conducive to growing Basmati varieties.4
Table 1: Districtwise Distribution of Gross Cropped Area Under Basmati and
Non-Basmati Varieties in Punjab, 2010
District Area Sown to Basmati Percent of Area Area Sown to Coarse Percent of Area
(Hectares) Sown to Basmati (Hectares) Sown to Coarse
Amritsar 191 71 87 10
Ludhiana 39 14 450 52
Sangrur 41 15 332 38
Total 271 100 869 100
2Source:Amritsar Procurement Centre (Mandi)3Source:Businessworld, 2009 and focus group discussions with farmers.4Source:The Tribune, 2005 and conversations with farmers and agricultural scientists.
6
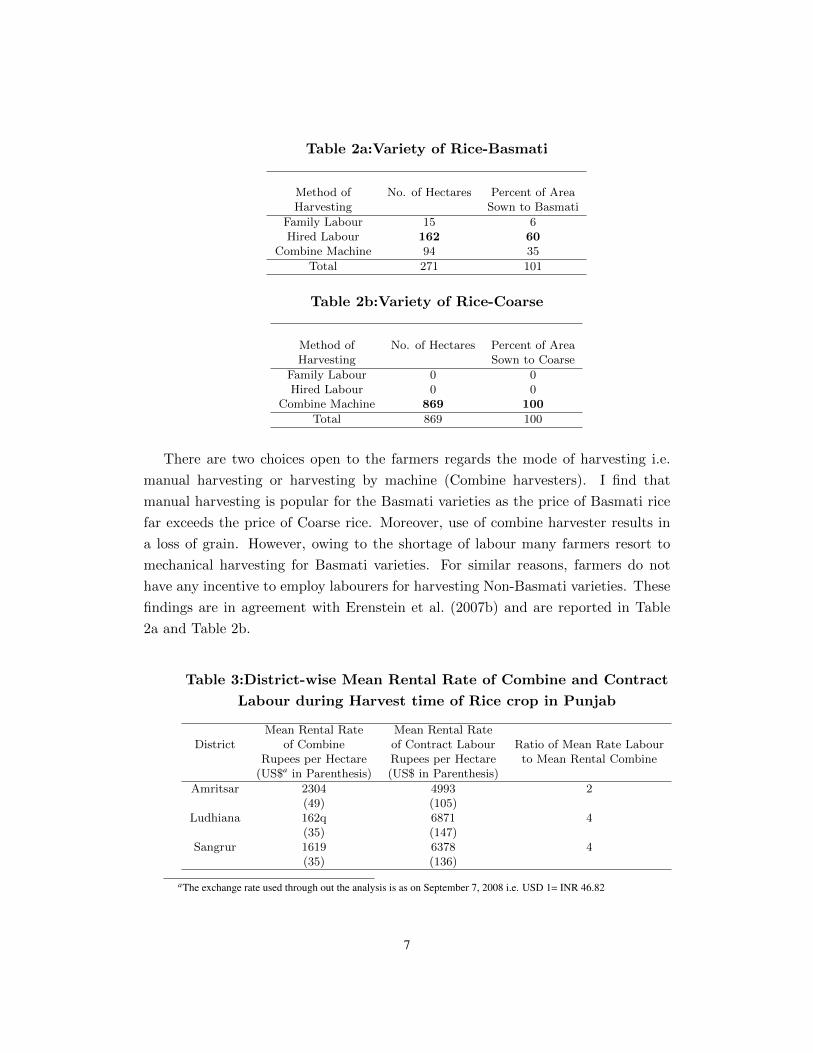
Table 2a:Variety of Rice-Basmati
Method of No. of Hectares Percent of AreaHarvesting Sown to Basmati
Family Labour 15 6Hired Labour 162 60
Combine Machine 94 35
Total 271 101
Table 2b:Variety of Rice-Coarse
Method of No. of Hectares Percent of AreaHarvesting Sown to Coarse
Family Labour 0 0Hired Labour 0 0
Combine Machine 869 100
Total 869 100
There are two choices open to the farmers regards the mode of harvesting i.e.
manual harvesting or harvesting by machine (Combine harvesters). I find that
manual harvesting is popular for the Basmati varieties as the price of Basmati rice
far exceeds the price of Coarse rice. Moreover, use of combine harvester results in
a loss of grain. However, owing to the shortage of labour many farmers resort to
mechanical harvesting for Basmati varieties. For similar reasons, farmers do not
have any incentive to employ labourers for harvesting Non-Basmati varieties. These
findings are in agreement with Erenstein et al. (2007b) and are reported in Table
2a and Table 2b.
Table 3:District-wise Mean Rental Rate of Combine and Contract
Labour during Harvest time of Rice crop in Punjab
Mean Rental Rate Mean Rental RateDistrict of Combine of Contract Labour Ratio of Mean Rate Labour
Rupees per Hectare Rupees per Hectare to Mean Rental Combine(US$a in Parenthesis) (US$ in Parenthesis)
Amritsar 2304 4993 2(49) (105)
Ludhiana 162q 6871 4(35) (147)
Sangrur 1619 6378 4(35) (136)
aThe exchange rate used through out the analysis is as on September 7, 2008 i.e. USD 1= INR 46.82
7
It is also much cheaper and quicker to use combine harvesters than to employ
labour. These time savings are dear to the farmers as there is a short time between
rice harvesting (mid October-early December and sowing of wheat November-early
December). Any delay in planting reduces the productivity of the wheat crop. It is
because of these reasons that combine harvesters are popular with farmers. Table 3
displays the mean rental rate of Combines and Contract labour across 3 districts of
Punjab. Farmers in Ludhiana save about $112 per hectare by opting for a Combine
Harvester.The corresponding figures for Amritsar and Sangrur are $56 and $102.
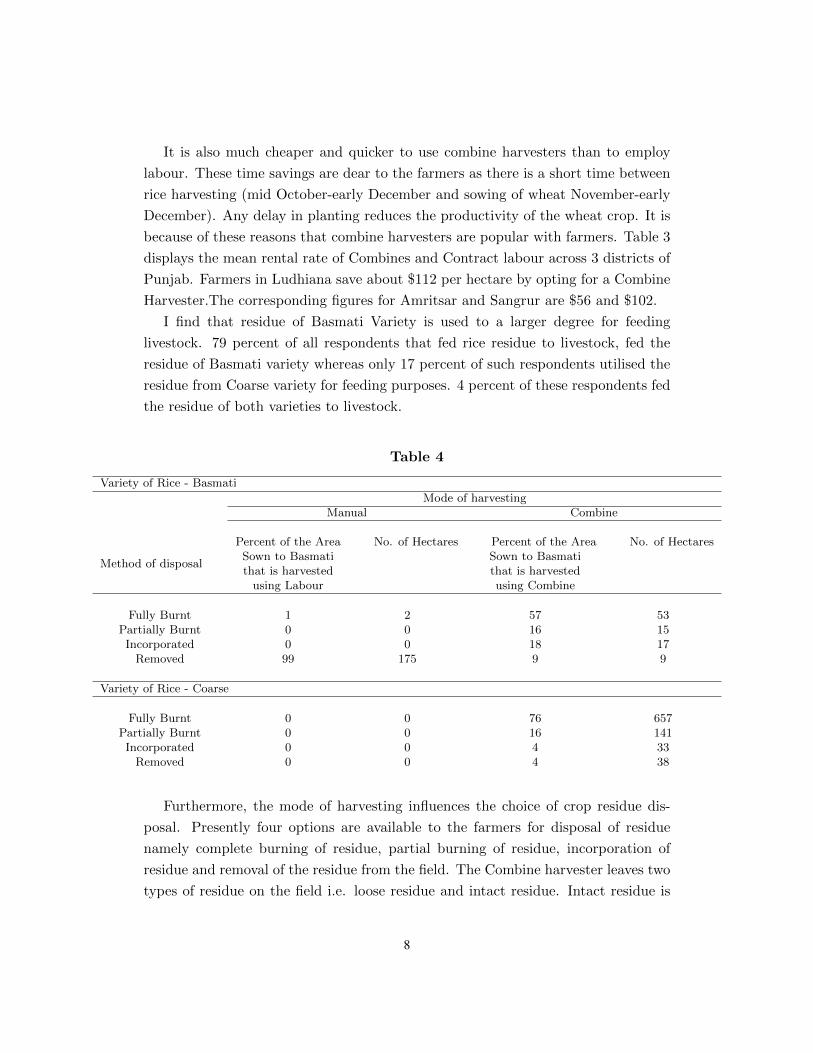
I find that residue of Basmati Variety is used to a larger degree for feeding
livestock. 79 percent of all respondents that fed rice residue to livestock, fed the
residue of Basmati variety whereas only 17 percent of such respondents utilised the
residue from Coarse variety for feeding purposes. 4 percent of these respondents fed
the residue of both varieties to livestock.
Table 4
Variety of Rice - Basmati
Method of disposal
Mode of harvestingManual Combine
Percent of the Area No. of Hectares Percent of the Area No. of HectaresSown to Basmati Sown to Basmatithat is harvested that is harvested
using Labour using Combine
Fully Burnt 1 2 57 53Partially Burnt 0 0 16 15Incorporated 0 0 18 17
Removed 99 175 9 9
Variety of Rice - Coarse
Fully Burnt 0 0 76 657Partially Burnt 0 0 16 141Incorporated 0 0 4 33
Removed 0 0 4 38
Furthermore, the mode of harvesting influences the choice of crop residue dis-
posal. Presently four options are available to the farmers for disposal of residue
namely complete burning of residue, partial burning of residue, incorporation of
residue and removal of the residue from the field. The Combine harvester leaves two
types of residue on the field i.e. loose residue and intact residue. Intact residue is
8

the stalk of the rice plant that is left standing in the field after the combine has cut
the top most portion of the plant that carries the grain. Its height varies from 8 to
10 inches. Loose residue is the residue that is scattered by the combine after the
harvesting and threshing of the rice crop. This part of the residue is hard to retrieve
as it is unevenly distributed over the field. Complete burning involves burning loose
and intact residue. Partial burning involves burning loose residue only.
As Table 4 shows, rice residue from 2 hectares was burnt after manual harvesting
while residue from 866 hectares was burnt post harvesting by a Combine machine.
Residue of Basmati varieties that are hand harvested are sought after as 99 percent
of this residue is cleared from the field. On the other hand residue of Coarse varieties
that are combine harvested are not considered to be valuable as 92 percent of such
residues are burnt.
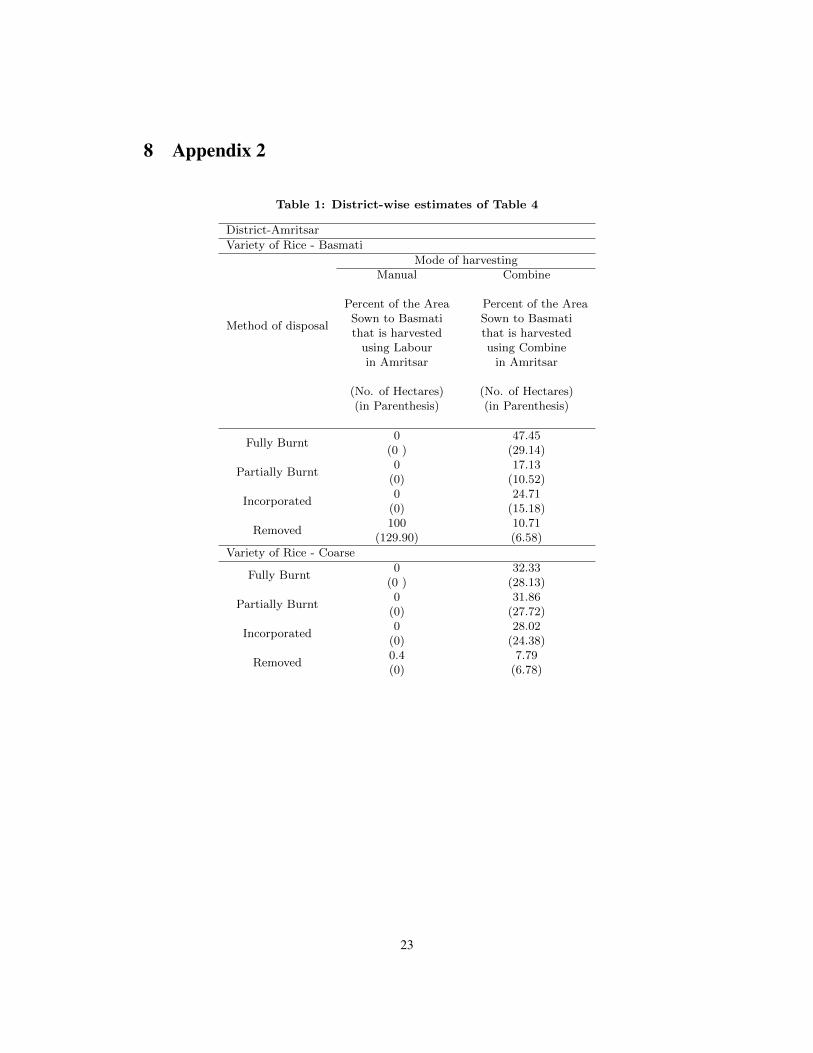
Table 4 displays the aggregated results.The district-wise estimates reveal that
burning of residues is less pronounced in Amritsar (See Appendix 1 Table 1-3).
This is not surprising as there is a stringent ban against burning of rice residues in
Amritsar.
Monetary savings and enhanced timeliness seem to provide the driver for burning
rice residues (See Table 5). Farmers who cultivate potato following rice need to burn
rice residues as potato cultivation requires land to be clean. Some farmers also burn
because they believe that burning of residues leads to the destruction of weeds that
may cause harm to the subsequent crop.
Table 5: Reaons for Burning Rice Residue
Serial No. Reason Percent of respondentsthat burnt rice residuea
1 Saves Money 512 Machinery that enables 48
ploughing of residueis unavailable
3 Saves Time 484 Others 11
aPercentages to not add up to 100 as respondents could provide multiple answers to this question.
5 Model and Results
Let b=1 denote burning of residue and b=0 otherwise. Likewise c=1 denotes usage of
a combine machine and ‘c=0’ otherwise. Let b∗ be an unobserved, or latent variable,
9
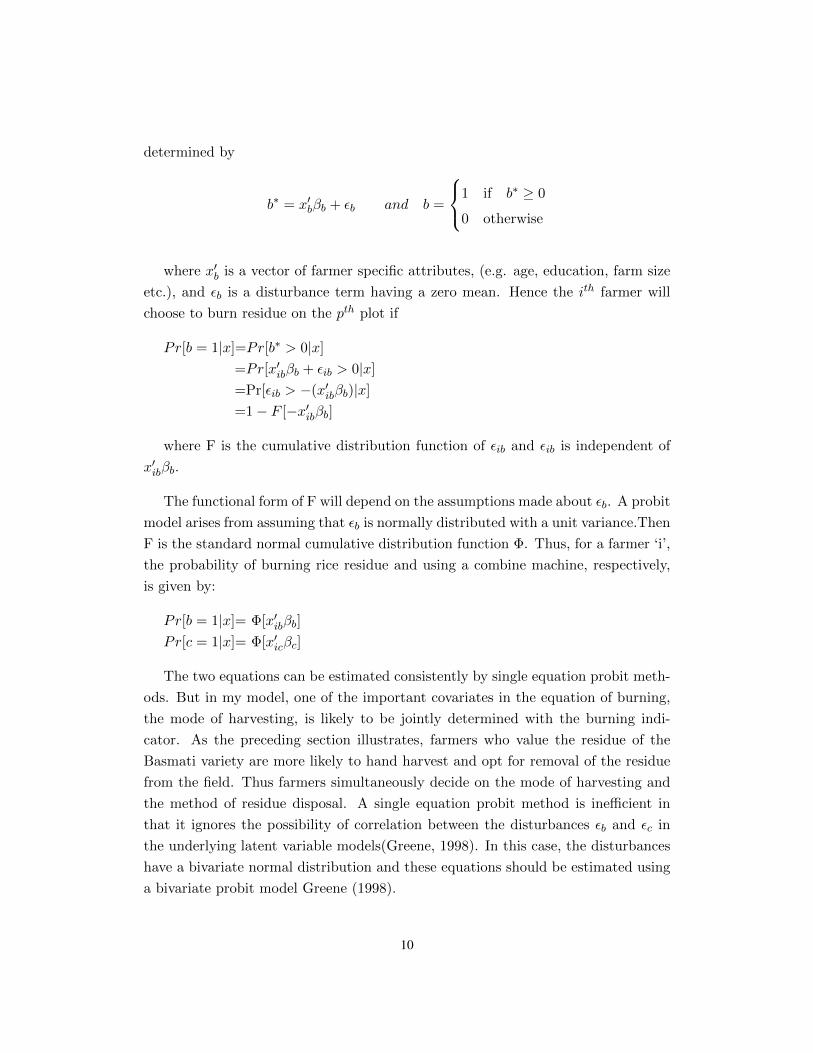
determined by
b∗ = x′bβb + εb and b =
1 if b∗ ≥ 0
0 otherwise
where x′b is a vector of farmer specific attributes, (e.g. age, education, farm size
etc.), and εb is a disturbance term having a zero mean. Hence the ith farmer will
choose to burn residue on the pth plot if
Pr[b = 1|x]=Pr[b∗ > 0|x]
=Pr[x′ibβb + εib > 0|x]
=Pr[εib > −(x′ibβb)|x]
=1− F [−x′ibβb]
where F is the cumulative distribution function of εib and εib is independent of
x′ibβb.
The functional form of F will depend on the assumptions made about εb. A probit
model arises from assuming that εb is normally distributed with a unit variance.Then
F is the standard normal cumulative distribution function Φ. Thus, for a farmer ‘i’,
the probability of burning rice residue and using a combine machine, respectively,
is given by:
Pr[b = 1|x]= Φ[x′ibβb]
Pr[c = 1|x]= Φ[x′icβc]
The two equations can be estimated consistently by single equation probit meth-
ods. But in my model, one of the important covariates in the equation of burning,
the mode of harvesting, is likely to be jointly determined with the burning indi-
cator. As the preceding section illustrates, farmers who value the residue of the
Basmati variety are more likely to hand harvest and opt for removal of the residue
from the field. Thus farmers simultaneously decide on the mode of harvesting and
the method of residue disposal. A single equation probit method is inefficient in
that it ignores the possibility of correlation between the disturbances εb and εc in
the underlying latent variable models(Greene, 1998). In this case, the disturbances
have a bivariate normal distribution and these equations should be estimated using
a bivariate probit model Greene (1998).
10
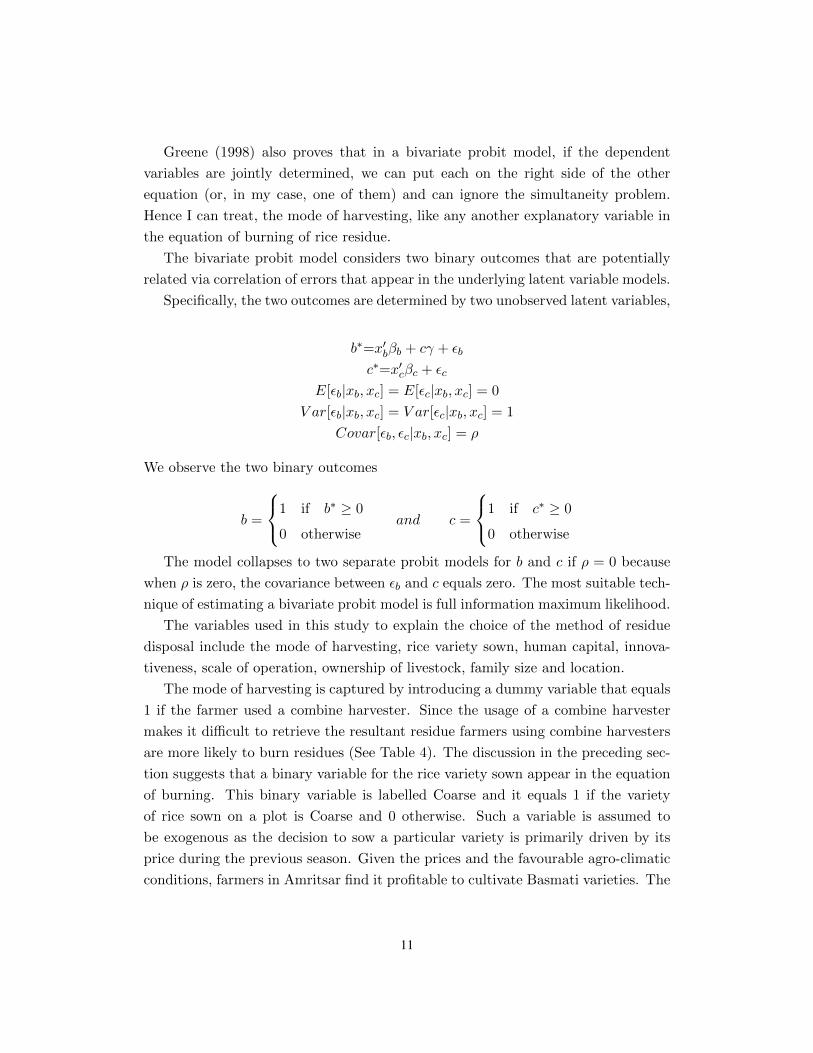
Greene (1998) also proves that in a bivariate probit model, if the dependent
variables are jointly determined, we can put each on the right side of the other
equation (or, in my case, one of them) and can ignore the simultaneity problem.
Hence I can treat, the mode of harvesting, like any another explanatory variable in
the equation of burning of rice residue.
The bivariate probit model considers two binary outcomes that are potentially
related via correlation of errors that appear in the underlying latent variable models.
Specifically, the two outcomes are determined by two unobserved latent variables,
b∗=x′bβb + cγ + εb
c∗=x′cβc + εc
E[εb|xb, xc] = E[εc|xb, xc] = 0
V ar[εb|xb, xc] = V ar[εc|xb, xc] = 1
Covar[εb, εc|xb, xc] = ρ
We observe the two binary outcomes
b =
1 if b∗ ≥ 0
0 otherwiseand c =
1 if c∗ ≥ 0
0 otherwise
The model collapses to two separate probit models for b and c if ρ = 0 because
when ρ is zero, the covariance between εb and c equals zero. The most suitable tech-
nique of estimating a bivariate probit model is full information maximum likelihood.
The variables used in this study to explain the choice of the method of residue
disposal include the mode of harvesting, rice variety sown, human capital, innova-
tiveness, scale of operation, ownership of livestock, family size and location.
The mode of harvesting is captured by introducing a dummy variable that equals
1 if the farmer used a combine harvester. Since the usage of a combine harvester
makes it difficult to retrieve the resultant residue farmers using combine harvesters
are more likely to burn residues (See Table 4). The discussion in the preceding sec-
tion suggests that a binary variable for the rice variety sown appear in the equation
of burning. This binary variable is labelled Coarse and it equals 1 if the variety
of rice sown on a plot is Coarse and 0 otherwise. Such a variable is assumed to
be exogenous as the decision to sow a particular variety is primarily driven by its
price during the previous season. Given the prices and the favourable agro-climatic
conditions, farmers in Amritsar find it profitable to cultivate Basmati varieties. The
11
availability of human capital is indicated by years of education of the farmer. In-
novativeness and technical ability are proxied by the viewer-ship of a programme
related to farming, contact with extension services and whether the farmer reads
agricultural magazines. Small scale farmers may be more inclined to remove the
residue from the fields for feeding livestock. The raw data in fact suggests that
small scale farmers are more likely to remove residue from fields. This effect of the
scale of operation is captured by farm size. The number of livestock owned per
hectare of farm area indicates the demand for fodder relative to its supply. The
higher is the number of livestock owned per hectare of farm area the greater is the
demand for rice residues as rice residues are used as livestock feed. The discussion
in the preceding section, however, suggests that this effect may vary by the rice
variety sown. Hence, I introduce a variable that interacts the number of livestock
with the rice variety sown by a farmer on a plot. Family size is proxied by the
number of family members equal to or above 15 years of age in the household per
hectare of farm area sown to rice. Since there was a ban on burning crop residues
in the district of Amritsar, a dummy variable indicating the location of a farmer is
included as a variable in the equation of burning. The descriptive statistics of the
variables included in the analyisis are given in Table 7.
The dependent variables in the equation of mode of harvesting are Coarse, Farm
Size, Number of livestock owned per hectare of farm area, Family labour available
to the household per hectare of farm area sown to rice, Rental rate of a combine
harvester in village, Rental rate of contract labour in village and Amritsar. The
discussion in the preceding section indicates that the rice variety sown has implica-
tions for the mode of harvesting (manual or combine). Small scale farmers may be
more inclined to use their own labour or employ labour for harvesting purposes for
Basmati vareties. Farmers who own livestock are more likely to harvest the crop
manually but I allow for this effect to vary with the variety of rice sown. Location
is captured by retaining the dummy variable Amritsar as an explanatory variable
in this equation.
5.1 Discussion Of Results
The estimated marginal effects of the variables in the two equations are given in
Table 8. The model has been estimated by bivariate probit methods using maximum
likelihood as the estimation criterion. All standard errors have been corrected for
clustering at the farmer level. I use Murphy’s score test of normality (Murphy, 2007)
12
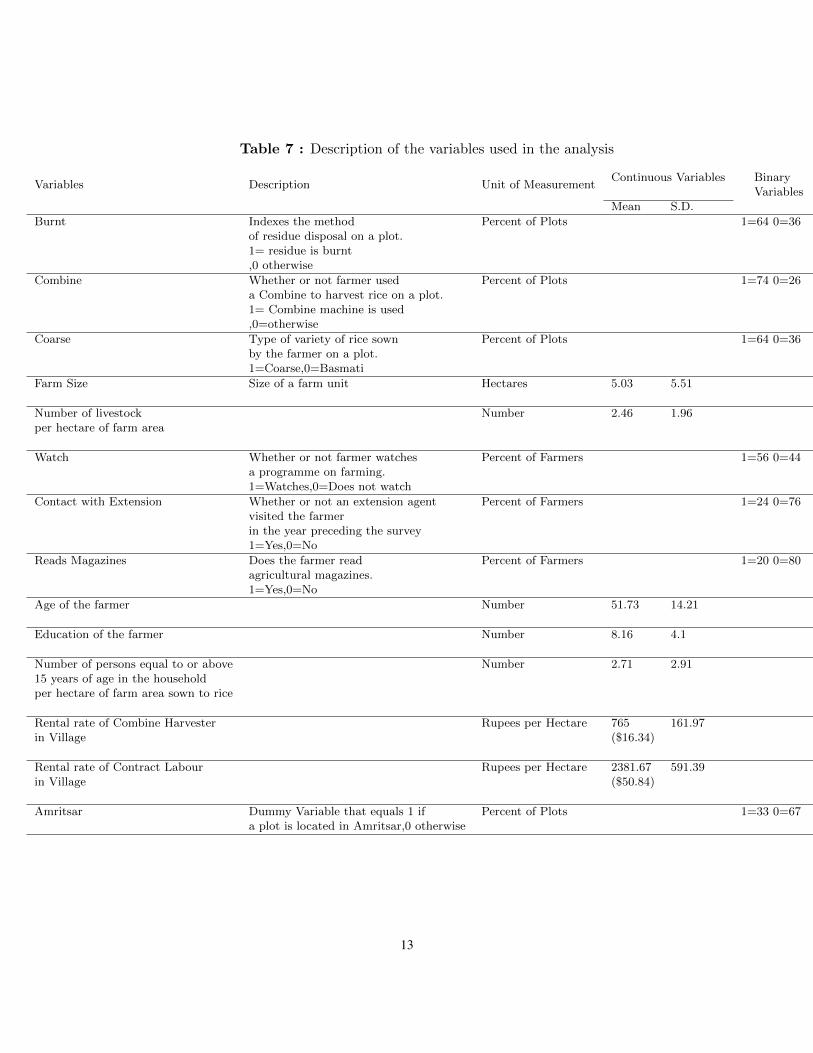
Table 7 : Description of the variables used in the analysis
Variables Description Unit of MeasurementContinuous Variables Binary
VariablesMean S.D.
Burnt Indexes the method Percent of Plots 1=64 0=36of residue disposal on a plot.1= residue is burnt,0 otherwise
Combine Whether or not farmer used Percent of Plots 1=74 0=26a Combine to harvest rice on a plot.1= Combine machine is used,0=otherwise
Coarse Type of variety of rice sown Percent of Plots 1=64 0=36by the farmer on a plot.1=Coarse,0=Basmati
Farm Size Size of a farm unit Hectares 5.03 5.51
Number of livestock Number 2.46 1.96per hectare of farm area
Watch Whether or not farmer watches Percent of Farmers 1=56 0=44a programme on farming.1=Watches,0=Does not watch
Contact with Extension Whether or not an extension agent Percent of Farmers 1=24 0=76visited the farmerin the year preceding the survey1=Yes,0=No
Reads Magazines Does the farmer read Percent of Farmers 1=20 0=80agricultural magazines.1=Yes,0=No
Age of the farmer Number 51.73 14.21
Education of the farmer Number 8.16 4.1
Number of persons equal to or above Number 2.71 2.9115 years of age in the householdper hectare of farm area sown to rice
Rental rate of Combine Harvester Rupees per Hectare 765 161.97in Village ($16.34)
Rental rate of Contract Labour Rupees per Hectare 2381.67 591.39in Village ($50.84)
Amritsar Dummy Variable that equals 1 if Percent of Plots 1=33 0=67a plot is located in Amritsar,0 otherwise
13
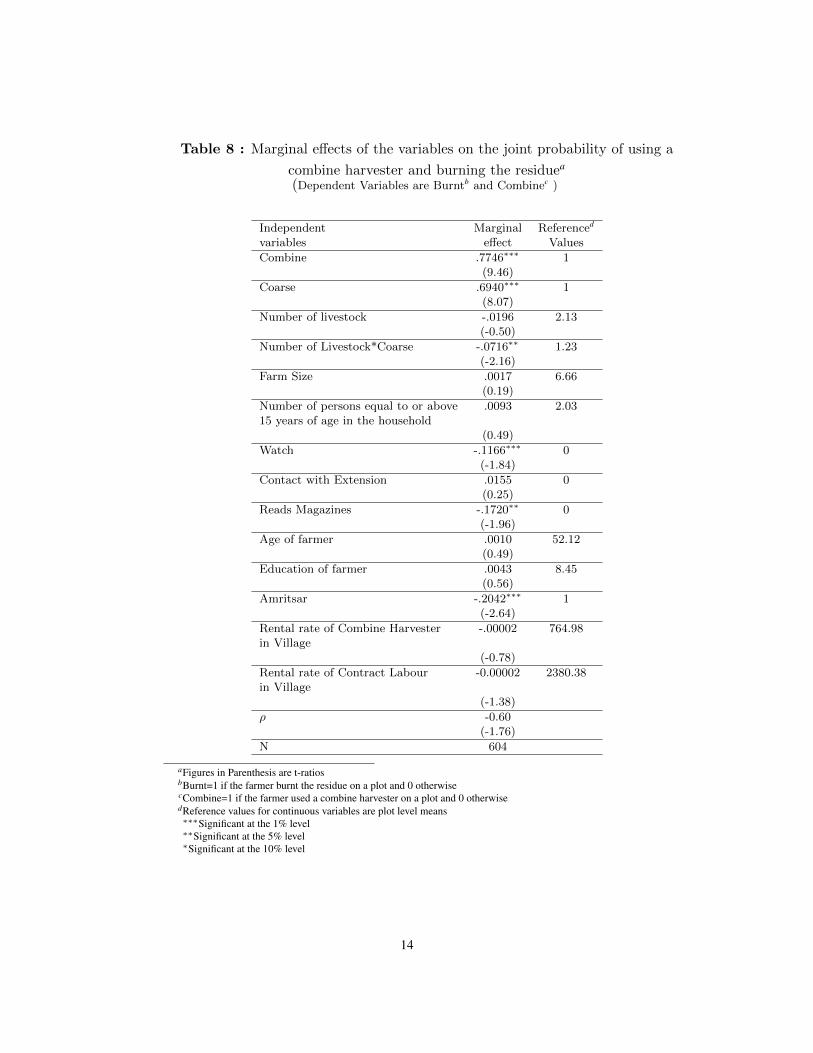
Table 8 : Marginal effects of the variables on the joint probability of using a
combine harvester and burning the residuea
(Dependent Variables are Burntb and Combinec )
Independent Marginal Referenced
variables effect Values
Combine .7746∗∗∗ 1(9.46)
Coarse .6940∗∗∗ 1(8.07)
Number of livestock -.0196 2.13(-0.50)
Number of Livestock*Coarse -.0716∗∗ 1.23(-2.16)
Farm Size .0017 6.66(0.19)
Number of persons equal to or above .0093 2.0315 years of age in the household
(0.49)
Watch -.1166∗∗∗ 0(-1.84)
Contact with Extension .0155 0(0.25)
Reads Magazines -.1720∗∗ 0(-1.96)
Age of farmer .0010 52.12(0.49)
Education of farmer .0043 8.45(0.56)
Amritsar -.2042∗∗∗ 1(-2.64)
Rental rate of Combine Harvester -.00002 764.98in Village
(-0.78)
Rental rate of Contract Labour -0.00002 2380.38in Village
(-1.38)
ρ -0.60(-1.76)
N 604
aFigures in Parenthesis are t-ratiosbBurnt=1 if the farmer burnt the residue on a plot and 0 otherwisecCombine=1 if the farmer used a combine harvester on a plot and 0 otherwisedReference values for continuous variables are plot level means∗∗∗Significant at the 1% level∗∗Significant at the 5% level∗Significant at the 10% level
14

to test the normality assumption in the bivariate model5. The p value is 0.5
hence the null hypothesis of normality is not rejected.
The estimated parameter of rho (Table 8) shows that the null hypothesis that the
covariance parameter ρ = 0 is not rejected at the 5% level, indicating the validity
of estimating the two equations separately. This is not surprising. The correlation
coefficient measures the correlation between the outcomes after the influence of the
explanatory variables is accounted for. Thus, the value, 0.60 measures the effect
after the influence of using a combine harvester is already accounted for. However,
as discussed later on, the single most important determinant of whether the residue
on a plot will be burnt is indeed whether a combine harvester is being used on the
plot. Hence I estimate each equation using single equation probit methods.
5.2 Determinants of Mode of Harvesting
I again employ Murphy’s score test of normality to test the normality assumption
in the univariate model and the null hypothesis of normality is not rejected at the
1% level. The model predicted 91 % of the plots on which a combine harvester was
being used correctly, and 91 % of the plots on which manual labour was being used
correctly, with an overall correct prediction rate of 91 %.
The only factor affecting the choice of mode of residue disposal is the variety of
rice sown by a farmer (Table 9). This is not surprising given the statistics in Table 2a
and Table 2b. In particular, on plots that are planted with Coarse varieties, farmers
are 81 % more likely to use combine harvesters holding other variables constant at
their reference values. The predicted probability of using a combine harvester on a
plot is 0.99 for plots that are sown with Coarse varieties and are situated in Amritsar
fixing the values of other variables at their means. In contrast, on plots that are
planted with Basmati varieties and with other identical features, the probability of
using a combine harvester is 0.2. Clearly, the rice variety sown by a farmer has huge
implications for the choice of the mode of harvesting.
5.3 Determinants of Method of Residue Disposal
Results of the method of residue disposal model indicate that the model successfully
predicted 97 % of all plots on which the rice residue was burnt, and 75 % of all plots
on which the residue was not burnt, with an overall correct prediction rate of 89 %.
5The null hypothesis is that the errors are from a bivariate normal distribution and the alternative hypothesis is that theerrors follow a truncated or type AA Gram Charlier Series. The test statistic is distributed as chi-squared with nine degreesof freedom under the null hypothesis
15
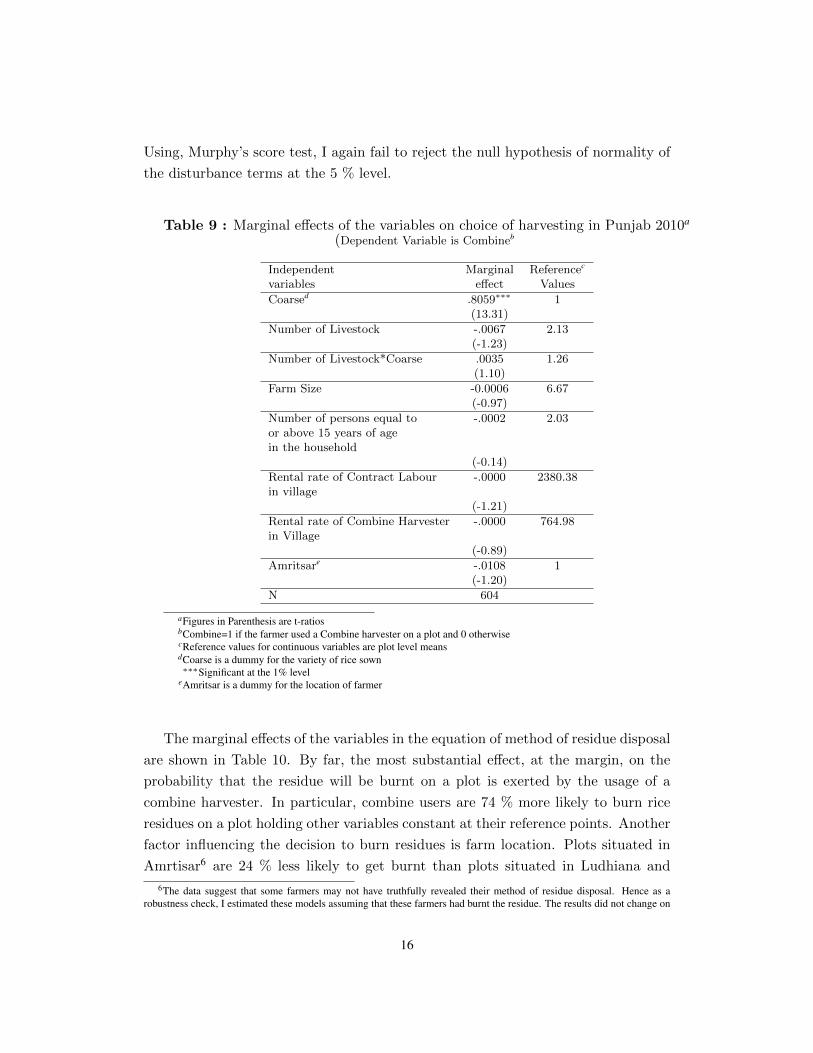
Using, Murphy’s score test, I again fail to reject the null hypothesis of normality of
the disturbance terms at the 5 % level.
Table 9 : Marginal effects of the variables on choice of harvesting in Punjab 2010a
(Dependent Variable is Combineb
Independent Marginal Referencec
variables effect Values
Coarsed .8059∗∗∗ 1(13.31)
Number of Livestock -.0067 2.13(-1.23)
Number of Livestock*Coarse .0035 1.26(1.10)
Farm Size -0.0006 6.67(-0.97)
Number of persons equal to -.0002 2.03or above 15 years of agein the household
(-0.14)
Rental rate of Contract Labour -.0000 2380.38in village
(-1.21)
Rental rate of Combine Harvester -.0000 764.98in Village
(-0.89)
Amritsare -.0108 1(-1.20)
N 604
aFigures in Parenthesis are t-ratiosbCombine=1 if the farmer used a Combine harvester on a plot and 0 otherwisecReference values for continuous variables are plot level meansdCoarse is a dummy for the variety of rice sown∗∗∗Significant at the 1% level
eAmritsar is a dummy for the location of farmer
The marginal effects of the variables in the equation of method of residue disposal
are shown in Table 10. By far, the most substantial effect, at the margin, on the
probability that the residue will be burnt on a plot is exerted by the usage of a
combine harvester. In particular, combine users are 74 % more likely to burn rice
residues on a plot holding other variables constant at their reference points. Another
factor influencing the decision to burn residues is farm location. Plots situated in
Amrtisar6 are 24 % less likely to get burnt than plots situated in Ludhiana and
6The data suggest that some farmers may not have truthfully revealed their method of residue disposal. Hence as arobustness check, I estimated these models assuming that these farmers had burnt the residue. The results did not change on
16
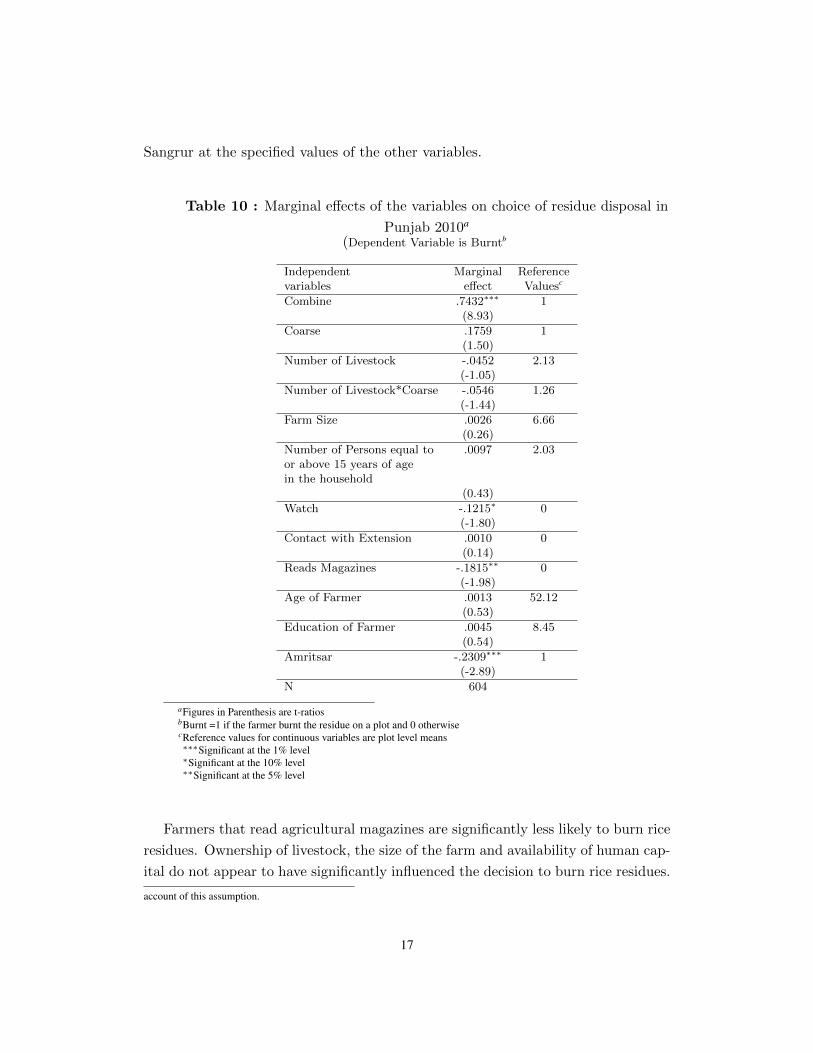
Sangrur at the specified values of the other variables.
Table 10 : Marginal effects of the variables on choice of residue disposal in
Punjab 2010a
(Dependent Variable is Burntb
Independent Marginal Referencevariables effect Valuesc
Combine .7432∗∗∗ 1(8.93)
Coarse .1759 1(1.50)
Number of Livestock -.0452 2.13(-1.05)
Number of Livestock*Coarse -.0546 1.26(-1.44)
Farm Size .0026 6.66(0.26)
Number of Persons equal to .0097 2.03or above 15 years of agein the household
(0.43)
Watch -.1215∗ 0(-1.80)
Contact with Extension .0010 0(0.14)
Reads Magazines -.1815∗∗ 0(-1.98)
Age of Farmer .0013 52.12(0.53)
Education of Farmer .0045 8.45(0.54)
Amritsar -.2309∗∗∗ 1(-2.89)
N 604
aFigures in Parenthesis are t-ratiosbBurnt =1 if the farmer burnt the residue on a plot and 0 otherwisecReference values for continuous variables are plot level means∗∗∗Significant at the 1% level∗Significant at the 10% level∗∗Significant at the 5% level
Farmers that read agricultural magazines are significantly less likely to burn rice
residues. Ownership of livestock, the size of the farm and availability of human cap-
ital do not appear to have significantly influenced the decision to burn rice residues.
account of this assumption.
17
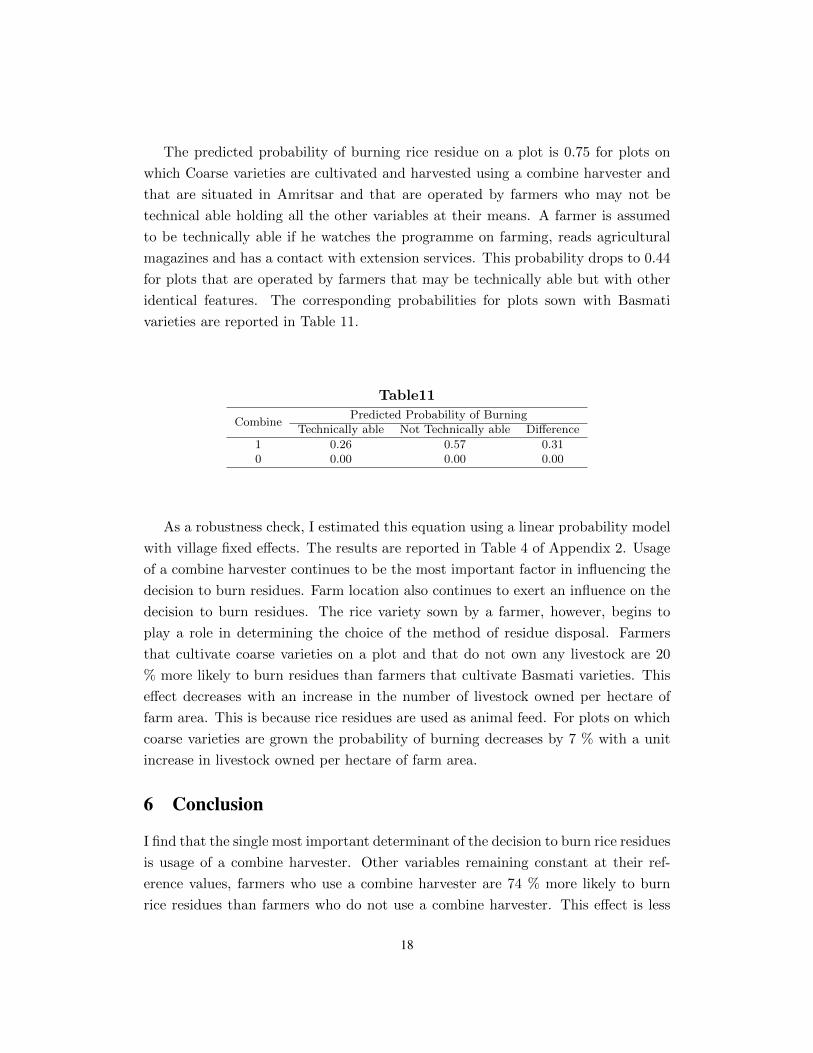
The predicted probability of burning rice residue on a plot is 0.75 for plots on
which Coarse varieties are cultivated and harvested using a combine harvester and
that are situated in Amritsar and that are operated by farmers who may not be
technical able holding all the other variables at their means. A farmer is assumed
to be technically able if he watches the programme on farming, reads agricultural
magazines and has a contact with extension services. This probability drops to 0.44
for plots that are operated by farmers that may be technically able but with other
identical features. The corresponding probabilities for plots sown with Basmati
varieties are reported in Table 11.
Table11
CombinePredicted Probability of Burning
Technically able Not Technically able Difference
1 0.26 0.57 0.310 0.00 0.00 0.00
As a robustness check, I estimated this equation using a linear probability model
with village fixed effects. The results are reported in Table 4 of Appendix 2. Usage
of a combine harvester continues to be the most important factor in influencing the
decision to burn residues. Farm location also continues to exert an influence on the
decision to burn residues. The rice variety sown by a farmer, however, begins to
play a role in determining the choice of the method of residue disposal. Farmers
that cultivate coarse varieties on a plot and that do not own any livestock are 20
% more likely to burn residues than farmers that cultivate Basmati varieties. This
effect decreases with an increase in the number of livestock owned per hectare of
farm area. This is because rice residues are used as animal feed. For plots on which
coarse varieties are grown the probability of burning decreases by 7 % with a unit
increase in livestock owned per hectare of farm area.
6 Conclusion
I find that the single most important determinant of the decision to burn rice residues
is usage of a combine harvester. Other variables remaining constant at their ref-
erence values, farmers who use a combine harvester are 74 % more likely to burn
rice residues than farmers who do not use a combine harvester. This effect is less
18

pronounced in Amritsar. Farmers in Amritsar are about 23 % less likely to burn rice
residues than farmers in the other two districts.Thus, the ban imposed on burning
rice residues in Amritsar had an impact on the decision to burn rice residues. The
decision to use a combine harvester is in turn driven by the rice variety sown by a
farmer. Coarse rice growers are 81 % more likely to use a combine harvester than
Basmati growers. The number of livestock per hectare of farm area, farm size and
variables that measure availability of human capital do not seem to have an impact
on the probability of burning rice residue.
Unfortunately the variable that matters the most to the decision to burn crop
residues i.e. the usage of a combine harvester, is not amenable to policy interven-
tion. Combines are entrenched in the agricultural system of the states of Punjab
and Haryana(Erenstein et al., 2007a). The advantages combine harvesters offer in
terms of savings of money and time and reduced supervision of labour have made
them immensely popular with the farmers. Presently combine harvesters are being
mainly used to harvest Coarse varieties in Punjab but as the discussion in section 4
shows farmers who face labour scarcity resort to mechanical harvesting of Basmati
varieties. Thus, in the advent of increased labour scarcity, use of combine harvesters
is likely to spread.
A modification to the combine harvester can be made whereby the residue is
separately collected. This raises questions about the utilisation of residue. Balers
have been introduced in the district of Amritsar and the baled residue is being used
to generate electricity in a sugar mill in this district7. However, baling of residue
may not be a viable mitigation strategy as the supply of baled residue may outweigh
its demand. There is no data available on the quantities of residue demanded by the
various industries in Punjab and the quantities supplied to substantiate this claim.
The alternative that seems viable to me is encouraging development of machines that
allow farmers to plant into loose residue. In fact one such machine called ‘Happy
Seeder’ has been developed by research engineers from Australia and India involved
in an ACIAR (Australian Centre for International Agricultural Research) Project.
‘The HS is a tractor-powered machine that cuts and lifts the rice straw, sows into
the bare soil, and deposits the straw over the sown area as a mulch’(Singh et al.,
2006). Wheat can be sown immediately after rice harvest precluding the need for
burning. Thus, an important research question is whether Happy Seeder is a viable
alternative to open field burning of rice residues. This question will be addressed in
a subsequent study.
7Source:Field Survey
19

References
Auffhammer, M., Ramanathan, V. and Vincent, J. (2006). Integrated model shows
that atmospheric brown clouds and greenhouse gases have reduced rice harvests
in India, Proceedings of the National Academy of Sciences 103(52): 19668.
Businessworld (2009). Website. http://www.businessworld.in/bw/2009_
10_03_Returns_From_PUSA_1121_Basmati_Variety_My_Dip.html?
storyInSinglePage=true.
Chiburis, R. (2010). Score tests of normality in bivariate probit models:Comment.
Erenstein, O., Thorpe, W., Singh, J. and Varma, A. (2007a). Crop-livestock inter-
actions and livelihoods in the Indo-Gangetic Plains, India: A regional synthesis,
Cimmyt African Livelihoods Program.
Erenstein, O., Thorpe, W., Singh, J. and Varma, A. (2007b). Crop-livestock inter-
actions and livelihoods in the trans-Gangetic Plains, India, ILRI (aka ILCA and
ILRAD).
Greene, W. (1998). Gender economics courses in liberal arts colleges: Further re-
sults, The Journal of Economic Education 29(4): 291–300.
Gupta, P., Sahai, S., Singh, N., Dixit, C., Singh, D., Sharma, C., Tiwari, M., Gupta,
R. and Garg, S. (2004). Residue burning in rice-wheat cropping system: causes
and implications, Current science 87(12): 1713–1717.
Gustafsson, O., Krusa, M., Zencak, Z., Sheesley, R., Granat, L., Engstrom, E.,
Praveen, P., Rao, P., Leck, C. and Rodhe, H. (2009). Brown Clouds over South
Asia: Biomass or Fossil Fuel Combustion?, Science 323(5913): 495.
Hobbs, P. and Morris, M. (1996). Meeting South Asia’s future food requirements
from rice-wheat cropping systems: priority issues facing researchers in the post-
Green Revolution era, NRG paper 96(01).
Koopmans, A. and Koppejan, J. (1997). Agricultural and Forest Residues-
Generation, Utilization and Availability, Paper presented at the Regional Con-
sultation on Modern Applications of Biomass Energy 6: 10.
Long, W., Tate, R., Neuman, M., Manfreda, J., Becker, A. and Anthonisen, N.
(1998). Respiratory symptoms in a susceptible population due to burning of
agricultural residue, Chest 113(2): 351.
20

Murphy, A. (2007). Score tests of normality in bivariate probit models, Economics
Letters 95(3): 374–379.
Ramanathan, V. and Carmichael, G. (2008). Global and regional climate changes
due to black carbon, Nature Geoscience 1(4): 221–227.
Ray, R. (2008). Agricultural Statistics at a Glance, Ministry of Agriculture .
Singh, R., Dhaliwal, H. and Tejpal-Singh, H. (2006). A financial assessment of the
Happy Seeder for rice–wheat systems in Punjab, India, Permanent beds and rice-
residue management for rice–wheat systems in the Indo-Gangetic Plain 7: 182.
Streets, D., Yarber, K., Woo, J. and Carmichael, G. (2003). Biomass burning in Asia:
Annual and seasonal estimates and atmospheric emissions, Global Biogeochem.
Cycles 17(4): 1099.
The Tribune, Amritsar Plus (2005). Newspaper.
Venkataraman, C., Habib, G., Kadamba, D., Shrivastava, M., Leon, J., Crouzille,
B., Boucher, O. and Streets, D. (2006). Emissions from open biomass burning in
India: Integrating the inventory approach with high-resolution Moderate Resolu-
tion Imaging Spectroradiometer (MODIS) active-fire and land cover data, Global
Biogeochemical Cycles 20(2): GB2013.
21
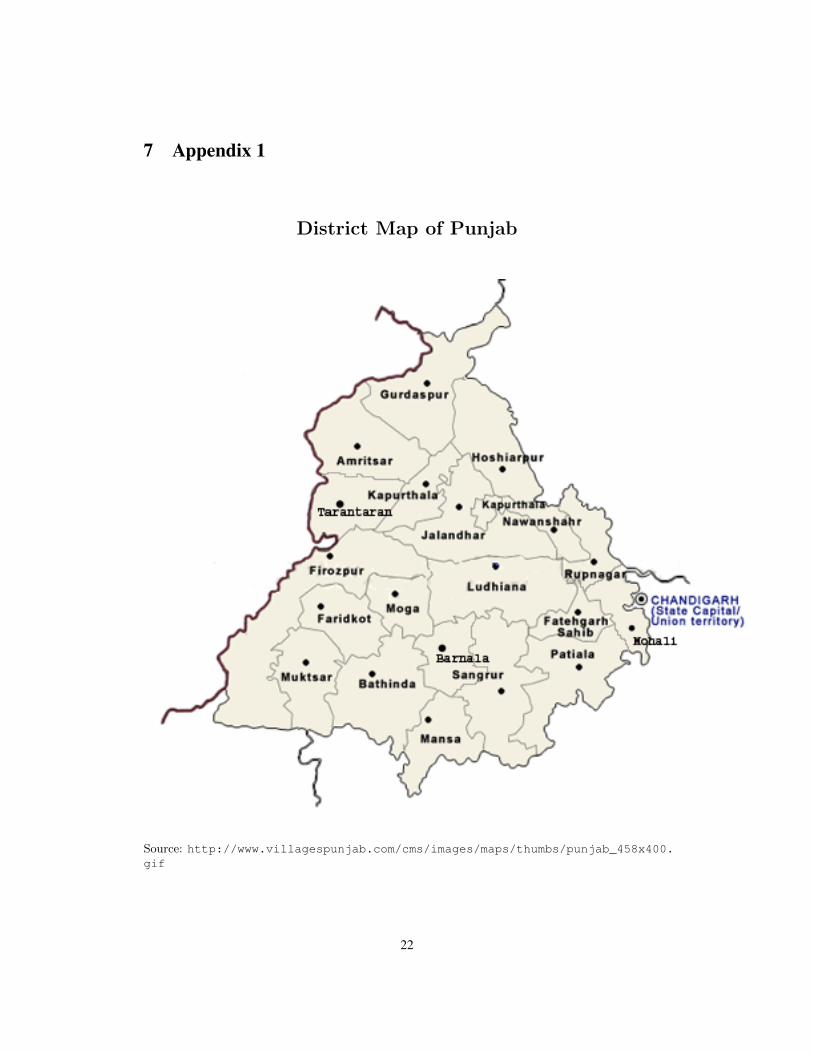
7 Appendix 1
District Map of Punjab
Source: http://www.villagespunjab.com/cms/images/maps/thumbs/punjab_458x400.gif
22
8 Appendix 2
Table 1: District-wise estimates of Table 4
District-Amritsar
Variety of Rice - Basmati
Method of disposal
Mode of harvestingManual Combine
Percent of the Area Percent of the AreaSown to Basmati Sown to Basmatithat is harvested that is harvested
using Labour using Combinein Amritsar in Amritsar
(No. of Hectares) (No. of Hectares)(in Parenthesis) (in Parenthesis)
Fully Burnt0 47.45
(0 ) (29.14)
Partially Burnt0 17.13
(0) (10.52)
Incorporated0 24.71
(0) (15.18)
Removed100 10.71
(129.90) (6.58)
Variety of Rice - Coarse
Fully Burnt0 32.33
(0 ) (28.13)
Partially Burnt0 31.86
(0) (27.72)
Incorporated0 28.02
(0) (24.38)
Removed0.4 7.79(0) (6.78)
23
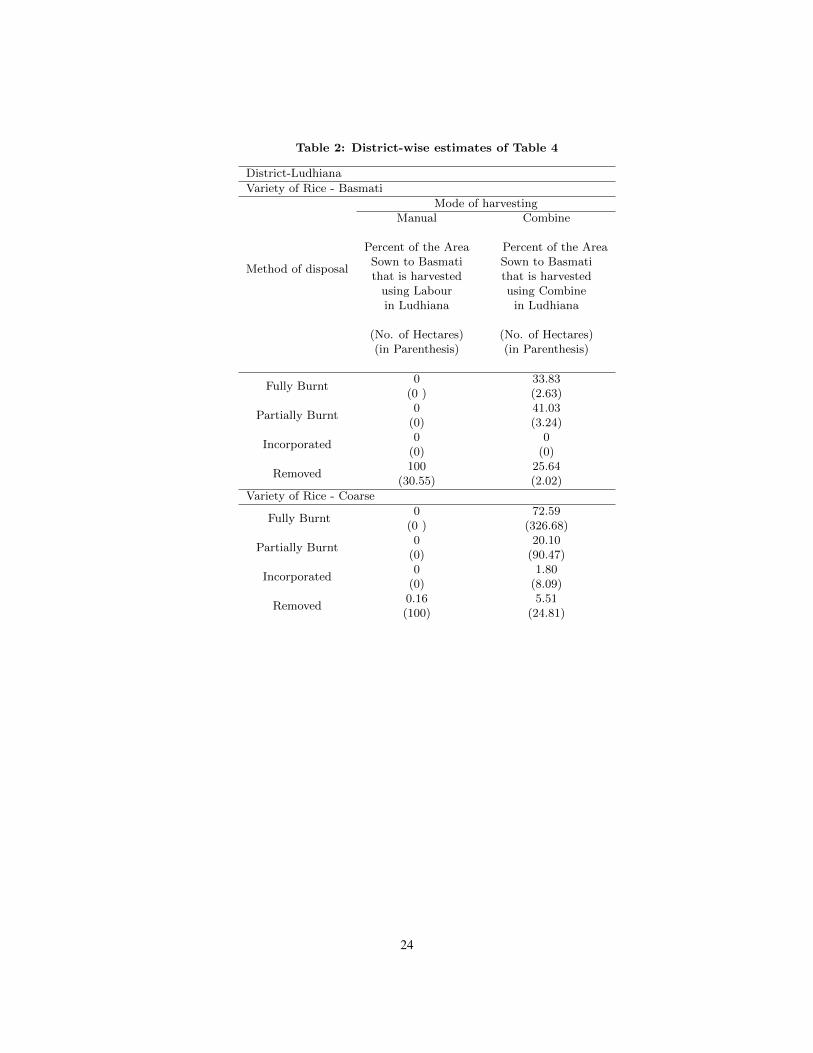
Table 2: District-wise estimates of Table 4
District-Ludhiana
Variety of Rice - Basmati
Method of disposal
Mode of harvestingManual Combine
Percent of the Area Percent of the AreaSown to Basmati Sown to Basmatithat is harvested that is harvested
using Labour using Combinein Ludhiana in Ludhiana
(No. of Hectares) (No. of Hectares)(in Parenthesis) (in Parenthesis)
Fully Burnt0 33.83
(0 ) (2.63)
Partially Burnt0 41.03
(0) (3.24)
Incorporated0 0
(0) (0)
Removed100 25.64
(30.55) (2.02)
Variety of Rice - Coarse
Fully Burnt0 72.59
(0 ) (326.68)
Partially Burnt0 20.10
(0) (90.47)
Incorporated0 1.80
(0) (8.09)
Removed0.16 5.51(100) (24.81)
24
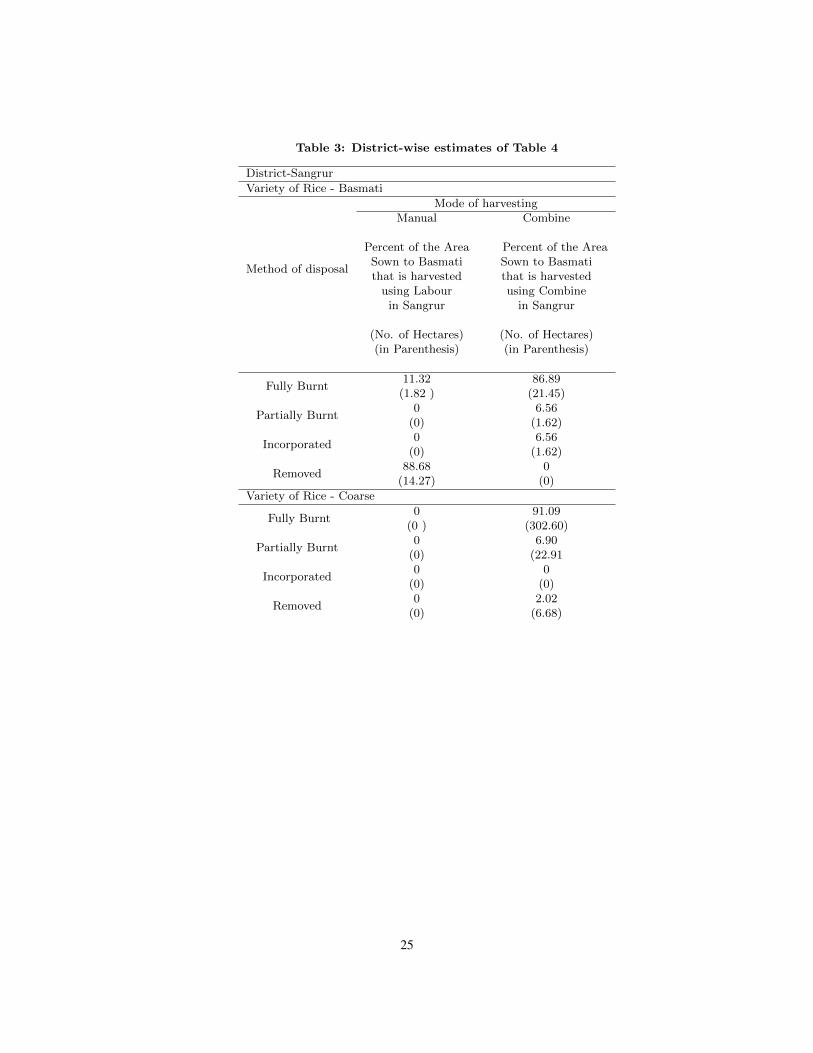
Table 3: District-wise estimates of Table 4
District-Sangrur
Variety of Rice - Basmati
Method of disposal
Mode of harvestingManual Combine
Percent of the Area Percent of the AreaSown to Basmati Sown to Basmatithat is harvested that is harvested
using Labour using Combinein Sangrur in Sangrur
(No. of Hectares) (No. of Hectares)(in Parenthesis) (in Parenthesis)
Fully Burnt11.32 86.89
(1.82 ) (21.45)
Partially Burnt0 6.56
(0) (1.62)
Incorporated0 6.56
(0) (1.62)
Removed88.68 0
(14.27) (0)
Variety of Rice - Coarse
Fully Burnt0 91.09
(0 ) (302.60)
Partially Burnt0 6.90
(0) (22.91
Incorporated0 0
(0) (0)
Removed0 2.02
(0) (6.68)
25
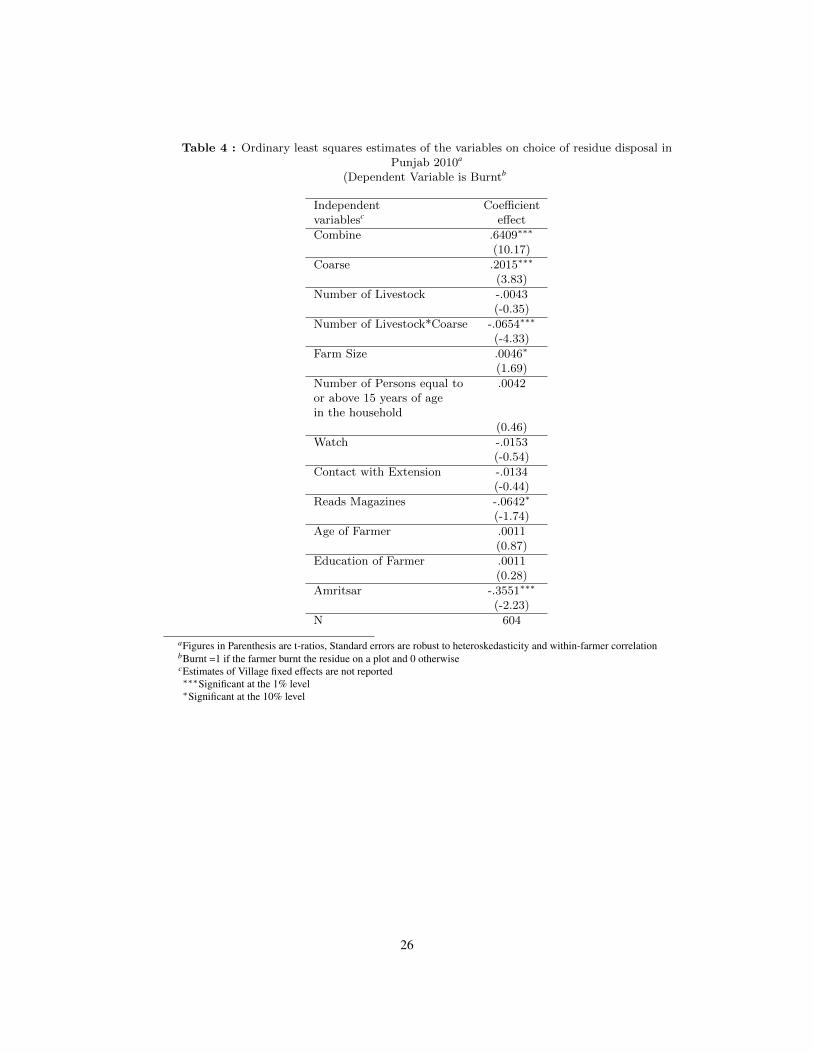
Table 4 : Ordinary least squares estimates of the variables on choice of residue disposal inPunjab 2010a
(Dependent Variable is Burntb
Independent Coefficientvariablesc effect
Combine .6409∗∗∗
(10.17)
Coarse .2015∗∗∗
(3.83)
Number of Livestock -.0043(-0.35)
Number of Livestock*Coarse -.0654∗∗∗
(-4.33)
Farm Size .0046∗
(1.69)
Number of Persons equal to .0042or above 15 years of agein the household
(0.46)
Watch -.0153(-0.54)
Contact with Extension -.0134(-0.44)
Reads Magazines -.0642∗
(-1.74)
Age of Farmer .0011(0.87)
Education of Farmer .0011(0.28)
Amritsar -.3551∗∗∗
(-2.23)
N 604
aFigures in Parenthesis are t-ratios, Standard errors are robust to heteroskedasticity and within-farmer correlationbBurnt =1 if the farmer burnt the residue on a plot and 0 otherwisecEstimates of Village fixed effects are not reported∗∗∗Significant at the 1% level∗Significant at the 10% level
26