Embed Size (px)
Citation preview
The Economic Benefits of Public Infrastructure
Spending in Canada
BY The Centre for Spatial Economics* | September 2015
*The C4SE monitors, analyzes, and forecasts economic and demographic change throughout Canada at virtually all levels of geography. It also prepares customized studies on the economic, industrial, and community impacts of various fiscal and other policy changes, and develops customized impact and projection models for clients. The Broadbent Institute commissioned C4SE to conduct independent economic modeling on the economic benefits of public infrastructure investment. For more information, please see www.c4se.com.
2 | THE ECONOMIC BENEFITS OF PUBLIC INFRASTRUCTURE SPENDING IN CANADA
TABLE OF CONTENTS
ABOUT THIS STUDY . . . . . . . . . . . . . . . . . . . . . . . . . . . . . . . . . . . . . . . . . . . . . . . . . . . . . . . . . . . . . . . . . . . . . . . . . . . . . . . . . . . . . . .3
EXECUTIVE SUMMARY . . . . . . . . . . . . . . . . . . . . . . . . . . . . . . . . . . . . . . . . . . . . . . . . . . . . . . . . . . . . . . . . . . . . . . . . . . . . . . . . . . . 4
INTRODUCTION . . . . . . . . . . . . . . . . . . . . . . . . . . . . . . . . . . . . . . . . . . . . . . . . . . . . . . . . . . . . . . . . . . . . . . . . . . . . . . . . . . . . . . . . . . . .8
ECONOMIC THEORY: LINKING INFRASTRUCTURE AND ECONOMIC PERFORMANCE . . . . . . . . . . 9
METHODOLOGY AND ASSUMPTIONS . . . . . . . . . . . . . . . . . . . . . . . . . . . . . . . . . . . . . . . . . . . . . . . . . . . . . . . . . . . . . . . . . . . . .12
DIRECT CONSTRUCTION PHASE ASSUMPTIONS AND IMPACT . . . . . . . . . . . . . . . . . . . . . . . . . . . . . . . . . . . .12
BENEFITS TO PRIVATE INDUSTRY . . . . . . . . . . . . . . . . . . . . . . . . . . . . . . . . . . . . . . . . . . . . . . . . . . . . . . . . . . . . . . . . . . . .13
A SCENARIO-BASED APPROACH TO MODELLING UNCERTAINTY . . . . . . . . . . . . . . . . . . . . . . . . . . . . . . . .13
RESULTS: TOTAL ECONOMIC IMPACT . . . . . . . . . . . . . . . . . . . . . . . . . . . . . . . . . . . . . . . . . . . . . . . . . . . . . . . . . . . . . . . . . .14
DYNAMIC IMPACTS . . . . . . . . . . . . . . . . . . . . . . . . . . . . . . . . . . . . . . . . . . . . . . . . . . . . . . . . . . . . . . . . . . . . . . . . . . . . . . . . . . . . .21
INDUSTRY IMPACTS . . . . . . . . . . . . . . . . . . . . . . . . . . . . . . . . . . . . . . . . . . . . . . . . . . . . . . . . . . . . . . . . . . . . . . . . . . . . . . . . . . . 24
REGIONAL IMPACTS . . . . . . . . . . . . . . . . . . . . . . . . . . . . . . . . . . . . . . . . . . . . . . . . . . . . . . . . . . . . . . . . . . . . . . . . . . . . . . . . . . . 25
ECONOMIC MULTIPLIERS AND RETURN ON INVESTMENT . . . . . . . . . . . . . . . . . . . . . . . . . . . . . . . . . . . . . . . . 27
SHORT-RUN MULTIPLIERS . . . . . . . . . . . . . . . . . . . . . . . . . . . . . . . . . . . . . . . . . . . . . . . . . . . . . . . . . . . . . . . . . . . . . . . . 28
LONG-RUN RETURN ON INVESTMENT . . . . . . . . . . . . . . . . . . . . . . . . . . . . . . . . . . . . . . . . . . . . . . . . . . . . . . . . . . 29
SUMMARY AND OBSERVATIONS . . . . . . . . . . . . . . . . . . . . . . . . . . . . . . . . . . . . . . . . . . . . . . . . . . . . . . . . . . . . . . . . . . . . . . . 32
APPENDIX A: CONTRIBUTION OF PUBLIC CAPITAL AT THE INDUSTRY LEVEL . . . . . . . . . . . . . . . . . . . . 34
APPENDIX B: C4SE PROVINCIAL ECONOMIC MODELLING SYSTEM . . . . . . . . . . . . . . . . . . . . . . . . . . . . . . . . 36
APPENDIX C: SCENARIO RESULTS . . . . . . . . . . . . . . . . . . . . . . . . . . . . . . . . . . . . . . . . . . . . . . . . . . . . . . . . . . . . . . . . . . . . . 42
REFERENCES . . . . . . . . . . . . . . . . . . . . . . . . . . . . . . . . . . . . . . . . . . . . . . . . . . . . . . . . . . . . . . . . . . . . . . . . . . . . . . . . . . . . . . . . . . . . 43
3 | THE ECONOMIC BENEFITS OF PUBLIC INFRASTRUCTURE SPENDING IN CANADA
ABOUT THIS STUDY
This report was prepared for the Broadbent Institute by the Centre for Spatial
Economics (C4SE). The Broadbent Institute is an independent, non-partisan
organization championing progressive change through the promotion of
democracy, equality, and sustainability and the training of a new generation of
leaders. For more information, please see www.broadbentinstitute.ca.
This paper estimates the economic benefits of a national five-year, $50-billion
public infrastructure spending program using the C4SE’s provincial economic
modelling system. Results are presented in terms of impacts upon gross
domestic product (GDP), employment, and government finances over time,
by sector, and by province. Spending multipliers and return on investment
statistics are generated to provide summary measures of the results and
provide a compelling case for funding a public infrastructure program where
public capital can play an important role in contributing to investment-led
economic expansions and improving the productivity and competitiveness of
private businesses in Canada.
The report was conducted by economist Robin Somerville, Director at the
C4SE. The C4SE monitors, analyzes, and forecasts economic and demographic
change throughout Canada at virtually all levels of geography. It also prepares
customized studies on the economic, industrial, and community impacts of
various fiscal and other policy changes, and develops customized impact and
projection models for in-house client use. The C4SE provides economic models,
analysis, and forecasts to nine provincial and territorial governments across
Canada. For more information, please see www.c4se.com.
4 | THE ECONOMIC BENEFITS OF PUBLIC INFRASTRUCTURE SPENDING IN CANADA
EXECUTIVE SUMMARY
This report provides estimates of the economic benefits of a five-year, $50-billion
public infrastructure spending program in Canada funded equally by the federal
and provincial governments. Public infrastructure is defined as the engineering
construction component of all levels—federal, provincial and territorial, and
local—of the public administration sector’s capital stock, and includes primarily
transportation systems, such as subways and highways, water supply, and
wastewater treatment facilities. The benefits of a national public infrastructure
program arise from the direct program spending, but then extend beyond this
direct impact with public capital promoting long-term economic growth and
productivity. Federal and provincial funding for the program is assumed to
come from either existing budget surpluses or from deficit financing. Tax rates
are left at baseline scenario levels so as to prevent mixing the results of the
spending initiative with the impact of selected tax increases.
The report does not advocate for one financing option over others, but models
one option based on fiscal projections and economic outlooks as of January
2015 (see Appendix B).
The benefits of a public infrastructure spending program include the following:
• In the short term, GDP rises $1.43 per dollar of spending, 9.4 jobs are
generated per million dollars spent, and $0.44 of each dollar spent
by government is recovered in additional tax revenue.
•Over the long term, the discounted present value of GDP generated
per dollar of public infrastructure spending (return on investment)
lies between $2.46 and $3.83.
•Private-sector investment rises by as much as $0.34 per dollar spent
in the short term, and by up to $1.00 per dollar spent in the long run.
•Businesses are more productive and competitive in international
markets.
•Real wages rise, providing a higher standard of living for Canadians.
And these benefits are realized without significant long-term fiscal consequences
to federal or provincial governments. The change in the long-term average
annual deficit-to-GDP ratio lies between a rise of 0.04 per cent and a decline of
0.02 per cent for the federal government, and between a rise of 0.08 per cent
5 | THE ECONOMIC BENEFITS OF PUBLIC INFRASTRUCTURE SPENDING IN CANADA
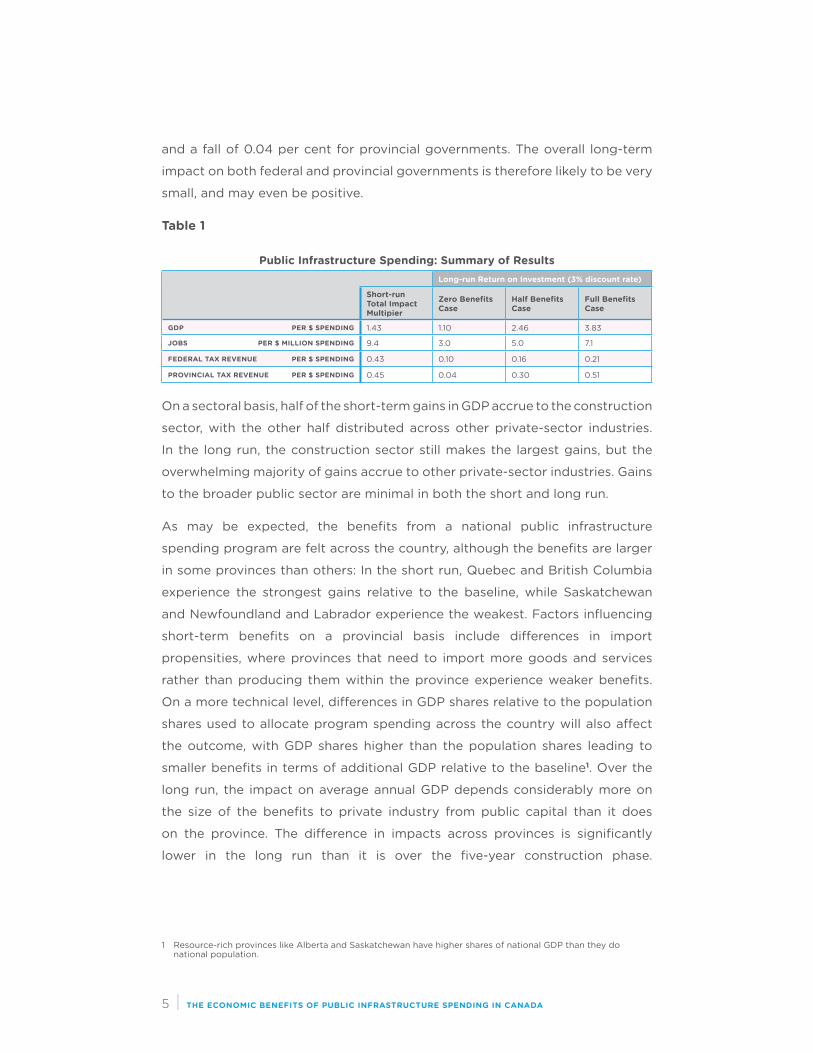
and a fall of 0.04 per cent for provincial governments. The overall long-term
impact on both federal and provincial governments is therefore likely to be very
small, and may even be positive.
Table 1
Public Infrastructure Spending: Summary of ResultsLong-run Return on Investment (3% discount rate)
Short-run Total Impact Multipier
Zero Benefits Case
Half Benefits Case
Full Benefits Case
GDP PER $ SPENDING 1.43 1.10 2.46 3.83
JOBS PER $ MILLION SPENDING 9.4 3.0 5.0 7.1
FEDERAL TAX REVENUE PER $ SPENDING 0.43 0.10 0.16 0.21
PROVINCIAL TAX REVENUE PER $ SPENDING 0.45 0.04 0.30 0.51
On a sectoral basis, half of the short-term gains in GDP accrue to the construction
sector, with the other half distributed across other private-sector industries.
In the long run, the construction sector still makes the largest gains, but the
overwhelming majority of gains accrue to other private-sector industries. Gains
to the broader public sector are minimal in both the short and long run.
As may be expected, the benefits from a national public infrastructure
spending program are felt across the country, although the benefits are larger
in some provinces than others: In the short run, Quebec and British Columbia
experience the strongest gains relative to the baseline, while Saskatchewan
and Newfoundland and Labrador experience the weakest. Factors influencing
short-term benefits on a provincial basis include differences in import
propensities, where provinces that need to import more goods and services
rather than producing them within the province experience weaker benefits.
On a more technical level, differences in GDP shares relative to the population
shares used to allocate program spending across the country will also affect
the outcome, with GDP shares higher than the population shares leading to
smaller benefits in terms of additional GDP relative to the baseline1. Over the
long run, the impact on average annual GDP depends considerably more on
the size of the benefits to private industry from public capital than it does
on the province. The difference in impacts across provinces is significantly
lower in the long run than it is over the five-year construction phase.
1 Resource-rich provinces like Alberta and Saskatchewan have higher shares of national GDP than they do national population.
6 | THE ECONOMIC BENEFITS OF PUBLIC INFRASTRUCTURE SPENDING IN CANADA
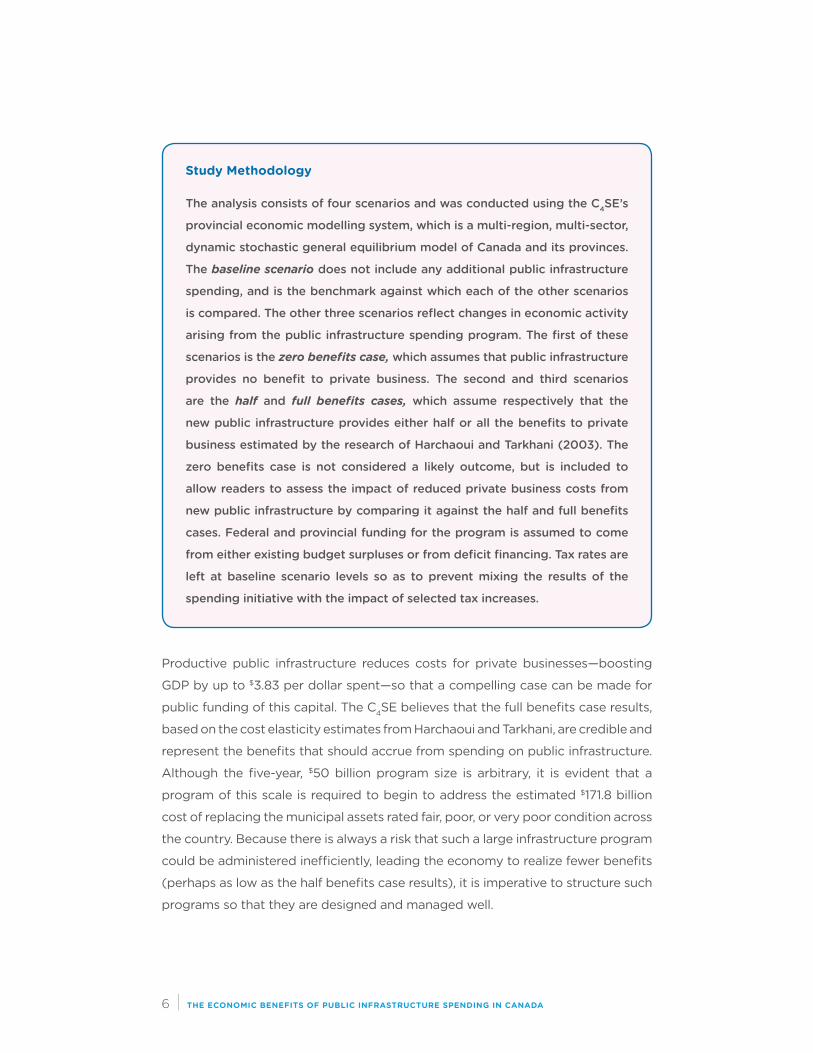
Study Methodology
The analysis consists of four scenarios and was conducted using the C4SE’s
provincial economic modelling system, which is a multi-region, multi-sector,
dynamic stochastic general equilibrium model of Canada and its provinces .
The baseline scenario does not include any additional public infrastructure
spending, and is the benchmark against which each of the other scenarios
is compared . The other three scenarios reflect changes in economic activity
arising from the public infrastructure spending program . The first of these
scenarios is the zero benefits case, which assumes that public infrastructure
provides no benefit to private business . The second and third scenarios
are the half and full benefits cases, which assume respectively that the
new public infrastructure provides either half or all the benefits to private
business estimated by the research of Harchaoui and Tarkhani (2003) . The
zero benefits case is not considered a likely outcome, but is included to
allow readers to assess the impact of reduced private business costs from
new public infrastructure by comparing it against the half and full benefits
cases . Federal and provincial funding for the program is assumed to come
from either existing budget surpluses or from deficit financing . Tax rates are
left at baseline scenario levels so as to prevent mixing the results of the
spending initiative with the impact of selected tax increases .
Productive public infrastructure reduces costs for private businesses—boosting
GDP by up to $3.83 per dollar spent—so that a compelling case can be made for
public funding of this capital. The C4SE believes that the full benefits case results,
based on the cost elasticity estimates from Harchaoui and Tarkhani, are credible and
represent the benefits that should accrue from spending on public infrastructure.
Although the five-year, $50 billion program size is arbitrary, it is evident that a
program of this scale is required to begin to address the estimated $171.8 billion
cost of replacing the municipal assets rated fair, poor, or very poor condition across
the country. Because there is always a risk that such a large infrastructure program
could be administered inefficiently, leading the economy to realize fewer benefits
(perhaps as low as the half benefits case results), it is imperative to structure such
programs so that they are designed and managed well.

7 | THE ECONOMIC BENEFITS OF PUBLIC INFRASTRUCTURE SPENDING IN CANADA
The increase in public capital can also help achieve something else that has
eluded policy makers in Canada over the last few years: gains in private-
sector investment spending. A public infrastructure program boosts private
investment in both the near and long term, and can therefore play an important
role in contributing to an investment-led economic expansion.
While a five-year, $50-billion program does represent a major spending
commitment for Canada’s federal and provincial governments, public
infrastructure spending has been curtailed for decades as governments of all
levels have restrained spending in order to avoid increases in tax rates or to
provide tax cuts. In the absence of surpluses, taxes or deficits will need to rise,
at least in the short term, but, because of the expected benefits to private
business from the public capital, they need not become a significant long-term
burden.
In closing, this study also provides a cautionary tale for policy analysts. The
costs of neglecting our public infrastructure are not zero: Allowing our public
infrastructure to continue to decay imposes costs at least equal but opposite to
the benefits estimated in this study. The competitiveness of private businesses
in Canada is tied to the quality of our public assets, so a significant and
sustained public infrastructure spending initiative is required if households and
businesses are to continue to enjoy the high standard of living provided by our
public infrastructure.

8 | THE ECONOMIC BENEFITS OF PUBLIC INFRASTRUCTURE SPENDING IN CANADA
INTRODUCTION
Media reports of crumbling and even dangerous public infrastructure have
become commonplace. Large sinkholes now routinely disrupt life in Canada’s
largest cities. Many critical bridges and highways need immediate attention.
And traffic gridlock in urban centres underscores the need for major investment
to improve and expand public transit. While everyday experience suggests that
Canada’s public infrastructure is in need of renewal, common observation is
also confirmed by research.
Lemire and Gaudreault (2006) estimated that in 2003, Canada’s road and
highway network had over 50 per cent of its useful life behind it, while federal and
provincial bridges had passed the halfway mark of their useful lives. Municipal
bridges fared a little better with 41 per cent of their useful lives behind them.
More recently, Guy Félio (2012) prepared a report for the Federation of Canadian
Municipalities that estimated the replacement cost of municipal infrastructure
assets that were rated between “fair” and “very poor” to be $171.8 billion in
2010. Federal and provincial governments have included spending initiatives in
recent budgets, but, after 25 years of underinvestment, the spending required
to correct the issue will require significantly more resources and sustained
commitment by all levels of government.
This report provides estimates of the economic benefits of public infrastructure
spending in Canada. Public infrastructure is defined as the engineering
construction component of all levels—federal, provincial and territorial, and
local—of the public administration sector’s capital stock, and includes primarily
transportation systems, such as subways and highways, water supply, and
wastewater treatment facilities.
The benefits of a national public infrastructure program arise from the direct
program spending and accrue principally to the construction sector. However,
the benefits from public infrastructure extend beyond this direct impact, with
public capital promoting economic growth and productivity. A highway, for
example, allows trucks to transport goods in less time than if they used slower,
local roads. This reduces shipping costs, helping private companies produce
their products at a lower cost.
A study prepared for Transport Canada (2006) estimates that the total annual
cost of congestion in terms of lost time and fuel consumption for Canada’s nine
major urban areas lies between $2.3 billion and $3.7 billion (measured in 2002
9 | THE ECONOMIC BENEFITS OF PUBLIC INFRASTRUCTURE SPENDING IN CANADA
dollars).2 It is important to note, however, that the condition of the highway is
just as important as its existence. According to Infrastructure Canada (2011),
“Inadequate infrastructure can deter foreign investors. Research shows that
inadequate public infrastructure tends to drive away foreign investment more
so than quality infrastructure attracts private investment. This, in turn, suggests
that public infrastructure is taken ‘as a given’—something that must be present.”
The need for public infrastructure and its importance to economic performance
is intuitively clear. Canada’s aging infrastructure could be an important
contributing factor to our lacklustre productivity gains. The challenge, from a
research perspective, is how to link public infrastructure spending to economic
performance so that we can estimate the benefits to society from that spending.
Economic Theory: Linking Infrastructure and Economic Performance
There are many critics of public spending that argue that it provides no benefits
to society. Media reports of overpriced doorknobs or gazebos make it easy
to think of examples of public infrastructure projects that provide little or no
benefit to business or to the public. These examples, however, are the exceptions
that prove the rule, as economic studies over the last 25 years have consistently
found a positive link between public infrastructure and productivity.
Public capital, consisting of roads, bridges, sewer systems, and water treatment
facilities, among other public infrastructure assets, constitutes a vital input
for private-sector production. Nonetheless, its impact on business-sector
productivity growth or total economy GDP is not well understood. Public
capital in North America tends to be publicly owned, so no markets exist for its
output. There are no close substitutes for public capital in the private sector,
thus making it infeasible to use private-sector information as a proxy for the
public sector. As a result, estimates of public capital’s impact are not easily
obtained.
In 1989, David Aschauer used production function estimates to ignite a
debate about the role of public capital in private production, and its role in
the productivity slowdown in the United States during the 1970s. Wylie (1996)
adopted the approach taken by Aschauer to estimate the elasticity of public
2 These costs rise to between $3.0 billion and $4.9 billion a year when valued in terms of current prices, although actual costs are likely to be significantly higher than this when factoring in the higher cost of petroleum since the study was conducted.

10 | THE ECONOMIC BENEFITS OF PUBLIC INFRASTRUCTURE SPENDING IN CANADA
capital in Canada. Using a production function and Canadian aggregate data
from 1946 to 1991, Wylie finds that government capital has a positive elasticity.
He concludes by arguing that his results support the finding for the United
States that public capital plays an important role in business-sector output
and productivity growth. Critics of these econometric studies have said that
they fail to account for non-stationarity in the data, omitted variable bias, and
simultaneity bias. In addition, the magnitudes of the coefficient estimates—the
benefits—are improbably large.
More recent empirical work replaces the production function with its dual: the
cost function.3 Nadiri and Mamuneas (1994) used the cost function approach to
investigate the impact of public capital on the cost structure of U.S. industries,
and obtained smaller, more credible estimates of the benefits from public
capital. Harchaoui and Tarkhani (2003) applied a similar approach using
Canadian data.
Finally, Baldwin, Gu, and Macdonald (2010) took an alternative non-parametric
approach to productivity analysis based on a growth accounting framework. It
focuses on private-sector inputs and outputs. Inputs that are difficult to measure
or include, such as public capital, are folded into estimates of multifactor
productivity. Critics of earlier studies that adopted this approach say that it
is unclear how large of an effect public capital has on productivity growth or
whether the impact varies over time. More recent research by Baldwin, Gu, and
Macdonald, however, specifically incorporates public capital using the benefits
estimated by Harchaoui and Tarkhani and others.
Harchaoui and Tarkhani estimated the effects of public capital on business-
sector production costs, level of output, and demand for labour, capital, and
intermediate goods using Canadian data for 37 industries for the 1961–2000
period using a translog cost function. They found that an increase in public
capital has an initial direct impact on productivity: It reduces the cost of
producing a given level of output in almost all industries. This cost-reducing
“productivity effect” of public capital varies in magnitude across industries (see
Appendix A for a table reproducing Harchaoui and Tarkhani’s results), with the
largest benefits accruing to the transportation, wholesale, retail, and other utility
3 In a production function, firms produce their output using various inputs (capital, labour, materials, etc.) so as to maximize their profits. A cost function has firms minimizing the cost of inputs to produce their output. The cost function is referred to as the dual of the production function because the two approaches yield the same outcome in terms of inputs and outputs.
11 | THE ECONOMIC BENEFITS OF PUBLIC INFRASTRUCTURE SPENDING IN CANADA
sectors. The economic impact of public capital on the various industries does
not stop with the direct productivity effect. Cost reductions permit products
to be sold at lower prices, and lower prices can be expected to lead to higher
sales and output growth. Harchaoui and Tarkhani refer to this as the “output
effect” of public capital.
The cost-reducing and output-expanding impacts of public capital affect the
business sector’s demand for labour, capital, and intermediate inputs. When
industry production levels increase due to the “output effect” of public capital,
the demand for labour and intermediate inputs is reduced, while the demand
for private capital increases in all industries. Thus, the output effect of public
capital reinforces the “crowding in” of private capital formation so that public
capital can be seen as having an important role in contributing to investment-
led economic expansions, and implies that public capital is a complement to
private capital.
This paper uses the findings from Harchaoui and Tarkhani to estimate the
economic benefits of a national five-year, $50-billion public infrastructure
spending program using the C4SE’s provincial economic modelling system.
The size of the program chosen for this study is arbitrary, and is meant to be
illustrative of the types of benefits that could accrue from a major program
of this nature. The results in this paper can, within limits, generally be scaled
to larger or smaller spending initiatives.4 The next section discusses the
study methodology and assumptions and is followed by the results. Results
are presented in terms of impacts upon GDP, employment, and government
finances over time, by sector, and by province. Spending multipliers and return
on investment statistics are generated to provide summary measures of the
results. The paper concludes with some observations based on the results.
4 A small program would need to be evaluated on the specifics of the project and the results could vary widely from the “average” project portfolio examined in this report, while a very large program would introduce distortions in markets for labour and materials that would not be captured by the model, which is predicated on the notion of marginal changes from current economic conditions.
12 | THE ECONOMIC BENEFITS OF PUBLIC INFRASTRUCTURE SPENDING IN CANADA
METHODOLOGY AND ASSUMPTIONS
The benefits of a national public infrastructure program—which accrue
principally to the construction sector—arise from the direct program spending
and beyond, with public capital promoting economic growth and productivity.
Direct Construction Phase Assumptions and Impact
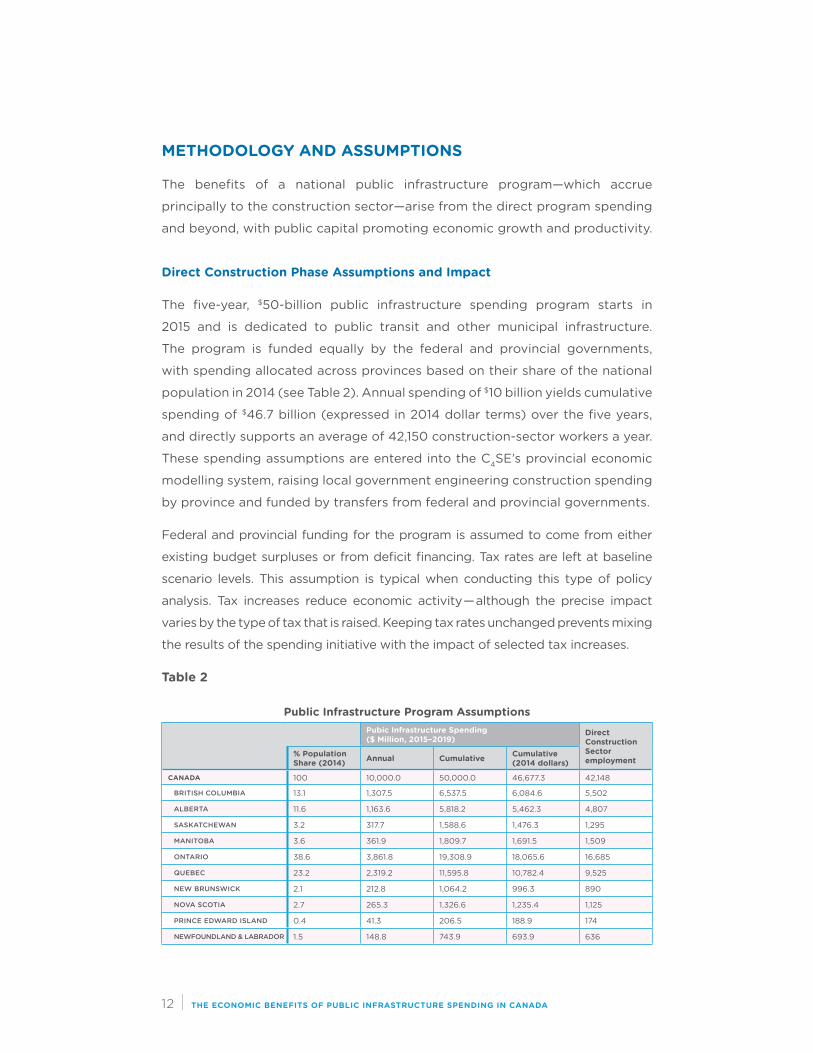
The five-year, $50-billion public infrastructure spending program starts in
2015 and is dedicated to public transit and other municipal infrastructure.
The program is funded equally by the federal and provincial governments,
with spending allocated across provinces based on their share of the national
population in 2014 (see Table 2). Annual spending of $10 billion yields cumulative
spending of $46.7 billion (expressed in 2014 dollar terms) over the five years,
and directly supports an average of 42,150 construction-sector workers a year.
These spending assumptions are entered into the C4SE’s provincial economic
modelling system, raising local government engineering construction spending
by province and funded by transfers from federal and provincial governments.
Federal and provincial funding for the program is assumed to come from either
existing budget surpluses or from deficit financing. Tax rates are left at baseline
scenario levels. This assumption is typical when conducting this type of policy
analysis. Tax increases reduce economic activity—although the precise impact
varies by the type of tax that is raised. Keeping tax rates unchanged prevents mixing
the results of the spending initiative with the impact of selected tax increases.
Table 2
Public Infrastructure Program AssumptionsPubic Infrastructure Spending ($ Million, 2015–2019)
Direct Construction Sector employment
% Population Share (2014) Annual Cumulative Cumulative
(2014 dollars)
CANADA 100 10,000.0 50,000.0 46,677.3 42,148
BRITISH COLUMBIA 13.1 1,307.5 6,537.5 6,084.6 5,502
ALBERTA 11.6 1,163.6 5,818.2 5,462.3 4,807
SASKATCHEWAN 3.2 317.7 1,588.6 1,476.3 1,295
MANITOBA 3.6 361.9 1,809.7 1,691.5 1,509
ONTARIO 38.6 3,861.8 19,308.9 18,065.6 16,685
QUEBEC 23.2 2,319.2 11,595.8 10,782.4 9,525
NEW BRUNSWICK 2.1 212.8 1,064.2 996.3 890
NOVA SCOTIA 2.7 265.3 1,326.6 1,235.4 1,125
PRINCE EDWARD ISLAND 0.4 41.3 206.5 188.9 174
NEWFOUNDLAND & LABRADOR 1.5 148.8 743.9 693.9 636
13 | THE ECONOMIC BENEFITS OF PUBLIC INFRASTRUCTURE SPENDING IN CANADA
Once built, it is assumed that this public infrastructure will be maintained and
repaired. The implicit depreciation rate generated from Statistics Canada’s
data for public-sector engineering construction is nine per cent, indicating an
average service life of 11 years. The estimated service life of public infrastructure
varies from as little as 15 years for some roads up to 150 years for main sewers
(Félio 2012, 11). This study assumes that the infrastructure projects built
under this program will have an average service life of 25 years. Public-sector
spending from 2020 on is permanently raised by $1.87 billion a year (measured
in 2014 dollars). The cost of maintaining the capital will be higher if a shorter
average service life is assumed, while a longer service life will lower the cost.
Benefits to Private Industry
The private industry cost elasticities estimated by Harchaoui and Tarkhani are
used to reduce production costs by business sector in the C4SE’s provincial
economic modelling system. A table showing the elasticities of costs with respect
to public capital by business sector is reproduced in Appendix A. A $50-billion
spending program raises the value of the stock of public infrastructure capital
in Canada by just over 18 per cent by 2020. Production costs by industry are
therefore eventually reduced by 18 times the estimated cost elasticity.
The changes in industry costs are introduced into the C4SE’s model after
the first full year of infrastructure spending (in 2016), and reach their
maximum by 2020. The benefits to industry in terms of reduced costs
continue over the design life of the public capital. Maintaining the public
infrastructure so that the net capital stock value is preserved therefore
allows these benefits to persist throughout the simulation period. Another
important assumption is that the use of public capital by one industry
does not preclude or reduce the value of its use by any other industry.
A Scenario-Based Approach to Modelling Uncertainty
Many economists consider the private industry cost elasticities estimated by
Harchaoui and Tarkhani to be plausible. Harchaoui and Tarkhani’s work corrects
the methodological concerns of earlier studies and produces elasticities that
are significantly smaller than those from earlier empirical studies. There is still
debate and uncertainty, however, over the precise level of benefit conferred to
private industry from public capital.
14 | THE ECONOMIC BENEFITS OF PUBLIC INFRASTRUCTURE SPENDING IN CANADA
Uncertainty is modelled through a set of scenarios. The first of these scenarios
is the zero benefits case, which assumes that public infrastructure provides
no benefit to private business. The results from this scenario are an extreme
case and are not meant to represent a likely outcome. They are, as will be seen,
helpful in evaluating the benefits of lower industry costs from public capital
upon the economy.
Two more plausible scenarios are provided to evaluate the benefits of lower
industry costs: the half benefits case and the full benefits case. The half benefits
case halves Harchaoui and Tarkhani’s business industry cost elasticities and
reflects the possibility that such a large spending program, while addressing
many vital infrastructure needs, may also include a number of projects of
dubious economic necessity or value. Economists refer to this phenomenon as
“diminishing marginal return on investment.” The full benefits case is based on
the full value of the estimated cost elasticities.
A final scenario, referred to as the baseline scenario, does not include any
additional public infrastructure spending. This is the benchmark against which
each of the other scenarios is compared. This scenario is summarized in
Appendix B.
RESULTS: TOTAL ECONOMIC IMPACT
This section of the report presents the total economic impact of the public
infrastructure spending program described in the previous section. The analysis
is conducted using the C4SE’s provincial economic modelling system, which is
a multi-region, multi-sector, dynamic stochastic general equilibrium model of
Canada and its provinces. The model is described in more detail in Appendix B.
The analysis consists of the four scenarios described in the previous section:
the baseline scenario, the zero benefits case, and the half and full benefits
cases. Table 3 summarizes the economic benefits from these scenarios by
comparing activity in the three public infrastructure spending scenarios against
the baseline scenario.5
5 A set of tables describing the macroeconomic impacts across Canada in more detail is provided in Appendix C.
15 | THE ECONOMIC BENEFITS OF PUBLIC INFRASTRUCTURE SPENDING IN CANADA
Table 3
Summary of Economic Impact of Public Infrastructure Spending on Canada’s Economy
Difference from the Baseline Percentage Difference from the Baseline
(2014 Dollars) Average Annual 2015–19
Average Annual 2020–40
Average Annual 2015–19
Average Annual 2020–40
GDP $ MILLION $ MILLION % %
Zero Benefit to Private Business 13,327 1,263 0.6 0.0
Half Benefit to Private Business 14,169 7,586 0.7 0.3
Full Benefit to Private Business 15,013 13,903 0.7 0.5
EMPLOYMENT THOUSAND THOUSAND % %
Zero Benefit to Private Business 88 -12 0.5 -0.1
Half Benefit to Private Business 84 -1 0.5 0.0%
Full Benefit to Private Business 81 9 0.4 0.0
NON-RESIDENTIAL FIXED INVESTMENT SPENDING $ MILLION $ MILLION % %
Zero Benefit to Private Business 12,538 1,442 3.6 0.3
Half Benefit to Private Business 13,043 3,096 3.7 0.7
Full Benefit to Private Business 13,551 4,750 3.9 1.1
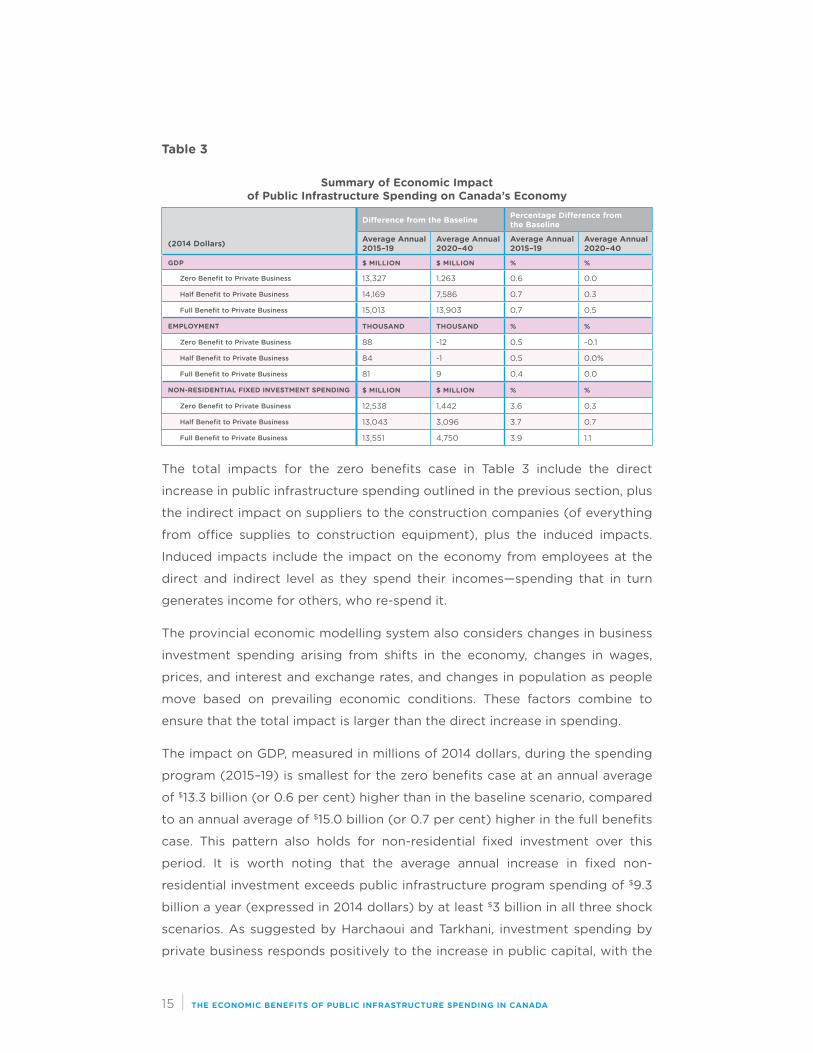
The total impacts for the zero benefits case in Table 3 include the direct
increase in public infrastructure spending outlined in the previous section, plus
the indirect impact on suppliers to the construction companies (of everything
from office supplies to construction equipment), plus the induced impacts.
Induced impacts include the impact on the economy from employees at the
direct and indirect level as they spend their incomes—spending that in turn
generates income for others, who re-spend it.
The provincial economic modelling system also considers changes in business
investment spending arising from shifts in the economy, changes in wages,
prices, and interest and exchange rates, and changes in population as people
move based on prevailing economic conditions. These factors combine to
ensure that the total impact is larger than the direct increase in spending.
The impact on GDP, measured in millions of 2014 dollars, during the spending
program (2015–19) is smallest for the zero benefits case at an annual average
of $13.3 billion (or 0.6 per cent) higher than in the baseline scenario, compared
to an annual average of $15.0 billion (or 0.7 per cent) higher in the full benefits
case. This pattern also holds for non-residential fixed investment over this
period. It is worth noting that the average annual increase in fixed non-
residential investment exceeds public infrastructure program spending of $9.3
billion a year (expressed in 2014 dollars) by at least $3 billion in all three shock
scenarios. As suggested by Harchaoui and Tarkhani, investment spending by
private business responds positively to the increase in public capital, with the

16 | THE ECONOMIC BENEFITS OF PUBLIC INFRASTRUCTURE SPENDING IN CANADA
size of this effect depending on the increase in productivity to private business
from public infrastructure.
The impact on employment during this period follows a different pattern. The
increase in average annual employment relative to the baseline is 88,000 in
the zero benefits case but 81,000 in the full benefits case. These results also
mirror those of Harchaoui and Tarkhani. Spending on public infrastructure
raises employment, but the size of the increase diminishes as the productivity
of public infrastructure to private business rises. This is because increases in
public capital reduce the demand for labour and intermediate inputs.
After the infrastructure program ends, average annual GDP in the zero benefits
case, measured in 2014 dollars, is just $1.3 billion a year higher than in the baseline
scenario—less than the $1.9-billion increase in spending to maintain and repair
the new public infrastructure. Reductions in business costs incorporated in the
half and full benefits cases lead to increases in GDP relative to the baseline of
between $7.6 and $13.9 billion a year.
Although the zero benefits case is not considered a likely outcome, the reader is
encouraged to compare the outcome of the full and half benefits cases against
it to assess the benefits to the economy that can be attributed to the increase
in productivity to private business from public infrastructure. These benefits
amount to an average of between $6.3 and $12.6 billion of additional GDP a year,
with the full benefits case conferring twice the benefit of the half benefits case.
The long-term impact on non-residential investment spending follows the same
pattern as GDP. The half benefits case raises average annual investment by $1.7
billion relative to the zero benefits case, while the full benefits case raises it by $3.4 billion. As seen in the short term, increases in public infrastructure spending
encourage private business to increase investment spending.
Finally, the long-term impact on employment is very small for all three shock
scenarios relative to the baseline. Comparing the half and full benefits cases to the
zero benefits case yields an average annual increase in jobs of 11,000 and 21,000,
respectively. In contrast to the short term, in the long run higher productivity
levels lead to more jobs. This result is discussed in more detail later in this section.
Figures 1–3 provide a summary of the impacts on select key economic measures
for each shock scenario relative to the baseline over the five-year construction
phase and over the long run.
17 | THE ECONOMIC BENEFITS OF PUBLIC INFRASTRUCTURE SPENDING IN CANADA
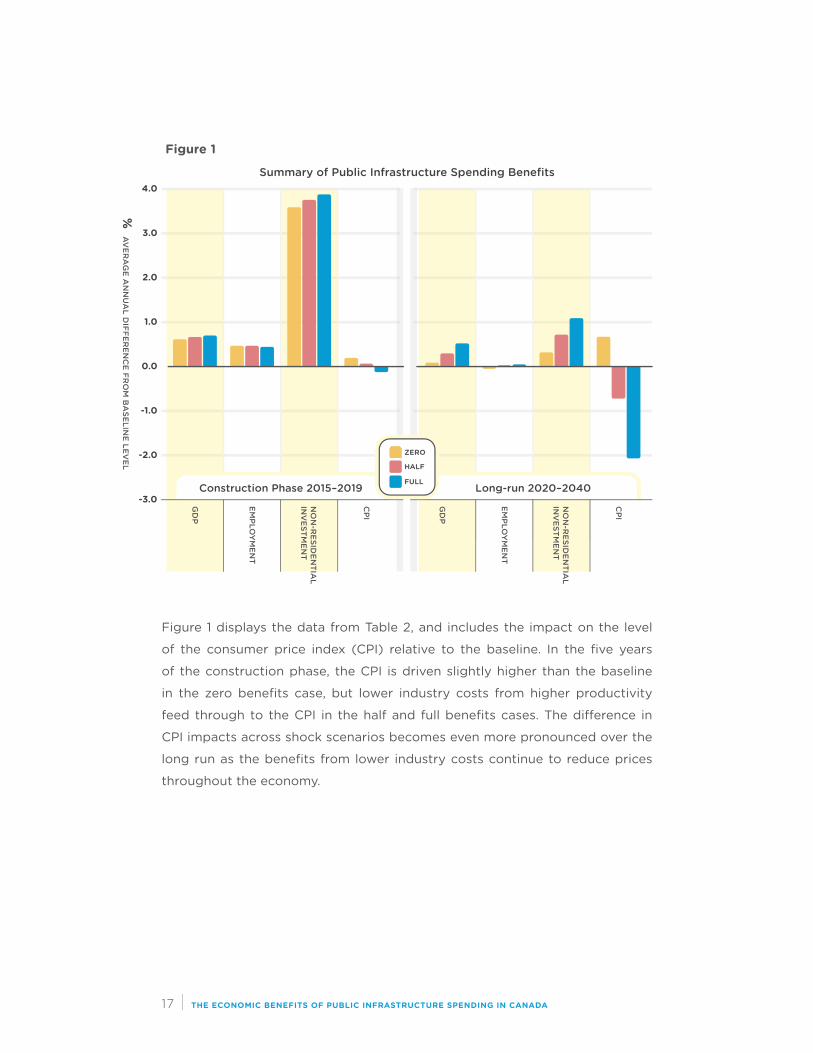
Figure 1
Figure 1 displays the data from Table 2, and includes the impact on the level
of the consumer price index (CPI) relative to the baseline. In the five years
of the construction phase, the CPI is driven slightly higher than the baseline
in the zero benefits case, but lower industry costs from higher productivity
feed through to the CPI in the half and full benefits cases. The difference in
CPI impacts across shock scenarios becomes even more pronounced over the
long run as the benefits from lower industry costs continue to reduce prices
throughout the economy.
-2.0
-3.0
-1.0
0.0
1.0
2.0
3.0
4.0
GD
P
EMPLO
YM
ENT
% A
VER
AG
E AN
NU
AL D
IFFEREN
CE FR
OM
BA
SELINE LEV
EL
NO
N-R
ESIDEN
TIAL
INV
ESTMEN
T
CPI
Construction Phase 2015–2019
Summary of Public Infrastructure Spending Benefits
Long-run 2020–2040
GD
P
EMPLO
YM
ENT
NO
N-R
ESIDEN
TIAL
INV
ESTMEN
T
CPI
ZERO
HALF
FULL
18 | THE ECONOMIC BENEFITS OF PUBLIC INFRASTRUCTURE SPENDING IN CANADA
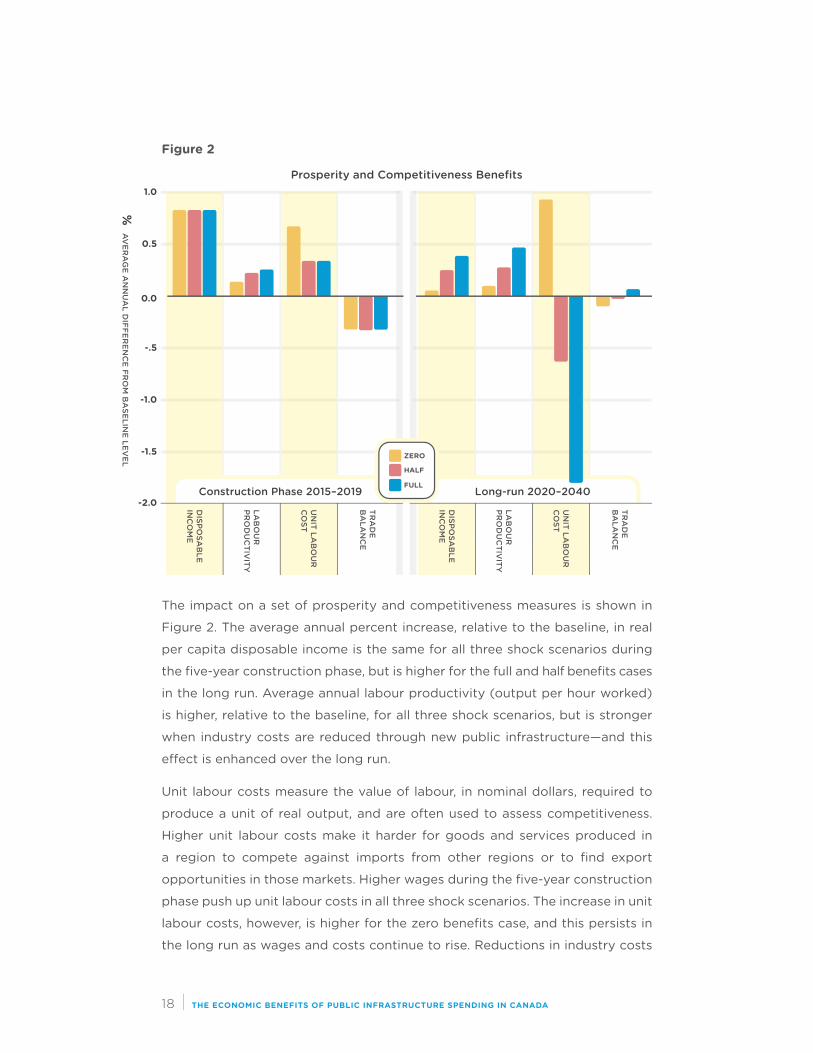
Figure 2
The impact on a set of prosperity and competitiveness measures is shown in
Figure 2. The average annual percent increase, relative to the baseline, in real
per capita disposable income is the same for all three shock scenarios during
the five-year construction phase, but is higher for the full and half benefits cases
in the long run. Average annual labour productivity (output per hour worked)
is higher, relative to the baseline, for all three shock scenarios, but is stronger
when industry costs are reduced through new public infrastructure—and this
effect is enhanced over the long run.
Unit labour costs measure the value of labour, in nominal dollars, required to
produce a unit of real output, and are often used to assess competitiveness.
Higher unit labour costs make it harder for goods and services produced in
a region to compete against imports from other regions or to find export
opportunities in those markets. Higher wages during the five-year construction
phase push up unit labour costs in all three shock scenarios. The increase in unit
labour costs, however, is higher for the zero benefits case, and this persists in
the long run as wages and costs continue to rise. Reductions in industry costs
-1.0
-1.5
-2.0
-.5
0.0
0.5
1.0
DISPO
SAB
LEIN
CO
ME
LAB
OU
RPR
OD
UC
TIVITY
% A
VER
AG
E AN
NU
AL D
IFFEREN
CE FR
OM
BA
SELINE LEV
EL
UN
IT LAB
OU
RC
OST
TRA
DE
BA
LAN
CE
Construction Phase 2015–2019
Prosperity and Competitiveness Benefits
Long-run 2020–2040
DISPO
SAB
LEIN
CO
ME
LAB
OU
RPR
OD
UC
TIVITY
UN
IT LAB
OU
RC
OST
TRA
DE
BA
LAN
CE
ZERO
HALF
FULL
19 | THE ECONOMIC BENEFITS OF PUBLIC INFRASTRUCTURE SPENDING IN CANADA
have a significant impact on unit labour costs over the long run due to lower
wages6 and increased productivity.
Shifts in competitiveness influence the trade balance. In the short term, however,
the trade balance—expressed as the average annual difference from the baseline
of the real trade balance as a share of real GDP—is more heavily influenced by
the need to import materials to support the infrastructure spending program,
and falls by about the same amount in all three shock scenarios. In the long run,
the more competitive economy in the full benefits case leads to an improvement
in the trade balance, whereas it remains depressed, relative to the baseline, in
the zero benefits case.
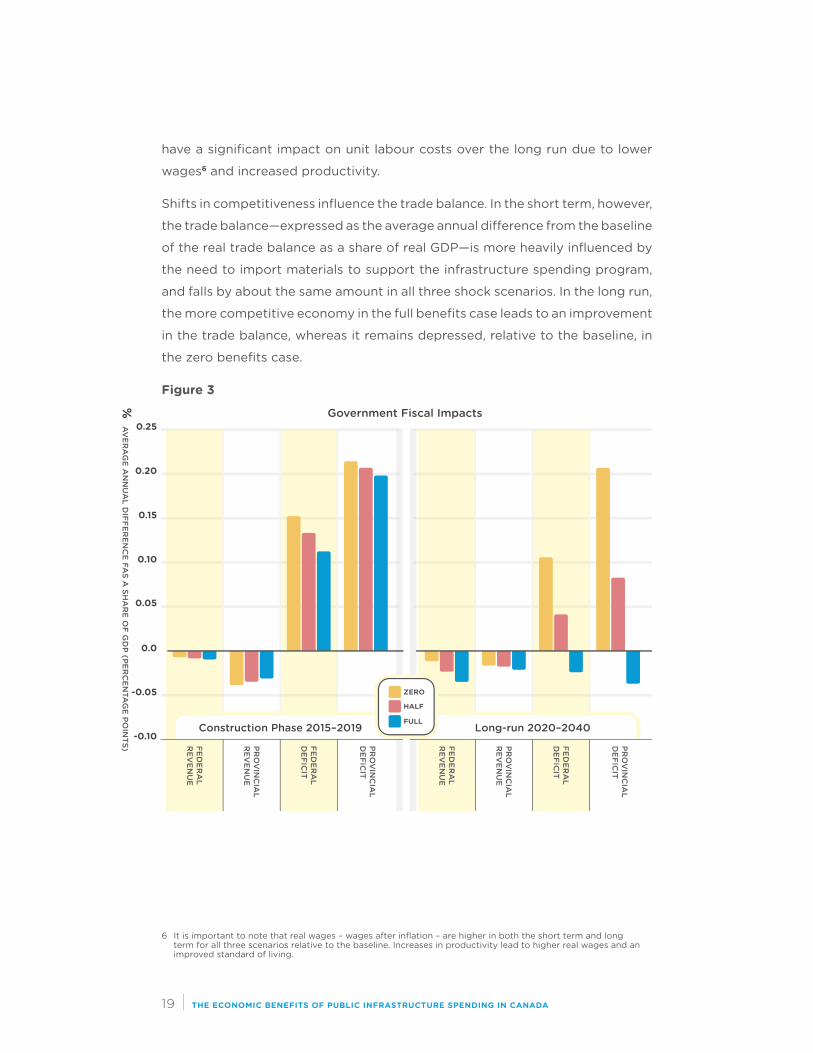
Figure 3
-0.10
-0.05
0.0
0.05
0.10
0.15
0.20
0.25
FEDER
AL
REV
ENU
E
PRO
VIN
CIA
LR
EVEN
UE
% A
VER
AG
E AN
NU
AL D
IFFEREN
CE FA
S A SH
AR
E OF G
DP (PER
CEN
TAG
E POIN
TS) FEDER
AL
DEFIC
IT
PRO
VIN
CIA
LD
EFICIT
Construction Phase 2015–2019
Government Fiscal Impacts
Long-run 2020–2040
FEDER
AL
REV
ENU
E
PRO
VIN
CIA
LR
EVEN
UE
FEDER
AL
DEFIC
IT
PRO
VIN
CIA
LD
EFICIT
ZERO
HALF
FULL
6 It is important to note that real wages – wages after inflation – are higher in both the short term and long term for all three scenarios relative to the baseline. Increases in productivity lead to higher real wages and an improved standard of living.

20 | THE ECONOMIC BENEFITS OF PUBLIC INFRASTRUCTURE SPENDING IN CANADA
The impact on government finances is summarized in Figure 3. The impact on
government revenues is expressed as the change, relative to the baseline, of GDP.
The impact on government deficits or surpluses are similarly expressed as a
share of GDP.
During the five-year construction phase, average annual government revenues
rise, but not as rapidly as nominal GDP, so their share declines.7 The impact
is stronger for the combined provincial governments than for the federal
government because natural-resource revenues for provinces such as Alberta,
Saskatchewan, and Newfoundland and Labrador are largely unchanged from
their baseline levels, leaving these provinces with smaller increases in their
overall revenues. Average annual government deficits, as a share of GDP, at
both the federal and provincial level are higher relative to the baseline. This is
hardly surprising as higher spending—as a share of GDP—collides with lower
revenues as a share of GDP. Stronger economic growth in the full benefits
case helps to partially reduce the increase in the deficit relative to the zero
benefits case.
Over the long run, average annual government revenues as a share of GDP
remain lower relative to the baseline for all three shock scenarios, with the
impact slightly worse for the half and full benefits cases than the zero benefits
case. The long-run impact on government deficits as a share of GDP is more
interesting. The lack of long-run economic expansion in the zero benefits
case means that higher debt-servicing costs, in conjunction with the cost of
maintaining and repairing the new public infrastructure, leave both federal and
provincial government deficits higher as a share of GDP relative to the baseline.
The higher economic activity in the full benefits case, however, actually leads
to a reduction in both federal and provincial deficits as a share of GDP relative
to the baseline.
The next section examines the results on a year-by-year basis so as to provide
the reader with a better understanding of the dynamic properties of the C4SE’s
provincial economic modelling system. This is followed by an examination of
the impacts by industry sector and then by province. Finally, the results are
summarized through a set of impact multipliers and return on public investment
statistics.
7 A decline in government revenue’s share of GDP does not necessarily mean that government revenue has declined. In fact, nominal government revenue is higher for all governments in all shock scenarios than in the baseline.
21 | THE ECONOMIC BENEFITS OF PUBLIC INFRASTRUCTURE SPENDING IN CANADA
Dynamic Impacts
For ease of exposition, most of the results of this analysis have been presented
either in terms of the impacts over the five-year term of the public infrastructure
spending program or as an average of long-term impacts. The C4SE’s provincial
economic modelling system does, however, produce results for each year
of the analysis. The annual results are presented in this section to help the
reader understand the evolution of the economy in response to the increase
in investment spending, and to help illustrate different ways of interpreting
impact analysis.
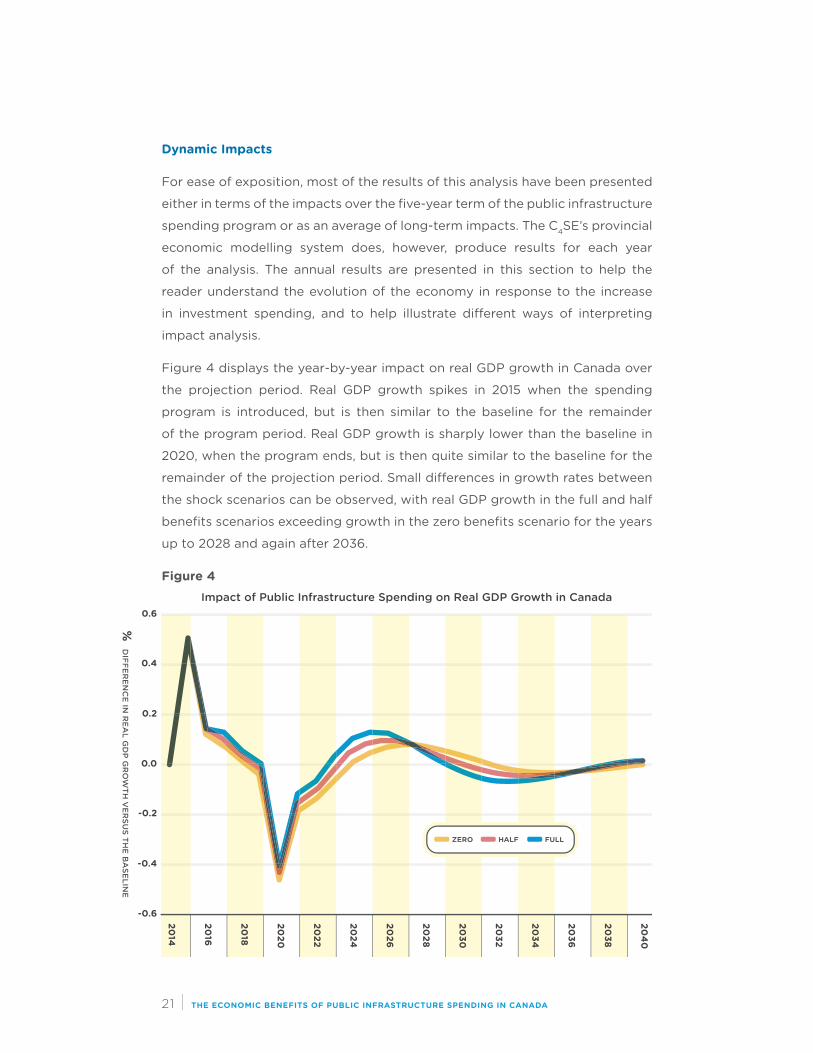
Figure 4 displays the year-by-year impact on real GDP growth in Canada over
the projection period. Real GDP growth spikes in 2015 when the spending
program is introduced, but is then similar to the baseline for the remainder
of the program period. Real GDP growth is sharply lower than the baseline in
2020, when the program ends, but is then quite similar to the baseline for the
remainder of the projection period. Small differences in growth rates between
the shock scenarios can be observed, with real GDP growth in the full and half
benefits scenarios exceeding growth in the zero benefits scenario for the years
up to 2028 and again after 2036.
Figure 4
-0.6
2014
2016
2018
2020
2022
2024
2026
2028
2030
2032
2034
2036
2038
2040
-0.4
-0.2
0.0
0.2
0.4
0.6
% D
IFFEREN
CE IN
REA
L GD
P GR
OW
TH V
ERSU
S THE B
ASELIN
E
Impact of Public Infrastructure Spending on Real GDP Growth in Canada
ZERO HALF FULL
22 | THE ECONOMIC BENEFITS OF PUBLIC INFRASTRUCTURE SPENDING IN CANADA
Figure 5
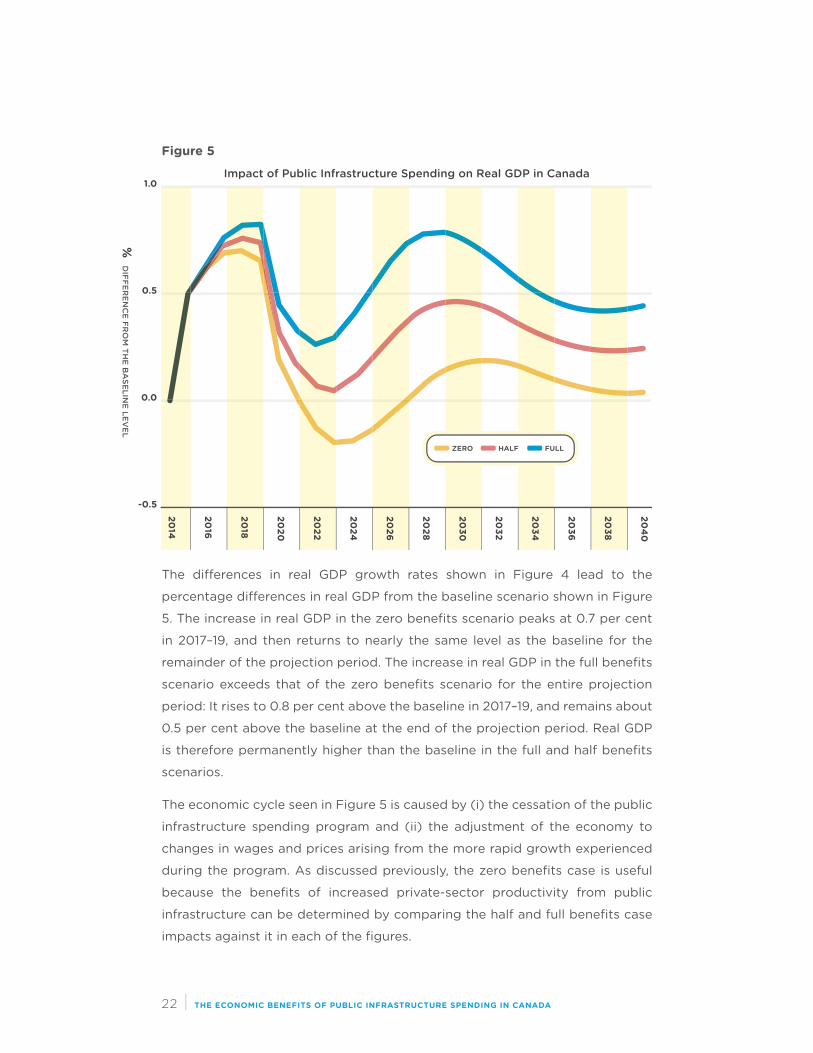
The differences in real GDP growth rates shown in Figure 4 lead to the
percentage differences in real GDP from the baseline scenario shown in Figure
5. The increase in real GDP in the zero benefits scenario peaks at 0.7 per cent
in 2017–19, and then returns to nearly the same level as the baseline for the
remainder of the projection period. The increase in real GDP in the full benefits
scenario exceeds that of the zero benefits scenario for the entire projection
period: It rises to 0.8 per cent above the baseline in 2017–19, and remains about
0.5 per cent above the baseline at the end of the projection period. Real GDP
is therefore permanently higher than the baseline in the full and half benefits
scenarios.
The economic cycle seen in Figure 5 is caused by (i) the cessation of the public
infrastructure spending program and (ii) the adjustment of the economy to
changes in wages and prices arising from the more rapid growth experienced
during the program. As discussed previously, the zero benefits case is useful
because the benefits of increased private-sector productivity from public
infrastructure can be determined by comparing the half and full benefits case
impacts against it in each of the figures.
-0.5
2014
2016
2018
2020
2022
2024
2026
2028
2030
2032
2034
2036
2038
2040
0.0
0.5
1.0
% D
IFFEREN
CE FR
OM
THE B
ASELIN
E LEVEL
Impact of Public Infrastructure Spending on Real GDP in Canada
ZERO HALF FULL
23 | THE ECONOMIC BENEFITS OF PUBLIC INFRASTRUCTURE SPENDING IN CANADA
Figure 6
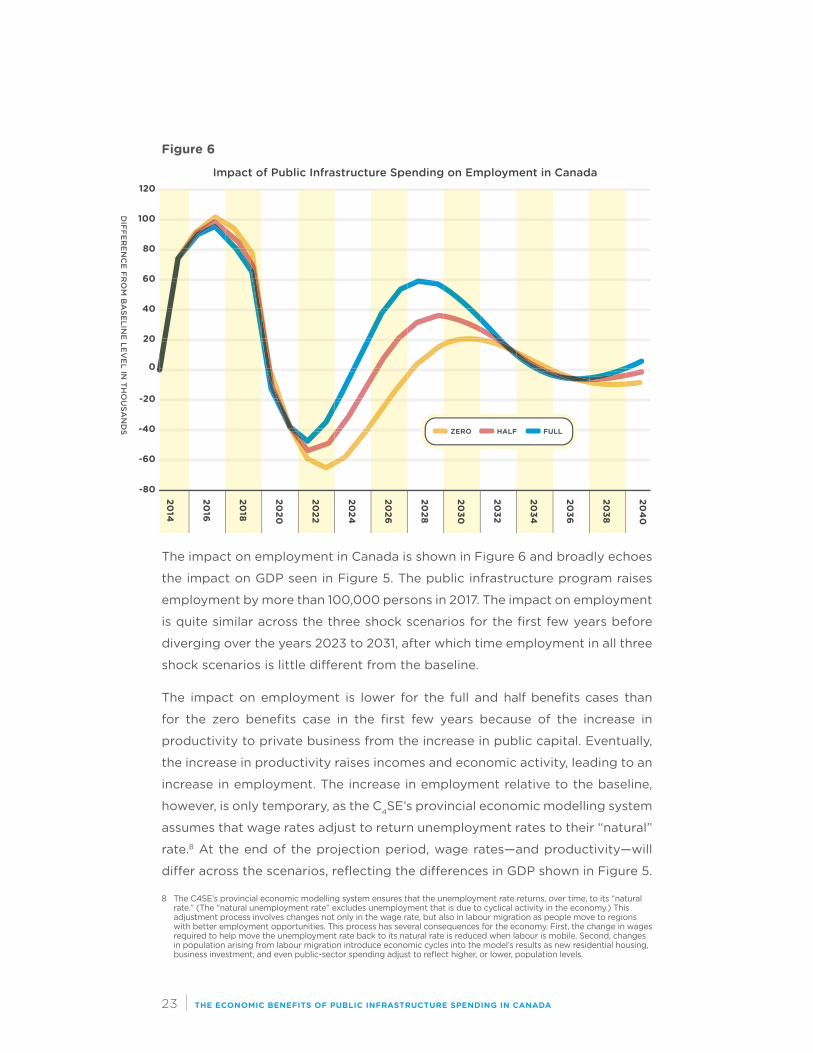
The impact on employment in Canada is shown in Figure 6 and broadly echoes
the impact on GDP seen in Figure 5. The public infrastructure program raises
employment by more than 100,000 persons in 2017. The impact on employment
is quite similar across the three shock scenarios for the first few years before
diverging over the years 2023 to 2031, after which time employment in all three
shock scenarios is little different from the baseline.
The impact on employment is lower for the full and half benefits cases than
for the zero benefits case in the first few years because of the increase in
productivity to private business from the increase in public capital. Eventually,
the increase in productivity raises incomes and economic activity, leading to an
increase in employment. The increase in employment relative to the baseline,
however, is only temporary, as the C4SE’s provincial economic modelling system
assumes that wage rates adjust to return unemployment rates to their “natural”
rate.8 At the end of the projection period, wage rates—and productivity—will
differ across the scenarios, reflecting the differences in GDP shown in Figure 5.
-80
2014
2016
2018
2020
2022
2024
2026
2028
2030
2032
2034
2036
2038
2040
-20
-40
-60
60
40
20
0
120
100
80
DIFFER
ENC
E FRO
M B
ASELIN
E LEVEL IN
THO
USA
ND
S
Impact of Public Infrastructure Spending on Employment in Canada
ZERO HALF FULL
8 The C4SE’s provincial economic modelling system ensures that the unemployment rate returns, over time, to its “natural rate.” (The “natural unemployment rate” excludes unemployment that is due to cyclical activity in the economy.) This adjustment process involves changes not only in the wage rate, but also in labour migration as people move to regions with better employment opportunities. This process has several consequences for the economy. First, the change in wages required to help move the unemployment rate back to its natural rate is reduced when labour is mobile. Second, changes in population arising from labour migration introduce economic cycles into the model’s results as new residential housing, business investment, and even public-sector spending adjust to reflect higher, or lower, population levels.
24 | THE ECONOMIC BENEFITS OF PUBLIC INFRASTRUCTURE SPENDING IN CANADA
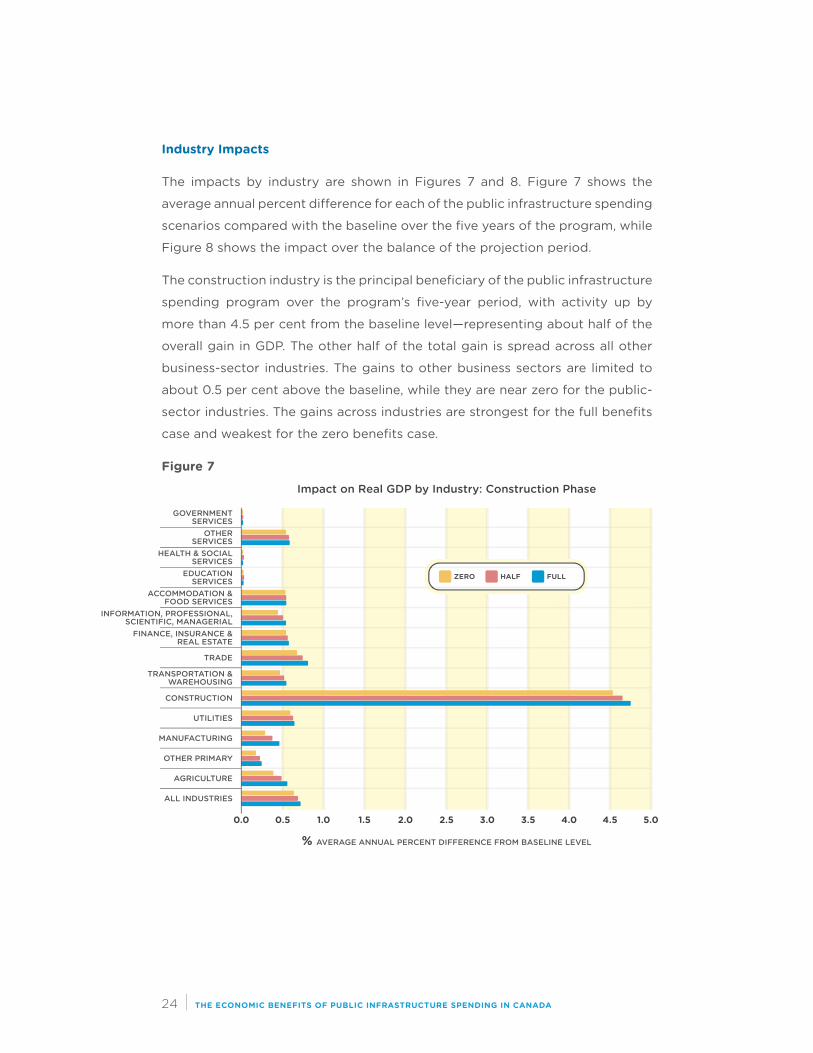
Industry Impacts
The impacts by industry are shown in Figures 7 and 8. Figure 7 shows the
average annual percent difference for each of the public infrastructure spending
scenarios compared with the baseline over the five years of the program, while
Figure 8 shows the impact over the balance of the projection period.
The construction industry is the principal beneficiary of the public infrastructure
spending program over the program’s five-year period, with activity up by
more than 4.5 per cent from the baseline level—representing about half of the
overall gain in GDP. The other half of the total gain is spread across all other
business-sector industries. The gains to other business sectors are limited to
about 0.5 per cent above the baseline, while they are near zero for the public-
sector industries. The gains across industries are strongest for the full benefits
case and weakest for the zero benefits case.
Figure 7
Impact on Real GDP by Industry: Construction Phase
ZERO HALF FULL
GOVERNMENTSERVICES
OTHERSERVICES
HEALTH & SOCIALSERVICES
EDUCATIONSERVICES
ACCOMMODATION &FOOD SERVICES
INFORMATION, PROFESSIONAL,SCIENTIFIC, MANAGERIAL
FINANCE, INSURANCE &REAL ESTATE
TRADE
TRANSPORTATION &WAREHOUSING
CONSTRUCTION
UTILITIES
MANUFACTURING
OTHER PRIMARY
AGRICULTURE
ALL INDUSTRIES
% AVERAGE ANNUAL PERCENT DIFFERENCE FROM BASELINE LEVEL
0.0 0.5 1.0 1.5 2.0 2.5 3.0 3.5 4.0 4.5 5.0
25 | THE ECONOMIC BENEFITS OF PUBLIC INFRASTRUCTURE SPENDING IN CANADA
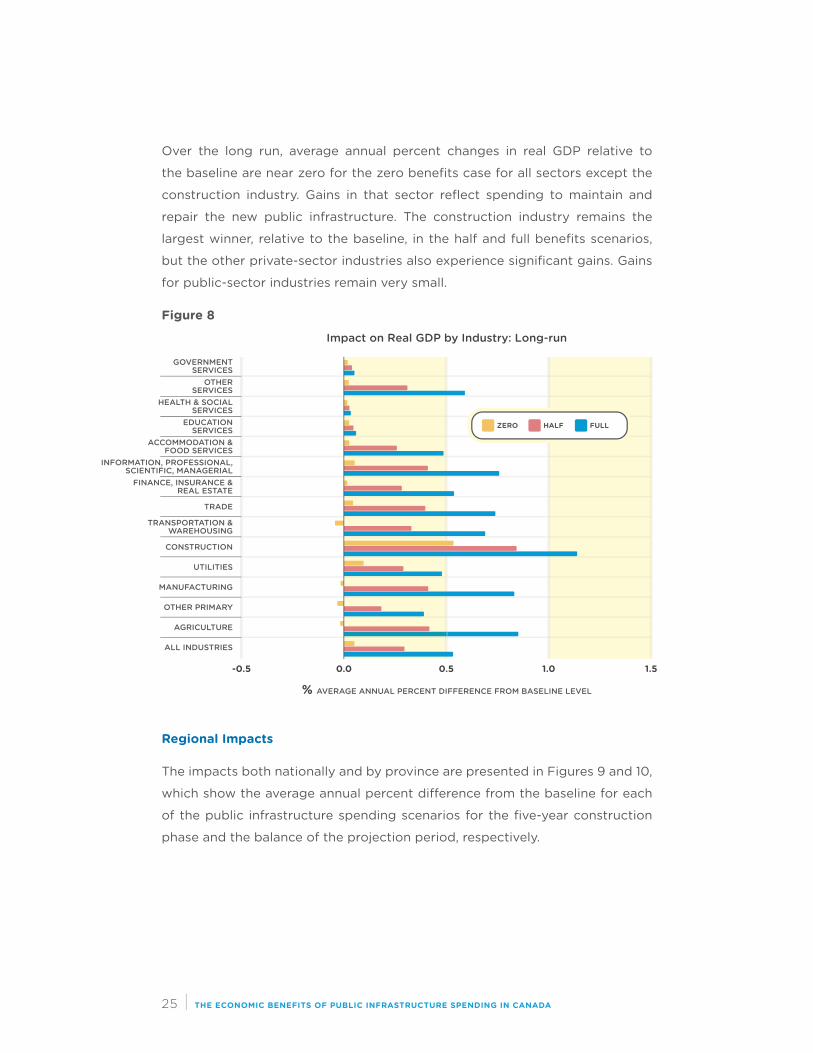
Over the long run, average annual percent changes in real GDP relative to
the baseline are near zero for the zero benefits case for all sectors except the
construction industry. Gains in that sector reflect spending to maintain and
repair the new public infrastructure. The construction industry remains the
largest winner, relative to the baseline, in the half and full benefits scenarios,
but the other private-sector industries also experience significant gains. Gains
for public-sector industries remain very small.
Figure 8
Regional Impacts
The impacts both nationally and by province are presented in Figures 9 and 10,
which show the average annual percent difference from the baseline for each
of the public infrastructure spending scenarios for the five-year construction
phase and the balance of the projection period, respectively.
Impact on Real GDP by Industry: Long-run
GOVERNMENTSERVICES
OTHERSERVICES
HEALTH & SOCIALSERVICES
EDUCATIONSERVICES
ACCOMMODATION &FOOD SERVICES
INFORMATION, PROFESSIONAL,SCIENTIFIC, MANAGERIAL
FINANCE, INSURANCE &REAL ESTATE
TRADE
TRANSPORTATION &WAREHOUSING
CONSTRUCTION
UTILITIES
MANUFACTURING
OTHER PRIMARY
AGRICULTURE
ALL INDUSTRIES
% AVERAGE ANNUAL PERCENT DIFFERENCE FROM BASELINE LEVEL
-0.5 0.0 0.5 1.0 1.5
ZERO HALF FULL
26 | THE ECONOMIC BENEFITS OF PUBLIC INFRASTRUCTURE SPENDING IN CANADA
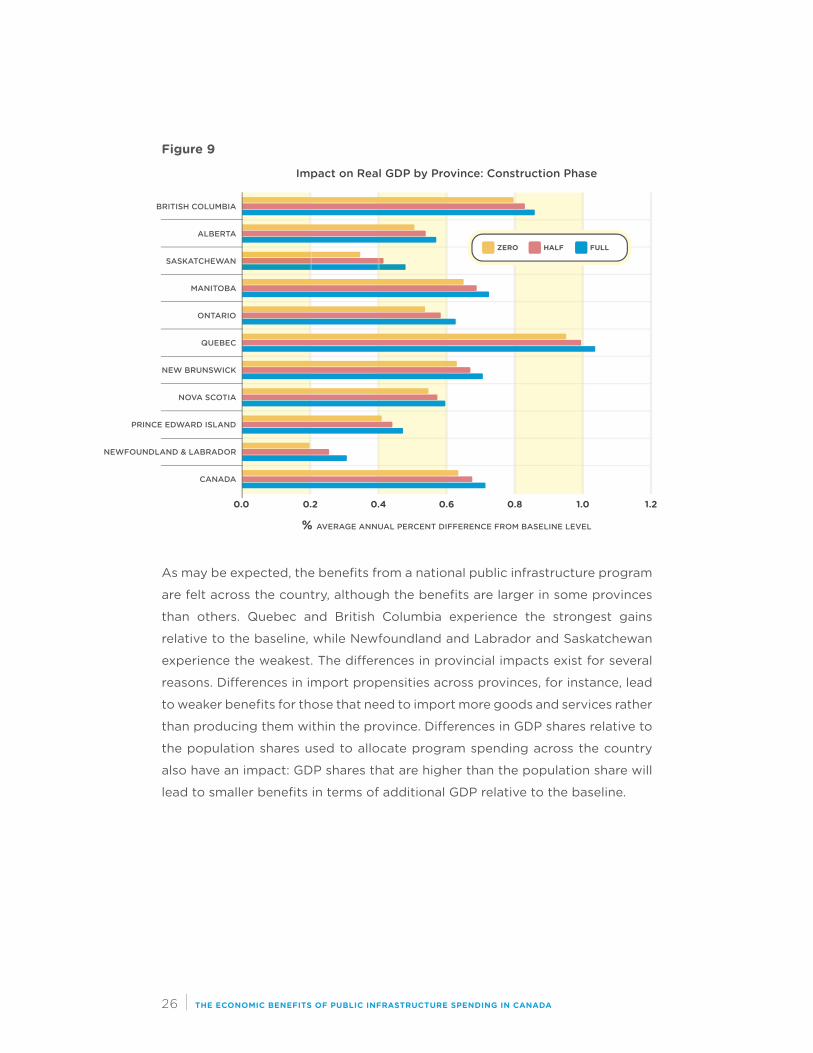
Figure 9
As may be expected, the benefits from a national public infrastructure program
are felt across the country, although the benefits are larger in some provinces
than others. Quebec and British Columbia experience the strongest gains
relative to the baseline, while Newfoundland and Labrador and Saskatchewan
experience the weakest. The differences in provincial impacts exist for several
reasons. Differences in import propensities across provinces, for instance, lead
to weaker benefits for those that need to import more goods and services rather
than producing them within the province. Differences in GDP shares relative to
the population shares used to allocate program spending across the country
also have an impact: GDP shares that are higher than the population share will
lead to smaller benefits in terms of additional GDP relative to the baseline.
Impact on Real GDP by Province: Construction Phase
BRITISH COLUMBIA
ALBERTA
SASKATCHEWAN
MANITOBA
ONTARIO
QUEBEC
NEW BRUNSWICK
NOVA SCOTIA
PRINCE EDWARD ISLAND
NEWFOUNDLAND & LABRADOR
CANADA
% AVERAGE ANNUAL PERCENT DIFFERENCE FROM BASELINE LEVEL
0.0 0.2 0.4 0.6 0.8 1.0 1.2
ZERO HALF FULL
27 | THE ECONOMIC BENEFITS OF PUBLIC INFRASTRUCTURE SPENDING IN CANADA
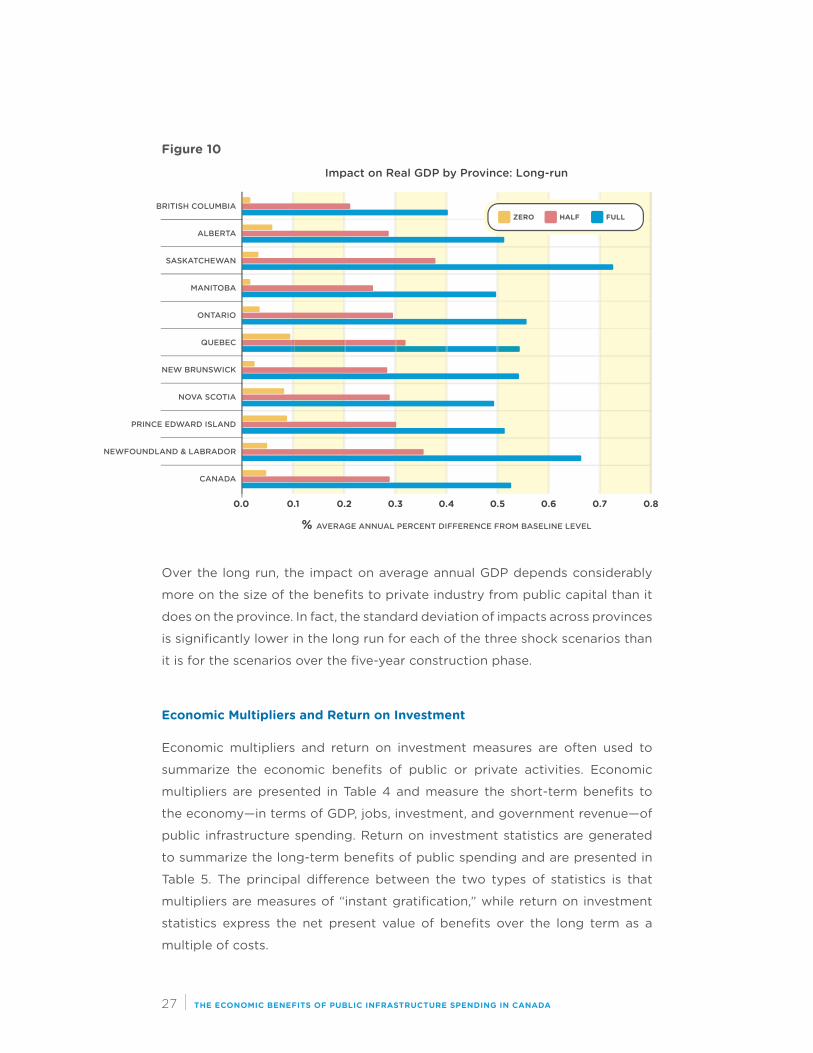
Figure 10
Over the long run, the impact on average annual GDP depends considerably
more on the size of the benefits to private industry from public capital than it
does on the province. In fact, the standard deviation of impacts across provinces
is significantly lower in the long run for each of the three shock scenarios than
it is for the scenarios over the five-year construction phase.
Economic Multipliers and Return on Investment
Economic multipliers and return on investment measures are often used to
summarize the economic benefits of public or private activities. Economic
multipliers are presented in Table 4 and measure the short-term benefits to
the economy—in terms of GDP, jobs, investment, and government revenue—of
public infrastructure spending. Return on investment statistics are generated
to summarize the long-term benefits of public spending and are presented in
Table 5. The principal difference between the two types of statistics is that
multipliers are measures of “instant gratification,” while return on investment
statistics express the net present value of benefits over the long term as a
multiple of costs.
Impact on Real GDP by Province: Long-run
BRITISH COLUMBIA
ALBERTA
SASKATCHEWAN
MANITOBA
ONTARIO
QUEBEC
NEW BRUNSWICK
NOVA SCOTIA
PRINCE EDWARD ISLAND
NEWFOUNDLAND & LABRADOR
CANADA
% AVERAGE ANNUAL PERCENT DIFFERENCE FROM BASELINE LEVEL
0.0 0.1 0.2 0.3 0.4 0.5 0.6 0.7 0.8
ZERO HALF FULL
28 | THE ECONOMIC BENEFITS OF PUBLIC INFRASTRUCTURE SPENDING IN CANADA
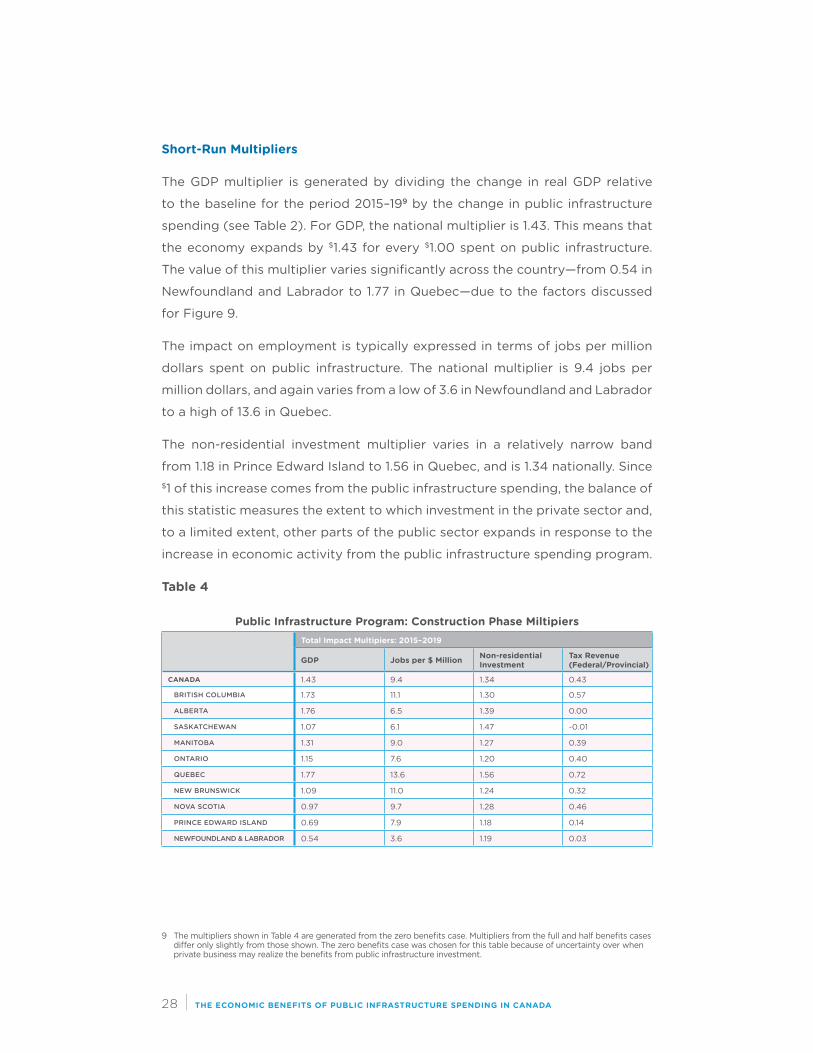
Short-Run Multipliers
The GDP multiplier is generated by dividing the change in real GDP relative
to the baseline for the period 2015–199 by the change in public infrastructure
spending (see Table 2). For GDP, the national multiplier is 1.43. This means that
the economy expands by $1.43 for every $1.00 spent on public infrastructure.
The value of this multiplier varies significantly across the country—from 0.54 in
Newfoundland and Labrador to 1.77 in Quebec—due to the factors discussed
for Figure 9.
The impact on employment is typically expressed in terms of jobs per million
dollars spent on public infrastructure. The national multiplier is 9.4 jobs per
million dollars, and again varies from a low of 3.6 in Newfoundland and Labrador
to a high of 13.6 in Quebec.
The non-residential investment multiplier varies in a relatively narrow band
from 1.18 in Prince Edward Island to 1.56 in Quebec, and is 1.34 nationally. Since $1 of this increase comes from the public infrastructure spending, the balance of
this statistic measures the extent to which investment in the private sector and,
to a limited extent, other parts of the public sector expands in response to the
increase in economic activity from the public infrastructure spending program.
Table 4
Public Infrastructure Program: Construction Phase MiltipiersTotal Impact Multipiers: 2015–2019
GDP Jobs per $ Million Non-residential Investment
Tax Revenue (Federal/Provincial)
CANADA 1.43 9.4 1.34 0.43
BRITISH COLUMBIA 1.73 11.1 1.30 0.57
ALBERTA 1.76 6.5 1.39 0.00
SASKATCHEWAN 1.07 6.1 1.47 -0.01
MANITOBA 1.31 9.0 1.27 0.39
ONTARIO 1.15 7.6 1.20 0.40
QUEBEC 1.77 13.6 1.56 0.72
NEW BRUNSWICK 1.09 11.0 1.24 0.32
NOVA SCOTIA 0.97 9.7 1.28 0.46
PRINCE EDWARD ISLAND 0.69 7.9 1.18 0.14
NEWFOUNDLAND & LABRADOR 0.54 3.6 1.19 0.03
9 The multipliers shown in Table 4 are generated from the zero benefits case. Multipliers from the full and half benefits cases differ only slightly from those shown. The zero benefits case was chosen for this table because of uncertainty over when private business may realize the benefits from public infrastructure investment.
29 | THE ECONOMIC BENEFITS OF PUBLIC INFRASTRUCTURE SPENDING IN CANADA
Federal government revenue rises by $0.43 per $1.00 spent by that level of
government (50 per cent of the program is funded by the federal government).
At the provincial level of government, the revenue raised per dollar spent on the
program varies from near zero in several provinces to $0.57 in British Columbia.
The combined provincial multiplier is $0.45 per $1.00 spent, so the revenue
recovered by all governments is $0.44 per dollar spent. As these multipliers are
less than one, governments finance the program by running higher deficits or
lower surpluses.
The low revenue impacts for some provinces require an explanation. The lowest
revenue impacts are for the provinces that derive a significant share of their
revenue from natural resources—Alberta, Saskatchewan, and Newfoundland
and Labrador—and this source of revenue is only marginally affected by the
infrastructure spending project. It is also important to note that nominal
revenues in the shock scenario are higher for all governments than in the
baseline. But, in order to allow relevant comparisons of the relative purchasing
power of government revenues in the zero benefits and baseline scenarios, the
revenues in both scenarios are restated in 2014 dollar terms. Higher prices in the
zero benefits case (see Figure 1) reduce the purchasing power of government
revenues in that scenario relative to the baseline, completely eliminating the
increase in nominal revenue for some provinces.
Long-Run Return on Investment
The longer-term benefits of public infrastructure spending are assessed
through return on investment (ROI) statistics. ROI calculations can be defined
in a variety of ways. The denominator is the net present value of expenditure
or investment over time associated with a particular outcome. The net present
value of the outcome over the simulation period is the numerator. The benefit
associated with a variety of outcome measures can be assessed. The most
common outcomes from economic benefit studies tend to be GDP, employment,
and government revenue.
The ROI statistics in this study show the net benefit to society from the public
infrastructure spending program. The first ROI statistic shows the discounted
value of GDP, measured in 2014 dollars, per dollar of funding (also expressed
in 2014 dollars). The second statistic shows the discounted number of jobs per
million dollars of spending. The final ROI statistic shows the number of dollars
30 | THE ECONOMIC BENEFITS OF PUBLIC INFRASTRUCTURE SPENDING IN CANADA
of additional federal or combined provincial tax revenue, expressed in 2014
dollars, per dollar spent (also expressed in 2014 dollars).
Discount Rates
The future is uncertain, so people place more importance on what they
have today relative to what they may have in the future. Uncertainty and the
number of potential risks rise as you look further into the future. The notion
of “discounting” the future is used to express how much less someone would
accept today in place of higher but uncertain future returns.
In the context of this analysis, the annual costs and benefits generated by the
C4SE’s provincial economic modelling system over the projection period are
converted to current-day values using a discount rate. In many cases, the yield
on long-term government bonds is used to represent the discount rate. This
rate accounts for the risks from both inflation and uncertainty about the future.
However, the economic measures considered in this report exclude the impacts
of inflation, so a lower discount rate can be used. In these instances, a discount
rate of just two or three per cent is often used, but higher uncertainty surrounding
the potential benefits from public infrastructure may make it advisable to use
a higher discount rate. The benefits based on both five per cent and seven per
cent discount rates were assessed to help account for this risk.
The costs and benefits in this study are assessed over the 28-year projection
horizon (from 2015 to 2043) in the provincial economic modelling system.
Arithmetically extending the projection horizon beyond 50 years leads to
stronger, positive results at all discount rates for the GDP, employment, and
government revenue ROI statistics. However, because of the potential that
other, disruptive technologies could arise in future decades, affecting the
assumed long-term returns, this alternative approach was not adopted.
Table 5 shows the ROI statistics associated with the zero benefits case and
the half and full benefits cases. Comparing the ROI measures from the zero
benefits case with the full and half benefits cases can again help determine
the productivity benefits to private business from public infrastructure. The
analysis reveals the following:
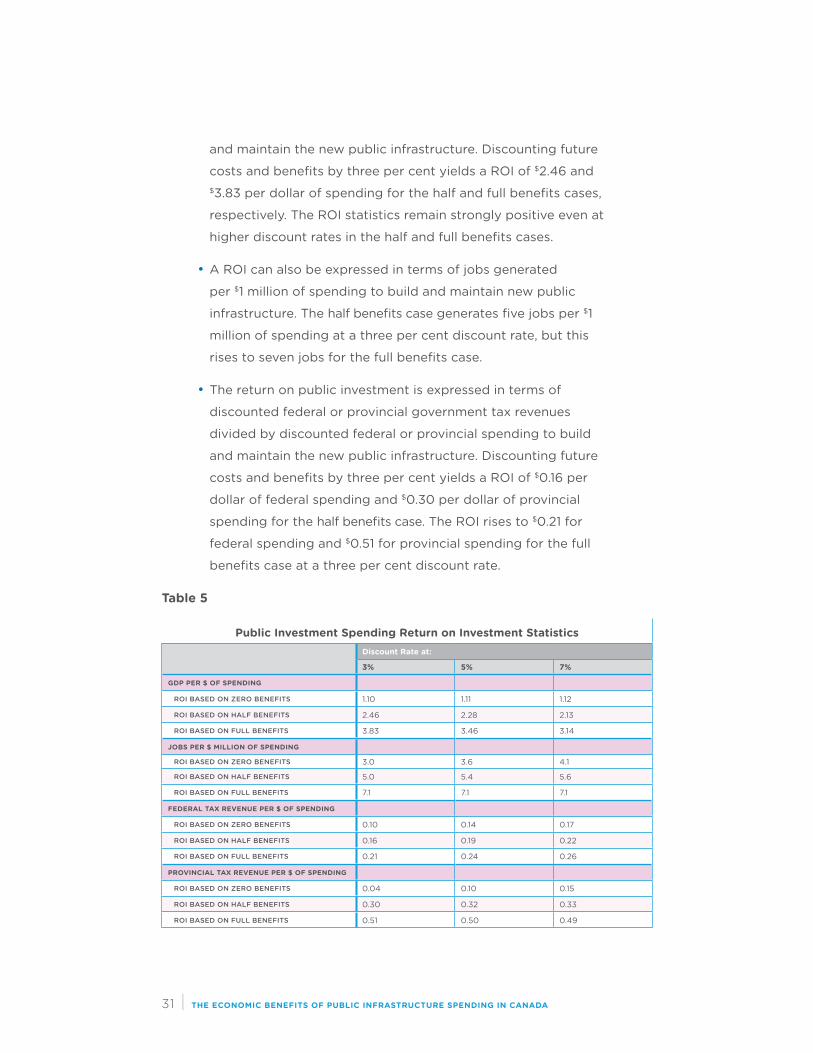
•The overall ROI is expressed in terms of discounted gross
domestic product divided by discounted spending to build
31 | THE ECONOMIC BENEFITS OF PUBLIC INFRASTRUCTURE SPENDING IN CANADA
and maintain the new public infrastructure. Discounting future
costs and benefits by three per cent yields a ROI of $2.46 and $3.83 per dollar of spending for the half and full benefits cases,
respectively. The ROI statistics remain strongly positive even at
higher discount rates in the half and full benefits cases.
•A ROI can also be expressed in terms of jobs generated
per $1 million of spending to build and maintain new public
infrastructure. The half benefits case generates five jobs per $1
million of spending at a three per cent discount rate, but this
rises to seven jobs for the full benefits case.
•The return on public investment is expressed in terms of
discounted federal or provincial government tax revenues
divided by discounted federal or provincial spending to build
and maintain the new public infrastructure. Discounting future
costs and benefits by three per cent yields a ROI of $0.16 per
dollar of federal spending and $0.30 per dollar of provincial
spending for the half benefits case. The ROI rises to $0.21 for
federal spending and $0.51 for provincial spending for the full
benefits case at a three per cent discount rate.
Table 5
Public Investment Spending Return on Investment StatisticsDiscount Rate at:
3% 5% 7%
GDP PER $ OF SPENDING
ROI BASED ON ZERO BENEFITS 1.10 1.11 1.12
ROI BASED ON HALF BENEFITS 2.46 2.28 2.13
ROI BASED ON FULL BENEFITS 3.83 3.46 3.14
JOBS PER $ MILLION OF SPENDING
ROI BASED ON ZERO BENEFITS 3.0 3.6 4.1
ROI BASED ON HALF BENEFITS 5.0 5.4 5.6
ROI BASED ON FULL BENEFITS 7.1 7.1 7.1
FEDERAL TAX REVENUE PER $ OF SPENDING
ROI BASED ON ZERO BENEFITS 0.10 0.14 0.17
ROI BASED ON HALF BENEFITS 0.16 0.19 0.22
ROI BASED ON FULL BENEFITS 0.21 0.24 0.26
PROVINCIAL TAX REVENUE PER $ OF SPENDING
ROI BASED ON ZERO BENEFITS 0.04 0.10 0.15
ROI BASED ON HALF BENEFITS 0.30 0.32 0.33
ROI BASED ON FULL BENEFITS 0.51 0.50 0.49
32 | THE ECONOMIC BENEFITS OF PUBLIC INFRASTRUCTURE SPENDING IN CANADA
SUMMARY AND OBSERVATIONS
Since productive public infrastructure reduces costs for private businesses,
a compelling case can be made for public funding of this capital. The C4SE
believes that the full benefits case results, based on the cost elasticity estimates
from Harchaoui and Tarkhani, are credible and represent the benefits that
should accrue from spending on public infrastructure. Although the five-year,
$50 billion program size is arbitrary, it is evident that a program of this scale
is required to begin to address the estimated $171.8 billion cost of replacing
the municipal assets rated fair, poor, or very poor condition across the country.
Because there is always a risk that such a large infrastructure program could
be administered inefficiently, leading the economy to realize fewer benefits
(perhaps as low as the half benefits case results), it is imperative to structure
such programs so they are designed and managed well.
The short-run economic benefits include a GDP multiplier of 1.43, 9.4 jobs
generated per million dollars spent, and $0.44 of government revenue recovered
per dollar spent. The increase in domestic economic activity, particularly
new construction-sector jobs, becomes more attractive in a slow-growth
environment riddled with external risks to our economy, such as low oil prices
and uncertain markets for our oil and gas, weakness with the ongoing potential
for crisis in Europe, and uncertainty in the United States.
Over the long run, the return on investment to GDP from spending on public
capital, assuming a three per cent discount rate, lies between 2.46 and 3.83 for
the half and full benefits scenarios. This result is easily strong enough to justify
a public infrastructure spending initiative and still remains high when higher
discount rates are assumed. While federal government revenue recovered is
between $0.16 and $0.21, and provincial government revenue is between $0.30
and $0.51, the long-run fiscal impact is less significant than this would suggest.
While deficits remain in the half benefits case (with a $1.0 billion average annual
increase measured in 2014 dollars for the federal government and a $2.2 billion
increase for provincial governments), they shrink in the full benefits case: $0.6 billion a year on average for the federal government and $1.1 billion for
the provincial governments. When expressed as a share of GDP, the average
annual deficit-to-GDP ratio for the federal government rises 0.04 per cent in
the half benefits case and falls 0.02 per cent in the full benefits case, while
for provincial governments it rises 0.08 per cent in the half benefits case and
falls 0.04 percent in the full benefits case. The overall long-run impact on both

33 | THE ECONOMIC BENEFITS OF PUBLIC INFRASTRUCTURE SPENDING IN CANADA
federal and provincial governments is therefore likely to be very small, and may
even be positive.
Some critics may note that the long-run increase in employment of between
five and seven jobs generated per million dollars spent on public capital is
low, and that the money would be better spent on other priorities—or not
spent at all. This result arises, in part, from the design of the C4SE’s provincial
economic modelling system, where changes in wage rates and migration
force the unemployment rate to adjust towards its natural rate over time.
While employment gains may be limited, businesses are more productive and
competitive, and workers earn higher real wages: up 0.4–0.6 per cent a year on
average in the half and full benefits cases relative to the baseline.
The increase in public capital can also help achieve something else that has
eluded policy makers in Canada over the last few years: gains in private-sector
investment spending. A public infrastructure program boosts private investment
by up to $0.34 per dollar of spending in the near term, and by $0.50–$1.00 in
the long term, and can therefore play an important role in contributing to an
investment-led economic expansion.
In summary, the benefits of a public infrastructure spending program
include more private-sector investment, a more productive economy, and a
higherstandard of living—and all are achieved without significant long-term
fiscal consequences to federal or provincial governments.
In closing, this study also provides a cautionary tale for policy analysts.
The costs of neglecting our public infrastructure are not zero. As noted by
Infrastructure Canada, allowing our public infrastructure to continue to decay
imposes costs at least equal but opposite to the benefits estimated in this study.
The competitiveness of private businesses in Canada is tied to the quality of
our public assets, so a significant and sustained public infrastructure spending
initiative is required if households and businesses are to continue to enjoy the
high standard of living provided by our public infrastructure system.
34 | THE ECONOMIC BENEFITS OF PUBLIC INFRASTRUCTURE SPENDING IN CANADA
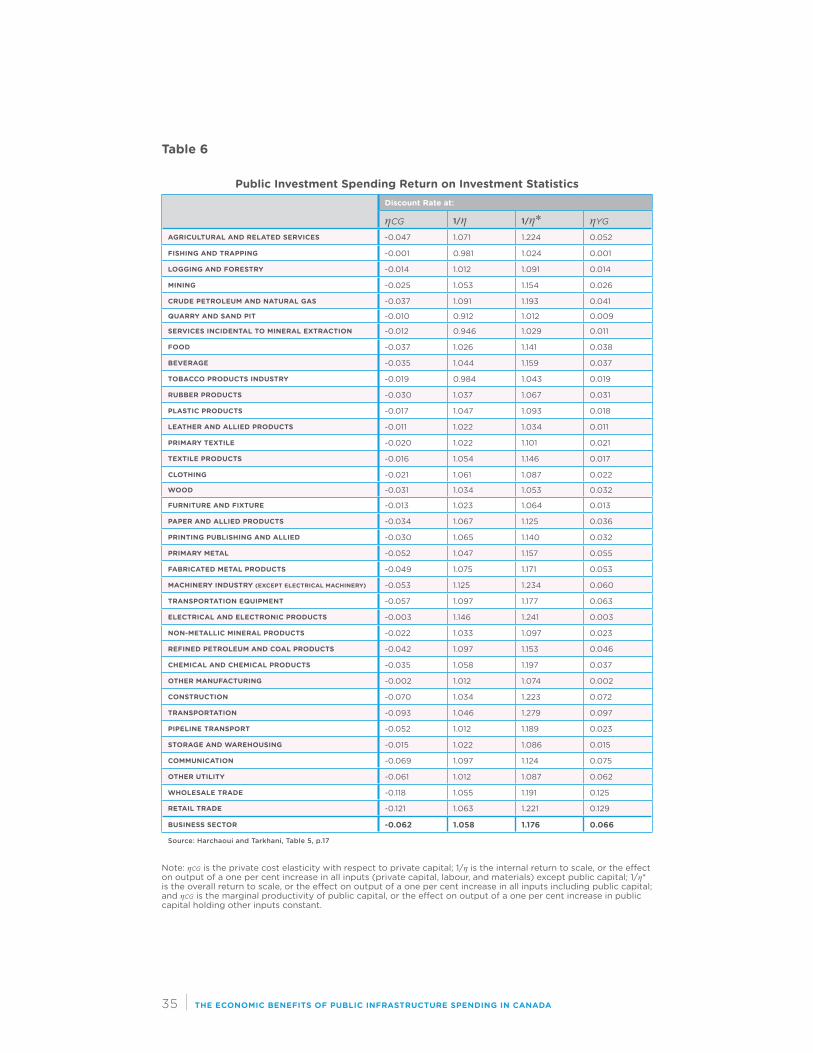
APPENDIX A: CONTRIBUTION OF PUBLIC CAPITAL AT THE INDUSTRY LEVEL
The following table can be found in Harchaoui and Tarkhani’s paper (Table
5, p.17), and provides a summary of their empirical results. The industry cost
elasticities (ηcg) indicate the percentage change in the total private cost of
producing a given level of output that is associated with a one per cent change
in the value of the public capital services, and were used to adjust industry
costs in the C4SE’s provincial economic modelling system. The impact on costs
is largest for the transportation and wholesale and retail trade sectors. The
weighted average aggregate impact on business costs is to lower them by 0.06
per cent for every one per cent increase in public capital.
35 | THE ECONOMIC BENEFITS OF PUBLIC INFRASTRUCTURE SPENDING IN CANADA
Table 6
Public Investment Spending Return on Investment StatisticsDiscount Rate at:
ηcg 1/η 1/η* ηygAGRICULTURAL AND RELATED SERVICES -0.047 1.071 1.224 0.052
FISHING AND TRAPPING -0.001 0.981 1.024 0.001
LOGGING AND FORESTRY -0.014 1.012 1.091 0.014
MINING -0.025 1.053 1.154 0.026
CRUDE PETROLEUM AND NATURAL GAS -0.037 1.091 1.193 0.041
QUARRY AND SAND PIT -0.010 0.912 1.012 0.009
SERVICES INCIDENTAL TO MINERAL EXTRACTION -0.012 0.946 1.029 0.011
FOOD -0.037 1.026 1.141 0.038
BEVERAGE -0.035 1.044 1.159 0.037
TOBACCO PRODUCTS INDUSTRY -0.019 0.984 1.043 0.019
RUBBER PRODUCTS -0.030 1.037 1.067 0.031
PLASTIC PRODUCTS -0.017 1.047 1.093 0.018
LEATHER AND ALLIED PRODUCTS -0.011 1.022 1.034 0.011
PRIMARY TEXTILE -0.020 1.022 1.101 0.021
TEXTILE PRODUCTS -0.016 1.054 1.146 0.017
CLOTHING -0.021 1.061 1.087 0.022
WOOD -0.031 1.034 1.053 0.032
FURNITURE AND FIXTURE -0.013 1.023 1.064 0.013
PAPER AND ALLIED PRODUCTS -0.034 1.067 1.125 0.036
PRINTING PUBLISHING AND ALLIED -0.030 1.065 1.140 0.032
PRIMARY METAL -0.052 1.047 1.157 0.055
FABRICATED METAL PRODUCTS -0.049 1.075 1.171 0.053
MACHINERY INDUSTRY (EXCEPT ELECTRICAL MACHINERY) -0.053 1.125 1.234 0.060
TRANSPORTATION EQUIPMENT -0.057 1.097 1.177 0.063
ELECTRICAL AND ELECTRONIC PRODUCTS -0.003 1.146 1.241 0.003
NON-METALLIC MINERAL PRODUCTS -0.022 1.033 1.097 0.023
REFINED PETROLEUM AND COAL PRODUCTS -0.042 1.097 1.153 0.046
CHEMICAL AND CHEMICAL PRODUCTS -0.035 1.058 1.197 0.037
OTHER MANUFACTURING -0.002 1.012 1.074 0.002
CONSTRUCTION -0.070 1.034 1.223 0.072
TRANSPORTATION -0.093 1.046 1.279 0.097
PIPELINE TRANSPORT -0.052 1.012 1.189 0.023
STORAGE AND WAREHOUSING -0.015 1.022 1.086 0.015
COMMUNICATION -0.069 1.097 1.124 0.075
OTHER UTILITY -0.061 1.012 1.087 0.062
WHOLESALE TRADE -0.118 1.055 1.191 0.125
RETAIL TRADE -0.121 1.063 1.221 0.129
BUSINESS SECTOR -0 .062 1 .058 1 .176 0 .066
Source: Harchaoui and Tarkhani, Table 5, p .17
Note: ηcg is the private cost elasticity with respect to private capital; 1/η is the internal return to scale, or the effect on output of a one per cent increase in all inputs (private capital, labour, and materials) except public capital; 1/η* is the overall return to scale, or the effect on output of a one per cent increase in all inputs including public capital; and ηcg is the marginal productivity of public capital, or the effect on output of a one per cent increase in public capital holding other inputs constant.
36 | THE ECONOMIC BENEFITS OF PUBLIC INFRASTRUCTURE SPENDING IN CANADA
APPENDIX B: C4SE PROVINCIAL ECONOMIC MODELLING SYSTEM
The C4SE’s provincial economic modelling system is a dynamic, multi-sector,
regional economic model of the country. It includes a bottom-up set of
macroeconomic models for the provinces, the territories, and the rest of the
world. The national model links economic activity in one region with activity in
the other regions through trade. The provincial models include detailed income
and expenditure categories and demographic and labour market information.
The purpose of the modelling system is to produce medium- to long-term
projections of the provincial economies and conduct simulation studies that
require industry and demographic detail.
This modelling system consists of a set of provincial and territorial
macroeconomic models that are linked through trade, financial markets,
and interprovincial migration. The impact on the supply chain—in terms of
output and employment—is fully captured by the multi-sector model, which
incorporates the purchasing patterns from the current input–output tables. But,
unlike an input–output model, a dynamic macroeconomic model also considers
the impact that the change in economic activity has on suppliers’ investment
decisions.
The model produces impacts on employment, labour income, value-added
output, productivity, investment, and exports for at least 14 industry sectors
(see list below). It also produces the impacts on government revenue by level of
government and source of revenue. The dynamic nature of the model, however,
makes it more challenging to develop a single summary measure that provides
a “rule-of-thumb” result. The need for such a measure is satisfied by generating
an average impact over several years of the simulation or, when appropriate, a
return on investment statistic.
37 | THE ECONOMIC BENEFITS OF PUBLIC INFRASTRUCTURE SPENDING IN CANADA
C4SE Model—Industry Sectors
The model incorporates partial policy responses to economic developments.
In terms of monetary policy, the Bank of Canada adjusts interest rates using
a Taylor Rule reaction function that responds to inflation relative to its target
rate and the unemployment rate relative to the natural rate of unemployment.
The exchange rate reacts to Canada–U.S. interest rate differentials and changes
in the purchasing power parity value of the dollar. In terms of fiscal policy,
government spending is, for many categories, a function of population, while
government revenue reacts to changes in the tax base.
The following sections provide the reader with more information on the
structure of the individual provincial models and the national model that unites
the provincial and territorial models.
Provincial Models
The provincial and territorial models are very similar in structure—the parameters
in each model differ to reflect differences in the economic experience of each
region.
The provincial models are similar in nature to a general equilibrium model,
but full product and factor substitution is not implemented. At present,
substitution is restricted to the energy products and value-added. For purposes
of manageability, there is only one wage rate and one set of cost of capital
measures—construction and equipment—in the model. Changes in these
measures of labour and capital costs cause labour and capital intensities to
change across all sectors of the economy.
Agriculture
Other Primary (detail varies by province)
Manufacturing (detail varies by province)
Construction
Utilities
Transportation & Warehousing
Wholesale & Retail Trade
Finance, Insurance, & Real Estate
Professional, Scientific, & Management Services
Accommodation & Food
Health Services
Other Services
Education Services
Government Services

38 | THE ECONOMIC BENEFITS OF PUBLIC INFRASTRUCTURE SPENDING IN CANADA
The model’s economy is organized into four broad sectors. Firms employ
capital and labour to produce a profit-maximizing output under a Cobb-
Douglas constant-returns-to-scale technology. Households consume the
domestic and foreign products and supply labour under the assumption of
utility maximization. Governments purchase the domestic and foreign products
and produce output. Foreigners purchase the domestic product and supply the
foreign product.
There are two main markets in the model. These markets correspond to the
domestic and foreign products and the labour market. Each of these markets is
concerned with the determination of demands, supplies, and prices. Like most
subnational models, the provincial models assume that most prices are set in
national markets. The presence of the national model in the system means that
interest rates, exchange rates, and the price of some goods and services are
affected by changes in economic activity in each province.
In subnational economies, the movement of labour is a key factor in the
adjustment of the local economy to changes in economic conditions. The
C4SE’s model allows net migration—and therefore the total population—to
adjust over time to reflect changes in economic conditions. If the economy and
employment is growing, then the demand for labour rises and net migration
rises. This feature is an important consideration when examining economic
impacts over one or more decades.
National Model
The design of the national model is what makes the C4SE’s system unique. The
national block adds up the economic activity across the country and uses this
information to help determine prices, interest rates, exchange rates, and the
rest-of-country external demand for goods and services—all factors that are
exogenous to the other provincial modelling systems.
To see why this is important, consider an increase in one province’s economy,
which raises that province’s demand for imports. In this system, each of the
other provinces sees an increase in demand for their exports to that province,
which, in turn, raises their own economies. The increase in economic activity will
put upward pressure on prices, interest rates, and exchange rates. The entire
national economy therefore adjusts over time to the initial shock.
39 | THE ECONOMIC BENEFITS OF PUBLIC INFRASTRUCTURE SPENDING IN CANADA
Summary of C4SE Winter 2014–15 Outlook
The provincial economic modelling system models and forecasts that were used
in this analysis were released in January 2015. The outlook is summarized in the
following two tables. The outlook incorporates lower prices for oil and other
commodities plus weaker economic growth for Canada’s key trading partners.
The slump in oil prices slows economic growth in Alberta, Saskatchewan,
and Newfoundland and Labrador this year. Economic growth is expected to
pick up again for the last few years of the decade, but then slows—driven by
demographic changes—over the long term.
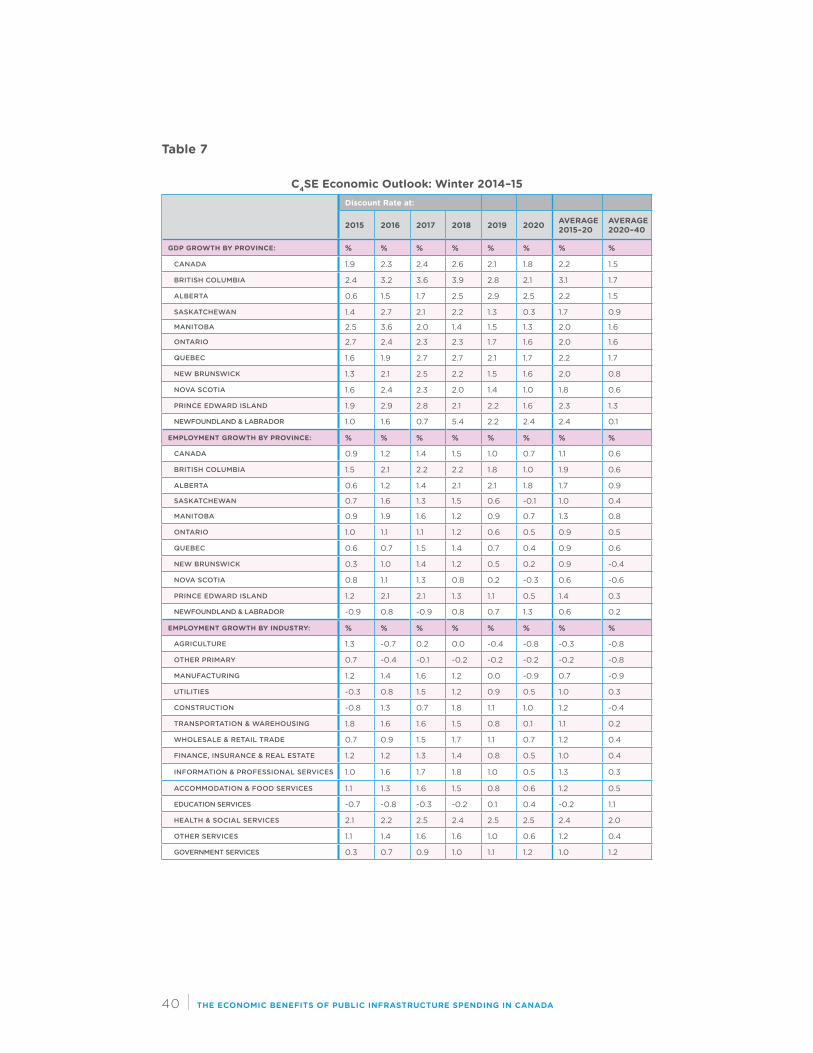
40 | THE ECONOMIC BENEFITS OF PUBLIC INFRASTRUCTURE SPENDING IN CANADA
Table 7
C4SE Economic Outlook: Winter 2014–15Discount Rate at:
2015 2016 2017 2018 2019 2020 AVERAGE 2015–20
AVERAGE 2020–40
GDP GROWTH BY PROVINCE: % % % % % % % %
CANADA 1.9 2.3 2.4 2.6 2.1 1.8 2.2 1.5
BRITISH COLUMBIA 2.4 3.2 3.6 3.9 2.8 2.1 3.1 1.7
ALBERTA 0.6 1.5 1.7 2.5 2.9 2.5 2.2 1.5
SASKATCHEWAN 1.4 2.7 2.1 2.2 1.3 0.3 1.7 0.9
MANITOBA 2.5 3.6 2.0 1.4 1.5 1.3 2.0 1.6
ONTARIO 2.7 2.4 2.3 2.3 1.7 1.6 2.0 1.6
QUEBEC 1.6 1.9 2.7 2.7 2.1 1.7 2.2 1.7
NEW BRUNSWICK 1.3 2.1 2.5 2.2 1.5 1.6 2.0 0.8
NOVA SCOTIA 1.6 2.4 2.3 2.0 1.4 1.0 1.8 0.6
PRINCE EDWARD ISLAND 1.9 2.9 2.8 2.1 2.2 1.6 2.3 1.3
NEWFOUNDLAND & LABRADOR 1.0 1.6 0.7 5.4 2.2 2.4 2.4 0.1
EMPLOYMENT GROWTH BY PROVINCE: % % % % % % % %
CANADA 0.9 1.2 1.4 1.5 1.0 0.7 1.1 0.6
BRITISH COLUMBIA 1.5 2.1 2.2 2.2 1.8 1.0 1.9 0.6
ALBERTA 0.6 1.2 1.4 2.1 2.1 1.8 1.7 0.9
SASKATCHEWAN 0.7 1.6 1.3 1.5 0.6 -0.1 1.0 0.4
MANITOBA 0.9 1.9 1.6 1.2 0.9 0.7 1.3 0.8
ONTARIO 1.0 1.1 1.1 1.2 0.6 0.5 0.9 0.5
QUEBEC 0.6 0.7 1.5 1.4 0.7 0.4 0.9 0.6
NEW BRUNSWICK 0.3 1.0 1.4 1.2 0.5 0.2 0.9 -0.4
NOVA SCOTIA 0.8 1.1 1.3 0.8 0.2 -0.3 0.6 -0.6
PRINCE EDWARD ISLAND 1.2 2.1 2.1 1.3 1.1 0.5 1.4 0.3
NEWFOUNDLAND & LABRADOR -0.9 0.8 -0.9 0.8 0.7 1.3 0.6 0.2
EMPLOYMENT GROWTH BY INDUSTRY: % % % % % % % %
AGRICULTURE 1.3 -0.7 0.2 0.0 -0.4 -0.8 -0.3 -0.8
OTHER PRIMARY 0.7 -0.4 -0.1 -0.2 -0.2 -0.2 -0.2 -0.8
MANUFACTURING 1.2 1.4 1.6 1.2 0.0 -0.9 0.7 -0.9
UTILITIES -0.3 0.8 1.5 1.2 0.9 0.5 1.0 0.3
CONSTRUCTION -0.8 1.3 0.7 1.8 1.1 1.0 1.2 -0.4
TRANSPORTATION & WAREHOUSING 1.8 1.6 1.6 1.5 0.8 0.1 1.1 0.2
WHOLESALE & RETAIL TRADE 0.7 0.9 1.5 1.7 1.1 0.7 1.2 0.4
FINANCE, INSURANCE & REAL ESTATE 1.2 1.2 1.3 1.4 0.8 0.5 1.0 0.4
INFORMATION & PROFESSIONAL SERVICES 1.0 1.6 1.7 1.8 1.0 0.5 1.3 0.3
ACCOMMODATION & FOOD SERVICES 1.1 1.3 1.6 1.5 0.8 0.6 1.2 0.5
EDUCATION SERVICES -0.7 -0.8 -0.3 -0.2 0.1 0.4 -0.2 1.1
HEALTH & SOCIAL SERVICES 2.1 2.2 2.5 2.4 2.5 2.5 2.4 2.0
OTHER SERVICES 1.1 1.4 1.6 1.6 1.0 0.6 1.2 0.4
GOVERNMENT SERVICES 0.3 0.7 0.9 1.0 1.1 1.2 1.0 1.2
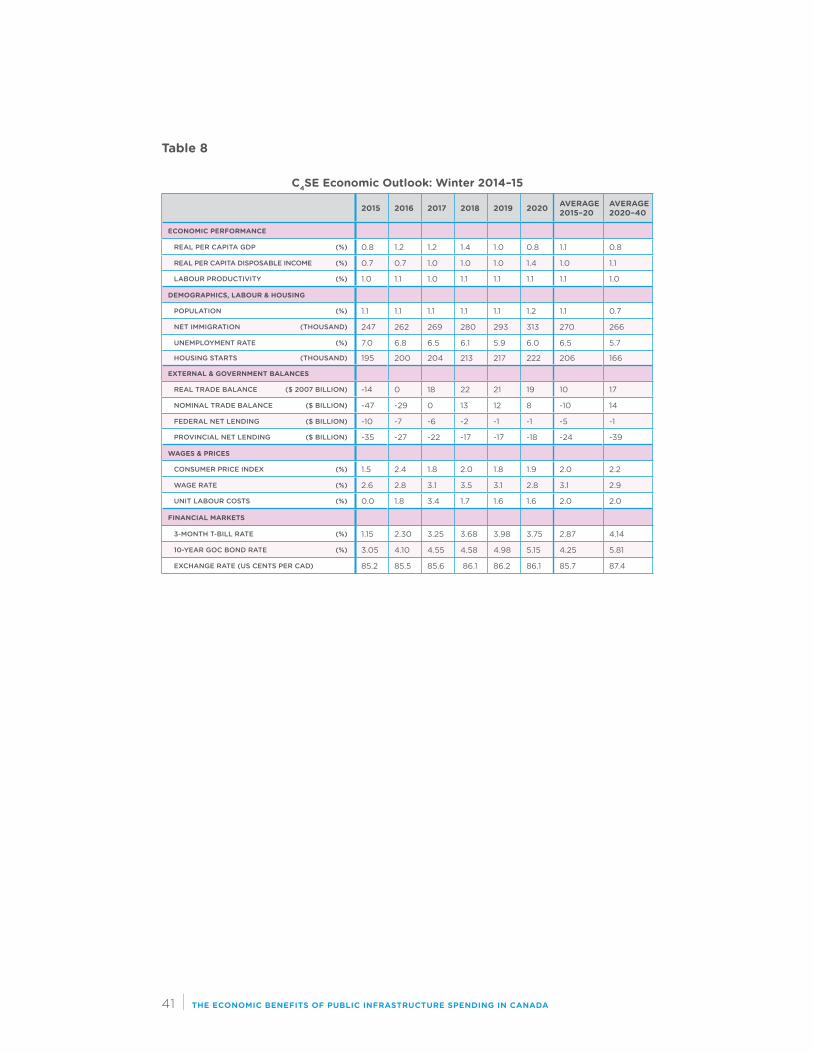
41 | THE ECONOMIC BENEFITS OF PUBLIC INFRASTRUCTURE SPENDING IN CANADA
Table 8
C4SE Economic Outlook: Winter 2014–15
2015 2016 2017 2018 2019 2020 AVERAGE 2015–20
AVERAGE 2020–40
ECONOMIC PERFORMANCE
REAL PER CAPITA GDP (%) 0.8 1.2 1.2 1.4 1.0 0.8 1.1 0.8
REAL PER CAPITA DISPOSABLE INCOME (%) 0.7 0.7 1.0 1.0 1.0 1.4 1.0 1.1
LABOUR PRODUCTIVITY (%) 1.0 1.1 1.0 1.1 1.1 1.1 1.1 1.0
DEMOGRAPHICS, LABOUR & HOUSING
POPULATION (%) 1.1 1.1 1.1 1.1 1.1 1.2 1.1 0.7
NET IMMIGRATION (THOUSAND) 247 262 269 280 293 313 270 266
UNEMPLOYMENT RATE (%) 7.0 6.8 6.5 6.1 5.9 6.0 6.5 5.7
HOUSING STARTS (THOUSAND) 195 200 204 213 217 222 206 166
EXTERNAL & GOVERNMENT BALANCES
REAL TRADE BALANCE ($ 2007 BILLION) -14 0 18 22 21 19 10 17
NOMINAL TRADE BALANCE ($ BILLION) -47 -29 0 13 12 8 -10 14
FEDERAL NET LENDING ($ BILLION) -10 -7 -6 -2 -1 -1 -5 -1
PROVINCIAL NET LENDING ($ BILLION) -35 -27 -22 -17 -17 -18 -24 -39
WAGES & PRICES
CONSUMER PRICE INDEX (%) 1.5 2.4 1.8 2.0 1.8 1.9 2.0 2.2
WAGE RATE (%) 2.6 2.8 3.1 3.5 3.1 2.8 3.1 2.9
UNIT LABOUR COSTS (%) 0.0 1.8 3.4 1.7 1.6 1.6 2.0 2.0
FINANCIAL MARKETS
3-MONTH T-BILL RATE (%) 1.15 2.30 3.25 3.68 3.98 3.75 2.87 4.14
10-YEAR GOC BOND RATE (%) 3.05 4.10 4.55 4.58 4.98 5.15 4.25 5.81
EXCHANGE RATE (US CENTS PER CAD) 85.2 85.5 85.6 86.1 86.2 86.1 85.7 87.4

42 | THE ECONOMIC BENEFITS OF PUBLIC INFRASTRUCTURE SPENDING IN CANADA
APPENDIX C: SCENARIO RESULTS
A detailed summary of the economic and fiscal impacts for each public
infrastructure spending scenario (zero, half and full benefits for selected
time periods) compared to the baseline results are available upon request.
Please contact the research department of the Broadbent Institute at
43 | THE ECONOMIC BENEFITS OF PUBLIC INFRASTRUCTURE SPENDING IN CANADA
REFERENCESAschauer, D.A. 1989. “Is Public Expenditure Productive?” Journal of Monetary
Economics 23(2): 177–200.
Baldwin, J., W. Gu, and R. Macdonald. 2010. “Integrated Productivity Accounts: Contributions to the Measurement of Capital.” The Canadian Productivity Review Catalogue no. 15-206-X, no. 027, Economic Analysis Division. Ottawa: Statistics Canada.
Delcan, iTRANS, and ADEC. 2006. “The Cost of Urban Congestion in Canada.” Ottawa: Transport Canada.
Félio, G. 2012. “Canadian Infrastructure Report Card—Volume 1: 2012 Municipal Roads and Water Systems.” Infrastructure Canada. www.canadianinfrastructure.ca.
Harchaoui, T.M., and F. Tarkhani. 2003. “Public Capital and its Contribution to the Productivity Performance of the Canadian Business Sector.” Economic Analysis Research Paper Series Catalogue no. 11F0027MIE, no. 017, Micro-Economic Analysis Division. Ottawa: Statistics Canada.
Infrastructure Canada. 2011. “Building Canada Plan.” Ottawa: Infrastructure Canada. Retrieved June 9, 2015 from http://www.infrastructure.gc.ca/prog/doc/booklet-livret03-eng.html.
Lemire, P., and V. Gaudreault. 2006. “The Age of Public Infrastructure in Canada.” Analysis in Brief Catalogue no. 11-621-MIE, no. 035, Investment and Capital Stock Division. Ottawa: Statistics Canada.
Nadiri, M.I., and T.P. Mamuneas. 1994. “Infrastructure and Public R&D Investments, and the Growth of Factor Productivity in US Manufacturing Industries.” NBER Working Paper Series, W.P. #4845.
Wylie, P.J. 1996. “Infrastructure and Economic Growth, 1946–1991.” Canadian Journal of Economics, XXIX, Special Issue, S350-S355.


![US Infrastructure Industry Spending Trends - 30th April 09[1]](https://img.dokumen.tips/doc/110x75/577ce43a1a28abf1038deb87/us-infrastructure-industry-spending-trends-30th-april-091.jpg)


