Embed Size (px)
Citation preview

British Journal of Nutrition (1987), 58, 369-381 369
The diets of pregnant and post-pregnant women in different social groups in London and Edinburgh :
energy, protein, fat and fibre
BY CLAIRE SCHOFIELD, ERICA WHEELER* A N D J U D Y STEWART Department of Human Nutrition, London School of Hygiene and Tropical Medicine,
Keppel Street, London WCIE 7HT
(Received 12 February 1987 - Accepted 24 July 1987)
1 . Dietary records were obtained twice in pregnancy and once post-partum from 265 women from all social
2. The London women always had higher mean energy, protein, fat and fibre intakes. Significant between-
3. Some between-social classes differences occurred, but were not consistently significant. 4. All mean energy and fibre intakes were lower, and protein and fat intakes were higher, than current
5. Of lactating women 15 % claimed to be dieting. 6. The percentage dietary energy derived from fat varied from 36 (in a dieting group) to 42.
classes in London and Edinburgh.
region differences emerged.
recommendations.
A number of studies of diet in pregnancy have been made in the UK (Smithells et al. 1977; Campbell-Brown, 1982; Doyle et al. 1982; Pickard, 1983), but the interaction of regional and social-class differences in intakes has not been explored. The only source of information about dietary differences between the North and South of the UK, other than anecdote, is the National Food Survey (Ministry of Agriculture Fisheries and Food (MAFF), 1985). This monitors household consumption rather than individual intake, and aggregates rural and urban information for Scotland.
Those workers who have examined nutrient intakes in various combinations of social classes have reported a distinct ‘social-class gradient’ (Thomson, 1959; Smithells et al. 1977; Whitehead et al. 1981; Doyle et al. 1982; Abraham et al. 1985). Birth weights in the UK are generally lower in social classes 5 + 6 (Office of Population Censuses and Surveys (OPCS), 1985), and the perinatal death rate is higher (OPCS, 1984). It is pertinent to inquire whether differences occur between the diets of pregnant and post-partum women in the North and South of the UK, and whether the effects of the ‘social-class gradient’ are similar in both regions. Between 1983 and 1985, a survey of the diets and food habits of pregnant and post-partum women was conducted simultaneously in London and Edinburgh; the present paper reports their energy, protein, fat and dietary fibre intakes, and compares them with some current recommendations (Department of Health and Social Security (DHSS), 1979 ; National Advisory Committee on Nutrition Education (NACNE), 1983). Intakes of other nutrients will be reported subsequently.
METHODS The sample
The sample was drawn from white women, aged 17-36 years, in the first trimester of pregnancy, attending the antenatal clinics of St George’s Hospital, London, The Simpson Memorial Maternity Pavilion, Edinburgh and Sighthili Health Centre, Edinburgh. Subjects
* For reprints
Dow
nloaded from https://w
ww
.cambridge.org/core . IP address: 65.21.228.167 , on 20 M
ar 2022 at 04:47:57 , subject to the Cambridge Core term
s of use, available at https://ww
w.cam
bridge.org/core/terms . https://doi.org/10.1079/BJN
19870106
370 C. SCHOFIELD, E. WHEELER A N D J. STEWART
Table 1. Design of study of diet in pregnancy
No. of completed diet records
Round Group London Edinburgh Period Process Location
- - < 14 weeks pregnant _ -
1 1 l a 53 85 < 14 weeks pregnant (trimester 1)
I Ib 84 38 15-28 weeks (trimester 2)
2 2 110 107 3 2 4 0 weeks (trimester 3)
3 3L 22 33 > 2 months post- partum lactating
3 3NL 102 77 > 2 months post- partum not lactating
Introductory letter, Ante-natal clinic recruitment questionnaire
Round I visit booked
2 d food diary Own home
3 d weighed Own home inventory
3 d food diary Own home
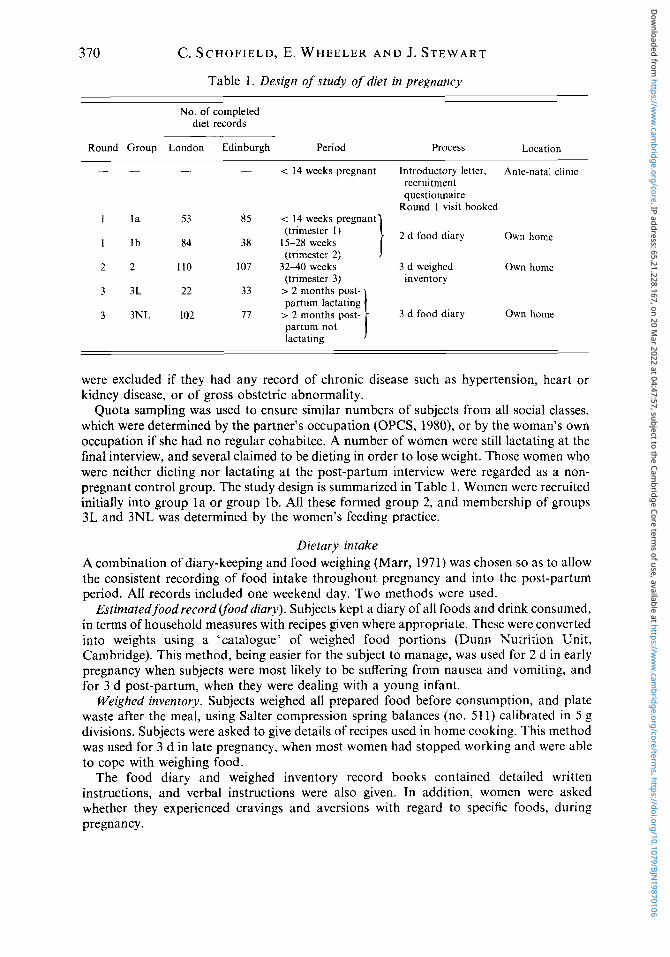
were excluded if they had any record of chronic disease such as hypertension, heart or kidney disease, or of gross obstetric abnormality.
Quota sampling was used to ensure similar numbers of subjects from all social classes, which were determined by the partner’s occupation (OPCS, 1980), or by the woman’s own occupation if she had no regular cohabitee. A number of women were still lactating at the final interview, and several claimed to be dieting in order to lose weight. Those women who were neither dieting nor lactating at the post-partum interview were regarded as a non- pregnant control group. The study design is summarized in Table 1. Women were recruited initially into group la or group Ib. All these formed group 2, and membership of groups 3L and 3NL was determined by the women’s feeding practice.
Dietary intake A combination of diary-keeping and food weighing (Marr, 1971) was chosen so as to allow the consistent recording of food intake throughout pregnancy and into the post-partum period. All records included one weekend day. Two methods were used.
Estimated food record (food diary). Subjects kept a diary of all foods and drink consumed, in terms of household measures with recipes given where appropriate. These were converted into weights using a ‘catalogue’ of weighed food portions (Dunn Nutrition Unit, Cambridge). This method, being easier for the subject to manage, was used for 2 d in early pregnancy when subjects were most likely to be suffering from nausea and vomiting, and for 3 d post-partum, when they were dealing with a young infant.
Weighed inventory. Subjects weighed all prepared food before consumption, and plate waste after the meal, using Salter compression spring balances (no. 51 1) calibrated in 5 g divisions. Subjects were asked to give details of recipes used in home cooking. This method was used for 3 d in late pregnancy, when most women had stopped working and were able to cope with weighing food.
The food diary and weighed inventory record books contained detailed written instructions, and verbal instructions were also given. In addition, women were asked whether they experienced cravings and aversions with regard to specific foods, during pregnancy.
Dow
nloaded from https://w
ww
.cambridge.org/core . IP address: 65.21.228.167 , on 20 M
ar 2022 at 04:47:57 , subject to the Cambridge Core term
s of use, available at https://ww
w.cam
bridge.org/core/terms . https://doi.org/10.1079/BJN
19870106

Diets of pregnant and post-pregnant women
Table 2. Distribution of the subjects by social class
371
~- _ _ _ ~- ~ ~ _ _ London Edinburgh
~~ ~~ .. ~
Social class* n % n YQ n % n YQ
1 2 35 19
21 20 14} 41 34 26 20
35 I5 41 22) 30 12 52 29 31
30 25 13 14 11
8 - 127 - - - 138 ~~ .- All
- * Non manual: 1, professional; 2, management and technical; 3, clerical and minor supervisory; manual: 4,
skilled manual; 5, semi-skilled manual; 6, unskilled manual (Office of Population Censuses and Surveys, 1980).
Validation tests were devised to ensure the comparability of 2 d and 3 d diaries with each other and the weighed inventories. Two approaches were used :
Comparison of 2 and 3 d estimated food records. Correlation coefficients were calculated between 2 and 3 d means for energy and nutrient intakes in round 3 . The days were aggregated in four ways : as the mean of days 1 + 2 , 2 + 3 , 3 + 1 and of a randomly selected pair of days. These four mean values were each regressed on the 3 d mean. The correlation coefficients ranged from 0.91 to 097. It was concluded that comparison between 2 and 3 d records was acceptable for this sample, and that valid comparisons between rounds 1 and 3 could therefore be made.
Comparison of estimated food record and weighed inventory. In the third trimester (round 2) , twenty (1 5 YO) subjects provided estimated food records instead of weighed inventories. There was no social class or age bias in this subgroup. For each location, the mean intakes by the two methods were compared by Student’s t test for independent samples: no statistically significant differences were detected. It was concluded that the weighed inventory and estimated food record methods were producing comparable results, and that valid comparisons between round 2 and rounds 1 and 3 could be made.
Statistical analysis The weighed food intake record books and food diaries were coded using food tables (Paul & Southgate, 1978 ; Paul et al. 1980). Computation of energy and nutrient intakes was done at the MAFF, using purpose-written dietary-survey software. Statistical methods included the use of logarithmic transformations of nutrient intakes with skewed distributions, Student’s t test on the means of raw and transformed variables, and the Z test of difference between sample proportions (Snedecor & Cochran, 1967).
The study was approved by the ethical committees of St George’s Hospital, London, and the Royal Infirmary, Edinburgh.
RESULTS
Sample and records Post-recruitment drop-out rates were 4 YO (London) and 9 % (Edinburgh). Incomplete records were omitted. Values were aggregated into three social groups as shown in Table 2, to allow comparison of extremes of the social range, and across the social gradient. The study continued for 20 months and the average number of subjects participating in each
Dow
nloaded from https://w
ww
.cambridge.org/core . IP address: 65.21.228.167 , on 20 M
ar 2022 at 04:47:57 , subject to the Cambridge Core term
s of use, available at https://ww
w.cam
bridge.org/core/terms . https://doi.org/10.1079/BJN
19870106
Tab
le 3
. Dai
ly e
nerg
y in
take
s of
preg
nant
and
pos
t-par
tum
wom
en in
Lon
don
and
Edin
burg
h
(Mea
n va
lues
and
sta
ndar
d de
viat
ions
for
die
ters
and
non
-die
ters
agg
rega
ted
(but
see
Tab
le 4
))
Lond
on
Edin
burg
h
Mea
n M
ean
SD
%
SD
Rou
nd
Gro
up*
Trim
este
r So
cial
cla
ss?
MJ
kcal
M
J n
RD
AS
MJ
kcal
M
J n
1 la
1
lb
2 2
3 3L
3
3NL
1
la
1 la
1
la
1 Ib
1
Ib
1 lb
2
2 2
2 2
2 3
3L
3 3L
3
3L
3 3N
L 3
3NL
3 3N
L
1 2 3 Po
st-p
artu
m
1 2 3
Post
-par
tum
All
All
All
All
All
1 +2
3
+4
5+
6 1 +
2
3+4
5+6
1 +2
3
+4
5
f6
1 f
2
3+4
5+
6
1+
2
3+
4
5f
6
8,171
1 9.
20
9.09
s 79
2 7.
825
8.4 1
79
5 8.
5 1
9.41
5 90
7 9.
16
9.54
5 86
4 9.
624
782
8.1 1
6.
99
7.94
7.
455
8.73
1953
1.
87
2199
2.
26
2172
2.
27
1894
2.
04
1868
2.
59
2010
1.
96
1899
1.
68
2035
2.
48
2250
2.
04
2167
2.
29
2190
2.
62
2281
2.
28
2066
1-
90
2299
3.
02
1868
2.
03
1938
2.
09
1898
2.
26
1781
2.
39
2087
3.
51
1670
-
46
81
91
92
110
90
27
69
97
87
15
-
25
-
6-
32
-
46
-
13
-
40
-
55
-
15
-
13
-
13
-
1-
33
-
49
-
15
-
_-
L, l
acta
ting;
NL
, non
-lac
tatin
g; R
DA
, rec
omm
ende
d da
ily a
mou
nts.
*
For
deta
ils, s
ee T
able
I.
t O
ffice
of
Popu
latio
n C
ensu
ses
and
Surv
eys (
1980
). 1:
DeD
artm
ent o
f H
ealth
and
Soc
ial S
ecur
ity (1
979)
.
%
RD
A#
8.49
20
28
8.62
20
59
8.00
19
13
7.74
18
50
6.58
15
73
8.54
20
42
8.82
21
09
8.05
19
24
8.13
19
44
8.30
19
84
9.61
22
96
8.22
19
65
8.10
19
37
7.51
17
96
8.10
19
36
7.05
16
84
7.23
17
28
6.89
16
44
6.23
14
90
6.77
16
17
2.24
87
2.
56
36
2.15
10
7 2.
64
33
2.40
77
2.
08
33
2.30
28
2.
31
26
1.47
I1
2.
59
15
3.12
10
1.
72
44
2.22
36
2.
59
27
291
21
1.47
8
2.57
4
2.04
20
2.
03
31
2.94
26
Mea
n va
lues
wer
e si
gnifi
cant
ly d
iffer
ent (P < 0
.05)
as
follo
ws:
§ b
etw
een
Lond
on a
nd E
dinb
urgh
, in
the
row
indi
cate
d; //
betw
een
grou
ps l
a an
d Ib
in th
e co
lum
n an
d fo
r the
soc
ial c
lass
indi
cate
d.
Dow
nloaded from https://w
ww
.cambridge.org/core . IP address: 65.21.228.167 , on 20 M
ar 2022 at 04:47:57 , subject to the Cambridge Core term
s of use, available at https://ww
w.cam
bridge.org/core/terms . https://doi.org/10.1079/BJN
19870106
Diets of pregnant and post-pregnant women 373
Table 4. Daily post-partum energy, protein and fat intakes of ' dieting' and ' non-dieting ' women in London and Edinburgh (Mean values and standard deviations)
Energy MJ (kcal) Protein (9) Fat (g)
n Mean SD Mean SD Mean SD from fat % Energy _ _ ~
London Lactating:
Dieting
Non-dieting
Non-lactating : Dieting
Non-dieting
Edinburgh Lactating:
Dieting
Non-dieting
Non-lactating : Dieting
Non-dieting
6
21
20
77
3
30
21
56
6.36* (1521) 8.37
(2001)
(1447) 6.05*
8.24t (1 970)
6.83 (1633) 7.83
(1871)
6.48 (1 548) 6.62
(1 582)
56.7
72.6
56.1*
68.4
66.4
69.2
62.1
58.8
19.8 602*
13.0 88.9
13.2 60.8.
18.7 906t
4.3 67.7
31.0 83.7
17.6 74.0
209 72.9
28.0 36
18.2 40
21.8 38
32.7 41
19.0 37
34.5 40
33.2 43
27.4 42
* Differences between dieting and non-dieting means in the same subgroup were significant (P < 0.05). t Differences between London and Edinburgh means for the same subgroup were significant (P rc 0.05).
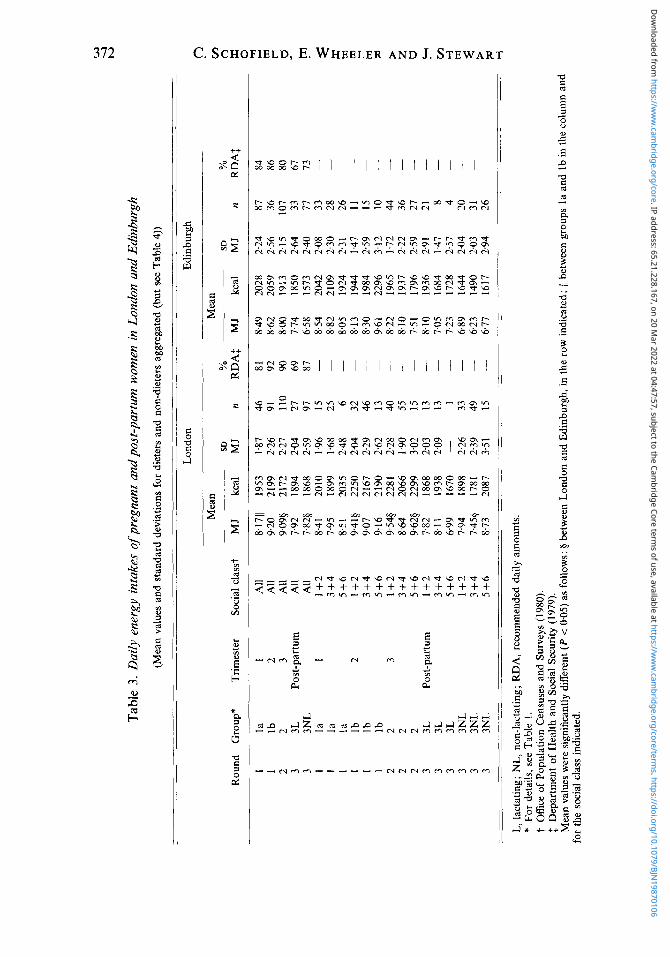
month was fifty-nine. The reported incidence of nausea during the first and second trimesters was 76 % in London and 51 YO in Edinburgh. In the third trimester, 24 and 8 YO respectively reported nausea. Post-partum, twenty-six women in London and twenty-four in Edinburgh claimed to be dieting in an attempt to lose weight.
During the first two trimesters, fifty-nine (55 YO) in Edinburgh and ninety-three (69 YO) in London reported cravings for specific foods, and sixty-two (58 YO) in Edinburgh and 116 (86 %) in London reported aversions. The between-region differences between the proportions in each case were statistically significant (Z test, P < 0.05). The proportions reporting nausea in round 1 were also significantly different.
Energy Table 3 shows mean energy intakes throughout the study. Few between-social class differences emerged. The lowest intake during pregnancy was that of social classes 5 + 6 in Edinburgh in the third trimester (7.5 MJ (1796 kcal)/d. In London it was social classes 3 +4 which consistently had the lowest energy intake, although these differences were not statistically significant. Post-partum, the only significant difference detected was in Edinburgh, between social classes 1 + 2 and 3 +4 (P < 0.01).
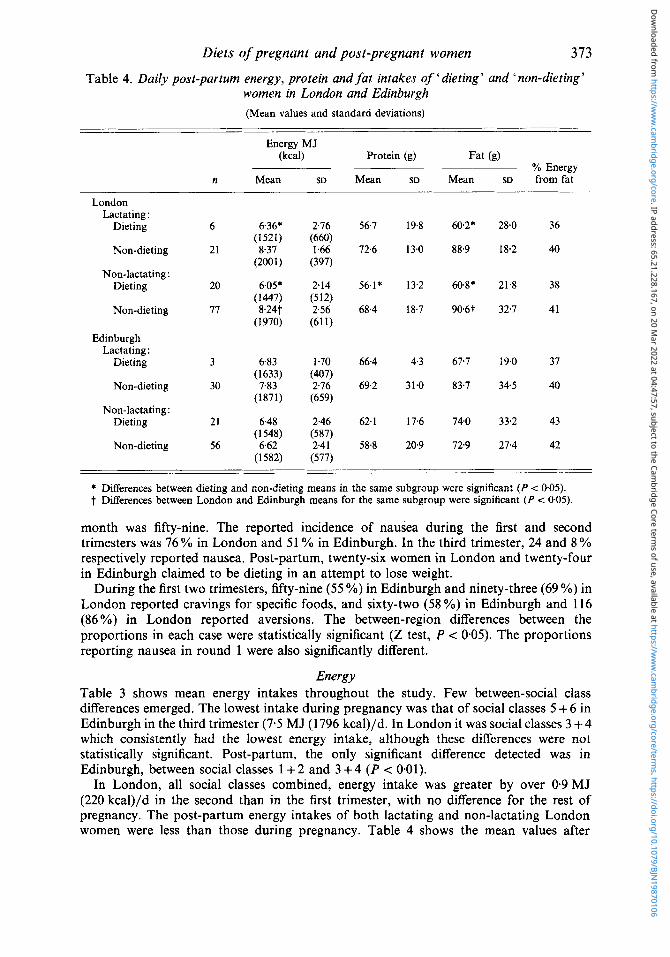
In London, all social classes combined, energy intake was greater by over 0.9 MJ (220 kcal)/d in the second than in the first trimester, with no difference for the rest of pregnancy. The post-partum energy intakes of both lactating and non-lactating London women were less than those during pregnancy. Table 4 shows the mean values after
Dow
nloaded from https://w
ww
.cambridge.org/core . IP address: 65.21.228.167 , on 20 M
ar 2022 at 04:47:57 , subject to the Cambridge Core term
s of use, available at https://ww
w.cam
bridge.org/core/terms . https://doi.org/10.1079/BJN
19870106

374 C. SCHOFIELD, E. WHEELER A N D J. STEWART
Table 5 . Daily protein intakes (gj of pregnant and post-pregnant women in London and Edinburgh
(Mean values and standard deviations for dieters and non-dieters aggregated (but see Table 4)) ~-
Round Group*
I l a I l b 2 2 3 3L 3 3NL 1 l a I l a I l a I l b 1 Ib I I b 2 2 2 2 2 2 3 3L 3 3L 3 3L 3 3NL 3 3NL 3 3NL
Trimester
1 2 3
Post-parturn
1
2
3
Post-partum
Social classt
All All All All All
1 + 2 3 + 4 5 + 6 1 + 2 3 f 4 5 + 6 1 f 2 3 f 4 5 + 6 1 + 2 3 + 4 5 f 6 1 + 2 3 + 4 5 f 6
London
Mean
69.6 78.8$ 77.6$ 69. I '65. I $ 72.5 69.1 64.5 84.5 763 73.3 83.6$ 72.25 81.2$ 70.5 68.1 63.4 67.9 63.7 68.6
~~
SD n
17.2 46 20.5 91 20.8 110 15.6 27 18.2 97 16.1 15 16.5 25 21.1 6 21.1 32 19.4 46 19.7 13 18.6 40 17.6 55 30.3 15 17.4 13 14.0 13
1 15.3 33 16.6 49 26.5 I S
- ~~
-
~ _ _ _ Mean
72.5 67.6 68.6 68.9 59.7 75.4 74.6 66.4 72.2 66.4 65.4 72.8 68.6 61.76 72.7 604 65.9 65.9 59.6 55.1
~- __
_- SD n
~~~ ._
22 7 87 19 6 36 177 107 29 1 33 I9 8 77 20 5 33 23 8 28 22 8 26 12 6 I 1 23 4 15 19 2 10 12 5 44 I9 8 36 I9 8 21 32 0 21 9 7 8
34 5 4 17 8 20 18 8 31 21 2 26
~ ____--
L, lactating; NL, non-lactating. * For details, see Table 1. t Office of Population Censuses and Surveys (1980). Mean values were significantly different (P < 0.05) as follows: 1 between London and Edinburgh, in the row
indicated; §from value for social classes 1 + 2 in the survey round indicated.
separation of the values for those subjects who claimed post-partum dieting. Statistical significance was achieved when mean intakes of the London dieting and non-dieting women were compared. The lowest mean energy intake in the survey was that of the London non- lactating, dieting group: 6.0 (SE 2.0) MJ (1447 (SE 512) kcalj/d. In Edinburgh, all social classes combined, mean intakes were slightly lower after the second trimester, and fell post- partum. Dieting, lactating subjects had a low mean intake, similar to that of non-lactating dieters.
In summary, the Londoners consumed significantly more energy than the Scots in all social classes in trimester 3, and for non-lactating women. The same regional difference existed, but was not significant, in the first two trimesters, and for lactating women. Significant between-region differences were shown by social classes 1 + 2, in trimesters 2 and 3, when the London intakes again were the higher,
Protein There were no significant between-social class differences in protein intake in London, but in Edinburgh during the third trimester and post-partum, social classes 1 + 2 consumed significantly more protein than classes 5 + 6. The mean London protein intake rose in the second trimester and remained high in the third (Table 5) . All the post-partum intakes were similar to that of the first trimester. In Edinburgh, mean protein intakes remained constant
Dow
nloaded from https://w
ww
.cambridge.org/core . IP address: 65.21.228.167 , on 20 M
ar 2022 at 04:47:57 , subject to the Cambridge Core term
s of use, available at https://ww
w.cam
bridge.org/core/terms . https://doi.org/10.1079/BJN
19870106

Diets of pregnant and post-pregnant women 375
Table 6. Daily fa t intakes (g) of pregnant and post-pregnant women in London and Edinburgh
(Mean values and standard deviations for dieters and non-dieters aggregated (but see Table 4))
Round Group*
1 l a 1 l b 2 2 3 3L 3 3NL 1 l a 1 la 1 la 1 l b 1 Ib 1 Ib 2 2 2 2 2 2 3 3L 3 3L 3 3L 3 3NL 3 3NL 3 3NL
-_
London Edinburgh Social
Trimester class? Mean SD n Mean SD n
I All 85.4 2 All 97.9 3 All 94.71
Post-partum All 82.5 All 845$
1 1 + 2 89.7 3 + 4 81.6f 5 + 6 90.5
2 1 +2 1006 3 + 4 95.0 5 f 6 101.11
3 1 + 2 98.5 3 + 4 90.2 5 + 6 101.11
Post-parturn 1 + 2 77.6 3+4 86.5 5+6 94.3 1 + 2 89.2 3 + 4 78.4 5 + 6 94.0
L, lactating; NL, non-lactating.
25.8 46 92.0 31.4 87 31.8 91 94.5 31.8 36 27.0 110 84.7 26.1 107 23.1 27 82.2 33.0 33 32.8 97 73.2 28.7 77 28.5 15 92.7 26.6 33 22.2 25 98.4 33.9 28 29.4 6 84.1 32.4 26 27.6 32 91.4 17.6 11 29.6 46 92.6 32.1 15 39.3 15 77.2 26.6 27 26.2 40 88.4 23.0 44 22.3 55 85.9 28.2 36 39.3 15 77.2 266 27 2 1.2 13 85.5 36.9 21 24.6 13 74.3 13.3 8 - 1 80.9 36.3 4
35.8 33 77.9 27.0 20 26.9 49 70.3 26.5 31 38.8 15 73.1 31.8 26
* For details, see Table 1. t Office of Population Censuses and Surveys (1980). Mean values were significantly different (P < 0.05) as follows : $ between London and Edinburgh in the row
indicated.
through pregnancy, and were low in the non-lactating, post-partum group. The lowest intake was that of the non-lactating, dieting group (Table 4).
In summary, the London women consumed more protein than the Edinburgh group during the second and third trimesters and in the non-lactating groups, in all social groups. ‘Dieting’ women in Edinburgh (Table 4) had mean protein intakes which were greater than those of the Londoners.
Fat No significant differences in absolute fat consumption or in fat as a percentage of total energy could be detected among social class groups in London or Edinburgh. During pregnancy, percentage energy from fat varied between 39 and 42 YO. Post-partum values are shown in Table 4, the lowest (36 YO) being for London dieters. The mean fat intake of the pregnant London group was higher in the second trimester and remained high during the third trimester (Table 6) . Fat intakes were lower post-partum. The effect of removing dieting subjects from the aggregated mean values for both lactating and non-lactating groups was marked (Table 4) with the mean intake of non-dieters greater by 6g/d. In Edinburgh, fat intakes were slightly higher in the third trimester, but lower post-partum. Lactating subjects consumed on average a larger amount of fat than those not lactating, but the differences were not statistically significant.
In summary, the London group consumed significantly more fat than the Edinburgh
Dow
nloaded from https://w
ww
.cambridge.org/core . IP address: 65.21.228.167 , on 20 M
ar 2022 at 04:47:57 , subject to the Cambridge Core term
s of use, available at https://ww
w.cam
bridge.org/core/terms . https://doi.org/10.1079/BJN
19870106
376 C. SCHOFIELD, E. WHEELER A N D J. STEWART
Table 7. Daily jibre intakes (g) of pregnant and post-pregnant women in London and Edinburgh
(Geometric mean values and standard deviations for dieters and non-dieters aggregated)
London Edinburgh
Social Geometric Geometric Round Group* Trimester classt mean SD n mean
1 I 2 3 3 1 1 1 1 1 1 2 2 2 3 3 3 3 3 3
la I Ib 2 2L 3 3L Post-partum 3NL la I la la Ib 2 Ib Ib 2 3 2 2 3L Post-parturn 3L 3L 3NL 3NL 3NL
All All All All All 1 + 2 3 + 4 5 + 6 1 + 2 3 + 4 5 + 6 1 + 2 3+4 5+6 1 +2 3 +4 5 + 6 1 + 2 3 + 4 5 + 6
18.91
19.01 19.11 16.31 21.53 19.135 13.08 23.43 18.215 17.928 21.0 17.9 18.52
17.31 18.5 16.31 16.32 16.3 $
19.91
21.01
1.52 1.43 1.47 1.36 1.51 1-65 1.34 1.54 1.39 1.32 1.45 1.47 1.43 1-53 1.40 1.29
1.45 1.47 1.72
-
46 15.8 91 15.1
110 14.6 27 15.3 97 11.5 15 18.2 25 15.85 6 13.3§
32 16.5 46 13.7 13 15.8 40 15.8 55 15.4 15 12.75 13 16.9 13 13.6
1 12.0 33 12.1 49 11.1 15 11.5
SD n
1.51 87 I .60 36 1.45 107 1.50 33 1.52 77 1.56 33 1.46 28 1.40 26 1.38 I1 1.79 15 1.47 10 1.32 44 1.41 36 1.57 27 1.56 21 1.3 I 8
4 1.34 20 1.48 31 1.67 26
-
L, lactating; NL, non-lactating. * For details, see Table 1. t Office of Population Censuses and Surveys (1980). Mean values were significantly different (P < 005) as follows: 3 between London and Edinburgh in the row
indicated; §from value for social classes 1 + 2 in the survey round indicated.
group in the third trimester and in the non-lactating group. In London, but not in Edinburgh, ‘dieting’ women consumed less fat. These effects were common to all social groups.
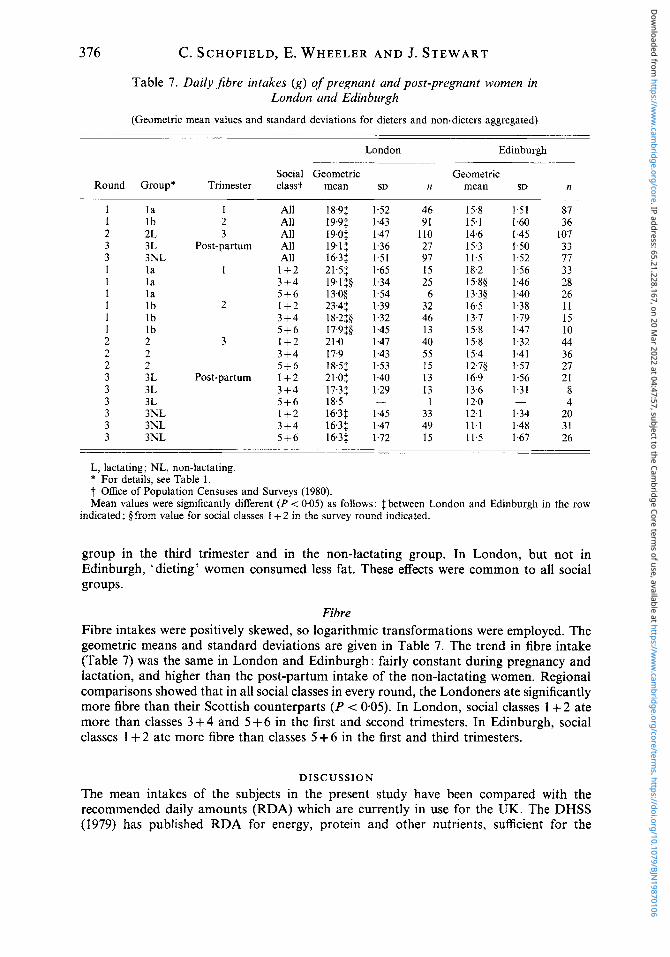
Fibre Fibre intakes were positively skewed, so logarithmic transformations were employed. The geometric means and standard deviations are given in Table 7. The trend in fibre intake (Table 7) was the same in London and Edinburgh: fairly constant during pregnancy and lactation, and higher than the post-partum intake of the non-lactating women. Regional comparisons showed that in all social classes in every round, the Londoners ate significantly more fibre than their Scottish counterparts (P < 005). In London, social classes 1 + 2 ate more than classes 3 + 4 and 5 + 6 in the first and second trimesters. In Edinburgh, social classes 1 + 2 ate more fibre than classes 5 + 6 in the first and third trimesters.
DISCUSSION
The mean intakes of the subjects in the present study have been compared with the recommended daily amounts (RDA) which are currently in use for the UK. The DHSS (1979) has published RDA for energy, protein and other nutrients, sufficient for the
Dow
nloaded from https://w
ww
.cambridge.org/core . IP address: 65.21.228.167 , on 20 M
ar 2022 at 04:47:57 , subject to the Cambridge Core term
s of use, available at https://ww
w.cam
bridge.org/core/terms . https://doi.org/10.1079/BJN
19870106

Tab
le 8
. Com
pari
son of
mea
n da
ily e
nerg
y an
d nu
trie
nt i
ntak
es of p
regn
ant
and
post
-par
tum
wom
en in
Lon
don
and
Edi
nbur
gh w
ith
curr
ent
reco
mm
ende
d da
ily a
mou
nts
(RD
A)
9 E M
ean
Mea
n %
die
tary
M
ean
% d
ieta
ry
Mea
n in
take
%
R Lo
ndon
2
Ener
gy (
MJ
(kca
l))
Prot
ein
(g)
Fat
(g)
Fibr
e (g
)
Gro
up*
RD
At
inta
ke
RD
At
inta
ke
ener
gy
RD
AS
inta
ke
ener
gy
RD
AP
(geo
met
ric) -
a 3
Q 3
la
1000
(240
0)
8.17
(195
3)
60
69.6
14
.2
80
85.4
39
30
18
.9
2 10
.00
(240
0)
9.09
(21
72)
60
77.6
14
.3
80
94.7
39
30
19
.0
Ib
10.0
0 (24
00)
9.20
(219
9)
60
78.8
14
.3
80
97.9
40
30
19
.9
-4
3L
11.5
1 (2
750)
7.
92 (1
894)
69
69
.1
14.6
92
82
.5
39
30
19.1
Q,
3NL
9.00
(215
0)
7.82
(18
68)
54
65.1
14
.1
12
84.5
41
30
16
-3
*a
Edin
burg
h % 2 9 $ 2
la
10.0
0 (2
400)
8.
49 (
2028
) 60
72
.5
14.3
80
92
.0
41
30
15.8
Ib
10
.00
(240
0)
8.62
(20
59)
60
67.6
13
.1
80
94.5
41
30
15
.1
2 10
.00
(240
0)
8.50
(1 91
3)
60
68.6
14
.3
80
84.7
40
30
14
.6
3L
11.5
1 (2
750)
7.
74 (1
850)
69
68
.9
14.9
92
82
.2
40
30
15.3
3N
L 9.
00 (2
150)
6.
58 (
1573
) 54
59
.7
15.2
12
73
.2
42
30
11.5
h
3 *
For
deta
ils, s
ee T
able
1.
2 N
atio
nal
Adv
isor
y C
omm
ittee
on
Nut
ritio
n Ed
ucat
ion
(NA
CN
E) (
1983
) rec
omm
ends
30%
tota
l die
tary
ene
rgy
from
fat
. Val
ues
give
n ar
e ca
lcul
ated
as
30%
of
the
5 In
the
abse
nce
of D
HSS
(197
9) re
com
men
datio
ns,
NA
CN
E (
1983
) re
com
men
datio
ns a
re g
iven
.
'f D
epar
tmen
t of
Hea
lth a
nd S
ocia
l Sec
urity
(D
HSS
), (1
979)
. m
DH
SS (
1979
) R
DA
for
ene
rgy.
Dow
nloaded from https://w
ww
.cambridge.org/core . IP address: 65.21.228.167 , on 20 M
ar 2022 at 04:47:57 , subject to the Cambridge Core term
s of use, available at https://ww
w.cam
bridge.org/core/terms . https://doi.org/10.1079/BJN
19870106
378 C. SCHOFIELD, E. WHEELER A N D J. STEWART
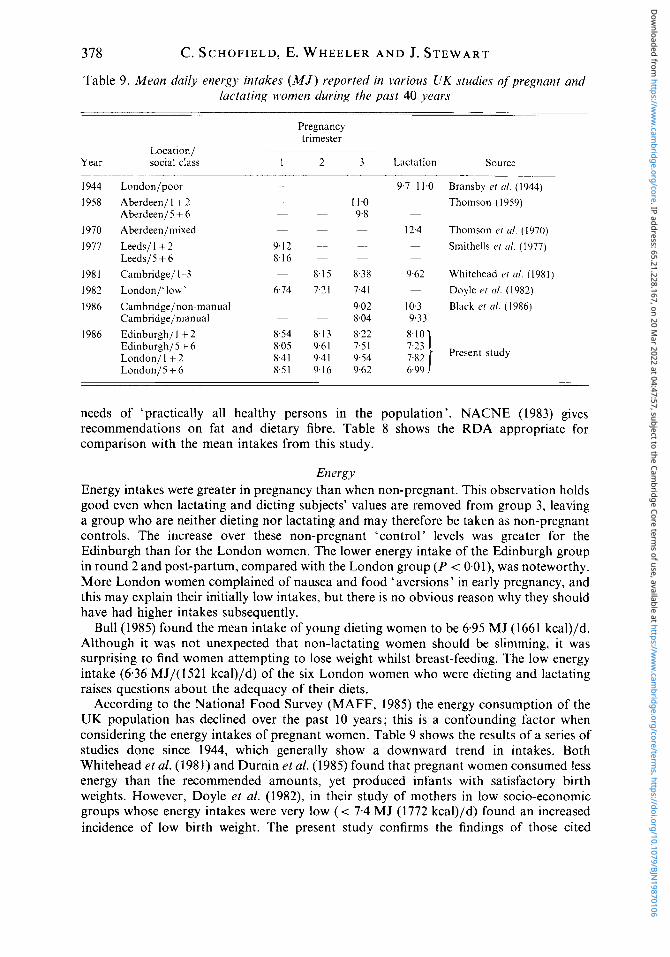
Table 9. Mean daily energy intakes ( M J ) reported in various UK studies of pregnant and lactating women during the past 40 years
-~
Year
I944 1958
1970 1977
1981 1982 1986
I986
~
~
needs
Location / social class
Pregnancy trimester
I 2 3 ~~
London/poor - ~ ~
Aberdeen/ I + 2 ~- ~ 11.0 Aberdeen/S + 6 9.8 Aberdeen/mixed ~ ~ ~
Leeds/5 + 6 8.16 ~ ~
Cambridge/ I--3 8.15 8.38 London/’ low’ 6.74 7.21 7.41 Cambridge/non-manual 9.02
8.04 Edinburgh/ I + 2 8.54 8.13 8.22 Edinburgh/S + 6 8.05 9.61 7.51 London/ l+2 8.41 9.41 9.54 London/5 + 6 8 3 1 9.16 9.62
~ ~
- Leeds/ 1 + 2 9.12 -
~
~ ~
~ Cambridge/rnanual -
Lactation Source
9.7-1 1.0 __ -_.__
Bransby ei ul. (1944) Thoinson ( 1959)
12.4 Thomson c i ul. (1970) - Smithells ~f ul. (1977)
9.62 Whitehead (’t crl. (1981)
~
- Doyle P [ d. (1982) 10.3 Black CI c//. (1986) 9.33 8.101
Present study
6.99 ~
~
of ‘practically all healthy persons in the population’. NACNE (1983) gives recommendations on fat and dietary fibre. Table 8 shows the RDA appropriate for comparison with the mean intakes from this study.
Energy Energy intakes were greater in pregnancy than when non-pregnant. This observation holds good even when lactating and dieting subjects’ values are removed from group 3, leaving a group who are neither dieting nor lactating and may therefore be taken as non-pregnant controls. The increase over these non-pregnant ‘control ’ levels was greater for the Edinburgh than for the London women. The lower energy intake of the Edinburgh group in round 2 and post-partum, compared with the London group (P < 0.01), was noteworthy. More London women complained of nausea and food ‘aversions’ in early pregnancy, and this may explain their initially low intakes, but there is no obvious reason why they should have had higher intakes subsequently.
Bull (1985) found the mean intake of young dieting women to be 6.95 MJ (1661 kcal)/d. Although it was not unexpected that non-lactating women should be slimming, it was surprising to find women attempting to lose weight whilst breast-feeding. The low energy intake (6.36 MJ/(l521 kcal)/d) of the six London women who were dieting and lactating raises questions about the adequacy of their diets.
According to the National Food Survey (MAFF, 1985) the energy consumption of the UK population has declined over the past 10 years; this is a confounding factor when considering the energy intakes of pregnant women. Table 9 shows the results of a series of studies done since 1944, which generally show a downward trend in intakes. Both Whitehead et al. (1981) and Durnin et al. (1985) found that pregnant women consumed less energy than the recommended amounts, yet produced infants with satisfactory birth weights. However, Doyle et al. (1982), in their study of mothers in low socio-economic groups whose energy intakes were very low (< 7.4 MJ (1772 kcal)/d) found an increased incidence of low birth weight. The present study confirms the findings of those cited
Dow
nloaded from https://w
ww
.cambridge.org/core . IP address: 65.21.228.167 , on 20 M
ar 2022 at 04:47:57 , subject to the Cambridge Core term
s of use, available at https://ww
w.cam
bridge.org/core/terms . https://doi.org/10.1079/BJN
19870106

Diets of pregnant and post-pregnant women 379
previously, demonstrating energy intakes lower than the RDA, in pregnancy, in lactation, and in the ‘control’ group. The incidence of low birth weight was only 2 % in a sample of 234 and did not vary with social class; there were no perinatal deaths. This sample is far too small for conclusions to be drawn about mortality rate, but it appears that ‘low’ energy intakes were adequate for normal fetal growth, and we conclude that the RDA is set unrealistically high.
The failure to detect a consistent social-class gradient during pregnancy is surprising. However, the general decline in mean intakes, and the emphasis on a ‘healthy’ diet being low in fat and sugar may well be the reason why women in social classes 1 + 2 did not have significantly higher intakes than others.
Protein It is apparent (Table 8) that all groups of women in the present study consumed amounts well above the RDA, and the average contribution of protein to dietary energy was 14%. Examination of protein : energy ratios shows that the London and Edinburgh post-partum dieters consumed 15 and 16% of dietary energy as protein respectively, reflecting the widespread belief that protein foods are less fattening than ‘starch’ and fat. The Londoners consumed more protein than the Edinburgh group during pregnancy, but intakes of both groups were so high relative to the RDA that regional differences are not of great importance. No significant social-class differences in protein intake were detected.
Fat Subjects in the present study had high-fat intakes, similar to those of other groups (Smithells et al. 1977, Doyle et al. 1982). The percentage of dietary energy derived from fat (39-40 % in London, 4 0 4 2 % in Edinburgh) was slightly lower than the National Food Survey reports for England (43.3 “/o) and Scotland (42 Yo) (MAFF, 1985). Although this percentage was higher in Edinburgh, the Londoners ate more fat in absolute terms. The same pattern of higher absolute fat intakes in London, with lower percentages of dietary energy, emerged when dieting and non-dieting subjects were compared. The mean ‘dieting’ Edinburgh intake of 74.0 g/d (43 YO energy) was unexpected for a group claiming to be slimming, and the understanding by this group of the nature of a low-energy diet is open to question. The lowest energy intake from fat was 36 YO, in the dieting non-lactating London group. None of the groups in the study reached the 35 % level recommended by the DHSS (1984) or the 30% of NACNE (1983).
Fibre Taking the intakes of the non-dieting, non-lactating women as a control, the subjects in the present study can be seen to have increased their fibre intakes during pregnancy and lactation. Nevertheless, these increased intakes are far below current recommendations (NACNE, 1983). The lower relative intakes of the Edinburgh group may be a function of smaller ranges and varieities of foods being available, and increased use of processed foods (E. Wheeler, C . Schofield and J. Stewart, unpublished results). The social class differences in fibre intake may reflect differences in knowledge of current health education messages (Schofield et al. 1987).
Conclusion The surprising finding from the present study is that regional differences in energy, protein, fat and fibre intake outweighed social-class differences. Two possible explanations apply for both pregnancy and lactation. One is that the middle-class women were the most ‘health conscious’ and controlled their fat and fibre intakes. This would tend to cancel out the
Dow
nloaded from https://w
ww
.cambridge.org/core . IP address: 65.21.228.167 , on 20 M
ar 2022 at 04:47:57 , subject to the Cambridge Core term
s of use, available at https://ww
w.cam
bridge.org/core/terms . https://doi.org/10.1079/BJN
19870106

3 80 C. SCHOFIELD, E. WHEELER A N D J. STEWART
‘traditional’ high-energy intake of their class. The other is that the general downward trend which is taking place in energy intakes is obscuring social-class differences. Both explanations may apply. An additional explanation, after pregnancy, would be that more middle-class women are genuinely dieting to regain their shape.
The RDA for nutrients and energy need to be reassessed in the light of increasing evidence of ‘low’ energy and protein intakes and satisfactory birth weights. It appears from this and other surveys that a recommended intake of 8.4 MJ (2000 kcal)/d would be adequate for pregnancy and lactation in groups of healthy women in the UK. At 10 % of dietary energy, this would imply a protein intake of 50 g/d. No study in the UK has shown a mean intake as low as this, but the current Food and Agriculture Organization/World Health Organization/United Nations University (1985) ‘safe levels’ of protein intake for a 60 kg woman, who becomes pregnant, is 51 g/d. There seems no reason to recommend intakes higher than those found in healthy women. It appears from the present study that the concept of ‘dieting’ is a flexible one, to say the least, and does not necessarily involve reduced fat intake. This point may be of interest to health educators.
The authors wish to acknowledge financial support, and assistance in computing, from the Ministry of Agriculture, Fisheries and Food; and the help and cooperation given by Dr Oliver Brooke, Dr Frank Johnstone and their colleagues, and the pregnant women in London and Edinburgh.
R E F E R E N C E S Abraham, R., Campbell-Brown, M., Haines, A. P., North, W. R. S., Hainsworth, V. & McFadyen, I. R. (1985).
Black, A. E., Wiles, S. J. & Paul, A. A. (1986). British Journal of Nutrition 56, 59-12. Bransby, E. R., Daubney, C. G. & King, J. (1944). British Journal oJ Nutrition 2, 89-1 10. Bull, N. L. (1985). Human Nutrition: Applied Nutrition 39A Suppl. Campbell-Brown, M. (1982). Proceedings of the Tenth Study Group of the Royal College of Obstetrics and
Gynaecology. London : Royal College of Obstetrics and Gynaecology. Campbell-Brown, M., Johnstone, F. D. & Grieve, J. F. K. (1986). Proceedings of the Nutrition Society 45,
90A. Department of Health and Social Security (1979). Report on Health and Social Subjects no. 15. London: H.M.
Stationery Office. Department of Health and Social Security (1984). Diet and Cardiovascular Disease, Committee on Medical Aspects
of Food Policy. Report of the Panel on Diet in Relation to Cardiovascular Disease. London: H.M. Stationery Office.
Doyle, W., Crawford, M. A., Laurance, B. M. & Drury, P. (1982). Human Nutrition: Applied Nutrition MA, 95-106.
Durnin, J. V. G. A., Mckillop, F. M., Grant, S. & Fitzgerald, G. (1985). Lancet ii, 823-825. Food and Agriculture Organization/World Health Organization/United Nations University. (1985). Technical
Marr, J. W. (1971). World Review of Nutrition and Dietetics 13, 105-164. Ministry of Agriculture, Fisheries and Food (1985). Annual Report of the National Food Survey Committee (1983).
National Advisory Committee on Nutrition Education (1983). Proposals for Nutritional Guidelines for Health
Office of Population Censuses and Surveys (1980). Classzjication of Occupations. London : H.M. Stationery
Office of Population Censuses and Surveys (1981). Regional Trends 197930. London: H.M. Stationery Office. Office of Population Censuses and Surveys (1984). OPCS Monitor DH3 84/6. London: H.M. Stationery
Office of Population Censuses and Surveys (1985). OPCS Monitor DH3 85/5. London: H.M. Stationery
Paul, A. A. & Southgate, D. A. T. (1978). McCance and Widdowson’s The Composition of Foods. London: H.M.
Paul, A. A,, Southgate, D. A. T. & Russell, J. (1980). First Supplement to McCance and Widdowson’s The
Human Nutrition: Applied Nutrition 39A, 23-35.
Report Series no. 724. Geneva: World Health Organization.
London: H.M. Stationery Office.
Education in Britain. London : Health Education Council.
Office.
Office.
Office.
Stationery Office and Elsevier/North Holland, Biomedical Press.
Composition of Foods. London: H.M. Stationery Office.
Dow
nloaded from https://w
ww
.cambridge.org/core . IP address: 65.21.228.167 , on 20 M
ar 2022 at 04:47:57 , subject to the Cambridge Core term
s of use, available at https://ww
w.cam
bridge.org/core/terms . https://doi.org/10.1079/BJN
19870106
Diets of pregnant and post-pregnant women 38 1
Pickard, B. M. (1983). Nutrition and Food Science January/February, 20-22. Schofield, E. C., Wheeler, E. F. & Stewart, J . (1987). Human Nutrition: Applied Nutrition (In the Press). Smithells, R. W., Ankers, C., Carver, M. E., Lennon, D., Schorah, C. J. & Sheppard, S. (1977). British Journal
Snedecor, G. W. & Cochran, W. G. (1967). Statistical Methoa!s, 6th ed. Ames, Iowa: Iowa State University
Thomson, A. M. (1959). British Journal of Nutriiion 13, 190-204. Thomson, A. M., Hytten, F. E. & Bilewicz, W. 2. (1970). British Journal of Nutrition 24, 565-572. Whitehead, R. G., Paul, A. A,, Black, A. E. & Wiles, S. J . (1981). Food and Nutrifion Bulletin Suppl. 5 ,
of Nutrition 38, 497-506.
Press.
259-265.
Printed in Great Britain
Dow
nloaded from https://w
ww
.cambridge.org/core . IP address: 65.21.228.167 , on 20 M
ar 2022 at 04:47:57 , subject to the Cambridge Core term
s of use, available at https://ww
w.cam
bridge.org/core/terms . https://doi.org/10.1079/BJN
19870106


