Embed Size (px)
Citation preview

Journal of Physics Conference Series
OPEN ACCESS
The detection of chronic cerebral hemorrhage inrabbits with magnetic inductionTo cite this article Jian Sun et al 2012 J Phys Conf Ser 407 012014
View the article online for updates and enhancements
You may also likeInvestigation of 13C Isotopic Fractionationof CCH in Two Starless Cores L1521Band L134NKotomi Taniguchi Eric Herbst HiroyukiOzeki et al
-
Characteristics of inductively coupledplasma (ICP) and helicon plasma in asingle-loop antennaTianliang ZHANG Kaiyin JIANG et al
-
Carbamoylated chitosan hydrogels withimproved viscoelastic properties andstability for potential 3D cell cultureapplicationsSai Geetha Marapureddy Pravin HivareSiddhant Kumar et al
-
Recent citationsTwenty-Four-Hour Real-Time ContinuousMonitoring of Cerebral Edema in RabbitsBased on a Noninvasive and NoncontactSystem of Magnetic InductionGen Li et al
-
This content was downloaded from IP address 45201173231 on 24122021 at 1507
The detection of chronic cerebral hemorrhage in rabbits with
magnetic induction
Jian Sun1 Gui Jin
1 Mingxin Qin
1 Zibing Wan
2 Jinbao Wang
3 ChaoWang
4
Wanyou Guo4 Lin Xu
1 Xu Ning
1 Jia Xu
1 Xianjie Pu
1 Mingsheng Chen
1 and
Hongmei Zhao2
1 College of Biomedical Engineering and Medical Imaging
2Experimental Animal Center
Third Military Medical University Gaotanyanzheng street 30
Shapingba district 400030 Chongqing China
3College of Life Sciences and Technology Xidian University
4 College of Electronic Engineering Xidian University
Taibai South Road 2 710126 Xirsquoan China
Email nksunj126com qmingxintmmueducn
Corresponding author
Abstract Chronic cerebral hemorrhage (CCH) in the brain is an important clinical problem
that is often monitored and studied with expensive devices such as MRI and PET which are
not readily available in low economical resource parts of the world We have developed a less
expensive tool for non-contact monitoring of CCH in the brain The system measures the phase
shift between the electromagnetic signals on the two coils CCH was induced in the brain of
rabbits by stereotactic method Intracranial pressure (ICP) and Electrocardiograph (ECG) of
subjects were monitored for 15h Signals were continuously monitored up to t=15h at exciting
frequency 107MHz From 08 to 24 ml of autologous blood was injected (each injection
quantity of 08 ml the interval time for 30 minutes) The results show significant phase shifts
increase as a function of injection volume ICP and phase shift were directly proportional to the
related while HRV were stable around 200beatsmin-1
Our system has high sensitivity that
even 08 ml can also be detected In this study the curves of inductive phase shift are
significantly related to ICP This observation suggests that the method could be valuable in
First Latin-American Conference on Bioimpedance (CLABIO 2012) IOP PublishingJournal of Physics Conference Series 407 (2012) 012014 doi1010881742-65964071012014
Published under licence by IOP Publishing Ltd 1
addition to continuous monitoring also for early warning in emergency medicine and critical
care units
1 Introduction
In brain neurosurgery to date deformation of the brain usually occurs due to the change of intracranial
pressure which can be caused by surgical intervention medications received and acute cerebral
hemorrhage [1] The study of the cerebral hemorrhage is benefited from advances in medical imaging
such as MRI and PET [2] While advanced medical imaging techniques are extremely valuable in
studying cerebral hemorrhage the devices are expensive and not readily available either to patients or
to researchers in areas with low economical resources [3 4] The goal of this study is to introduce a
new inexpensive and valuable technology which could become a useful tool in research and clinical
applications related to the study of brain injury in general and cerebral hemorrhage in particular
The field of study relates to the electromagnetic properties of biological tissues As shown by
Tarjan and McFee [5] an electrode-less measurement of changing impedances in the human body can
be achieved by measuring the effect of inducted eddy currents It is established in the literature that
different biological tissues have different electromagnetic properties and that it is possible to
distinguish between different tissues on the basis of these properties [6] The complex electrical
properties of impaired tissue are substantially different from those of normal tissue various non-
invasive systems based on electro-magnetic measurements have been proposed for different medical
applications [7 8] Magnetic induction tomography (MIT) has been studied as a potential tool for
noninvasive detection of tissue oedema [7 8 9 and 10] Also there are different approaches for
detecting electromagnetic changes in tissue by non-invasive means [11] Measuring changes in the
electromagnetic properties of the tissue with two non-contact induction coils placed around the tissue
could be used as an alternative technique for detection of the clinical changes in the tissue [12 13]
While information is not in the form of an image it can produce temporal and even gross local
information about changes in tissue [14] from non-invasive bulk measurements In particular
detecting the change in the variable electromagnetic phase shift in time after the occurrence of a
suspected clinical episode could serve as a first-order clinical warning to detect the presence and
progression of change in tissue [11] In this study we show with experiments in the rabbit brain that
the concept of non-invasive measurements of the electromagnetic properties of the brain can be used
to detect the evolution of cerebral hemorrhage in the brain The electromagnetic property we measure
in this study is the change of electromagnetic phase shift in time in the brain We describe here the
fundamental principles the device and show results obtained in the brain of cerebral hemorrhage
rabbits
2 Methods
First Latin-American Conference on Bioimpedance (CLABIO 2012) IOP PublishingJournal of Physics Conference Series 407 (2012) 012014 doi1010881742-65964071012014
2
21 Theoretical estimation
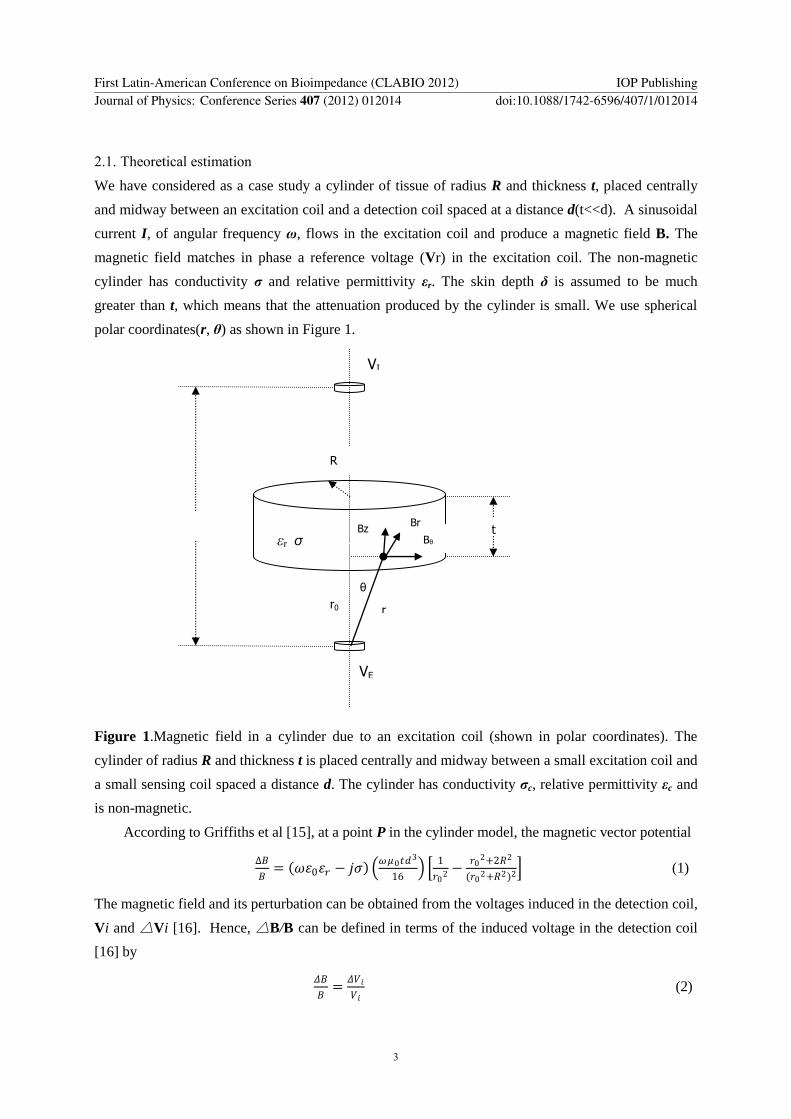
We have considered as a case study a cylinder of tissue of radius R and thickness t placed centrally
and midway between an excitation coil and a detection coil spaced at a distance d(tltltd) A sinusoidal
current I of angular frequency ω flows in the excitation coil and produce a magnetic field B The
magnetic field matches in phase a reference voltage (Vr) in the excitation coil The non-magnetic
cylinder has conductivity ζ and relative permittivity εr The skin depth δ is assumed to be much
greater than t which means that the attenuation produced by the cylinder is small We use spherical
polar coordinates(r θ) as shown in Figure 1
Figure 1Magnetic field in a cylinder due to an excitation coil (shown in polar coordinates) The
cylinder of radius R and thickness t is placed centrally and midway between a small excitation coil and
a small sensing coil spaced a distance d The cylinder has conductivity ζc relative permittivity εc and
is non-magnetic
According to Griffiths et al [15] at a point P in the cylinder model the magnetic vector potential
∆119861
119861= 1205961205760120576119903 minus 119895120590
12059612058301199051198893
16
1
11990302 minus
11990302+21198772
(11990302+1198772)2
(1)
The magnetic field and its perturbation can be obtained from the voltages induced in the detection coil
Vi and Vi [16] Hence BB can be defined in terms of the induced voltage in the detection coil
[16] by
120549119861
119861=
120549119881119894
119881119894 (2)
t
r r0
θ
VE
VI
R
Bz Bθ
Br
εr σ
First Latin-American Conference on Bioimpedance (CLABIO 2012) IOP PublishingJournal of Physics Conference Series 407 (2012) 012014 doi1010881742-65964071012014
3
We define a constant k
119896 = 1205830119905119889
3
16
1
11990302 minus
11990302+21198772
(11990302+1198772)2
(3)
Substituting (3) and (2) into (1) the phase of the total induced voltage Vi in the detection coil with
respect to the induced voltage by the primary magnetic field could be expressed as a function of
frequency and electrical parameters in the cylinder between the coils [15]by
120579119881119894 = 119886119903119888119905119892 119868119898 ∆119881
119881+119877119890 ∆119881 = 119886119903119888119905119892(
minus119896120596120590
11989612059621205760120576119903+1) (4)
The phase of the reference voltage Ve in the presence of the cylinder sample can be estimated
from the following expression [11]
Im( )
[ ]
Re( )
L L
out L LVe
L L
out L L
Z Z
Z Z Zarctg
Z Z
Z Z Z
(5)
Where LZ represents the impedance of the excitation coil outZ represents the output impedance
of the excitation source The total change in phase shift ( ) between the reference and induced
voltages in the excitation and sensing coil respectively is given by the expression
Vi Ve (6)
22 Surgical procedure
A rabbit (38kg) were anaesthetized with urethane (255mlkg) via ear vein We establish the
model of ACH by means of stereotactic method The coordinates for the brain were determined using
a standard atlas [17] A short midline skin incision was made and the point for a stereotactic approach
through the skull determined The head was leveled in such a way that the bared Bregma was 15mm
higher than Lambda With the position of Bregma as a reference point the coronal zero planes (AP0)
passed through the coronal suture A1 referred to the coronary plane which was 1 mm before AP0
while P1 was 1mm after AP0 The scope of the internal capsule was between A5 and P2 We chose
coronary plane P1 Puncture point is on the right of the coronal suture(R=6mm) and after the sagittal
suture (P1 AP=1mm) A 1mm drill bit was twisted by hand to perforate the skull A needle (d=07mm)
was then introduced to the proper depth (H=13mm) and autologous blood slowly injected From 04 to
52 ml of autologous blood was injected RM 6280B biological signal collecting and processing
system was used to measure the changes of ICP and APP of paracele [18] and HRV As shown in
Figure2 rabbits were operated to monitoring ICP APP and HRV
First Latin-American Conference on Bioimpedance (CLABIO 2012) IOP PublishingJournal of Physics Conference Series 407 (2012) 012014 doi1010881742-65964071012014
4
Figure2 Rabbit model
23 Experimental magnetic induction prototype
An experimental inductive setup was designed and constructed The system consists of seven modules
signal generator excitation coil detection coil phase detector PC and biological signal collecting
and processing part A picture of the experimental set-up is shown in Figure 3
Figure3 Experimental setup for detection of cerebral hemorrhage in rabbits
with magnetic induction
231 Signal generator
The function generator was implemented by a signal generator which supplies a signal I cos(ωt) of
approximately 5v at 107MHz The range of output power from the excitation source is 15~33dB The
frequency stability is the order of magnitude of 10-4
the distortion reaches 10-2
~10-4
and the SNR is
30~60dB in the excitation source
232 The coils
The excitation and detection coils were coaxially placed Both coils were ten turns with radius r = 5
cm The distance between coils was d=11 cm To avoid inductive pickup the leads of the coils were
twisted The excitation coil induces a current in the detection coil by magnetic induction and an
First Latin-American Conference on Bioimpedance (CLABIO 2012) IOP PublishingJournal of Physics Conference Series 407 (2012) 012014 doi1010881742-65964071012014
5
inductive phase shift as a function of the electrical properties of the rabbit brain
233 Phase detector
The phase detector includes the band-pass filter amplifier AD FDGA DSP flash memory and LCD
The phase detector can be calibrated and the temperature drift and the noise can be eliminated by
calibration software The parameters of our phase detector are as follows the range of the phase
measurement 0~1800 the phase precision 005
0 the range of gain -10~35dB once measurement
time 3~7s The 12h data measured can be saved in the phase detector
234 Biological signal collecting and processing part
The data processing part (6280C Chengdu Instrument Factory) was controlled by a personal computer
24 Experimental design
Figure 4 Work flow diagram
Figure4 shows a work flow diagram of the experimental prototype ICP APP ECG and phase shift
were synchronously collected for the comparison of measured results In a typical procedure baseline
data were taken after the surgical procedure (t = 0) Signals were continuously monitored for 15h
Autologous blood was injected from 08 to 24 ml (Each injection quantity of 08 ml the interval time
for 30 minutes) When each 08ml blood was injected the phase detector measured the phase shift for
30 minutes and got 500 data We choose 10 stable and continuous measurements of phase shift before
Signal Generator
Physiological Signal Collection
Device
r
Rabbit
Excitation
Coil
Detection Coil
Phase Detector
PC
Phase
Shift
ICP
ECG
ICP APP
Signal Generator
Physiological Signal Collection
Device
r
Rabbit
Excitation
Coil
Detection Coil
Phase Detector
PC
Phase
Shift
ECG
First Latin-American Conference on Bioimpedance (CLABIO 2012) IOP PublishingJournal of Physics Conference Series 407 (2012) 012014 doi1010881742-65964071012014
6
next injection ICP APP and HRV were processed according to the 10 measurements of phase shift
And then each data set was averaged
The values of the phase shift changes were recorded with respect to baseline measurements
taken after the procedure Experimental excitation and detection coils are coaxial placed around the
brain cavity of the rabbits In all the experiments the coils were placed in such a way that the brain
cavity was centered between the excitation and detection coils Changes in phase shift as a function of
the injection volume were recorded The fundamental hypothesis in this study is that the changes in
phase shift measured with the detection coil will be representative of the changes in electrical
conductivity of the brain
The Animal Experiments and Ethical Committee of the Institution approved all experimental
protocols and the care of animals was carried out in accordance with the Declaration of Helsinki and
IASP guidelines [19 20]
3 Results and discussion
Figure 5Relationship curves of intracranial pressure and inductive phase shift from
rabbit brain hematoma model
Figure 5 showed relationship curves of ICP APP HRV and phase shift from rabbit brain
hemorrhage model at exciting frequency 107MHz
Along with the increase of injection quantity the changes of phase shift also increased The phase
shift curversquos slope was stable Our study told us magnetic induction theory was reliable and our
system can detect a small amount of bleeding in the brain ICP were directly proportional to phase
shift while HRV were stable around 200beatsmin-1
So the changes of phase shift reflected the
0h 05h 1h 15h
0
005
01
015
02
025
03
035
04
0
50
100
150
200
250
0 08 16 24
Phase Shift(degrees)
HRV(beatsmin)CPP(mmhg)APP(mmhg)ICP(mmhg)
Injection Volume(ml)time(h)
HRV
CPP
ICP
APP
PS
First Latin-American Conference on Bioimpedance (CLABIO 2012) IOP PublishingJournal of Physics Conference Series 407 (2012) 012014 doi1010881742-65964071012014
7
changes of ICP
Figure 5 also showed the change rate of ICP and phase shift were not identical Reasons are as
following First the collection of ICP and phase shift is not completely in sync Second manual
injection brought error Third injection intervals were short (only for 30 minutes) so CBF (cerebral
blood flow) and CSF (cerebrospinal fluid) regulatory function were not considered As compared to
this CBF was reduced both around the hemorrhage and in the surrounding brain and this change was
strongly volume-dependent and was not accompanied by significant alterations in CPP [21]Fourth
the animal moved in the experimental process In future we must optimize our system to ensure
synchronous collection and use injection pump to avoid artificial error
Also we may take long term monitoring up to 12h above The coils inductance and electrical
conductivity of rabbit brain were not calculated Due to time restrictions sample number was too
small and had no control group Further development aims at contrast research
This was an early experiment and had many drawbacks But this was the first study to reveal the
relationship between the ICP and change of phase shift by animal experiment A comparison of the
analytical and experimental results with respect to othersrsquo previous studies [12 13] suggests that
various physiological conditions in the brain such as oedema and ischaemia can be distinguished
through the analysis of the inductive phase shift change at specific frequencies In this study the
curves of inductive phase shift are significantly related to ICP This observation suggests that the
method could be valuable for early warning in emergency medicine and critical care units in addition
to continuous monitoring
4 Conclusion
Measuring the magnetic induction phase shift changes as a function of time after brain injury has the
potential for being a simple method for early and non-contact detection of the occurrence and progress
of cerebral hemorrhage in the bulk of brain This technique could be useful in both research and
clinical applications in particular for low economical resources areas of the world This is a
preliminary study and much more research remains to be done to confirm these observations
Although the experimental evidence provided in this study has relevance to the clinical case the
cerebral hemorrhage formation in clinical practice is a more complex process than the experimental
model evaluated in this study
5 Acknowledgments
This work was supported by Foundation of Third Military Medical University and National Natural
Science Foundation of China (61072254)
6 References
[1] Lighthall W J 1988 Controlled cortical impact a new experimental brain injury model J
First Latin-American Conference on Bioimpedance (CLABIO 2012) IOP PublishingJournal of Physics Conference Series 407 (2012) 012014 doi1010881742-65964071012014
8
Neurotrauma5 1ndash15
[2] Chelsea S Kidwell Julio A Chalela Jeffrey L Saver 2004 Comparison of MRI and CT for
Detection of Acute Intracerebral Hemorrhage JAMA 292(15) 1823-1830
[3] Otten D M Onik G and Rubinsky B 2004 Distributed network imaging and electrical impedance
tomography of minimally invasive surgery Technol Cancer Res Treat 3 1ndash10
[4] Granot Y Ivorra A and Rubinsky B 2008 A new concept for medical imaging centered on
cellular phone technology PlosOne 3 2075
[5] Tarjan P and McFee R 1968 Electrodeless measurements of the effective resistivity of the
human torso and head by magnetic induction IEEE Trans Biomed Eng 4 266ndash78
[6] Foster K R and Schwan H P 1989 Dielectric properties of tissues and biological materials a
critical review CRC Crit Rev Biomed Eng 17 25ndash104
[7] Al-Zeiback N S 1993 A feasability study of in vivo electromagnetic imaging Phys Med Biol
38 151ndash60
[8] Korjenevsky A V and Cherepenin V A 1997 Magnetic induction tomography J Commun
Technol Electron 42 469ndash74
[9] Korjenevsky A V and Cherepenin V A 1999 Progress in realization of magnetic induction
tomography Ann N YAcad Sci 873 346ndash52
[10] Griffiths H 2001 Magnetic induction tomography Meas Sci Technol 12 1126ndash31
[11] Gonzalez C A 2009 The detection of brain ischaemia in rats by inductive phase shift
spectroscopy Physiol Meas 30 809ndash819
[12] Gonzalez C A and Rubinsky B 2006 A theoretical study on magnetic induction frequency
dependence of phase shift in oedema and haematoma Physiol Meas 27 829ndash38
[13] Gonzalez C A and Rubinsky B 2006 Detection of brain oedema with frequency dependent
phase shift electromagnetic induction Physiol Meas 27 539ndash52
[14] Rojas R Rubinsky B and Gonz alez C A 2008 The effect of brain hematoma location on
volumetric inductive phase shift spectroscopy of the brain with circular and magnetron
sensor coils a numerical simulation study Physiol Meas 29 S255ndashS266
[15] Griffiths H Steward W R and Gough W 1999 Magnetic induction tomographymdasha measuring
system for biologicalmaterials Ann New York Acad Sci 873 335ndash45
[16] Scharfetter H Casa˜nas R and Rosell J 2003 Biological tissue characterization by magnetic
induction spectroscopy(MIS) requirements and limitations IEEE Trans Biomed Eng 50
870ndash80
[17] Sawyer CH Everett JW Green JD 1954 The rabbit diencephalon in stereotaxic coordinates J
Comp Neurol 101 801-824
[18] Wl Jing 2007 Study on the model building of internal capsule hemorrhage and the changes of
intracranial pressure and discharge of vagus nerve in rabbits shanxi medical journal 361
First Latin-American Conference on Bioimpedance (CLABIO 2012) IOP PublishingJournal of Physics Conference Series 407 (2012) 012014 doi1010881742-65964071012014
9
[19] Helsinki 1996 Declaration of Helsinki Br Med J 313 1448ndash9
[20] ZimmermannM1983 Ethical guidelines for investigations of experimental pain in conscious
animals Pain 16 109ndash10
[21] Fredric P NATH FRCS et al 1986 Early hemodynamic changes in experimental
intracerebral hemorrhage J Neurosurg 65 697-703
First Latin-American Conference on Bioimpedance (CLABIO 2012) IOP PublishingJournal of Physics Conference Series 407 (2012) 012014 doi1010881742-65964071012014
10
The detection of chronic cerebral hemorrhage in rabbits with
magnetic induction
Jian Sun1 Gui Jin
1 Mingxin Qin
1 Zibing Wan
2 Jinbao Wang
3 ChaoWang
4
Wanyou Guo4 Lin Xu
1 Xu Ning
1 Jia Xu
1 Xianjie Pu
1 Mingsheng Chen
1 and
Hongmei Zhao2
1 College of Biomedical Engineering and Medical Imaging
2Experimental Animal Center
Third Military Medical University Gaotanyanzheng street 30
Shapingba district 400030 Chongqing China
3College of Life Sciences and Technology Xidian University
4 College of Electronic Engineering Xidian University
Taibai South Road 2 710126 Xirsquoan China
Email nksunj126com qmingxintmmueducn
Corresponding author
Abstract Chronic cerebral hemorrhage (CCH) in the brain is an important clinical problem
that is often monitored and studied with expensive devices such as MRI and PET which are
not readily available in low economical resource parts of the world We have developed a less
expensive tool for non-contact monitoring of CCH in the brain The system measures the phase
shift between the electromagnetic signals on the two coils CCH was induced in the brain of
rabbits by stereotactic method Intracranial pressure (ICP) and Electrocardiograph (ECG) of
subjects were monitored for 15h Signals were continuously monitored up to t=15h at exciting
frequency 107MHz From 08 to 24 ml of autologous blood was injected (each injection
quantity of 08 ml the interval time for 30 minutes) The results show significant phase shifts
increase as a function of injection volume ICP and phase shift were directly proportional to the
related while HRV were stable around 200beatsmin-1
Our system has high sensitivity that
even 08 ml can also be detected In this study the curves of inductive phase shift are
significantly related to ICP This observation suggests that the method could be valuable in
First Latin-American Conference on Bioimpedance (CLABIO 2012) IOP PublishingJournal of Physics Conference Series 407 (2012) 012014 doi1010881742-65964071012014
Published under licence by IOP Publishing Ltd 1
addition to continuous monitoring also for early warning in emergency medicine and critical
care units
1 Introduction
In brain neurosurgery to date deformation of the brain usually occurs due to the change of intracranial
pressure which can be caused by surgical intervention medications received and acute cerebral
hemorrhage [1] The study of the cerebral hemorrhage is benefited from advances in medical imaging
such as MRI and PET [2] While advanced medical imaging techniques are extremely valuable in
studying cerebral hemorrhage the devices are expensive and not readily available either to patients or
to researchers in areas with low economical resources [3 4] The goal of this study is to introduce a
new inexpensive and valuable technology which could become a useful tool in research and clinical
applications related to the study of brain injury in general and cerebral hemorrhage in particular
The field of study relates to the electromagnetic properties of biological tissues As shown by
Tarjan and McFee [5] an electrode-less measurement of changing impedances in the human body can
be achieved by measuring the effect of inducted eddy currents It is established in the literature that
different biological tissues have different electromagnetic properties and that it is possible to
distinguish between different tissues on the basis of these properties [6] The complex electrical
properties of impaired tissue are substantially different from those of normal tissue various non-
invasive systems based on electro-magnetic measurements have been proposed for different medical
applications [7 8] Magnetic induction tomography (MIT) has been studied as a potential tool for
noninvasive detection of tissue oedema [7 8 9 and 10] Also there are different approaches for
detecting electromagnetic changes in tissue by non-invasive means [11] Measuring changes in the
electromagnetic properties of the tissue with two non-contact induction coils placed around the tissue
could be used as an alternative technique for detection of the clinical changes in the tissue [12 13]
While information is not in the form of an image it can produce temporal and even gross local
information about changes in tissue [14] from non-invasive bulk measurements In particular
detecting the change in the variable electromagnetic phase shift in time after the occurrence of a
suspected clinical episode could serve as a first-order clinical warning to detect the presence and
progression of change in tissue [11] In this study we show with experiments in the rabbit brain that
the concept of non-invasive measurements of the electromagnetic properties of the brain can be used
to detect the evolution of cerebral hemorrhage in the brain The electromagnetic property we measure
in this study is the change of electromagnetic phase shift in time in the brain We describe here the
fundamental principles the device and show results obtained in the brain of cerebral hemorrhage
rabbits
2 Methods
First Latin-American Conference on Bioimpedance (CLABIO 2012) IOP PublishingJournal of Physics Conference Series 407 (2012) 012014 doi1010881742-65964071012014
2
21 Theoretical estimation
We have considered as a case study a cylinder of tissue of radius R and thickness t placed centrally
and midway between an excitation coil and a detection coil spaced at a distance d(tltltd) A sinusoidal
current I of angular frequency ω flows in the excitation coil and produce a magnetic field B The
magnetic field matches in phase a reference voltage (Vr) in the excitation coil The non-magnetic
cylinder has conductivity ζ and relative permittivity εr The skin depth δ is assumed to be much
greater than t which means that the attenuation produced by the cylinder is small We use spherical
polar coordinates(r θ) as shown in Figure 1
Figure 1Magnetic field in a cylinder due to an excitation coil (shown in polar coordinates) The
cylinder of radius R and thickness t is placed centrally and midway between a small excitation coil and
a small sensing coil spaced a distance d The cylinder has conductivity ζc relative permittivity εc and
is non-magnetic
According to Griffiths et al [15] at a point P in the cylinder model the magnetic vector potential
∆119861
119861= 1205961205760120576119903 minus 119895120590
12059612058301199051198893
16
1
11990302 minus
11990302+21198772
(11990302+1198772)2
(1)
The magnetic field and its perturbation can be obtained from the voltages induced in the detection coil
Vi and Vi [16] Hence BB can be defined in terms of the induced voltage in the detection coil
[16] by
120549119861
119861=
120549119881119894
119881119894 (2)
t
r r0
θ
VE
VI
R
Bz Bθ
Br
εr σ
First Latin-American Conference on Bioimpedance (CLABIO 2012) IOP PublishingJournal of Physics Conference Series 407 (2012) 012014 doi1010881742-65964071012014
3
We define a constant k
119896 = 1205830119905119889
3
16
1
11990302 minus
11990302+21198772
(11990302+1198772)2
(3)
Substituting (3) and (2) into (1) the phase of the total induced voltage Vi in the detection coil with
respect to the induced voltage by the primary magnetic field could be expressed as a function of
frequency and electrical parameters in the cylinder between the coils [15]by
120579119881119894 = 119886119903119888119905119892 119868119898 ∆119881
119881+119877119890 ∆119881 = 119886119903119888119905119892(
minus119896120596120590
11989612059621205760120576119903+1) (4)
The phase of the reference voltage Ve in the presence of the cylinder sample can be estimated
from the following expression [11]
Im( )
[ ]
Re( )
L L
out L LVe
L L
out L L
Z Z
Z Z Zarctg
Z Z
Z Z Z
(5)
Where LZ represents the impedance of the excitation coil outZ represents the output impedance
of the excitation source The total change in phase shift ( ) between the reference and induced
voltages in the excitation and sensing coil respectively is given by the expression
Vi Ve (6)
22 Surgical procedure
A rabbit (38kg) were anaesthetized with urethane (255mlkg) via ear vein We establish the
model of ACH by means of stereotactic method The coordinates for the brain were determined using
a standard atlas [17] A short midline skin incision was made and the point for a stereotactic approach
through the skull determined The head was leveled in such a way that the bared Bregma was 15mm
higher than Lambda With the position of Bregma as a reference point the coronal zero planes (AP0)
passed through the coronal suture A1 referred to the coronary plane which was 1 mm before AP0
while P1 was 1mm after AP0 The scope of the internal capsule was between A5 and P2 We chose
coronary plane P1 Puncture point is on the right of the coronal suture(R=6mm) and after the sagittal
suture (P1 AP=1mm) A 1mm drill bit was twisted by hand to perforate the skull A needle (d=07mm)
was then introduced to the proper depth (H=13mm) and autologous blood slowly injected From 04 to
52 ml of autologous blood was injected RM 6280B biological signal collecting and processing
system was used to measure the changes of ICP and APP of paracele [18] and HRV As shown in
Figure2 rabbits were operated to monitoring ICP APP and HRV
First Latin-American Conference on Bioimpedance (CLABIO 2012) IOP PublishingJournal of Physics Conference Series 407 (2012) 012014 doi1010881742-65964071012014
4
Figure2 Rabbit model
23 Experimental magnetic induction prototype
An experimental inductive setup was designed and constructed The system consists of seven modules
signal generator excitation coil detection coil phase detector PC and biological signal collecting
and processing part A picture of the experimental set-up is shown in Figure 3
Figure3 Experimental setup for detection of cerebral hemorrhage in rabbits
with magnetic induction
231 Signal generator
The function generator was implemented by a signal generator which supplies a signal I cos(ωt) of
approximately 5v at 107MHz The range of output power from the excitation source is 15~33dB The
frequency stability is the order of magnitude of 10-4
the distortion reaches 10-2
~10-4
and the SNR is
30~60dB in the excitation source
232 The coils
The excitation and detection coils were coaxially placed Both coils were ten turns with radius r = 5
cm The distance between coils was d=11 cm To avoid inductive pickup the leads of the coils were
twisted The excitation coil induces a current in the detection coil by magnetic induction and an
First Latin-American Conference on Bioimpedance (CLABIO 2012) IOP PublishingJournal of Physics Conference Series 407 (2012) 012014 doi1010881742-65964071012014
5
inductive phase shift as a function of the electrical properties of the rabbit brain
233 Phase detector
The phase detector includes the band-pass filter amplifier AD FDGA DSP flash memory and LCD
The phase detector can be calibrated and the temperature drift and the noise can be eliminated by
calibration software The parameters of our phase detector are as follows the range of the phase
measurement 0~1800 the phase precision 005
0 the range of gain -10~35dB once measurement
time 3~7s The 12h data measured can be saved in the phase detector
234 Biological signal collecting and processing part
The data processing part (6280C Chengdu Instrument Factory) was controlled by a personal computer
24 Experimental design
Figure 4 Work flow diagram
Figure4 shows a work flow diagram of the experimental prototype ICP APP ECG and phase shift
were synchronously collected for the comparison of measured results In a typical procedure baseline
data were taken after the surgical procedure (t = 0) Signals were continuously monitored for 15h
Autologous blood was injected from 08 to 24 ml (Each injection quantity of 08 ml the interval time
for 30 minutes) When each 08ml blood was injected the phase detector measured the phase shift for
30 minutes and got 500 data We choose 10 stable and continuous measurements of phase shift before
Signal Generator
Physiological Signal Collection
Device
r
Rabbit
Excitation
Coil
Detection Coil
Phase Detector
PC
Phase
Shift
ICP
ECG
ICP APP
Signal Generator
Physiological Signal Collection
Device
r
Rabbit
Excitation
Coil
Detection Coil
Phase Detector
PC
Phase
Shift
ECG
First Latin-American Conference on Bioimpedance (CLABIO 2012) IOP PublishingJournal of Physics Conference Series 407 (2012) 012014 doi1010881742-65964071012014
6
next injection ICP APP and HRV were processed according to the 10 measurements of phase shift
And then each data set was averaged
The values of the phase shift changes were recorded with respect to baseline measurements
taken after the procedure Experimental excitation and detection coils are coaxial placed around the
brain cavity of the rabbits In all the experiments the coils were placed in such a way that the brain
cavity was centered between the excitation and detection coils Changes in phase shift as a function of
the injection volume were recorded The fundamental hypothesis in this study is that the changes in
phase shift measured with the detection coil will be representative of the changes in electrical
conductivity of the brain
The Animal Experiments and Ethical Committee of the Institution approved all experimental
protocols and the care of animals was carried out in accordance with the Declaration of Helsinki and
IASP guidelines [19 20]
3 Results and discussion
Figure 5Relationship curves of intracranial pressure and inductive phase shift from
rabbit brain hematoma model
Figure 5 showed relationship curves of ICP APP HRV and phase shift from rabbit brain
hemorrhage model at exciting frequency 107MHz
Along with the increase of injection quantity the changes of phase shift also increased The phase
shift curversquos slope was stable Our study told us magnetic induction theory was reliable and our
system can detect a small amount of bleeding in the brain ICP were directly proportional to phase
shift while HRV were stable around 200beatsmin-1
So the changes of phase shift reflected the
0h 05h 1h 15h
0
005
01
015
02
025
03
035
04
0
50
100
150
200
250
0 08 16 24
Phase Shift(degrees)
HRV(beatsmin)CPP(mmhg)APP(mmhg)ICP(mmhg)
Injection Volume(ml)time(h)
HRV
CPP
ICP
APP
PS
First Latin-American Conference on Bioimpedance (CLABIO 2012) IOP PublishingJournal of Physics Conference Series 407 (2012) 012014 doi1010881742-65964071012014
7
changes of ICP
Figure 5 also showed the change rate of ICP and phase shift were not identical Reasons are as
following First the collection of ICP and phase shift is not completely in sync Second manual
injection brought error Third injection intervals were short (only for 30 minutes) so CBF (cerebral
blood flow) and CSF (cerebrospinal fluid) regulatory function were not considered As compared to
this CBF was reduced both around the hemorrhage and in the surrounding brain and this change was
strongly volume-dependent and was not accompanied by significant alterations in CPP [21]Fourth
the animal moved in the experimental process In future we must optimize our system to ensure
synchronous collection and use injection pump to avoid artificial error
Also we may take long term monitoring up to 12h above The coils inductance and electrical
conductivity of rabbit brain were not calculated Due to time restrictions sample number was too
small and had no control group Further development aims at contrast research
This was an early experiment and had many drawbacks But this was the first study to reveal the
relationship between the ICP and change of phase shift by animal experiment A comparison of the
analytical and experimental results with respect to othersrsquo previous studies [12 13] suggests that
various physiological conditions in the brain such as oedema and ischaemia can be distinguished
through the analysis of the inductive phase shift change at specific frequencies In this study the
curves of inductive phase shift are significantly related to ICP This observation suggests that the
method could be valuable for early warning in emergency medicine and critical care units in addition
to continuous monitoring
4 Conclusion
Measuring the magnetic induction phase shift changes as a function of time after brain injury has the
potential for being a simple method for early and non-contact detection of the occurrence and progress
of cerebral hemorrhage in the bulk of brain This technique could be useful in both research and
clinical applications in particular for low economical resources areas of the world This is a
preliminary study and much more research remains to be done to confirm these observations
Although the experimental evidence provided in this study has relevance to the clinical case the
cerebral hemorrhage formation in clinical practice is a more complex process than the experimental
model evaluated in this study
5 Acknowledgments
This work was supported by Foundation of Third Military Medical University and National Natural
Science Foundation of China (61072254)
6 References
[1] Lighthall W J 1988 Controlled cortical impact a new experimental brain injury model J
First Latin-American Conference on Bioimpedance (CLABIO 2012) IOP PublishingJournal of Physics Conference Series 407 (2012) 012014 doi1010881742-65964071012014
8
Neurotrauma5 1ndash15
[2] Chelsea S Kidwell Julio A Chalela Jeffrey L Saver 2004 Comparison of MRI and CT for
Detection of Acute Intracerebral Hemorrhage JAMA 292(15) 1823-1830
[3] Otten D M Onik G and Rubinsky B 2004 Distributed network imaging and electrical impedance
tomography of minimally invasive surgery Technol Cancer Res Treat 3 1ndash10
[4] Granot Y Ivorra A and Rubinsky B 2008 A new concept for medical imaging centered on
cellular phone technology PlosOne 3 2075
[5] Tarjan P and McFee R 1968 Electrodeless measurements of the effective resistivity of the
human torso and head by magnetic induction IEEE Trans Biomed Eng 4 266ndash78
[6] Foster K R and Schwan H P 1989 Dielectric properties of tissues and biological materials a
critical review CRC Crit Rev Biomed Eng 17 25ndash104
[7] Al-Zeiback N S 1993 A feasability study of in vivo electromagnetic imaging Phys Med Biol
38 151ndash60
[8] Korjenevsky A V and Cherepenin V A 1997 Magnetic induction tomography J Commun
Technol Electron 42 469ndash74
[9] Korjenevsky A V and Cherepenin V A 1999 Progress in realization of magnetic induction
tomography Ann N YAcad Sci 873 346ndash52
[10] Griffiths H 2001 Magnetic induction tomography Meas Sci Technol 12 1126ndash31
[11] Gonzalez C A 2009 The detection of brain ischaemia in rats by inductive phase shift
spectroscopy Physiol Meas 30 809ndash819
[12] Gonzalez C A and Rubinsky B 2006 A theoretical study on magnetic induction frequency
dependence of phase shift in oedema and haematoma Physiol Meas 27 829ndash38
[13] Gonzalez C A and Rubinsky B 2006 Detection of brain oedema with frequency dependent
phase shift electromagnetic induction Physiol Meas 27 539ndash52
[14] Rojas R Rubinsky B and Gonz alez C A 2008 The effect of brain hematoma location on
volumetric inductive phase shift spectroscopy of the brain with circular and magnetron
sensor coils a numerical simulation study Physiol Meas 29 S255ndashS266
[15] Griffiths H Steward W R and Gough W 1999 Magnetic induction tomographymdasha measuring
system for biologicalmaterials Ann New York Acad Sci 873 335ndash45
[16] Scharfetter H Casa˜nas R and Rosell J 2003 Biological tissue characterization by magnetic
induction spectroscopy(MIS) requirements and limitations IEEE Trans Biomed Eng 50
870ndash80
[17] Sawyer CH Everett JW Green JD 1954 The rabbit diencephalon in stereotaxic coordinates J
Comp Neurol 101 801-824
[18] Wl Jing 2007 Study on the model building of internal capsule hemorrhage and the changes of
intracranial pressure and discharge of vagus nerve in rabbits shanxi medical journal 361
First Latin-American Conference on Bioimpedance (CLABIO 2012) IOP PublishingJournal of Physics Conference Series 407 (2012) 012014 doi1010881742-65964071012014
9
[19] Helsinki 1996 Declaration of Helsinki Br Med J 313 1448ndash9
[20] ZimmermannM1983 Ethical guidelines for investigations of experimental pain in conscious
animals Pain 16 109ndash10
[21] Fredric P NATH FRCS et al 1986 Early hemodynamic changes in experimental
intracerebral hemorrhage J Neurosurg 65 697-703
First Latin-American Conference on Bioimpedance (CLABIO 2012) IOP PublishingJournal of Physics Conference Series 407 (2012) 012014 doi1010881742-65964071012014
10
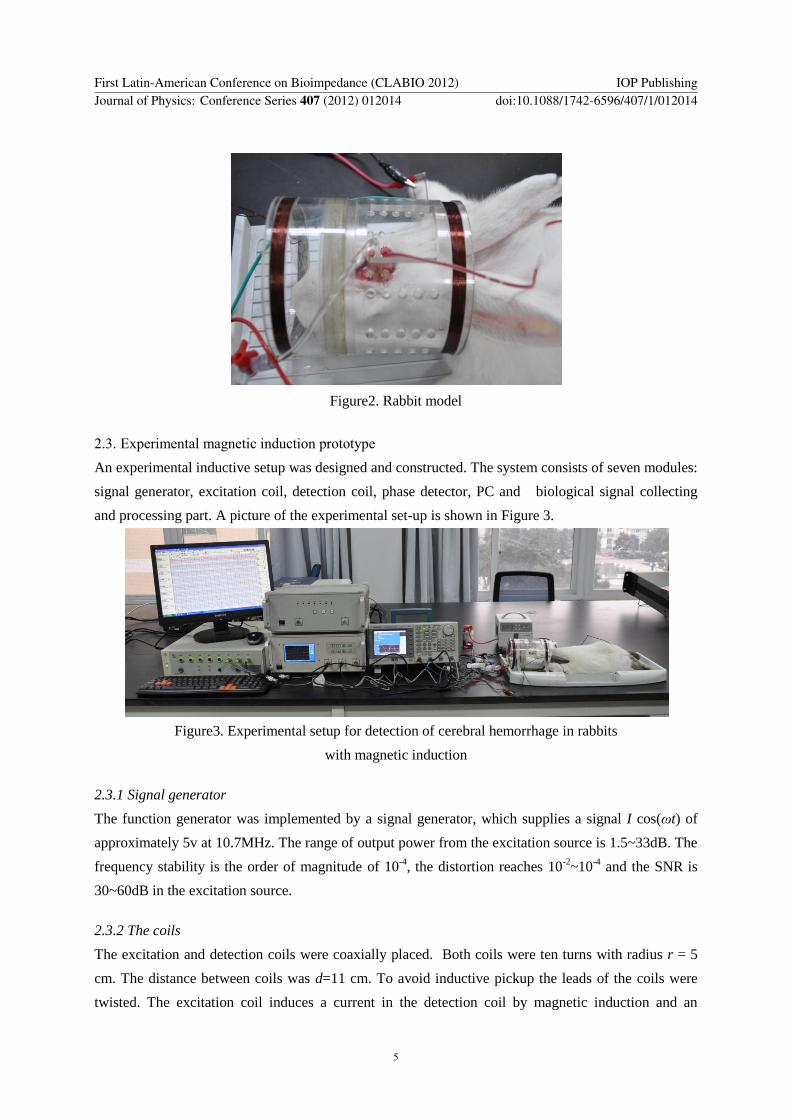
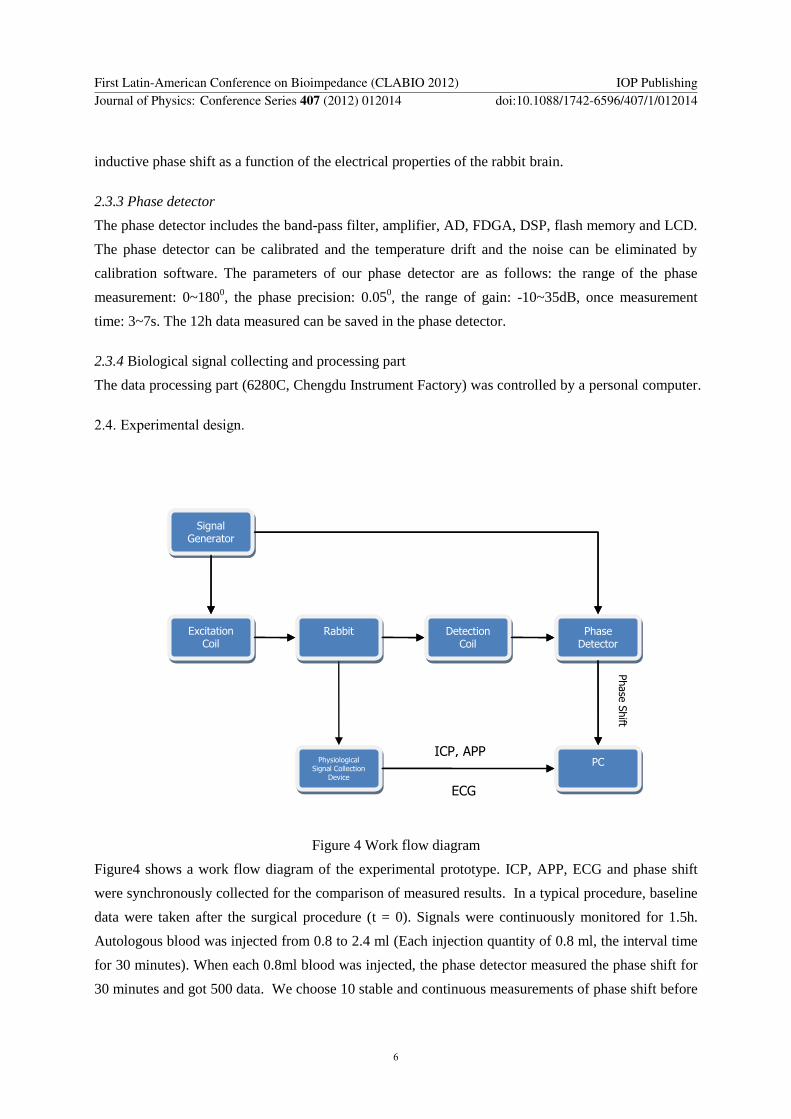
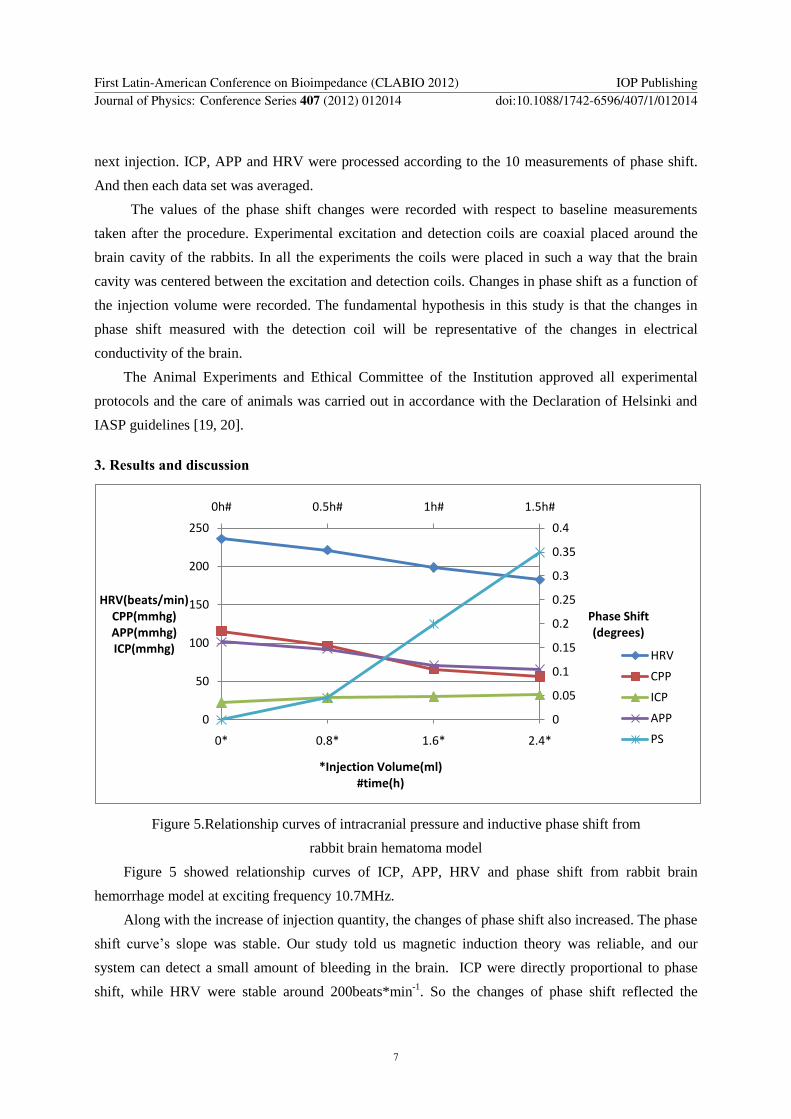