Embed Size (px)
Citation preview

Retrospective Theses and Dissertations Iowa State University Capstones, Theses andDissertations
1976
The design of a microprocessor-controlledvectorcardiographic systemAnil Kumar SahaiIowa State University
Follow this and additional works at: https://lib.dr.iastate.edu/rtd
Part of the Biomedical Engineering and Bioengineering Commons
This Dissertation is brought to you for free and open access by the Iowa State University Capstones, Theses and Dissertations at Iowa State UniversityDigital Repository. It has been accepted for inclusion in Retrospective Theses and Dissertations by an authorized administrator of Iowa State UniversityDigital Repository. For more information, please contact [email protected].
Recommended CitationSahai, Anil Kumar, "The design of a microprocessor-controlled vectorcardiographic system " (1976). Retrospective Theses andDissertations. 5701.https://lib.dr.iastate.edu/rtd/5701

INFORMATION TO USERS
This material was produced from a microfilm copy of the original document. While
the most advanced technological means to photograph and reproduce this document
have been used, the quality is heavily dependent upon the quality of the original
submitted.
The following explanation of techniques is provided to help you understand markings or patterns which may appear on this reproduction.
1.The sign or "target" for pages apparently lacking from the document photographed is "Missing Page(s)". If it was possible to obtain the missing page(s) or section, they are spliced into the film along with adjacent pages.
This may have necessitated cutting thru an image and duplicating adjacent pages to insure you complete continuity.
2. When an image on the film is obliterated with a large round black mark, it
is an indication that the photographer suspected that the copy may have
moved during exposure and thus cause a blurred image. You will find a
good image of the page in the adjacent frame.
3. When a map, drawing or chart, etc., was part of the material being
photographed the photographer followed a definite method in
"sectioning" the material. It is custo,,.»; / to begin photoing at the upper
left hand corner of a large sheet and to continue photoing from left to
righi in equal sections with a small uverlâp. if necebSâry, secuoniiiy is
continued again - beginning below the first row and continuing on until
complete.
4. The majority of users indicate ihat the textual content is of greatest value,
however, a somewhat higher quality reproduction could be made from
"photographs" if essential to the understanding of the dissertation. Silver prints of "photographs" may be ordered at additional charge by writing the Order Department, giving the catalog number, title, author and
specific pages you wish reproduced.
5. PLEASE NOTE: Some pages may have indistinct print. Filmed as
received.
Xerox University Microfilms 300 North Zeeb Road Ann Arbor, Michigan 48106

77-1476
SAHAI, Anil Kumar, 1951-THE DESIGN OF A MICROPROCESSOR-CONTROLLED VECTORCARDIOGRAPHIC SYSTEM.
Iowa State University, Ph.D., 1976 Engineering, biomedical
Xerox University ivilcrofilms, Ann Arbor, Michigan 48106
© Copyright by
ANIL KUMAR SAHAI
1976

The design of a microprocessor-controlled
vectorcardiographic system
by
Anil Kumar Sahai
A Dissertation Submitted to the
Graduate Faculty in Partial Fulfillment of
The Requirements for the Degree of
DOCTOR OF PHILOSOPHY
Major: Biomedical Engineering
Approved:
In Charge of Major Work:
Professor-1n Professor-1n-Cftarge Program in Biomedical Engineering
For the Gradate ColTege
Iowa State University Ames, Iowa
1976
Copyright Anil Kumar Sahai, 19/6. All rights reserved.
Signature was redacted for privacy.
Signature was redacted for privacy.
Signature was redacted for privacy.

i l
TABLE OF CONTENTS
Page
INTRODUCTION 1
Vectorcardiography 1
Microprocessors 7
REVIEW OF LITERATURE 10
Introductory Remarks 10
Comparison of Lead Systems 14
Comparison of ECG and VCG in Diagnostic Procedures 15
Recording Techniques 16
SYSTEM DESIGN 18
Hardware 18
Software 30
SIMULATION 47
CONCLUSION 72
DU'PCDU"Mri-C; 7A
ACKNOWLEDGMENTS 78
1
INTRODUCTION
A microprocessor could be a very effective tool in the development of
complex medical instruments. The research described in this dissertation
deals with the design of a microprocessor-based vectorcardiographic sys
tem. The microprocessor is used to control the analog-to-digital and
digital-to-analog conversion and to do some arithmetic to display a
selected part of the vectorcardiogram on a cathode ray tube.
Vectorcardiography
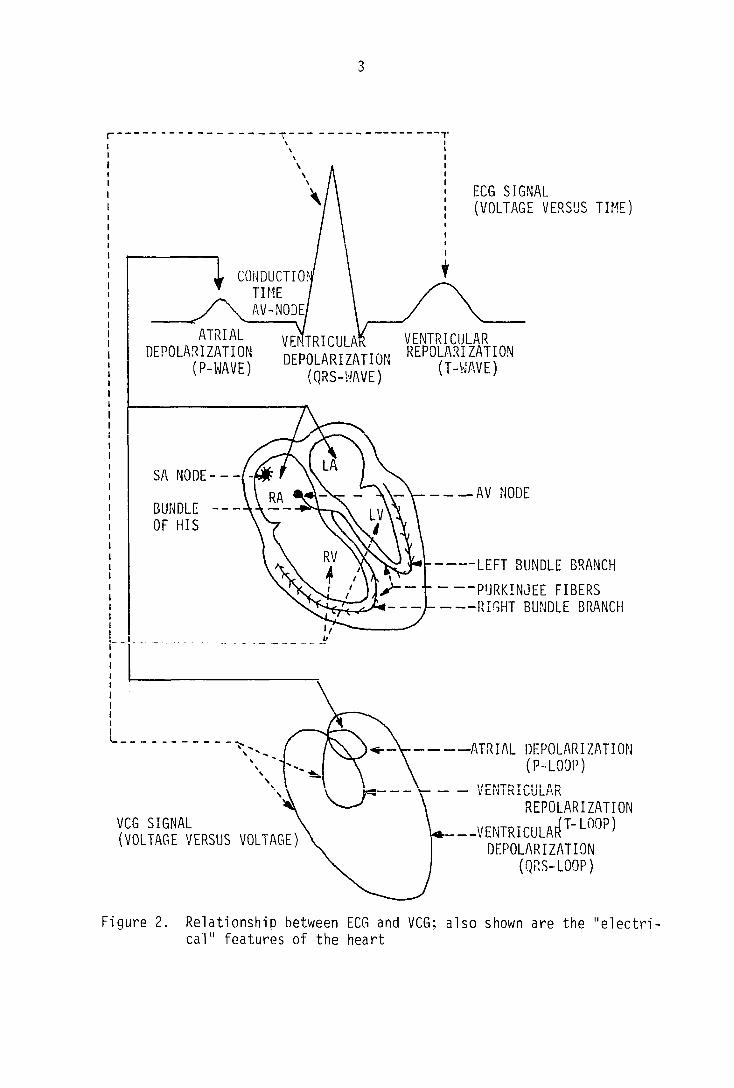
A vectorcardiogram (VCG) can be best described as a projection of a
spatial loop (that is generated by the tips of the mean instantaneous
cardiac vectors) in three mutually orthogonal planes.
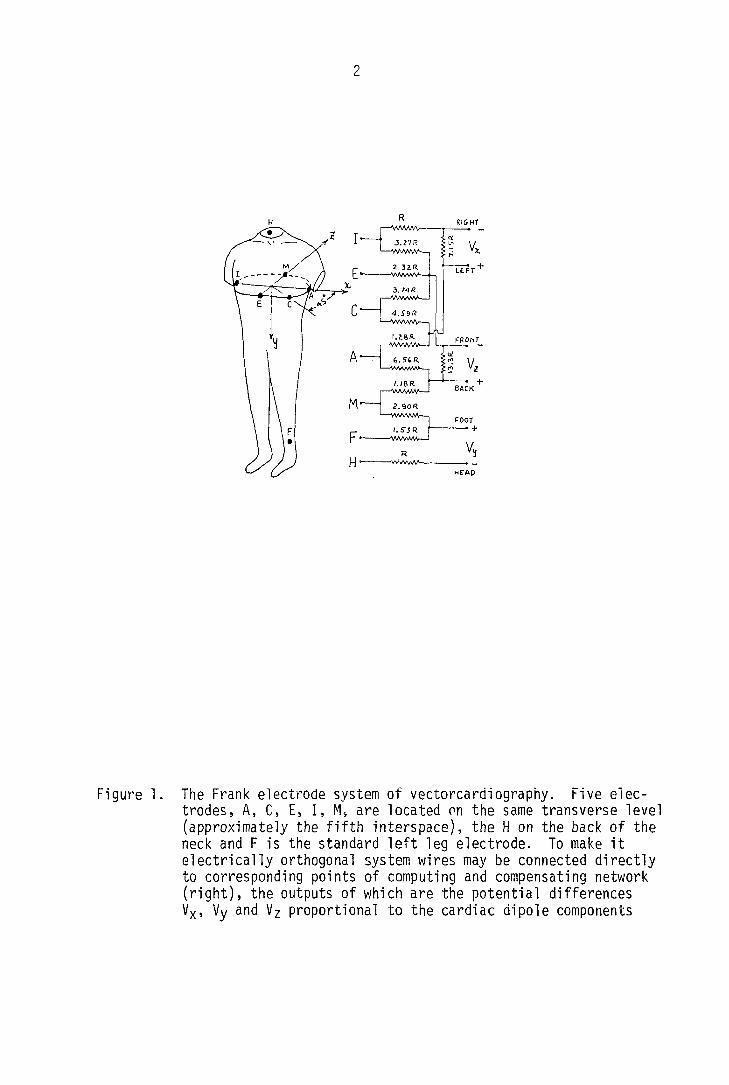
The VCG is recorded by placing multiple electrodes (6-14) on the body
to obtain the x, y and z components of the mean instantaneous cardiac
vectors. See Figure 1. When two of the three x, y, and z components are
plotted dyàirist each other, or.e can obtain the VCG in three orthogonal
planes (xy, xz and yz for the frontal, the transverse and the sagittal
plane, respectively). The two-dimensional pictures so obtained consist
of three different loops--the P loop, the QRS loop and the T loop. See
Figure 2. These loops correspond, respectively, to the loci of the mean
instantaneous cardiac vectors produced during atrial depolarization,
ventricular depolarization and ventricular repolarization.
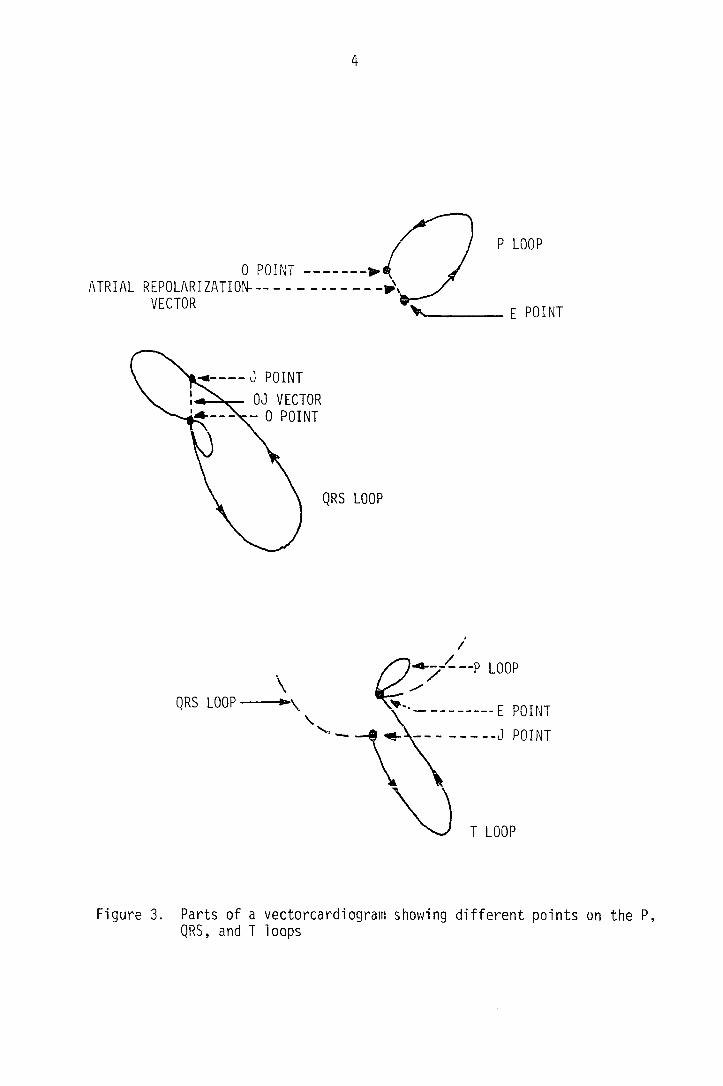
As shown in Figure 3, the P loop starts at the E point (isoelectric
point) and ends at 0 point, which is located superiorly, slightly
2
RIGHT
FRONT
BACK
'VVvVwV--
HCAD
Figure 1. The Frank electrode system of vectorcardiography. Five electrodes, A, C, E, I, M, are located on the same transverse level (approximately the fifth interspace), the H on the back of the neck and F is the standard left leg electrode. To make it electrically orthogonal system wires may be connected directly to corresponding points of computing and compensating network (right), the outputs of which are the potential differences Vx, Vy and Vz proportional to the cardiac dipole components
3
; CONDUCTIO TIME AV-NODE,
ATRIAL DEPOLARIZATION
(P-WAVE)
ECG SIGNAL (VOLTAGE VERSUS TIME)
VEMTRICULA DEPOLARIZATION
(QRS-IJAVE)
VENTRICULAR REPOLARIZATION
(T-WAVE)
AV NODE SA NODE
BUNDLE OF HIS
LEFT BUNDLE BRANCH
PURKINJEE FIBERS RIGHT BUNDLE BRANCH
VCG SIGNAL (VOLTAGE VERSUS VOLTAGE)
—ATRIAL DEPOLARIZATION (P-LOOP)
— VENTRICULAR REPOLARIZATION
^__VENTRICULA^T-LOOP) DEPOLARIZATION
(QRS-LOOP)
Figure 2. Relationship between ECG and VCG; also shown are the "electrical" features of the heart
4
0 POINT ATRIAL REPOLARIZATION-
VECTOR
P LOOP
E POINT
J POINT OJ VECTOR
— 0 POINT
QRS LOOP
QRS LOOP \
"y P LOOP
E POINT
J POINT
T LOOP
Figure 3. Parts of a vectorcardiogram showing different points on the P, QRS, and T loops

5
posteriorly and rightward with respect to the E point. The vector OE from
the 0 point to the E point represents atrial repolarization. This loop
has not been used very much clinically because it gets "buried" under the
QRS loop. (The P wave amplitude is 0.06 ± 0.03 millivolts compared to a
QRS wave amplitude of 1.17 ± ,30 millivolts in lead x. Draper et al.,
1964). The QRS loop starts at point 0 and ends either at point 0 or point
J. If the loop ends at point J, i.e., an open QRS loop, it indicates that
ventricular repolarization started before the ventricular resting electri
cal state was achieved. It is primarily this loop that has been analyzed
in clinical vectorcardiographic studies. The following criteria to study
QRS loop are used.
a) The direction, size, and speed of inscription of the loop. (The
latter is related to the speed of ventricular depolarization.)
b) The configuration of the loop.
c) The magnitude and direction of the mean instantaneous cardiac
vectors, occurring at 10 milliseconds, 20 milliseconds, and 30 milli
seconds intervals.
d) The length of the OJ vector, if it exists.
The T loop, which starts at the 0 or the J point and ends at the E
point, represents ventricular repolarization.
The acceptance of vectorcardiography as a diagnostic tool has been
retarded because it involves mathematical (vector analysis) and biophysi
cal concepts. The widespread use of vectorcardiography has been hampered
by high equipment costs, the lack of a standard lead system (as in
electrocardiography) and the normally unclear presentation of different

6
loops and vectors. Wartak (1970) states:
Even in the academic world, and to a much greater extent outside it, the spread of understanding (of vectorcardiography) has been confined to a relatively small group of experts. This condition is unfortunate, in the sense that it greatly limits the use of this valuable technique in medical research and practice.
According to Oram (1971), vectorcardiography has been proven to be
very helpful in diagnosing cardiac abnormalities such as: a) the detec
tion of right ventricular hypertrophy when the electrocardiogram is normal
or equivocal; b) the differentiation of left bundle branch block from left
venticular hypertrophy; c) the detection of underlying right ventricular
hypertrophy in the presence of right bundle branch block; d) the detection
of posterior cardiac infarction; and e) the detection of underlying
anterior and posterior cardiac infarction in the presence of right bundle
branch block.
The difficulty in obtaining clearly displayed loops has been the
major cause for the lack of growth of this technique. Presently existing
conventional (analog) vectorcardiographic equipment does not provide a
stationary two-dimensional picture. It is difficult to look at just the
P, QRS, or T loops by themselves. Also, the different time intervals of
different loops and the exact amplitudes of the maximal vectors are not
automatically displayed or calculated.
The research described in this dissertation is involved with the
design of a vectorcardiographic system which will detect and store the P,
QRS, and the T loops in three orthogonal planes and will display an
individual x-y, x-z, or y-z graph of the same sample on a cathode ray tube
under the control of a microprocessor. The display will be stationary.

7
This kind of dedicated microcomputer-aided analysis will prove itself to
be very helpful in the field of cardiology.
Microprocessors
The single-chip microprocessor (defined later) was first introduced
in early 1970 and was the first real general purpose large-scale inte
grated circuit (LSI) logic device. Before the microprocessor was intro
duced a designer had a choice to use either random logic (flip flops,
shift registers, counters, etc.) or a minicomputer programmed to his de
sign requirements. The random logic gave only a dedicated system for the
specific requirement. Other problems of random logic systems included
increased space and power dissipation and "breadboarding" was always
necessary before finalizing the design. Modifications could be achieved
only by wiring changes along with additional components.
The introduction of the minicomputer alleviated the problem of bread-
boarding, and modification complications, but brought with it a higher
cost. The microprocessor allowed a new and easier way to accomplish the
same design. Software implemented logic, few number of IC's (integrated
circuits), and low power supply requirements are a few of the advantages
of a microprocessor (Electronics, 1976).
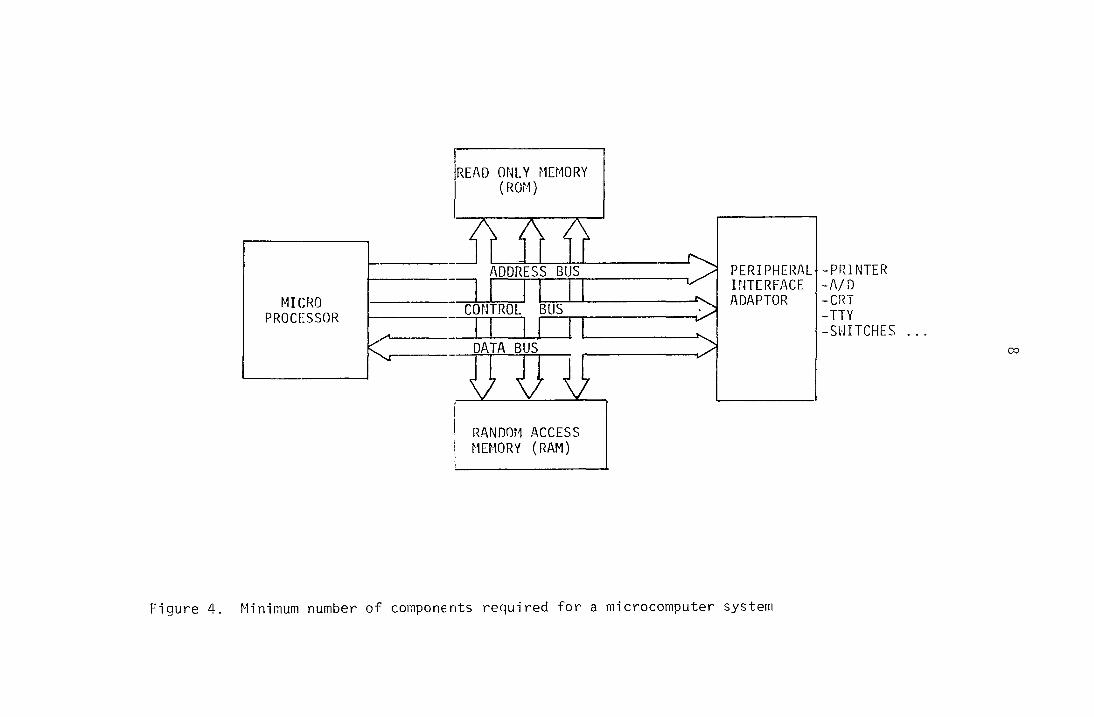
Well then, what is a microprocessor? A microprocessor is the control
and processing unit of a microcomputer. So for a simple microcomputer one
would need a microprocessor, a random access memory (RAM), a programmable
read only memory (PROM) and some kind of I/O (input/output) interface.
Figure 4 shows a basic microprocessor scheme. The RAM is used for
MICRO PROCESSOR
READ ONLY MEMORY
SS BUS
CONTROL
)ATA B
RANDOM ACCESS MEMORY (RAM)
PERIPHERAL INTERFACE ADAPTOR
-PRINTER -A/D -CRT -TTY -SWITCHES
CO
Figure 4. Minimum number of components required for a microcomputer system

9
temporary data and/or program storage, the PROM is used to store the in
structions for the microprocessor (i.e., the program), and the interface
adaptors provide the necessary timing and controlling and conversion
signals for "outside world" devices.

10
REVIEW OF LITERATURE
Introductory Remarks
The process of depolarization and repolarization of the cardiac
muscle during each cardiac cycle can be broken into many time intervals,
and each interval can be represented by a resultant cardiac dipole or
vector. When a dipole is placed in a conductive medium (volume con
ductor), currents are established throughout the whole medium. The poten
tials at the body surface due to these currents were first recorded by
Waller (1889). Einthoven et al. (1950) studied ventricular depolarization
in a plane parallel to the anterior surface (the frontal plane). This
study was the birth of modern electrocardiography. To justify these re
cordings, Einthoven et al. (1950) introduced many simplifying assumptions
about the human torso, such as:
1) The human torso can be regarded as a sphere, with the dipole
located in the center. The dipole is fixed and not displaced by the
action of the heart.
2) The electrical conductivities of various body tissues (lungs,
muscle, etc.) are uniform, that is, isotropic and homogeneous.
3) The heart can be represented by a mathematical dipole of variable
strength and variable axial orientation, i.e., a vector quantity, (liow-
ever, Einthoven called it manifest potential, a scalar quantity.)
4) The left and right arms and the left leg are equally spaced in the
frontal plane, through the center of the sphere--an equilateral triangle,
"the schema" with its geometric center at the center of the circle.

11
This working hypothesis, despite the drawbacks in its assumptions, has
grown into a universally used system because of the simplicity involved
in its use.
The concept of a vector loop was first introduced by Mann (1920). He
manually plotted the locus of the tips of the instantaneous QRS and T
vectors and thus obtained a recording which he called the monocardiogram.
He later showed the value of the monocardiogram (recorded in the frontal
plane from Einthoven's Lead I and Lead II) in diagnosing bundle branch
block, which was difficult to diagnose in the standard electrocardiograph
ic recording at that time (Mann, 1931).
Mann's recordings were made using a galvanometer. The introduction
of the cathode ray tube (CRT) in electrocardiographic procedures was a
major breakthrough which increased the popularity of vectorcardiography.
The CRT made it easier to record cardiac potentials as projected in three
different leads. The use of a CRT to record VCGs was first shown in this
country by Wilson and Johnston (1938). These investigators used
Einthoven's triangle and its geometrical central terminal to display the
voltage of the Lead I electrodes versus the voltage between the left leg
and the central electrode. They called this recording the vectorcardio
gram, a name which is most commonly used for a display made from two sets
of electrical axes.
The development of vectorcardiography has brought with it the reali
zation that Einthoven's postulates were inadequate. The theory behind the
potential generated by a dipole is based on the assumptions that the di-
pole is surrounded by an isotropic and homogeneous volume conductor and

12
that the distance between the recording electrode and the dipole is very
large compared to the magnitude of the dipole vector. Some of these
assumptions as used by Einthoven are not true for the human body
(Schaffer, 1956).
Burger and van Milaan (1946, 1947, 1948) were the first to question
the validity of Einthoven's hypotheses. They were also the first ones to
introduce the concept of a "lead vector" (sometimes called Frank's image
vector or Schmitt's transfer impedance). These investigators modified the
Einthoven frontal plane "schema". They constructed a human torso model
and filled it with copper sulfate to get a homogeneously conductive
medium. By implanting a physical dipole in the position of the heart they
studied the potential difference between the sites where the right arm,
left arm and left leg would attach to the torso. The results obtained
were altogether different from the ones predicted by using Einthoven's
triangle. From this model they also constructed three vectors to form a
triangle (Burger's triangle) having angles of 96° at the right arm, 56°
at the left arm and 28° at the left leg.
Burger and van Milaan (1946, 1947, 1948) also studied a model in
which they introduced inhomogeneities for the lungs and the spinal column.
From the results of homogeneous and inhomogeneous models they concluded
that front plane tissue inhOmogeneities may not play an important role in
altering body surface potentials. These investigators also concluded that
the pattern of the current field generated by the cardiac dipole depends
not only on the cardiac vector but also on the size and shape of the body
and the conductivities of the various tissues of the body.

13
A cadaver was used by den Boer (1952) to study the effect of in-
homogeneous tissues on the potentials recorded at the body surface. He
also did not find any variations from the homogeneous model. The concept
that an electrical lead is a vector quantity was a significant contribu
tion to the development of vectorcardiography.
The three-dimensional cardiac vectors can be reconstructed by re
cording their components in three orthogonal axes. Different positions of
electrodes to form anatomically orthogonal axes have been studied (Wilson
et al., 1947; Grishman and Scherlis, 1952). Wilson et al. (1947) de
veloped an equilateral tetrahedral lead system by using an electrically
driven dipole in a cadaver's heart. Since the recorded voltage levels
were in agreement with the theoretical values, this electrode system
gained considerable support at that time.
Vectorcardiographers continued to search for a lead system which would
reduce the variation of loops for normal individuals and be relatively
insensitive to the location of the dipole. McFee and Johnston (1953,
1954a,b) derived a corrected lead-field theory and postulated that the
error caused by multiple dipoles or by a shift in a single dipole could be
minimized by using a multiple electrode system instead of a two electrode
system. This lead theory provided an electrically orthogonal system as
compared to the anatomically orthogonal lead system studied before. Leads
which are insensitive to the location of the dipole increase the accuracy
of the assumption that the equivalent cardiac vector has a fixed location.
Schmitt and Simonson (1955) developed a 14-electrode system which is
commonly referred to as the SVEC III system. This system did not gain

14
much popularity because of the number of electrodes needed and theirrepro-
ducibility of vectorcardiogram measurements. The lead system designed by
Frank (1954a,b, 1955, 1956) uses seven electrodes. This is the most com
monly used electrode system because the placement of the electrodes is
simple and the vector loops are reproducible. McFee and Parungao (1961)
designed a nine-electrode axial lead system. This system has not been
clinically used as much as Frank's lead system.
Comparison of Lead Systems
All of the anatomically and electrically orthogonal lead systems have
been compared by different researchers. Frank (1954a,b) was the first to
compare the Duchosal-Sulzer double cube, Wilson's tetrahedral, and the
Grishman cube array lead system. Frank and Kay (1954), like Burger and
van Milaan, also used a torso model filled with electrolyte. They showed
that the scalar lead shapes obtained from the tetrahedral lead system
deviated an average of approximately 15% from the torso dipole variations,
but that the scalar lead system of Duchosal and Grishman show signifi
cantly larger discrepancies.
Abildskov and Pence (1956) compared data obtained from the Wilson's
(1947) tetrahedral lead system with that obtained from the corrected tetra
hedral lead system, as suggested by McFee and Johnston (1954a,b). In 75
subjects, they found that although the data were similar in both methods,
the corrected lead system showed less variance. A study made by Schmitt
(1957) to compare the Frank, SVEC III, and Duchosal-Sulzer lead systems,
points out chat the standard deviation from the mean of the SVEC III
15
system is 10.2, 3.0 and 4.0% compared to the values from Frank's lead
system of 15.2, 6.9 and 16.5% for x, y and z leads, respectively. This
compares with 20.4, 12.3 and 14.2% for limb Leads I, II and III, re
spectively.
Langer et al. (1958) compared the four electrically orthogonal lead
systems designed by Schmitt and Simonson (1955), Frank (1956), McFee and
Johnston (1954a,b) and Helm (1957). Out of 60 cases, for 90% of the
cases, the four lead systems were interchangeable in the z lead with re
gard to shape and the orientation of the QRS and T waves. For the x lead,
in 24 subjects, the systems were interchangeable for the QRS wave in all
cases and for the T wave in 90% of the cases. For the y lead they did not
find any difference in shape but only a slight difference in amplitude.
More recently Horcek (1971) compared the McFee and Parungao (1961)
SVEC III and Frank (1956) lead system in regards to tissue inhomogeneities
using Burger's image surface (Burger and van Milaan, 1946). He concluded
that the McFee and Parungao lead system gave the best overall performance
and the Schmitt's SVEC III lead system, the second best. Frank's lead
system was considered less satisfactory.
Comparison of ECG and VCG in Diagnostic Procedures
Simonson eL al. (1966) did a study in which they compared ECG and VCG
results in literature that was published up to September 1, 1965. Out of
33 articles, the authors claim superiority of VCG in 28 and superiority of
ECG in five. This comparative study also showed that the results were
overwhelmingly in favor of VCG when right ventricular hypertrophy, left
16
ventricular hypertrophy and myocardial infarction were diagnosed. Also,
at one point, the authors claimed that, "the results were in so much favor
of the VCG that from a clinical point of view there was no need of a
corrected orthogonal lead system."
Wolff et al. (1961) correlated the diagnosis using VCG and autopsy
findings in 167 cases. Vectorcardiographic indications of left ven
tricular hypertrophy were indicated in 139 cases but were present in only
106. Right ventricular hypertrophy, however, tended to obscure the diag
nosis of left ventricular hypertrophy. Vector cardiographie diagnosis of
myocardial infarction was correctly made in 90% of the cases with large
lesions and 35% of those with small lesions.
Burch (1952) pointed out that the single vector loop contained more
information than the ECG recording. The VCG also helps in data reduction
for computers (Pipberger, 1959). Vectorcardiography has been accepted by
most cardiologists as a useful diagnostic tool (Simonson et al., 1966).
In recent studies, vectorcardiography has been shown to be helpful in
diagnosing acute left anterior hemiblock (Lamberg et al., 1971), tetralogy
and triology of fallot (De Michelli et al., 1968), dextrocardia (Miller,
1968), right bundle-branch block (Varriale and Kennedy, 1972) and anterior
myocardial infarction (Starr et al., 1975).
Recording Techniques
The first recording of a vectorcardiogram was done by Mann (1938).
He used a galvanometer with a single mirror that was deflected by coils
mounted with their axes 60° apart. These coils corresponded to the leads
17
of the Einthoven "schema". The photographic record of the deflection of
the reflected light beam produced a monocardiogram. By slowly moving the
paper film, one could obtain timing information about the VCG but this
movement distorted the recording.
The use of an oscilloscope to record VCG was originally done in
Germany in 1937 (Geddes and Baker, 1968) and was later introduced in this
country by Wilson and Johnston (1938). Schmitt (1947) and Brimberg (1969)
tried to display three-dimensional pictures of vectorcardiograms by using
z axis modulation. Hoover and Skutt (1975) used a multicolor phosphor
screen to display vectorcardiograms. The z axis modulation capability of
oscilloscopes is the most often used technique today to give an indication
of timing and direction to the vectorcardiographic loop. Different
triggering and delay techniques have also been used to display desired
parts of the VCG (Isaac, 1964). Finally, both large and small computer
systems have been used to process and to display vector loops (Van Bemmel
et al., 1971; Arvedson, 1971).
18
SYSTEM DESIGN
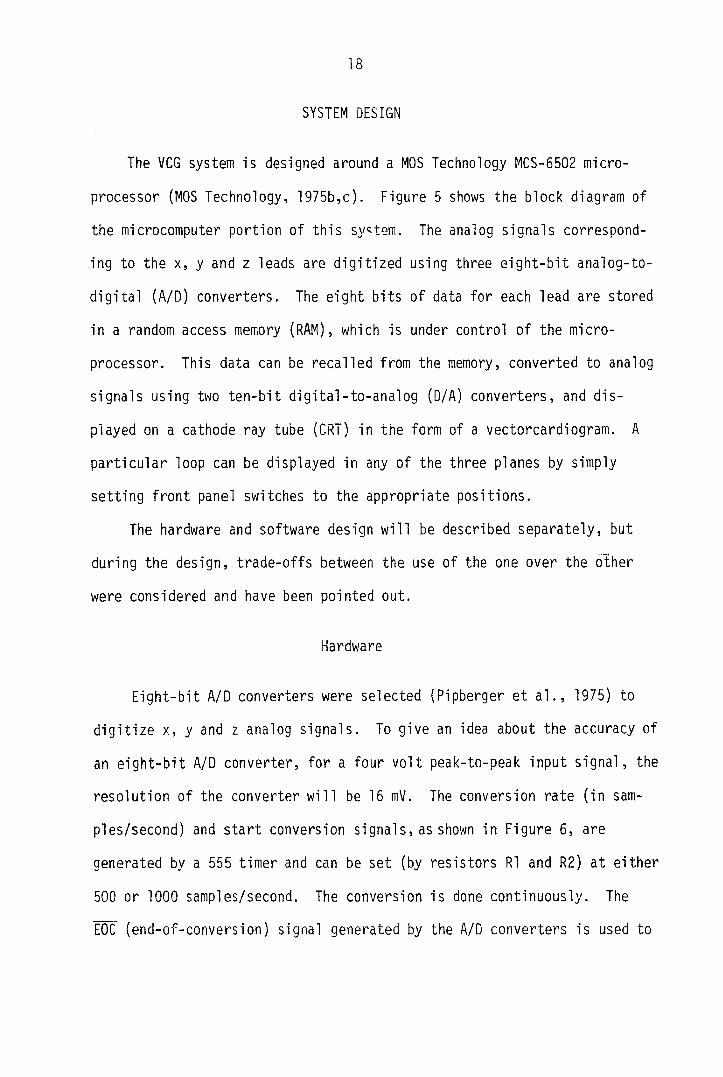
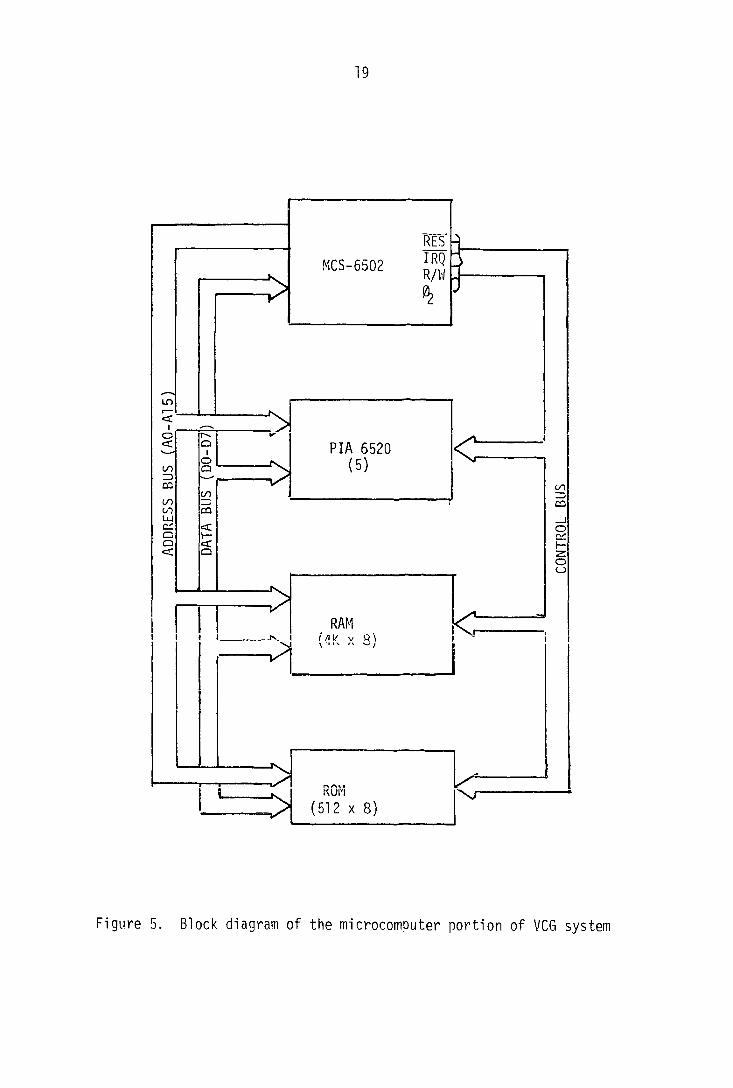
The VCG system is designed around a MOS Technology MCS-6502 micro
processor (MOS Technology, 1975b,c). Figure 5 shows the block diagram of
the microcomputer portion of this system. The analog signals correspond
ing to the X, y and z leads are digitized using three eight-bit analog-to-
digital (A/D) converters. The eight bits of data for each lead are stored
in a random access memory (RAM), which is under control of the micro
processor. This data can be recalled from the memory, converted to analog
signals using two ten-bit digital-to-analog (D/A) converters, and dis
played on a cathode ray tube (CRT) in the form of a vectorcardiogram. A
particular loop can be displayed in any of the three planes by simply
setting front panel switches to the appropriate positions.
The hardware and software design will be described separately, but
during the design, trade-offs between the use of the one over the other
were considered and have been pointed out.
Hardware
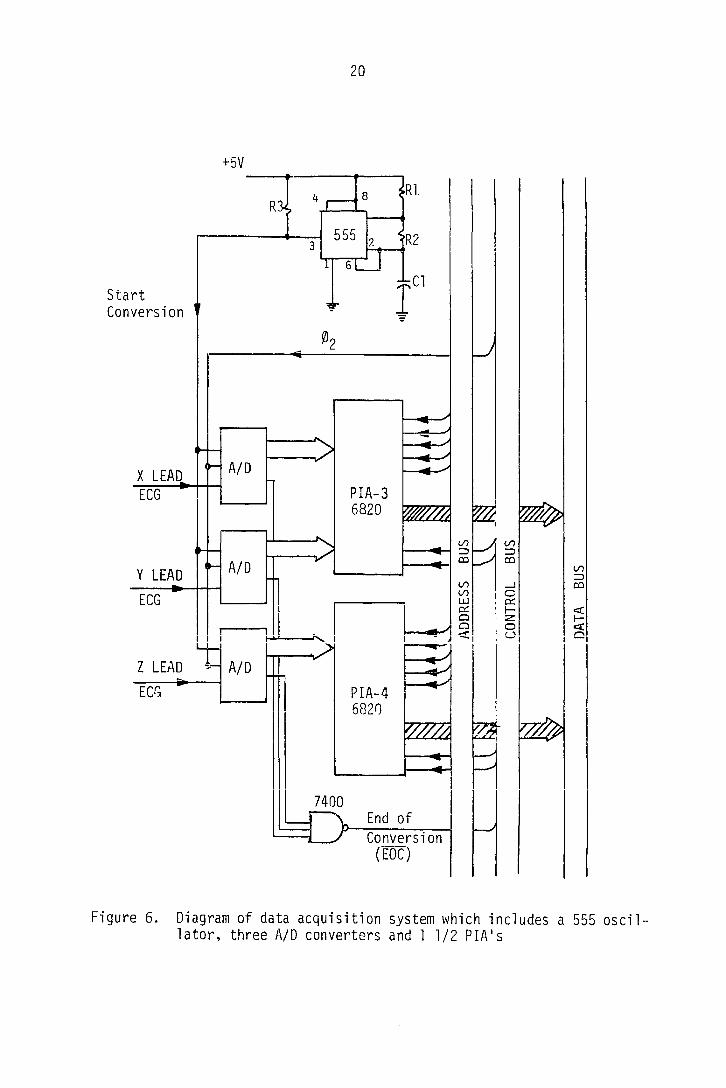
Eight-bit A/D converters were selected (Pipberger et al., 1975) to
digitize x, y and z analog signals. To give an idea about the accuracy of
an eight-bit A/D converter, for a four volt peak-to-peak input signal, the
resolution of the converter will be 16 mV. The conversion rate (in sam
ples/second) and start conversion signals, as shown in Figure 5, are
generated by a 555 timer and can be set (by resistors R1 and R2) at either
500 or 1000 samples/second. The conversion is done continuously. The
EOC (end-of-conversion) signal generated by the A/D converters is used to
19
un
o r>. Q
o Q 00 cc C/)
00
(_j
RAM
Kun (512 X 8)
PIA 6520
MCS-6502 IRQ R/W
RES
Figure 5. Block diagram of the microcomputer portion of VCG system
20
+5V
Start Conversion
X LEAD ECG
(/) (/)
CO CO
Y LEAD ^ 00 CO
ECG a:
o
Z LEAD
ECG
7400 End of Conversion
(EOC)
555
A/D
A/D
A/D
PIA-3 6820
PIA-4 6820
Figure 6. Diagram of data acquisition system which includes a 555 oscillator, three A/D converters and 1 1/2 PIA's
21
interrupt the microprocessor. The interrupt enable bit that controls the
interrupt input of the microprocessor is cleared (under software control)
to accept an interrupt from the A/D converters. After the microprocessor
is interrupted, it fetches all three x, y and z lead samples and stores
them in the RAM. As illustrated in Figure 5 the A/D converters are inter
faced with the microprocessor using PIA-6820 integrated circuits. Sam
pling is stopped (software controlled) after the microprocessor has stored
500 or 1000 samples (depending on the sampling rate) in the memory. The
program and the flow diagram that control the A/D conversion are included
in the simulation and software section of this dissertation.
Microprocessor
The selection of the microprocessor was based on the following
factors:
1. Cost
2. Software support
3. Desired accuracy
4. Complexity of interfacing
5. Clock requirement and register add time
6. Voltage requirement
7. Interrupt capability
Each of these factors will be discussed below.
Cost When the overall system was designed, the chosen micro
processor (MCS-6502) was the most reasonably priced microprocessor. Price
in quantities of 100 for different microprocessors considered were Intel
22
4040, $40; Intel 8008, $60; Intel 8080, $200; Motorola M6800, $150; and
NOS Technology MCS 6502, $21.
Software support This was one of the main factors and was greatly
accounted for in selecting the MCS-6502 microprocessor. As a matter of
fact, the Iowa State University Computation Center had an operational
assembler only for the MCS-6502. The second alternative for assembling a
program for the other microprocessors and the chosen one was through
General Electric's time sharing facilities. This is very expensive and
requires a special terminal.
Desired accuracy An eight-bit microprocessor (M6800, MCS-6502,
Intel 8008 and 8080) was selected over a four-bit (Intel 4040) model. An
eight-bit microprocessor provides for the analog resolution and computa
tional accuracy required in the design of this vectorcardiographic system.
Complexity of interfacing The MCS-6502 and M6800 microprocessors
are the only eight-bit microprocessor systems that offer such powerful
interfacing integrated circuits as the MCS-6502 and M6820. The interrupt
handling capability and individual input/output pin programmability makes
these integrated circuits very flexible for multiple peripheral applica
tions such as controlling z-modulation in the cathode ray tube, operating
the A/D converters and reading the input selector switches.
Clock requirenienLs and regisLer add lime The nCS-6502 is the only
microprocessor that has a built-in clock oscillator and driver, and re
quires no additional integrated circuits for generating two phase ((j)! and
if2) five-volt clock pulses to control the activity of the microprocessor.
This feature allows the microprocessor to be driven from either a single

23
TTL-level input clock, an RC time base, or a crystal time base. The other
microprocessors (M6800, 4040, 8008 and 8080) require additional integrated
circuits to generate a two-phase clock signal. The typical register add
time for different microprocessors is; MCS-6502, 2 ^seconds; M6800, 2 y-
seconds; Intel 4040, 10 yseconds; and Intel 8008 and 8080, 12.5 yseconds.
Voltage requirements Like the M6800, only a single +5 volt power
supply is needed to operate the MCS-6502. Voltage requirements for the
other microprocessors are: 4040, +15 volts; 8008, -9 and +5 volts; and
8080, ±5 and +12 volts.
Interrupt capability Both the M6800 and the 8080 have a variable
stack, i.e., the stack can be located anywhere in the random access memo
ry. The stack for the MCS-6502 can only be located in page one of the
memory because the stack pointer register is only nine bits long and the
ninth bit is always set to a logic "one". Both the 8008 and the 4040
microprocessors have fixed locations for the stack within the micro
processors themselves. These two microprocessors have only 7-level
interrupt capability. A fixed stack location limits the use of multiple
interrupts and nested subroutines, two features which make it hard to
program these microprocessors.
A4Kx 8 (32,000 bits) random access memory is required for this vec-
torcardiograpuic system. Data sLoraye (x, y and z lead) uses 3K x 8 of the
total, zero-page addressing uses 256 x 8, the stack uses 256 x 8 and the
remaining 512 x 8 is used for arithmetic calculations and is reserved for
future developments. The memory chosen for the system (Intel 2102) has an
access time of 500 nanoseconds.

24
Since address bus (A0-A15), data bus (D0-D7), R/W (read/write) and *2
clock outputs of the microprocessor can drive one TTL load (in parallel
with 130 pf), it is necessary that these outputs be buffered externally
to drive other loads (the RAM and PIA's). This is accomplished by using
Signetics 8T26 three state quad buffers. These integrated circuits pro
vide TTL compatible inputs and three-state outputs.
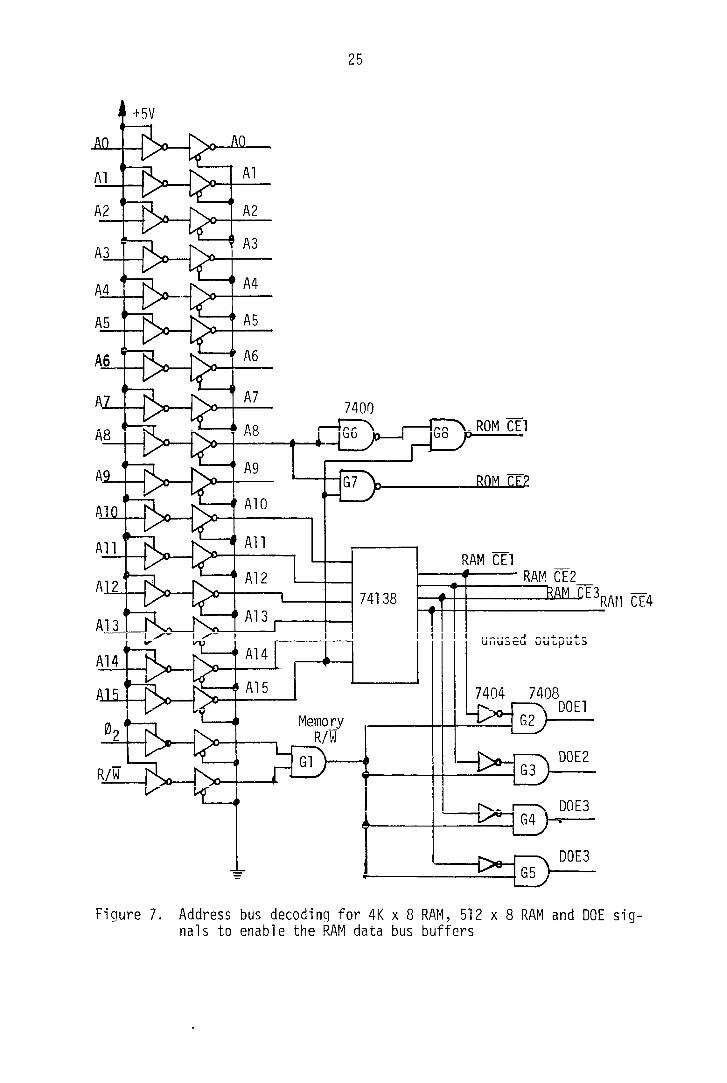
The address bus decoding, to generate the memory chip-enable (CE), is
done using a 74138 3-to-8 decoder/demultiplexor integrated circuit.
Figure 7 shows how address lines A10-A15 can be decoded to give the capa
bility of addressing 8K x 8 bits of memory. Each chip enable signal
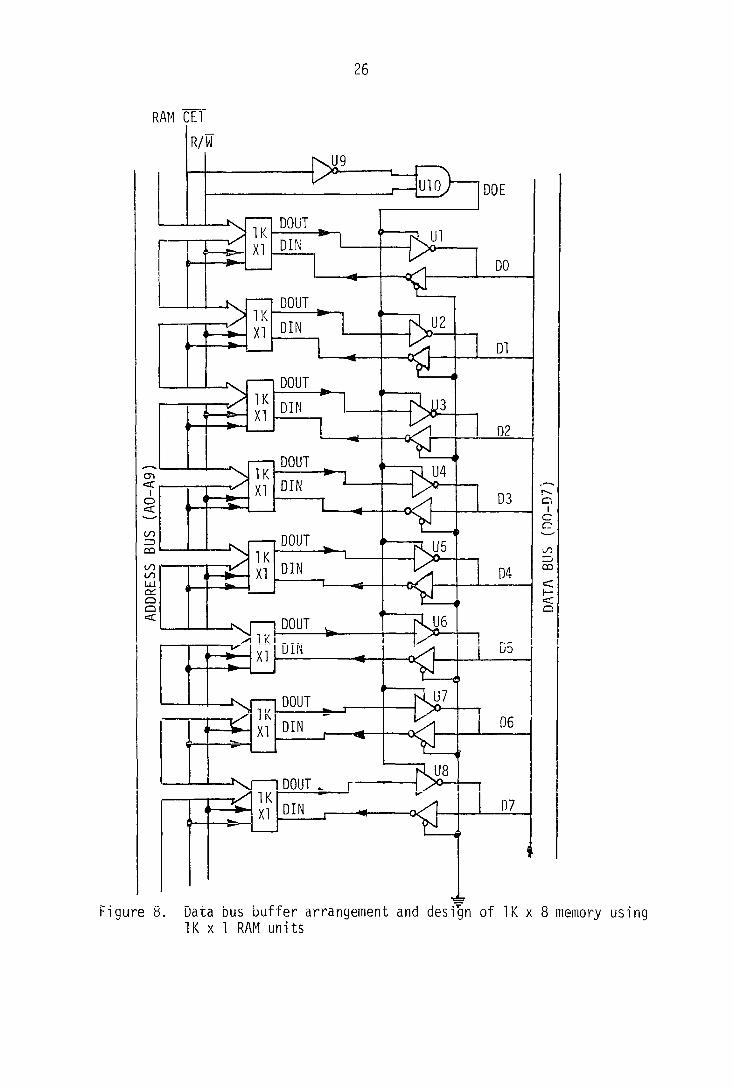
addresses a IK x 8 memory block (refer to Figure 8) and address bus lines
A0-A9 decode one of 1024 locations in each memory. As illustrated in
Figure 7, using gates G6-G8, address bus lines A8 and A15 are decoded to
give chip enables (ROMCEl and R0MCE2) for addressing two (256 x 8) blocks
of read only memory.
During a memory read operation the data output signal (DOE), which
enables gates U1-U8 (refer to Figure 8), is generated using gates U9 and
UIO and memory R/W and chip enable signals. The high level R/W pulse
instructs a RAM memory block to perform a memory read operation (provided
the address select signal CE is low). The DOE signal instructs the data
bus interface to transfer the memory output to the microprocessor via the
system bus.
During the memory write operation gates U1-U8 are disabled by a low
level R/W signal. This low level signal instructs the RAM memory block to
25
+5V
. ROM CEI t A8
AlO m
All RAM CEI
RAM CE2_
CË4 All
74138
All
A14
7404 7408 \ I DO El
Memory R/W
D0E2 R/W
D0E3 {>-'
DOES
Figure 7. Address bus decoding for 4K x 8 RAM, 512 x 8 RAM and DOE signals to enable the RAM data bus buffers
26
RAM CET
R/W
Mgure 8. uata bus buffer arrangement and design of IK x 8 memory using IK X 1 RAM units

27
perform a memory write operation and to store the data it receives from
the data bus interface (if the address select signal (CE) is low).
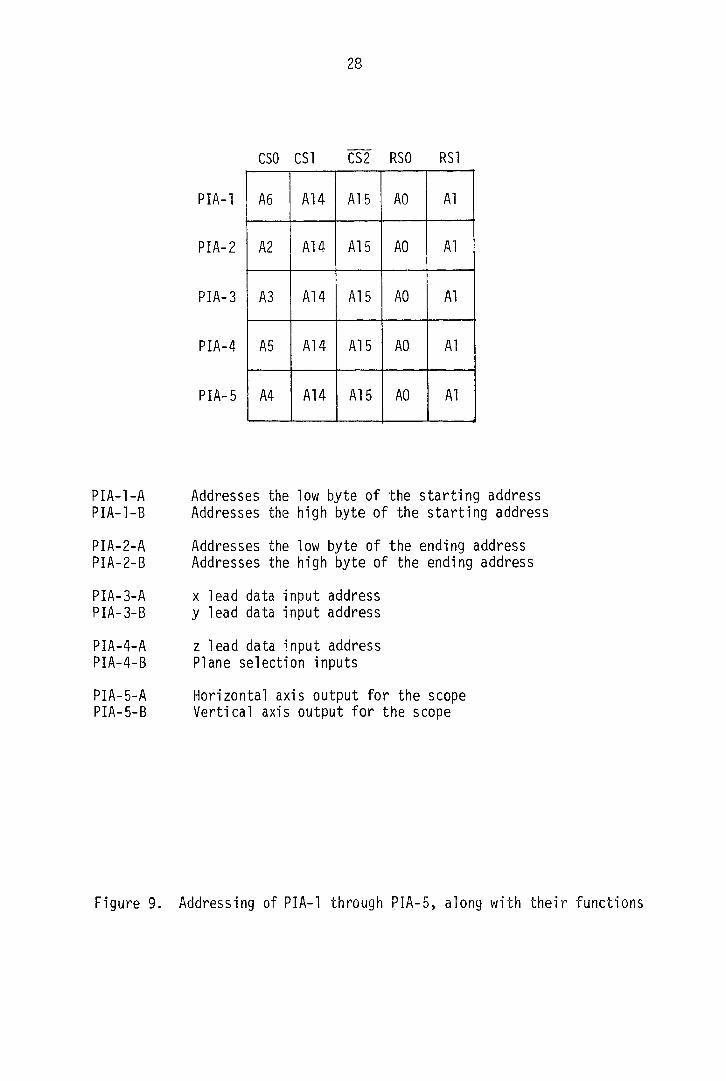
Figure 9 illustrates how the addressing of PIA-1 through PIA-5, using
address lines A0-A6, A14 and A15, is accomplished. Also shown is the re
lationship of each PIA to its peripheral.
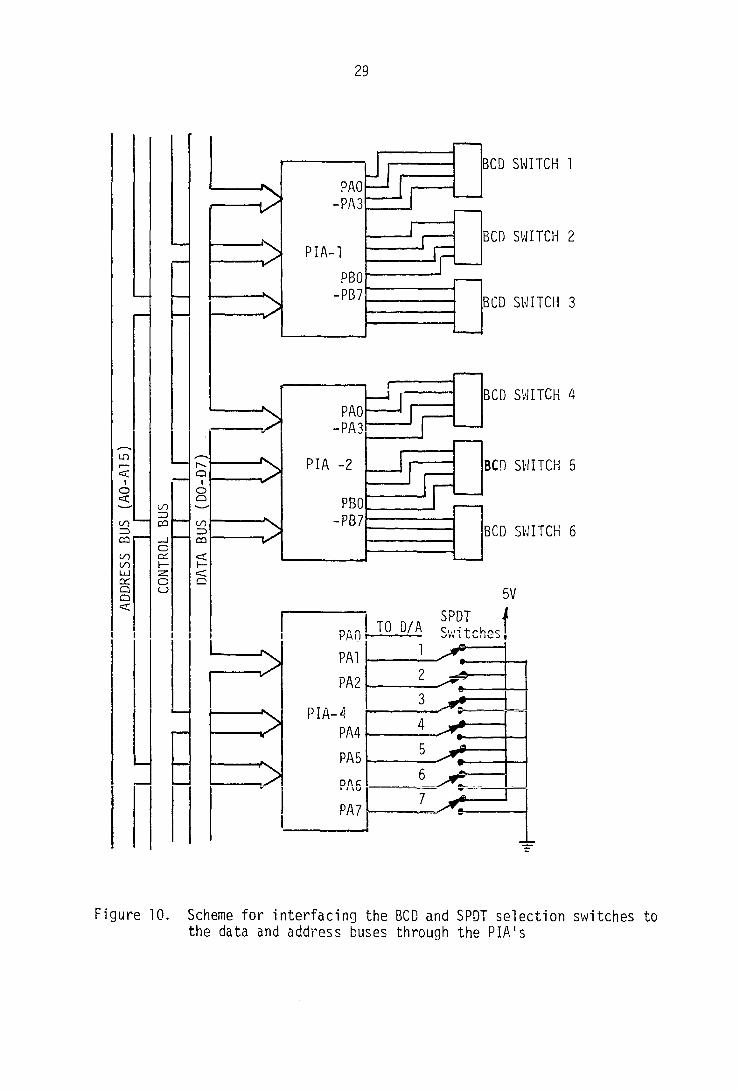
The starting and ending addresses for the VCG loops are selected
using binary coded decimal (BCD) switches (refer to Figure 10). BCD
switches 1, 2 and 3 give the starting address and BCD switches 4, 5 and 6
give the ending address. The plane and lead selection is accomplished
using five single-pole double-throw (SPDT) switches. Whenever either of
switches 1, 2, 3, 4 or 5 is up, it selects the x lead, y lead, z lead,
frontal plane or horizontal plane, respectively. As illustrated in Figure
10 these BCD and SPDT switches are interfaced with the microprocessor
through the M6820 peripheral interface adaptors (PIA's). Switches 6 and 7
are left for future developments. Output PAO of PIA-4 in Figure 10 is
used when either an x, y, or z lead is to be displayed with respect to
time. This output is connected to the most significant bit of the D/A
converter that drives the x-axis of the oscilloscope. By doing so one can
display 512 points compared to 256 obtained by only 8 bits of information.
The information stored in the random access memory is displayed on
the CRT through two 10-bit D/A converters. When the most significant
bits (2-9 for the x-axis and 3-10 for the y-axis) are used, the 10-bit
D/A converters give an accurate display since the nonlinearity (at 8
bits) is ±1/8 of the least significant bit (LSB) for the y-axis and ±1/4
LSB for the x-axis. This is better than the linearity specification of
28
PIA-l-A PIA-l-B
PIA-2-A PIA-2-B
PIA-3-A PIA-3-B
PIA-4-A PIA-4-B
PIA-5-A PIA-5-B
CSO CSl CS2 RSO RSI
PIA-1 A6 A14 A15 AO A1
PIA-2 A2 A14 A15 AO A1
PIA-3 A3 A14 A15 AO A1
PIA-4 A5 A14 A15 AO A1
PIA-5 A4 A14 A15 AO A1
Addresses the low byte of the starting address Addresses the high byte of the starting address
Addresses the low byte of the ending address Addresses the high byte of the ending address
X lead data input address y lead data input address
z lead data input address Plane selection inputs
Horizontal axis output for the scope Vertical axis output for the scope
Figure 9. Addressing of PIA-1 through PIA-5, along with their functions
29
c I o c
u~> ZD 03 (/) 00 UJ cc Cj Q <
(/) 3 CO
o c;
o c_>
BCD SWITCH 1
BCD SWITCH 2
BCD SWITCH 3
BCD SWITCH 4
BCD SWITCH 5 Q O Q
CO
BCD SWITCH 6 CO
SPOT TO D/A PAO
PAl
PA2
PIA-4 PA4
PA5
one
PA 7
PIA-1
PAO -PA3
PBO -PB7
PIA -2
PAO -PA3
PBO -PB7
Figure 10. Scheme for interfacing the BCD and SPOT selection switches to the data and address buses through the PIA's
30
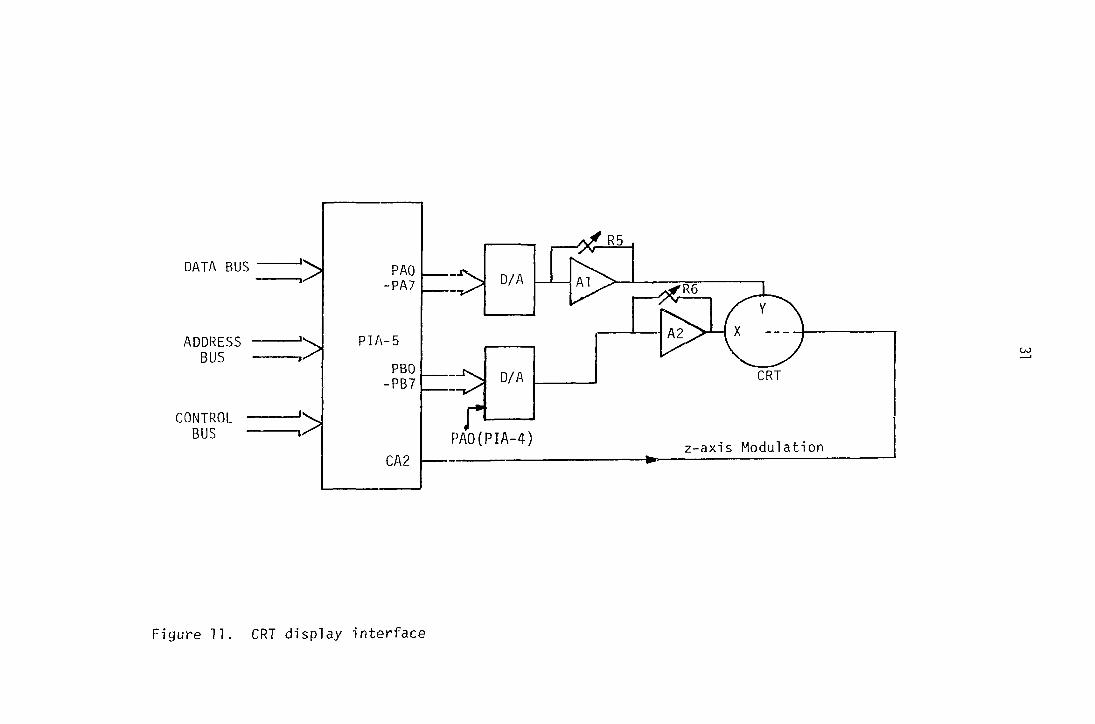
±1/2 LSB for an 8-bit only A/D converter. As illustrated in Figure 11,
the variable gain amplifiers A1 and A2 are used to amplify the signals of
the VCG to an appropriate level for CRT deflection. The z-axis modulation
is controlled by an 8 ysecond pulse from PIA-5. To allow for the set
tling time of the CRT amplifiers, the modulation pulse is produced 20 y-
seconds after the D/A converters have received the x- and y-axis values
from the RAM.
Software
The program to control the activity of the microprocessor was written
using an MCS-6502 assembler language (MOS Technology, 1975a). This sym
bolic code was assembled using an IBM 360/370 cross assembler. The
assembled program is included in this dissertation in the section on
Simulation.
The control program can be divided in the following four parts:
1. Initialization
0 Hata amuTCTtnnn 4 nc
3. Switch scanning and display control
4. Binary-coded-decimal (BCD) to hexadecimal conversion subroutine
Each of these four parts will be described in more detail below.
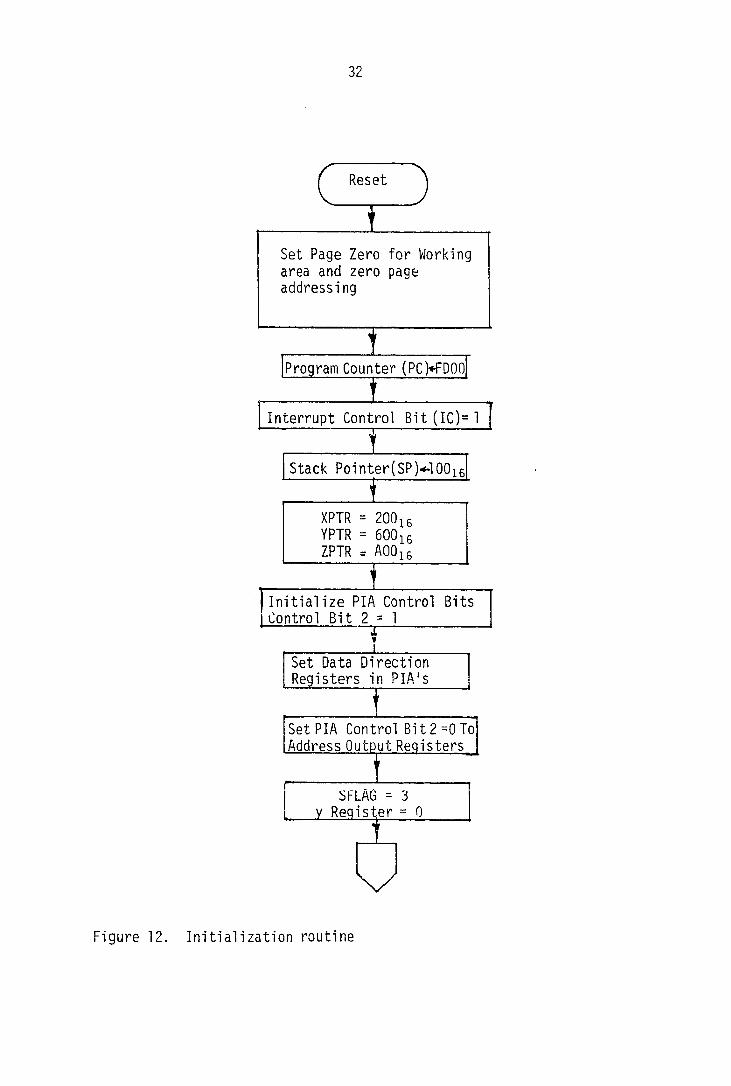
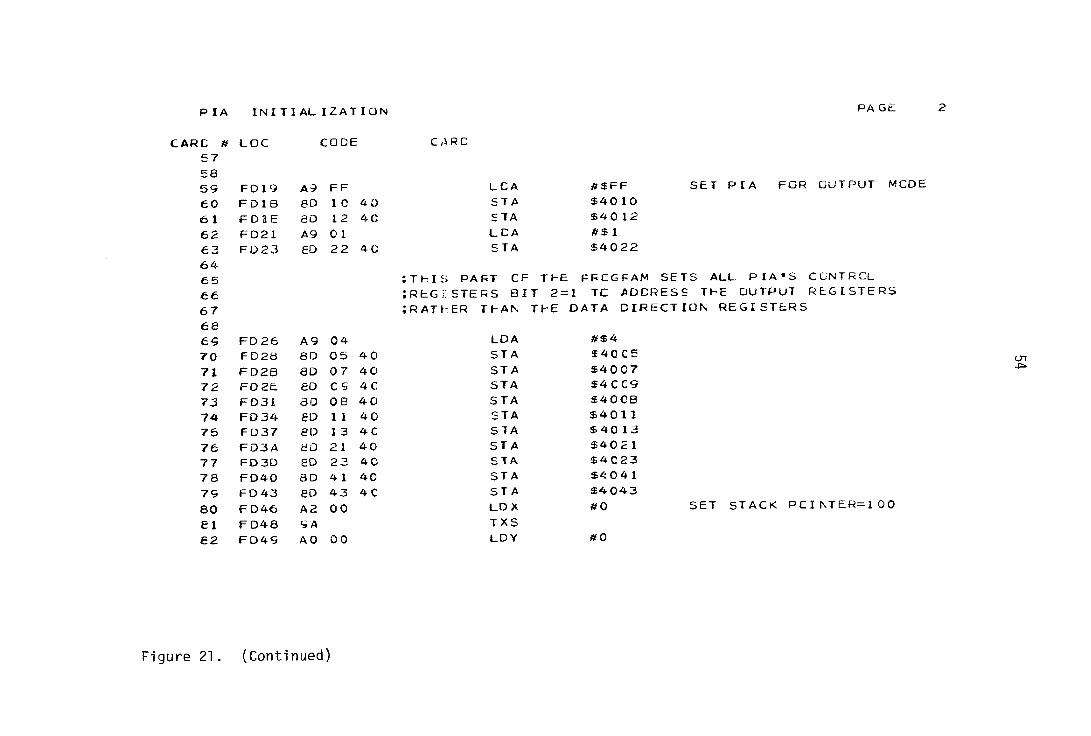
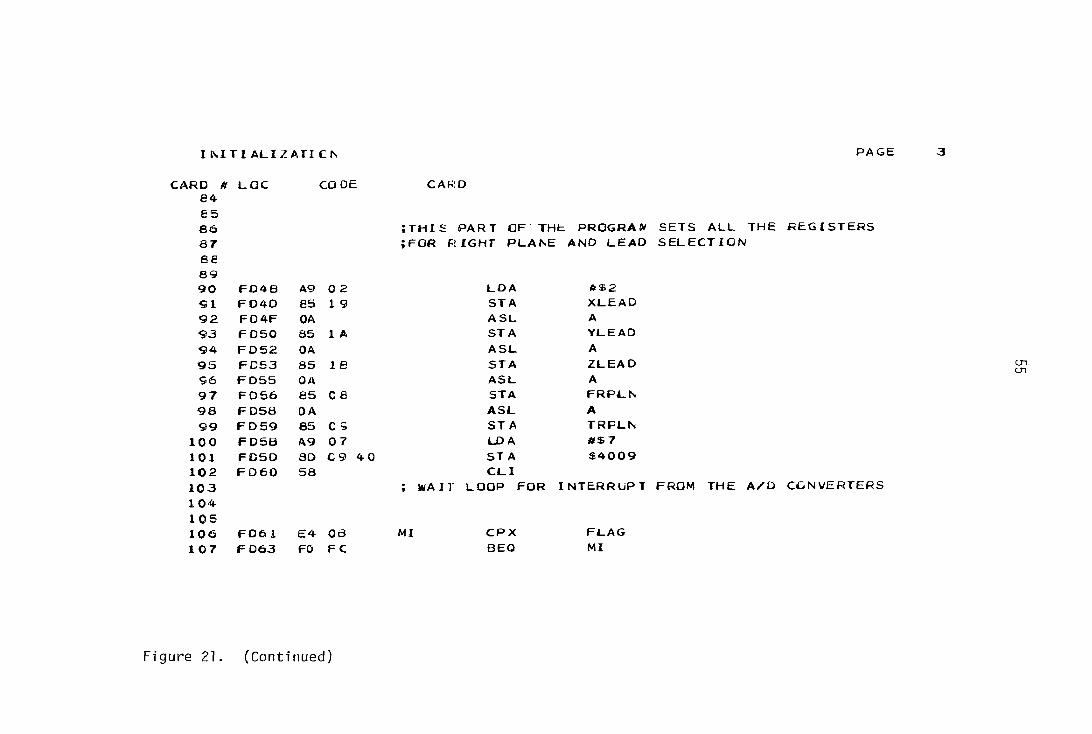
Initialization
In this part of the program the control and the data direction
registers of PIA-1 to PIA-5 are initialized. The stack pointer is set to
100. Address locations for storing the x-lead, y-lead and z-lead data are
also initialized to 200, 600 and AOO (base sixteen), respectively. The
flow diagram for the initialization routine is shown in Figure 12.
DATA BUS
ADDRESS BUS
CONTROL BUS PAO(PIA-4)
D/A
D/A
PIA-5
PAO -PA7
PBO -PB7
CA2
Figure 11. CRT display interface
r—^
A2
CRT
z-axis Modulation
32
Reset
Program Counter (PC)«fDOn
Stack Pointer(SP)*100
Interrupt Control Bit(IC)=l
Set Data Direction Registers in PIA's
SFLAG = 3 V Register = 0
Set PIA Control Bit2=0To Address Output Registers^
Initialize PIA Control Bits Control Bit 2 = 1
XPTR = 200 YPTR = 600 ZPTR = AOO
Set Page Zero for Working area and zero page addressing
Figure 12. Initialization routine
33
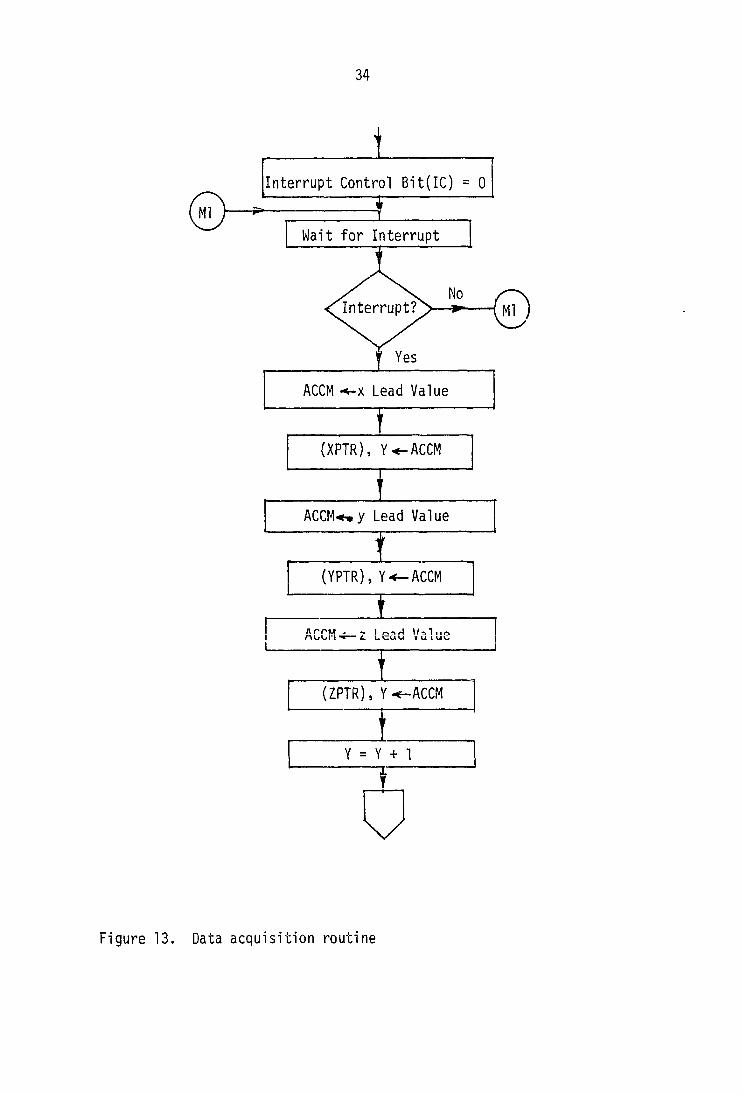
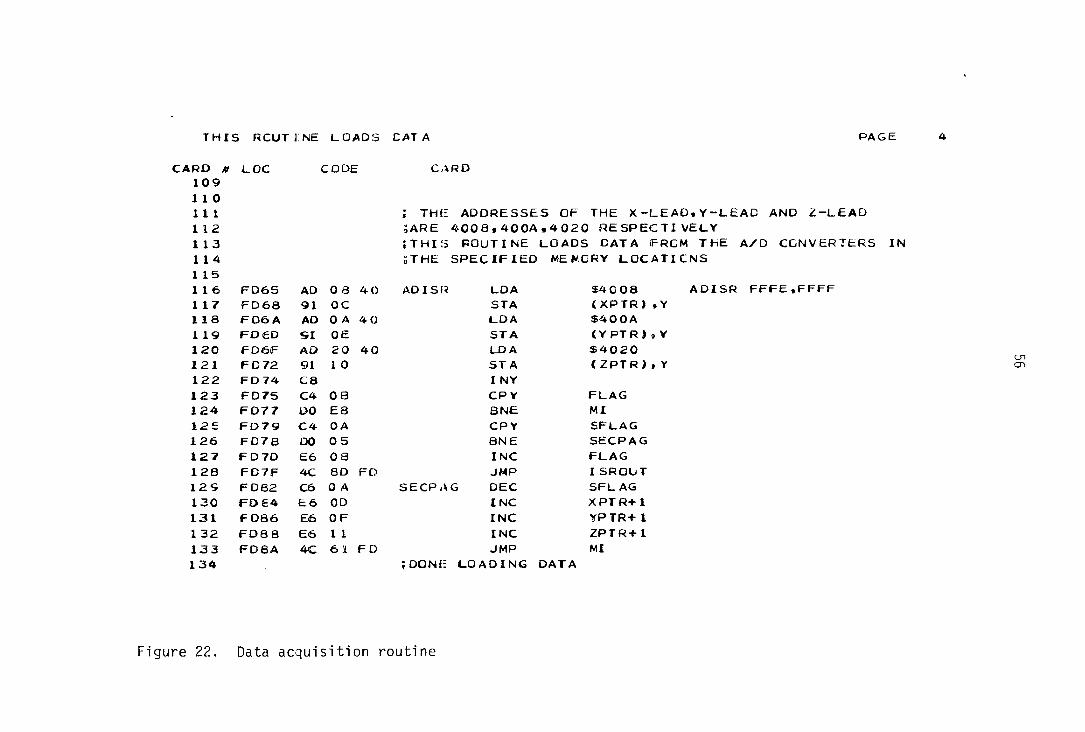
Data acquisition routine
After initialization, the processor goes into a "wait" stage until
an end of conversion (EOC) interrupt from all three A/D converters occurs.
Following this interrupt, the address for the storage subroutine is
fetched from location FFFE and FFFF of the ROM (read only memory). As
illustrated in the flow diagram of Figures 13 and 14, the storage subrou
tine stores the x, y and z lead values in locations addressed by XPTR,
YPTR and ZPTR, respectively. After the processor is done loading these
values in the RAM, it again goes into a "wait" stage and the interrupt
control bit is again disabled. By means of this subroutine the micro
processor sends 500 or 1000 samples (base 10) for each x, y and z lead to
the RAM for storage. It takes 37 ^seconds to fetch one sample of the x,
y and z lead data from the A/D converters and to store them in the RAM.
Since the microprocessor is interrupted every one milisecond (sampling
rate of 1000 samples/second), there is enough time to do more things like
pattern recognition and some digital filtering if one so desires.
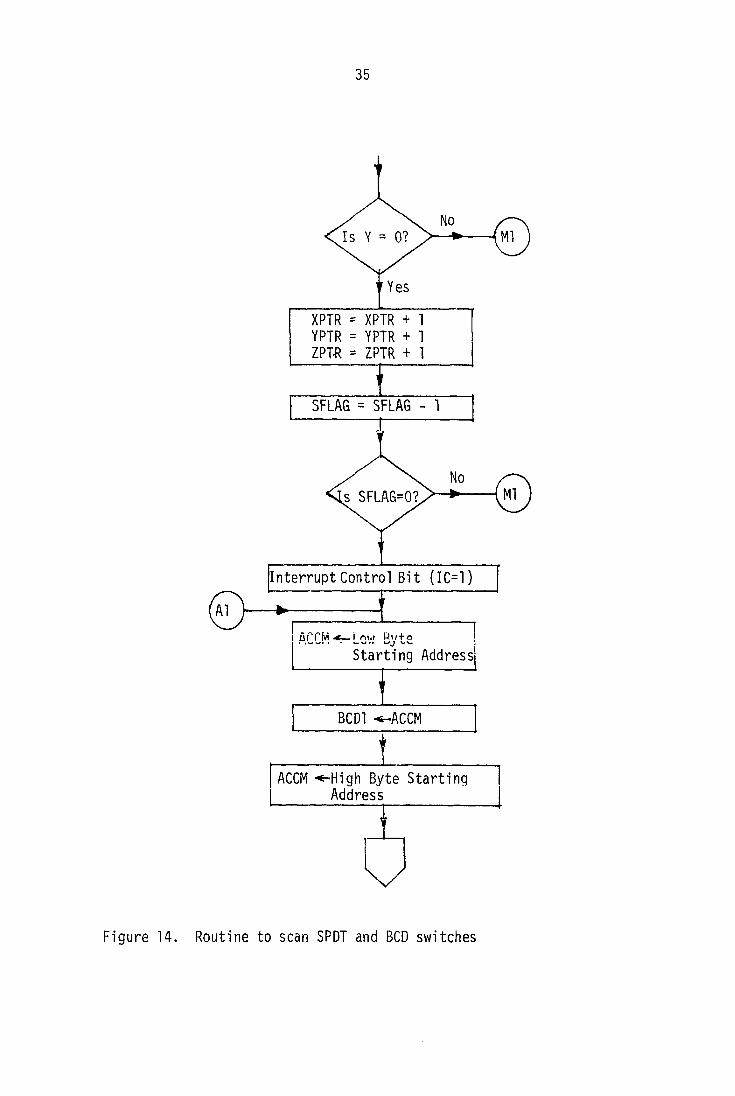
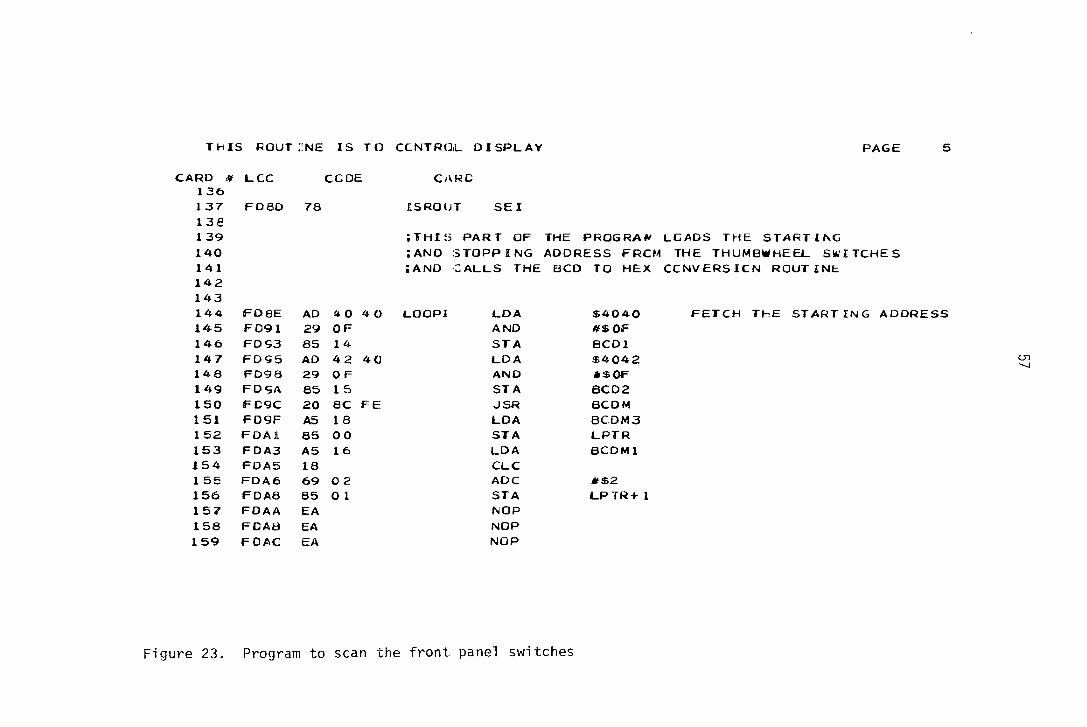
Switch scanning and display routine
As shown in part of the flow diagram of Figure 14, after the sampling
subroutine is finished, the interrupt control bit in the microprocessor
(using the SEI instruction) is set to one. Under this condition, the
microprocessor ignores any interrupt from the A/n converters during the
display routine. The microprocessor now scans the front panel SPOT and
BCD switches to determine how the vectorcardiogram is to be displayed on
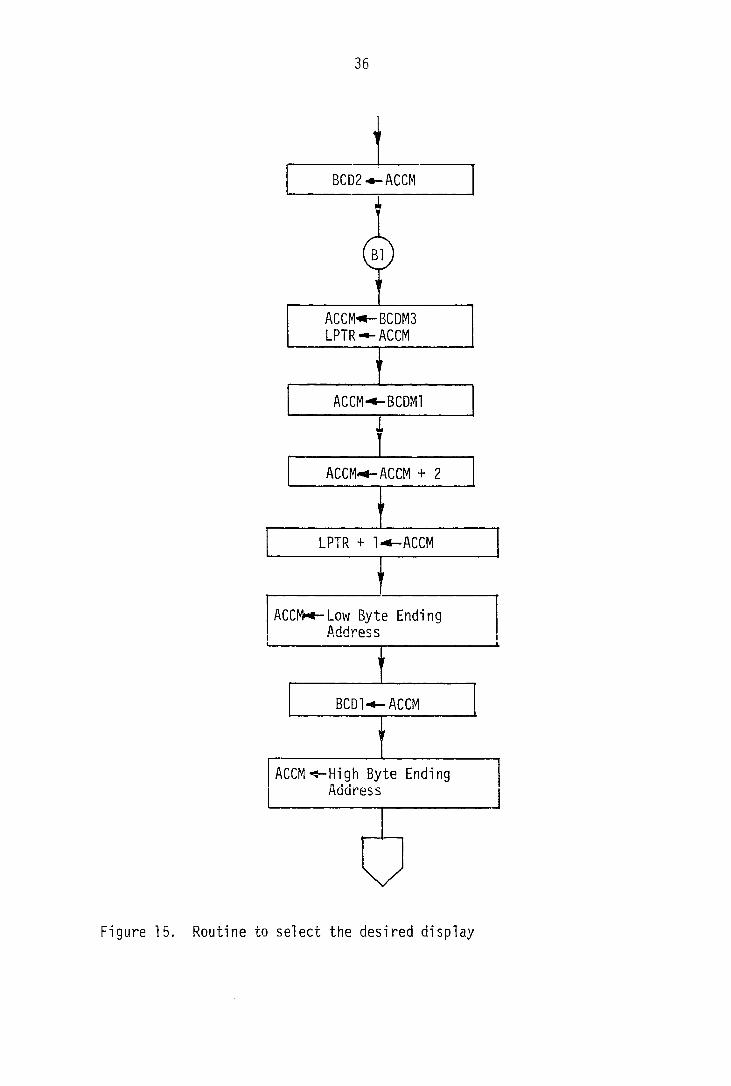
the CRT. As illustrated in Figure 15, the proper plane or lead is se
lected by comparing the settings on the SPOT switches (1-5) to stored
34
Interrupt?
Yes
ACCM-
Wait for Interrupt
ACCM^y Lead Value
ACCM "4-x Lead Value
Interrupt Control Bit(IC) = 0
Figure 13. Data acquisition routine
35
XPTR = XPTR + 1 YPTR = YPTR + 1 ZPT-R = ZPTR + 1
SFLAG = SFLAG - 1
No s SFLAG=0?
Interrupt Control Bit (IC=1)
-—i I ai l M .^! ni.t My + p
Starting Address
BCDl -s-ACCM
ACCM -«-High Byte Starting Address
Figure 14. Routine to scan SPDT and BCD switches
36
ACCM"*-ACCM + 2
LPTR + l^ACCM
ACCM<-High Byte Ending Address
ACCM-*-Low Byte Ending Address
Figure 15. Routine to select the desired display
37
(HPTR + 1)-^ACCM
A C C M A C C M + 2
ACCM"«-Plane Selection Byte
Figure 15. (Continued)
38
Yes
Yes ACCM=YLead?
Yes ACCM=ZLead?
\/
Figure 15. (Continued)
39
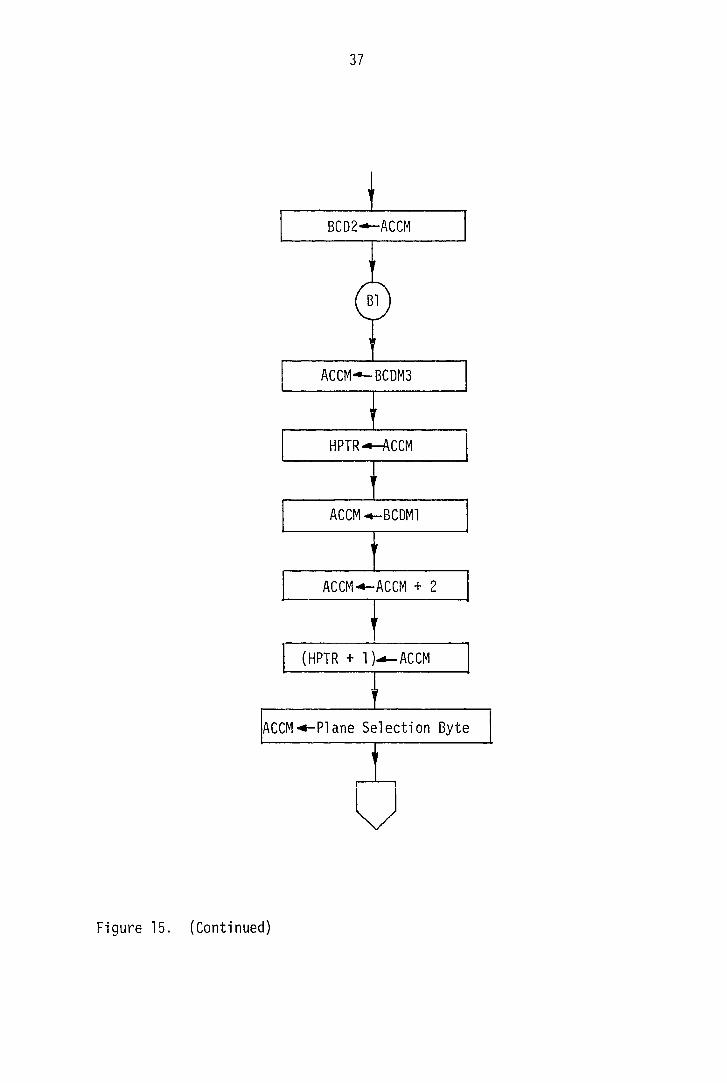
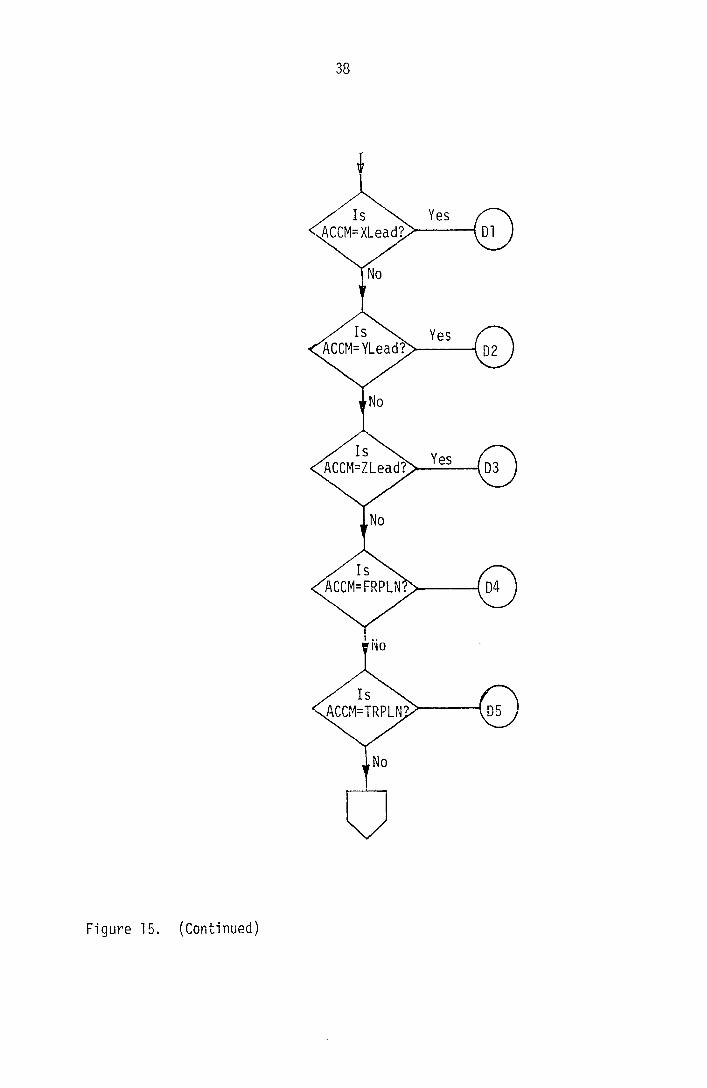
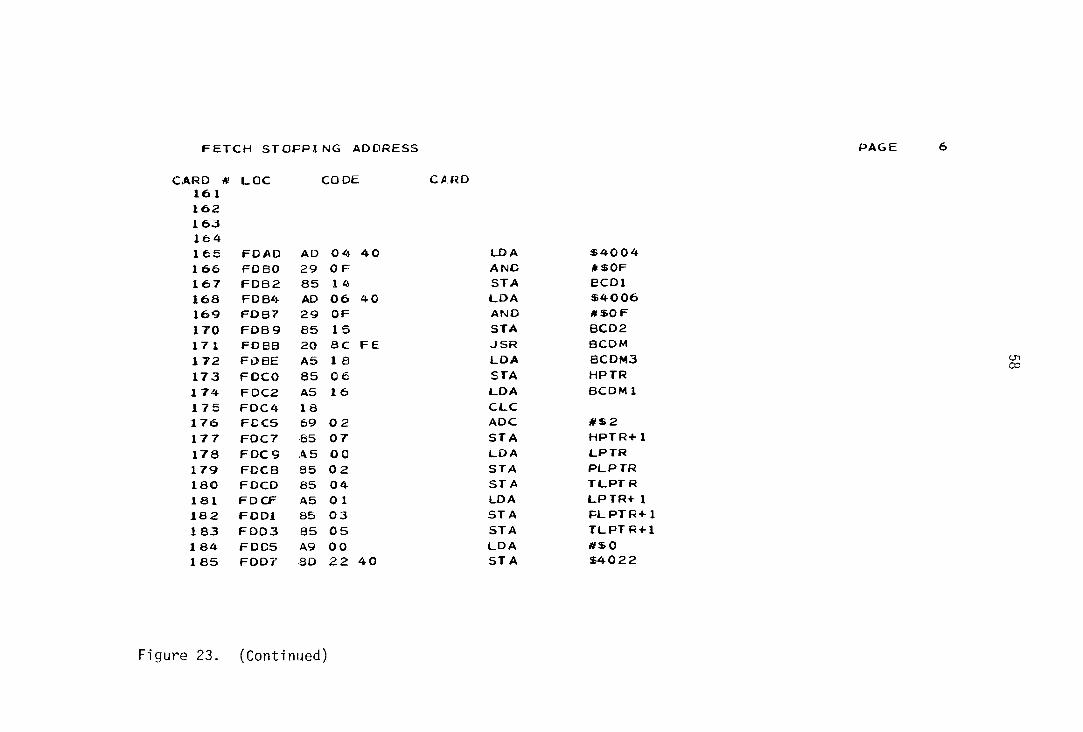
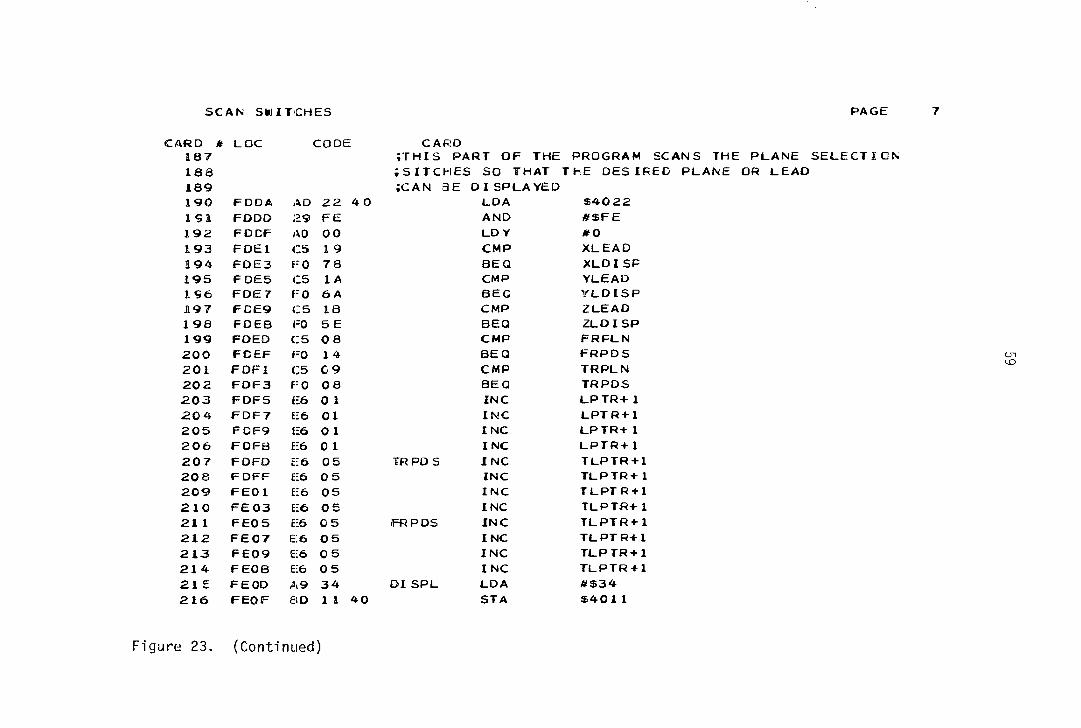
pointers for the frontal plane (FRPLN), horizontal plane (TRPLN), x lead
(XLEAD), y lead (YLEAD) and z lead (ZLEAD), respectively. The micro
processor automatically selects saggital plane if neither the frontal nor
horizontal planes are selected. After this selection is complete, the
starting and ending address for the display are fetched from the two sets
of BCD switches to either display the desired portion of the VC6 loop in a
selected plane or to display the desired lead with respect to time. It
takes 301 pseconds to scan the switches and to select the proper display.
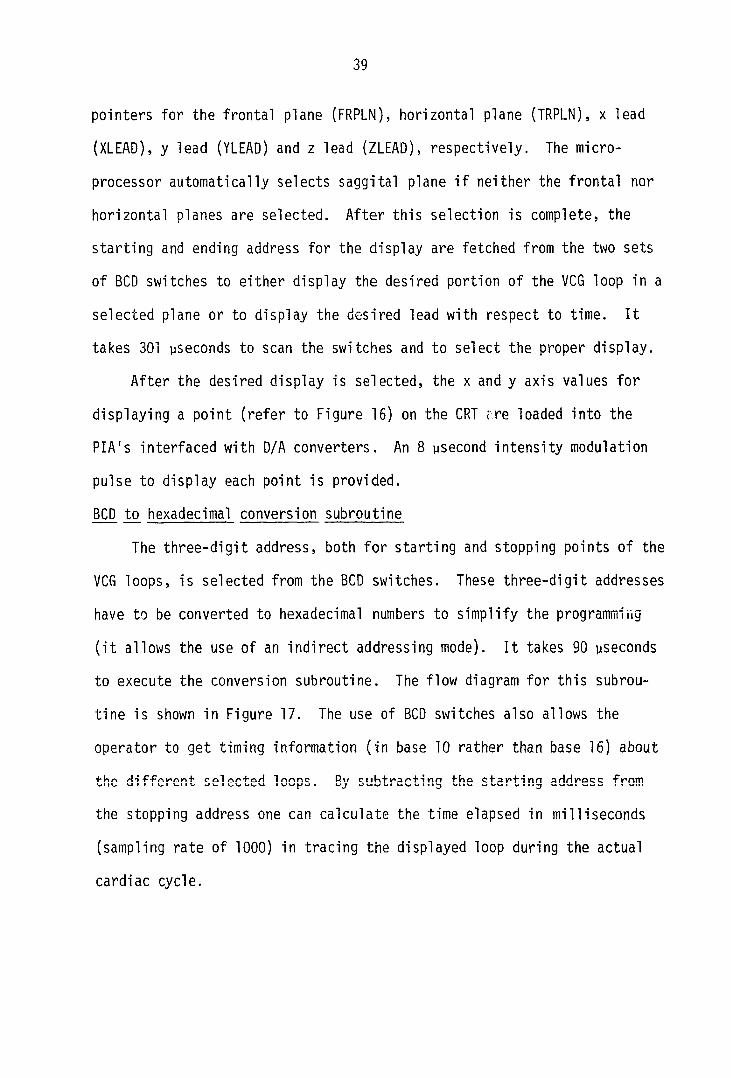
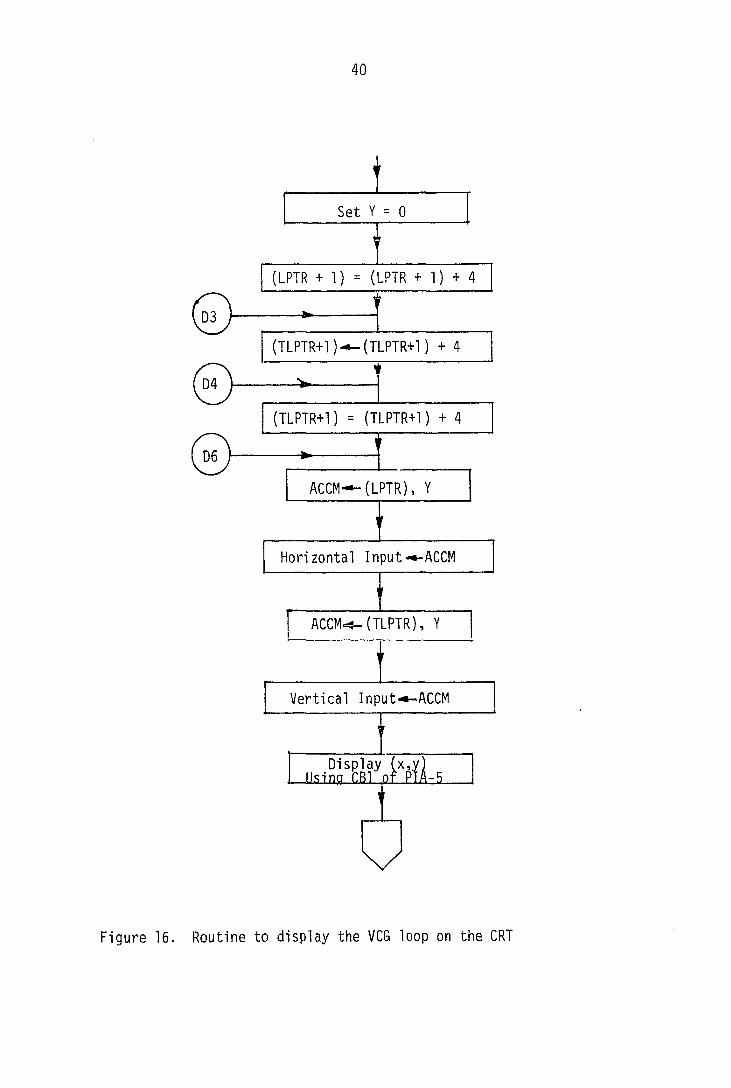
After the desired display is selected, the x and y axis values for
displaying a point (refer to Figure 16) on the CRT rre loaded into the
PIA's interfaced with D/A converters. An 8 ysecond intensity modulation
pulse to display each point is provided.
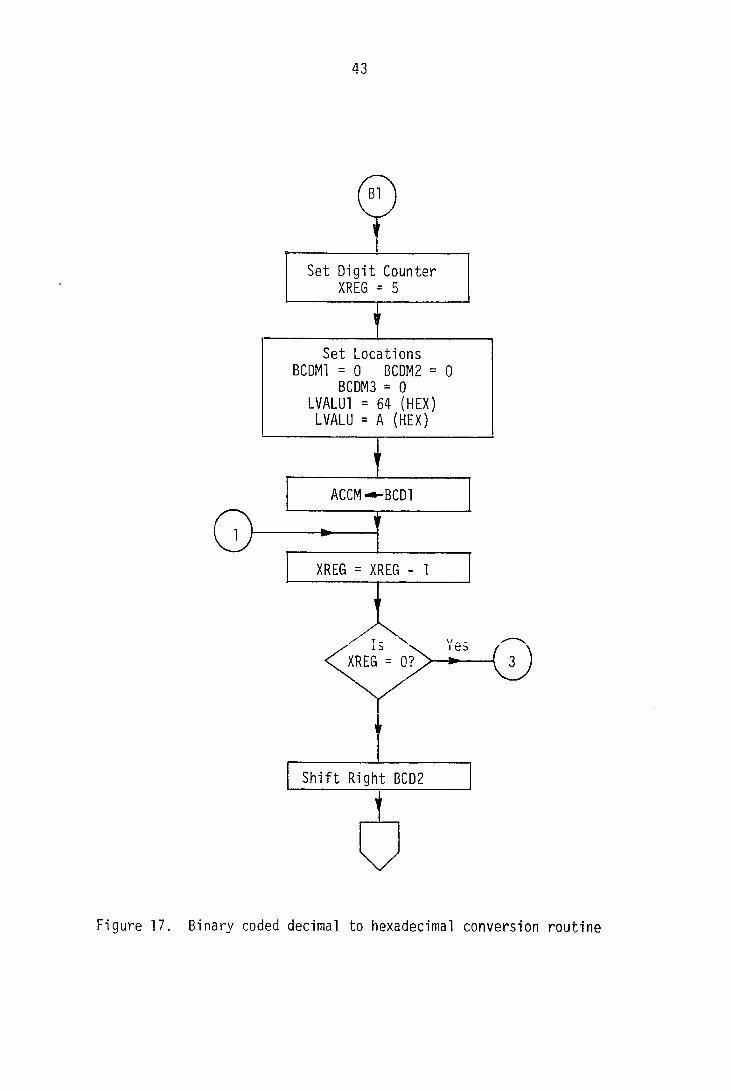
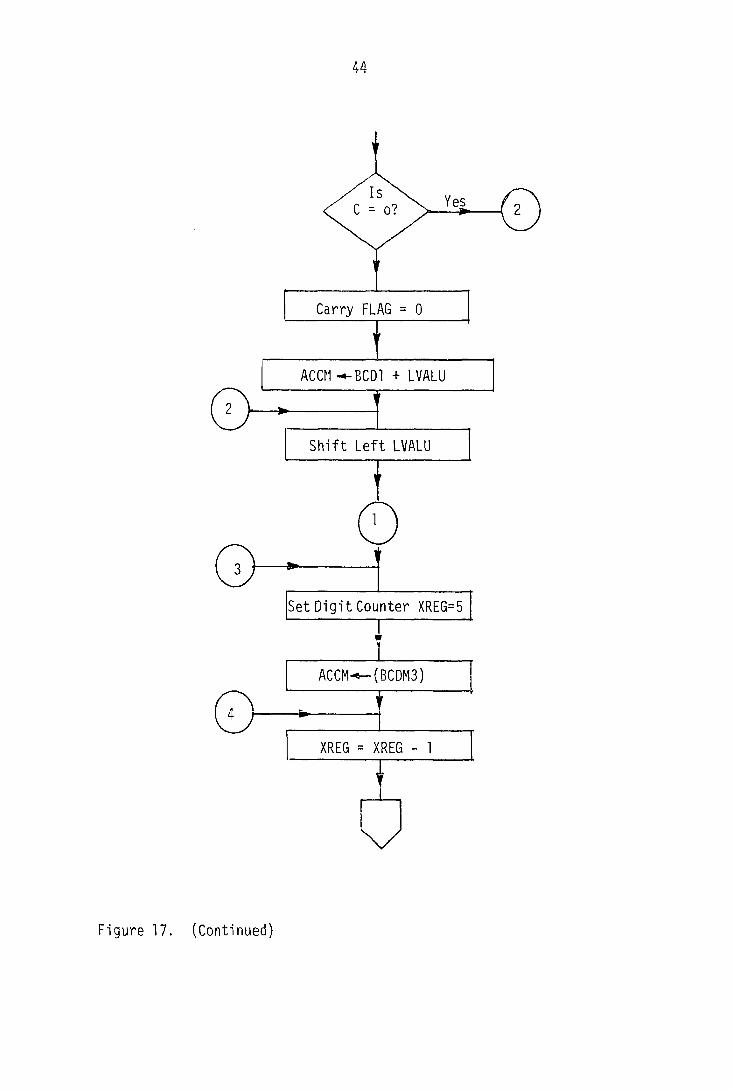
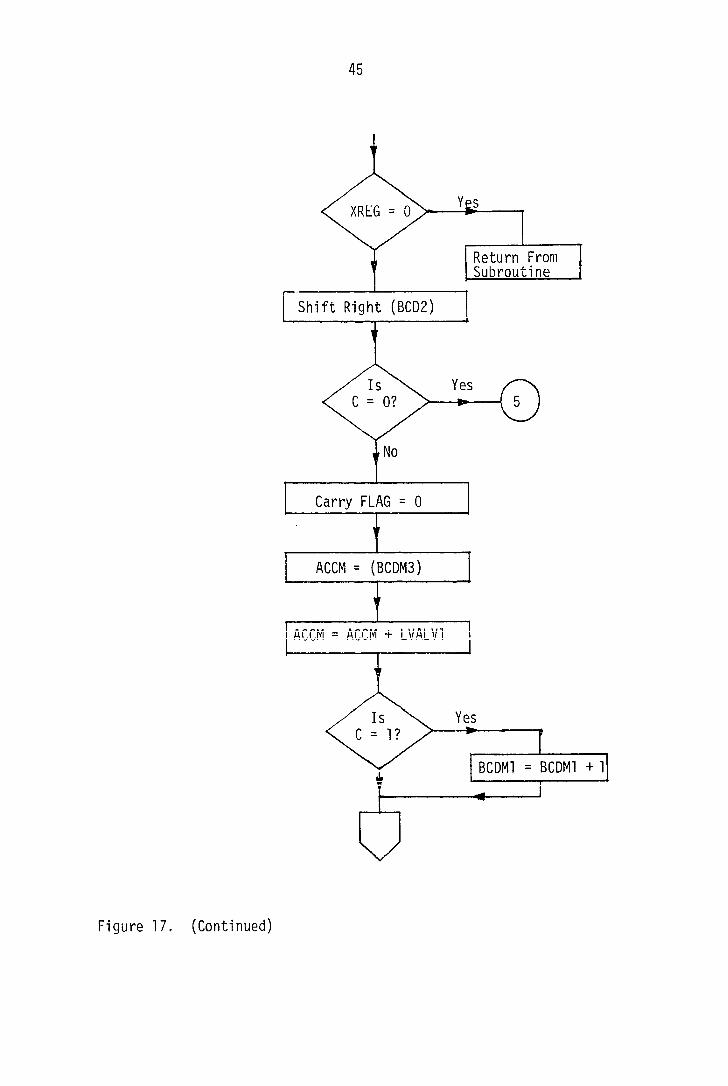
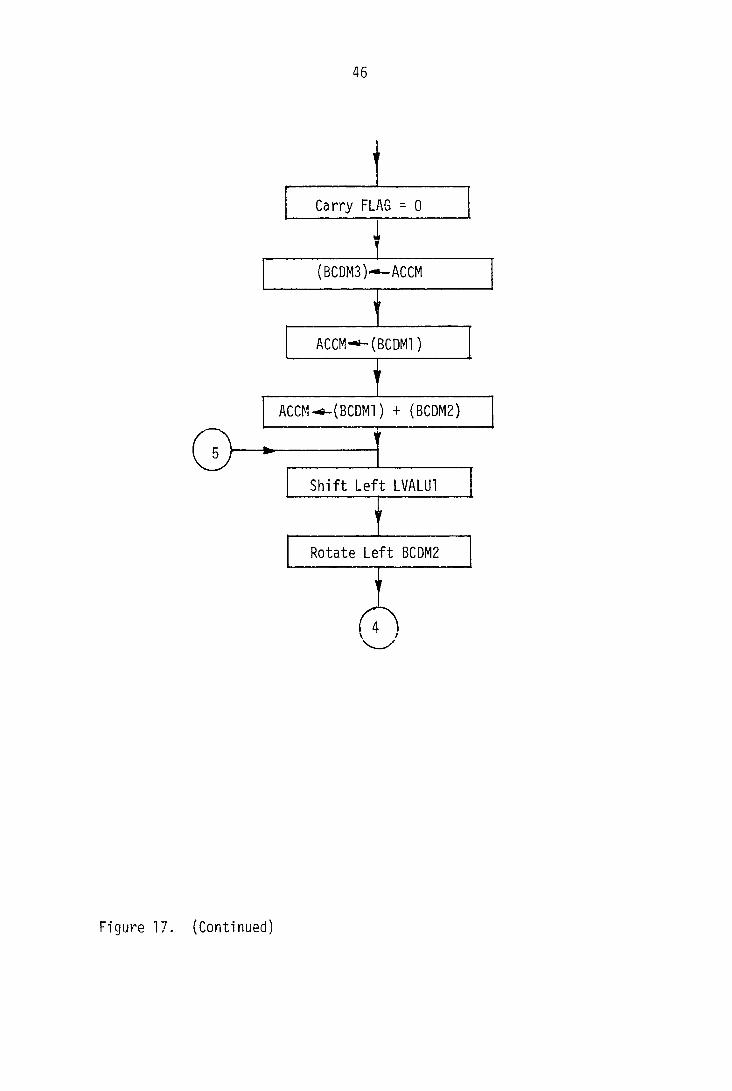
BCD to hexadecimal conversion subroutine
The three-digit address, both for starting and stopping points of the
VCG loops, is selected from the BCD switches. These three-digit addresses
have to be converted to hexadecimal numbers to simplify the programming
(it allows the use of an indirect addressing mode). It takes 90 yseconds
to execute the conversion subroutine. The flow diagram for this subrou
tine is shown in Figure 17. The use of BCD switches also allows the
operator to get timing information (in base 10 rather than base 16) about
the different selected loops. By subtracting the starting address from
the stopping address one can calculate the time elapsed in milliseconds
(sampling rate of 1000) in tracing the displayed loop during the actual
cardiac cycle.
40
i Set Y = 0
I (LPTR + 1) = (LPTR + 1) + 4
1 (TLPTR+1)--(TLPTR+1) + 4
I (TLPTR+1) = (TLPTR+1) + 4
•—t ACCM«»-(LPTR), Y
r~
Horizontal Input-^ACCM
I ACCM«4-(TLPTR), Y
Vertical Input*-ACCM
Display (x,y] Using CB1 of PlA-5
Figure 16. Routine to display the VCG loop on the CRT
41
Yes
HPTR-LPTR?
(LPTR+1)-«-( LPTR+l) + 4
" Î (LPTR+l)«»-(LPTR+l) + 4
Horizontal Input«s-y
\/
Figure 16. (Continued)
42
Vertical Input-«•-(LPTR+l), Y
Display (x,y) Using CB1 ,of HA-5
PTR-LPTR
LPTR = LPTR + 1
Figure 16. (Continued)
43
1 b X XREG = 0?
Shift Right BCD2
XREG = XREG - 1
Set Digit Counter XREG = 5
BCDM3 = 0 LVALUl = 64 (HEX)
LVALU = A (HEX)
Set Locations
Figure 17. Binary coded decimal to hexadecimal conversion routine
44
Yes —^
Carry FLAG = 0
ACCH -»-BCDl + LVALU
Shift Left LVALU
Set Digit Counter XREG=5
W 1
ACCM-^(BCDM3)
Q ' LZ XREG = XREG - 1
I
Figure 17. (Continued)
45
Return From Subroutine
Yes
Yes
BCDMl = BCDM1 + 1
ACCM = {BCDM3)
Carry FLAG = 0
XREG = 0
Shift Right (BCD2)
Figure 17, (Continued)
46
Shift Left LVALUl
Rotate Left BCDM2
Carry FLAG = 0
(BCDM3)--ACCM
ACCM.*-(BCDM1) + (BCDM2)
Figure 17. (Continued)
47
SIMULATION
In any microprocessor-controlled instrumentation, designing error-
free software is the major problem. Hardware design is not as complicated
if the interfacing is done using microprocessor-compatible integrated
circuits. To complete the design of this VCG system, the software was
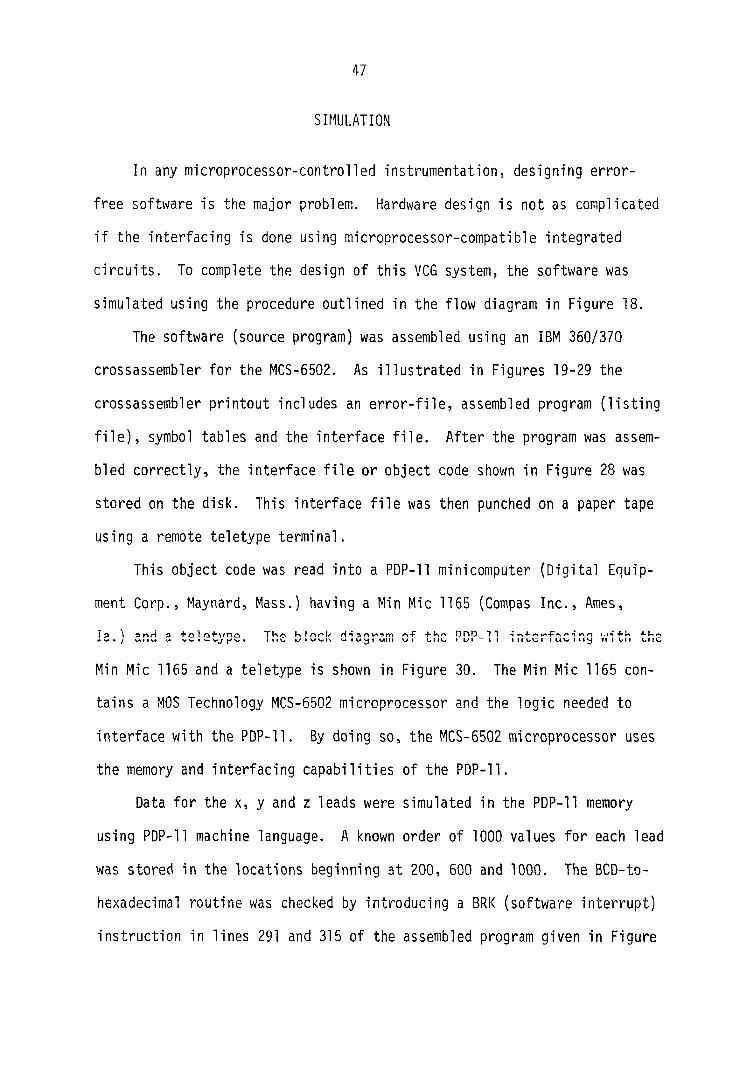
simulated using the procedure outlined in the flow diagram in Figure 18.
The software (source program) was assembled using an IBM 360/370
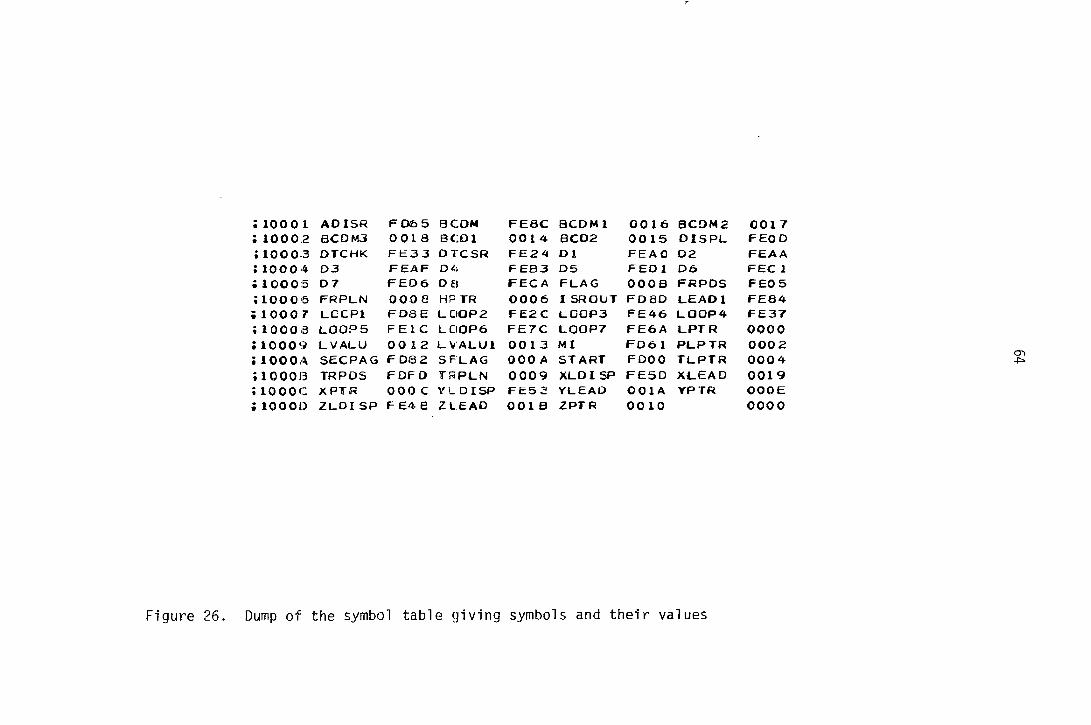
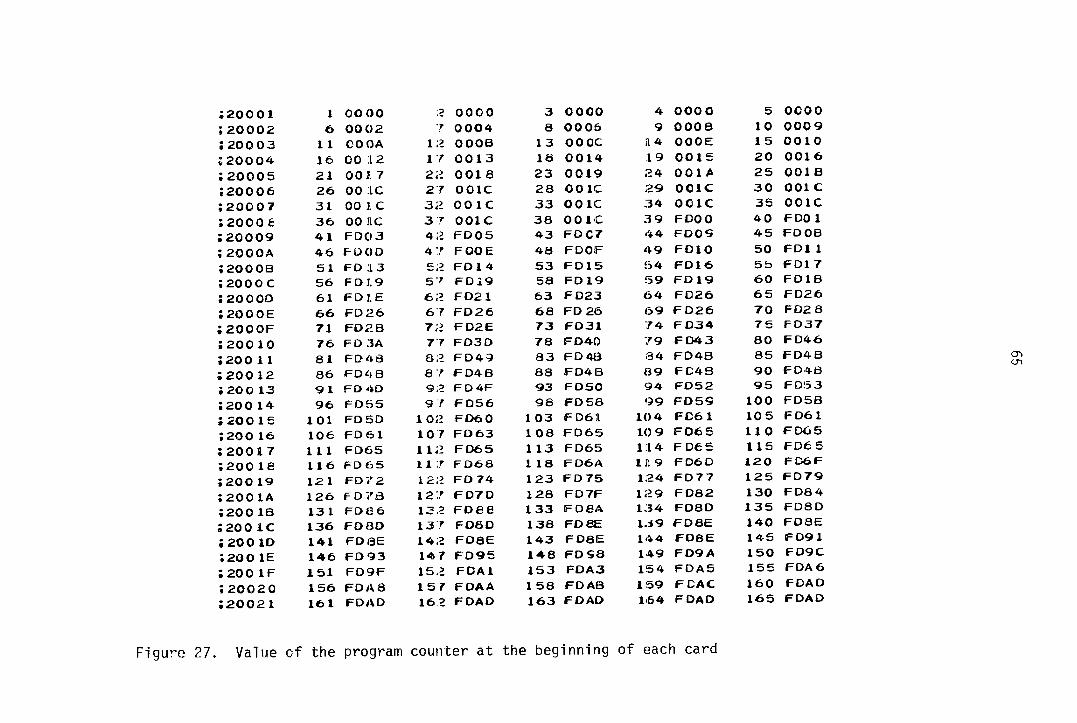
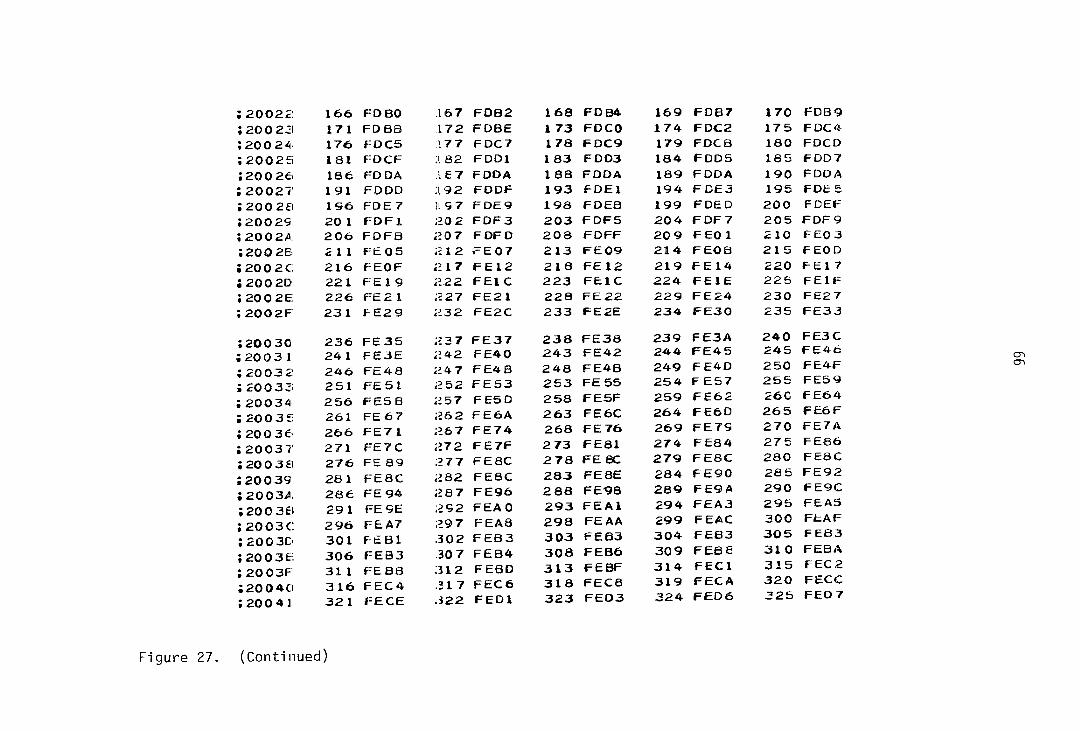
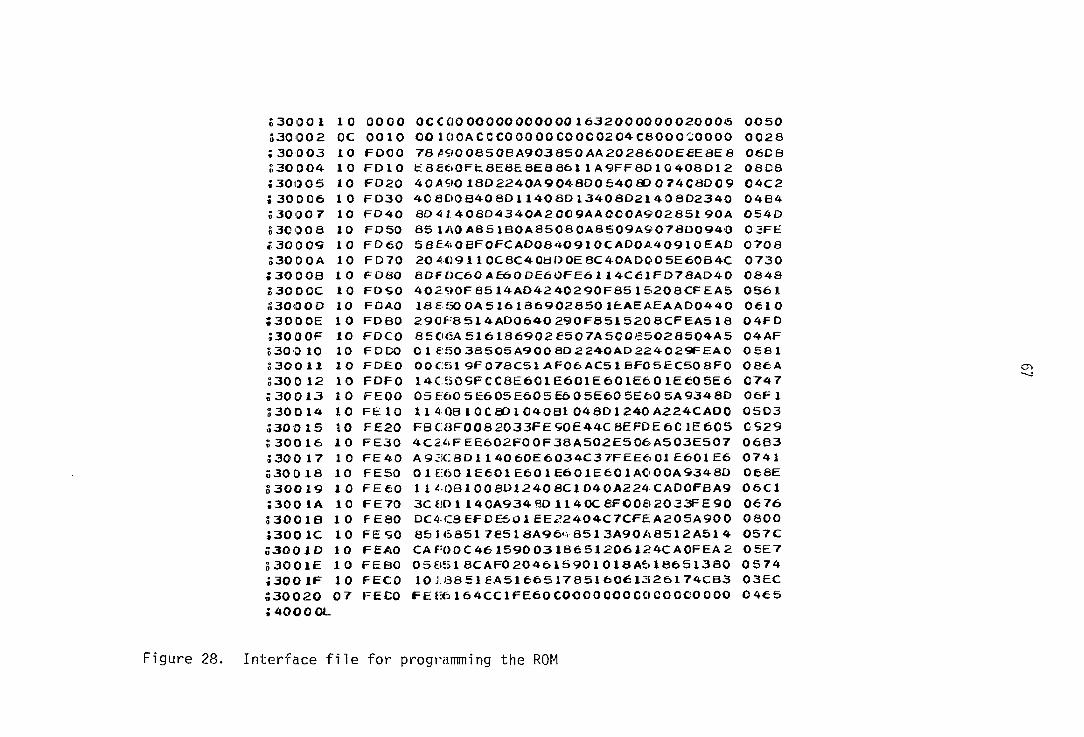
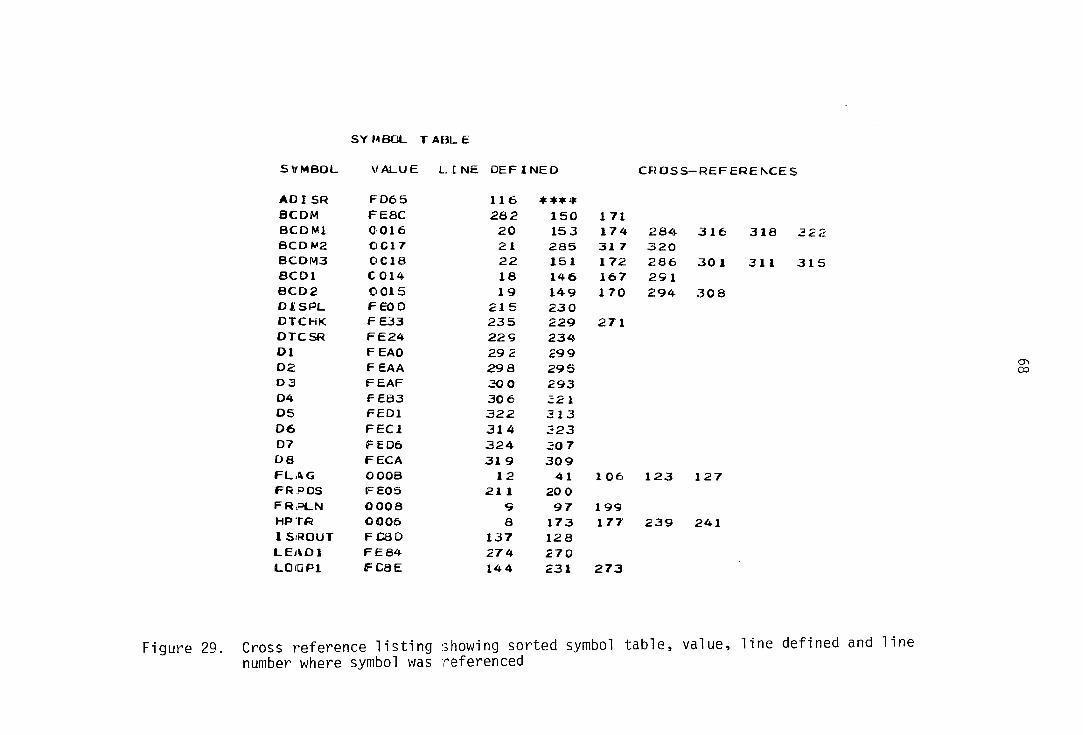
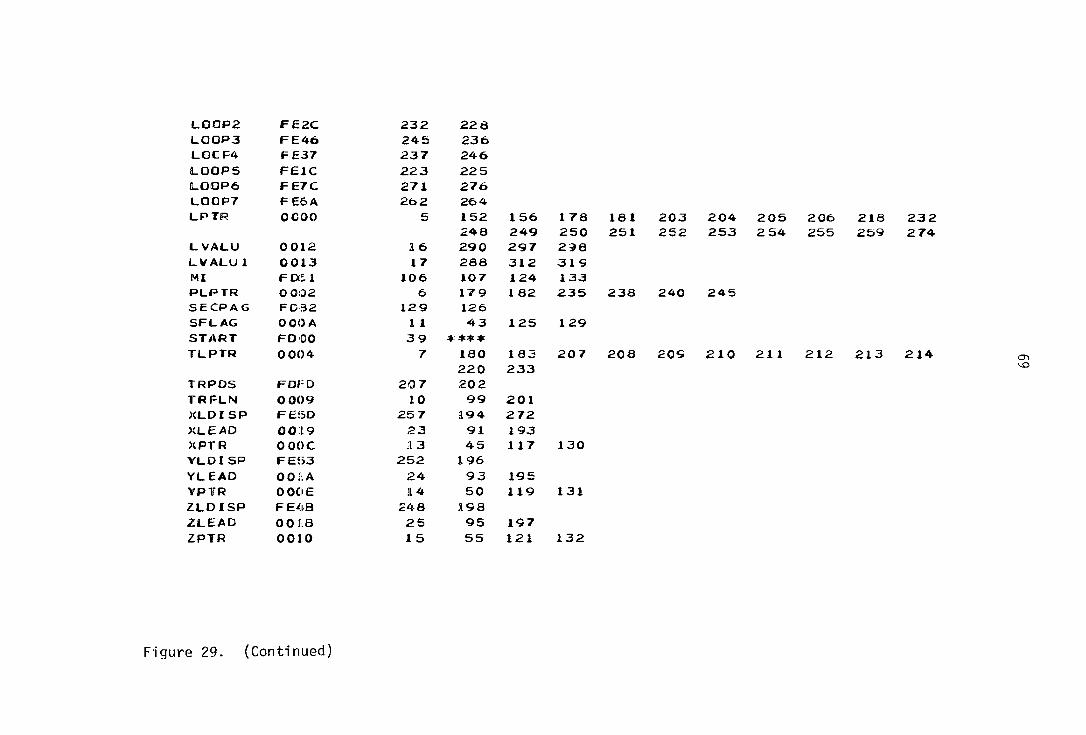
crossassembler for the MCS-6502. As illustrated in Figures 19-29 the
crossassembler printout includes an error-file, assembled program (listing
file), symbol tables and the interface file. After the program was assem
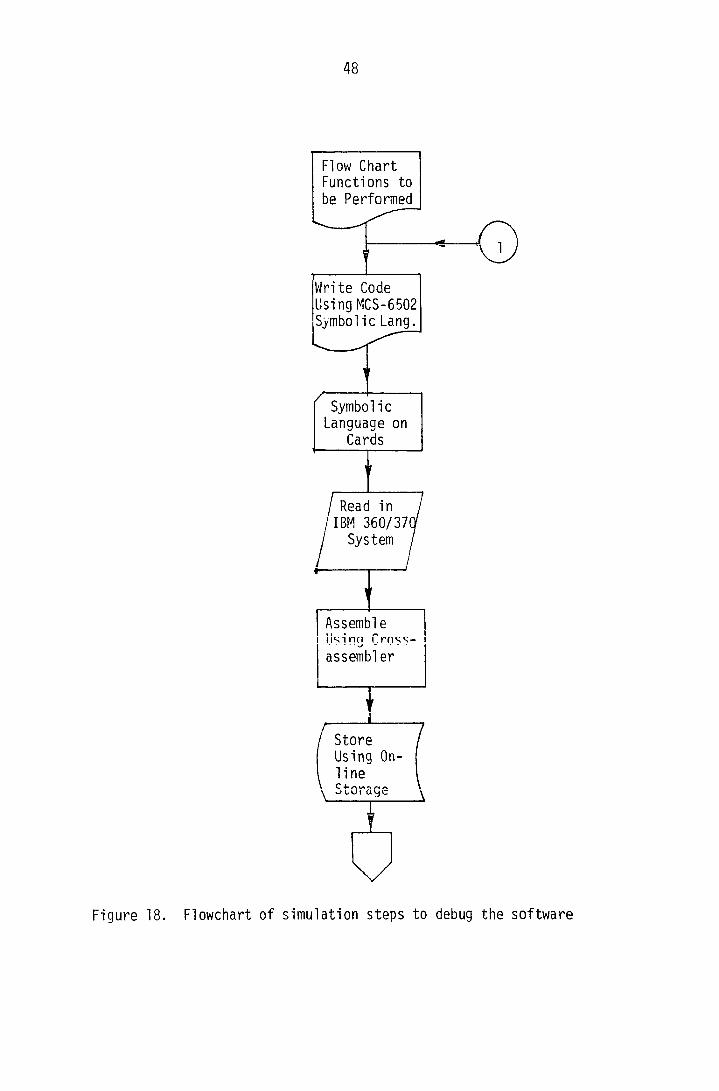
bled correctly, the interface file or object code shown in Figure 28 was
stored on the disk. This interface file was then punched on a paper tape
using a remote teletype terminal.
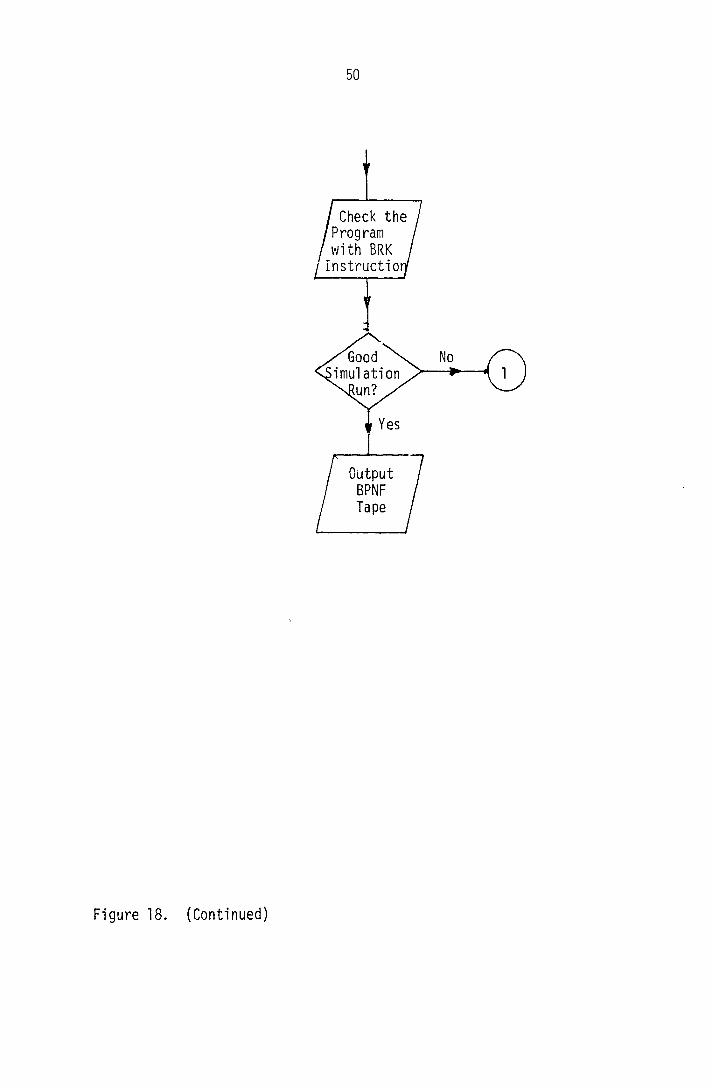
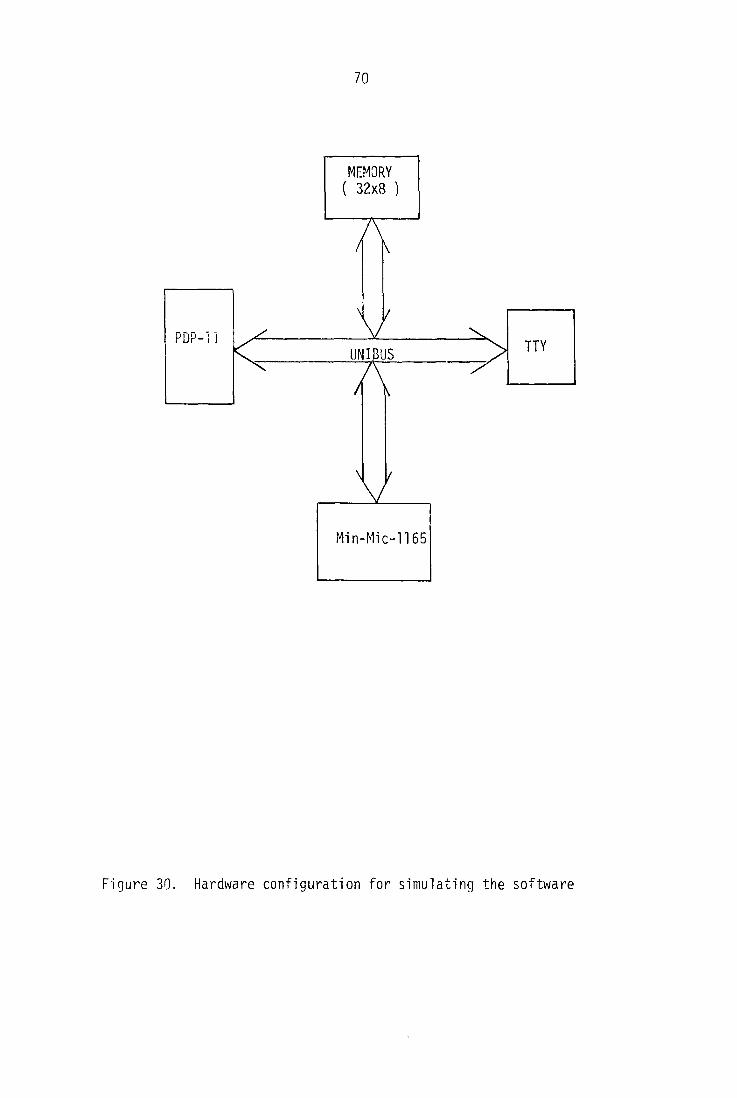
This object code was read into a PDP-11 minicomputer (Digital Equip
ment Corp., Maynard, Mass.) having a Min Mic 1165 (Compas Inc., Ames,
T a \ 3 Mri a Thn 4» ODD 11 * V» » / I I IX» !_/ I V i \ V* I w y I uni v i U11 tL / l I I V1IOI I VI IC
Min Mic 1165 and a teletype is shown in Figure 30. The Min Mic 1165 con
tains a MOS Technology MCS-6502 microprocessor and the logic needed to
interface with the PDP-11. By doing so, the MCS-6502 microprocessor uses
the memory and interfacing capabilities of the PDP-11.
Data for the x, y and z leads were simulated in the PDP-11 memory
using PDP-11 machine language. A known order of 1000 values for each lead
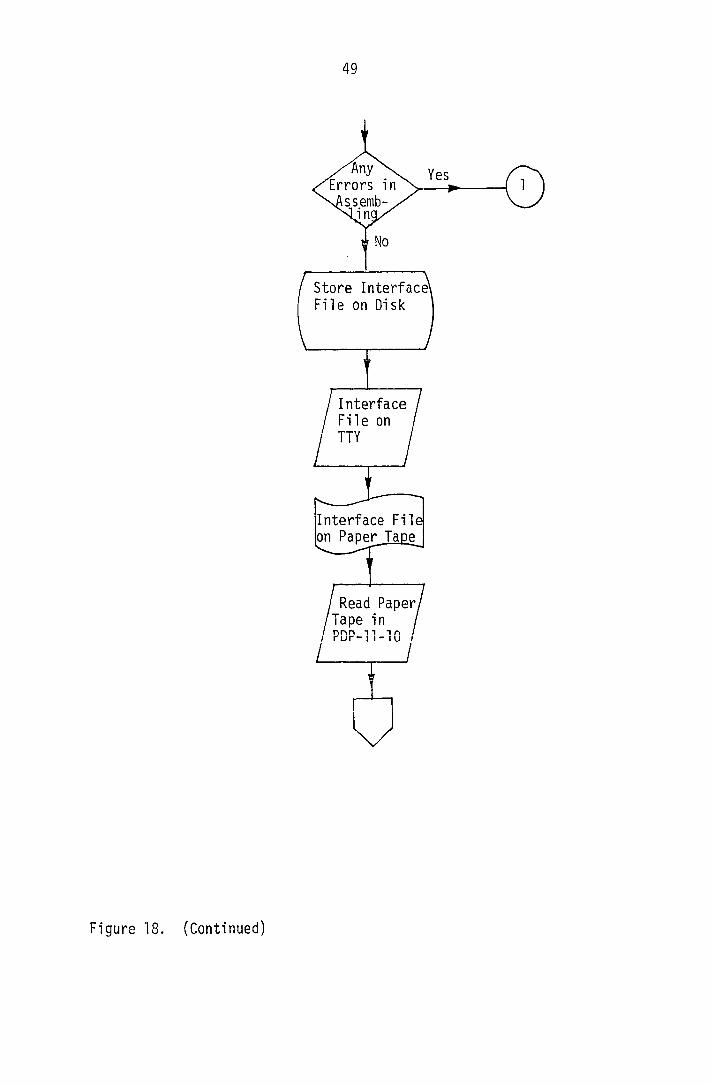
was stored in the locations beginning at 200, 600 and 1000. The BCD-to-
hexadecimal routine was checked by introducing a BRK (software interrupt)
instruction in lines 291 and 315 of the assembled program given in Figure
48
Flow Chart Functions to be Performed
?
Write Code Using MCS-6502 Symbol ic Lang.
Symbolic Language on
Cards
Read in IBM 360/37C
System
I Assemble using Cross-assembler
I Store Using Online Storage
Figure 18. Flowchart of simulation steps to debug the software
49
Any Errors in
ssemb-in
Store Interface\ File on Disk
Interface File on TTY
Interface File on Paper Tape
Read Paper/ 'Tape in
/ rur-ll-lO / L I
Figure 18. (Continued)
50
/ Check the (Program with BRK
Instruction/
Yes
Output BPNF Tape
Figure 18. (Continued)
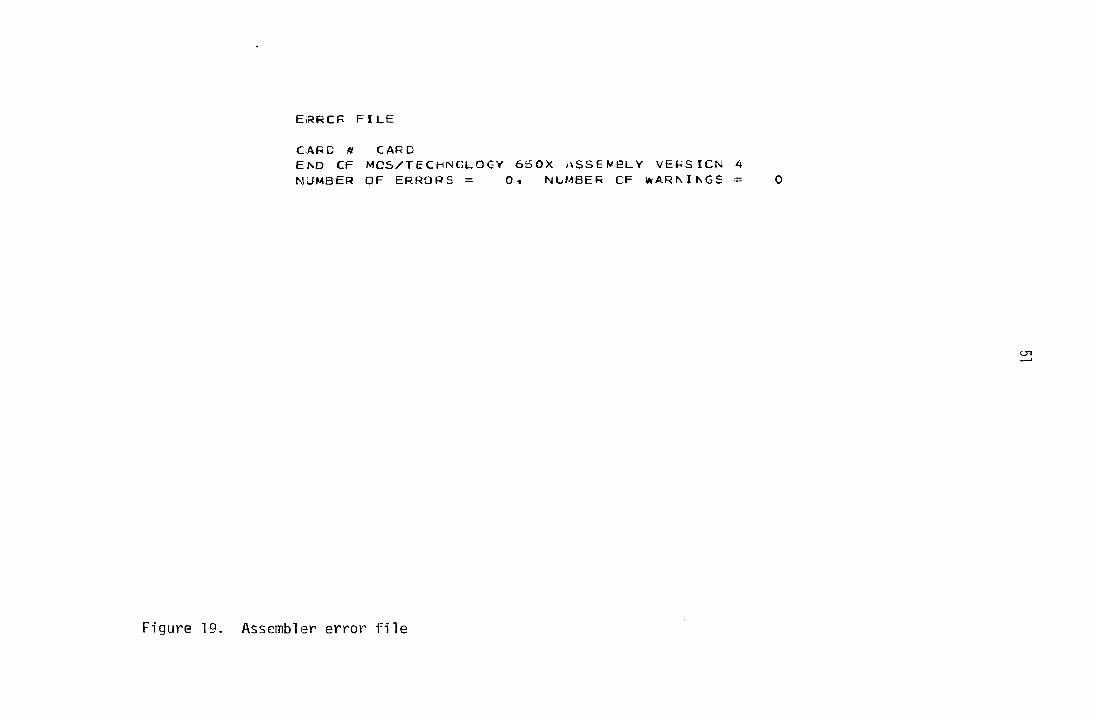
E I R R C F F I L E
C A R D U C A R D E N D C P M C S / T Ê C H N C L O C - Y 6 5 0 X A S S E M B L Y V E P S I C N 4 N U M B E R O F E R R O R S = 0 « N U M B E R C F E A R N I N G S = 0
Figure 19. Assembler error file

2 3
; S E 7 P A G E C N E F C A ( I C R K I N G 4 R E A ; A C C R E S S VALUES ARE ASSIGNED FOR ZERO PAGE ADORE SING
5 0 0 0 0 0 0 0 0 L F T F • V W O R C $ 0
6 0 0 0 2 0 0 C O P L P T R . K C R D $ 0
7 0 0 0 4 0 0 0 0 T L P T R . W O R D S O
a 0 0 C 6 C O C O H F T R . K K C F D $ 0
9 0 0 0 8 1 6 F R P L N . B Y T E $ 1 6
i 0 0 0 0 9 3 2 T R F L N . B Y T E $ 3 2
1 1 0 0 C A C O S F L A G . B Y T E S O
1 2 O O O B 0 0 F L A G . B Y T E $ C
1 3 C O C C 0 0 02 X P T P . H C F D $ 2 0 0
1 4 O O O E C O 0 6 Y F T R . A C R D seo 0 I S 0 0 1 0 C O 1 0 Z P T R . W C R D $ 1 0 0 0
L E 0 0 1 2 O A L V A L L . E Y T E $ A
1 7 0 0 1 3 C O L V A L L 1 . B Y T E $ 0
1 8 0 0 1 4 0 0 ecc 1 . E Y T E $ 0
1 9 0 0 1 5 C O B C D 2 • B Y T E $ 0
20 0 0 1 6 0 0 B C D M 1 . B Y T E $ C
2 1 0 0 1 7 C O B C D N 2 . B Y T E S O
2 2 0 0 1 8 C O B C D y3 . B Y T E so 2 3 0 0 1 9 0 2 X L E A D . B Y T E s 2
2 4 O C I A 0 4 Y L E A C . B Y T E $ 4
2 5 0 0 I B 0 6 Z L E A D . B Y T E S £
Figure 20. Initialization for zero-page addressing
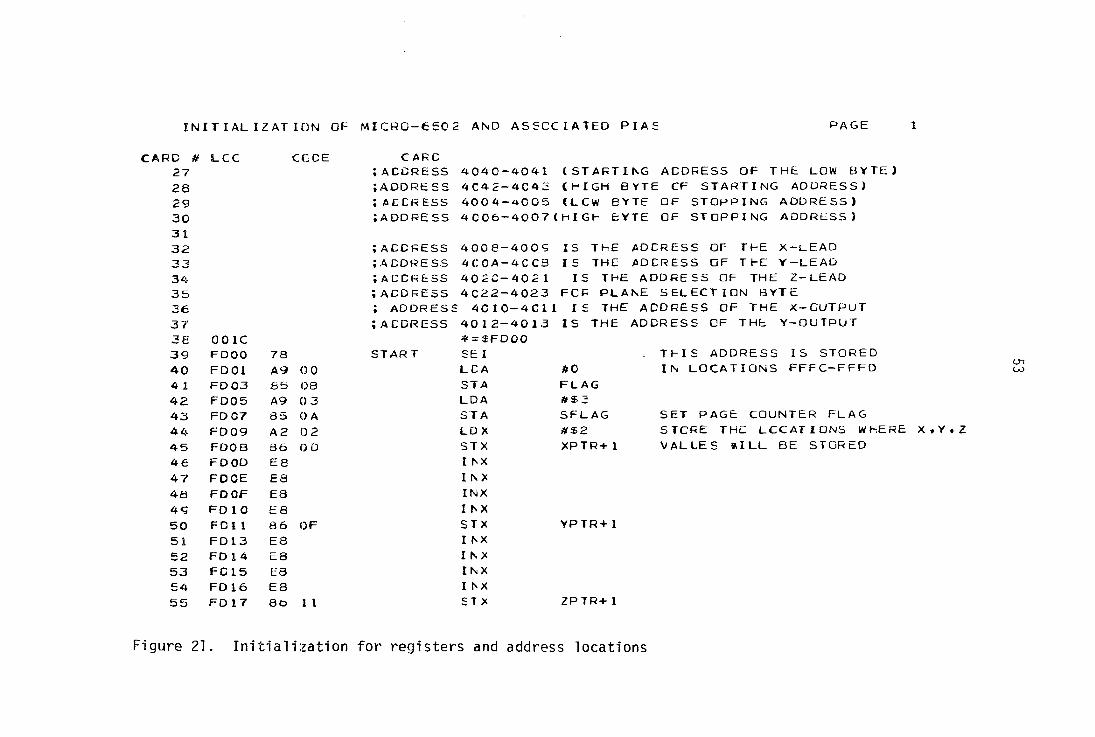
INITIALIZATION OF MICRO-ESO 2 AND ASSOCIATED PIA £ PAGE
!D L.CC CCCE C ARC 27 ;ACCRESS 4040- 4041 (ST ART ING ADDRESS OF THE LOW BYTE) 2 8 ; A D D R E S S 4C42- 4045 (HIGH BYTE CF STARTING ADDRESS) 29 ;ACCRESS 4004- 4005 (LCW BYTE OF STOPPING ADDRESS) 30 ;ADDRESS 4 0 0 6 — 4007(HIGM EYTE OF STOPPING ADDRESS) 3 1 32 ;ACCRESS 4 00 8- 400 9 IS THE ADCRESS OF THE X-LEAD 33 ; ADDRESS 4C0A- 4C CB IS THE ADCRESS OF THE Y-LEAÛ 34 ; ACCRESS 402C- 402 1 IS THE ADDRESS OF THE Z-LEAD 35 ;ACDRESS 4C22-4023 FOR PLANE SELECTION BYTE 26 ; ADDRES £ 4C 10 -4011 IS THE ADDRESS OF THE X-OUTPUT 37 ; A C C R E S S 40 1 2-40 13 IS THE ADDRESS OF THE Y-OUTPUT 36 O O l C • * - $ F D O O
3 9 F D O O 7 8 STAR T £EI THIS ADDRESS IS STORED 4 0 F D O i A9 0 0 LCA A O IN LOCATIONS FFFC-FFFD 4 1 FDC3 85 08 3TA FLAG 42 F 0 0 5 A9 0 3 LDA 43 F D 0 7 85 0 A ST A SFL AG SET PAGE COUNTER FLAG 44 F009 A2 0 2 LD X «$2 STORE THE LOCATIONS WHERE 45 F O O B 8 6 0 D STX XPTR+ 1 VALLES * ILL BE STORED 46 FOOD EG I HX 47 FDCE E S I NX 48 F D O F E 3 INX 4Ç FO 10 E8 I ̂X 5 0 FDL 1 86 OF STX YPTR+1 51 FD13 E8 I N X
52 FD 1 4 E 8 INX 53 FC15 F8 INX 54 FOI 6 E B INX 5 5 FD 17 8& 1 1 STX ZPTR+ 1
Figure 21. Initialization for registers and address locations
5 7 5 8 5 9 60 6 1 6 2
62 6 4 6 5 66
6 7 66 65 7 0 7 1 7 2 7 3 7 4 7 5 7 6 7 7 7 8 7 9 80
e i 62
21 .
INITIAL IZATION
L O C C O D E
F D 1 9 A 9 F F F D I B 8 0 1 0 4 0 F O I E a o 1 2 4 C
F D 2 1 A 9 0 1 F D 2 3 e o 2 2 4 0
F D 2 6 A 9 0 4 F D 2 8 8 D 0 5 4 0
F D 2 B 8 D 0 7 4 0 F D 2 E eo C 9 4 C F D 3 i 3 0 0 8 4 0 F D 3 4 £ D 1 1 4 0 F D 3 7 e o 1 3 4 C F 0 3 A a o 2 1 4 0 F 0 3 D 8 D 2 3 4 0 F D 4 0 8 D 4 1 4 0 F D 4 3 S D 4 3 4 C F D 4 6 A 2 0 0 F D 4 8 9 A F D 4 9 A O 0 0
P A G £ 2
C ARC
L C A A $ F F S T A $ 4 0 1 0 S T A S 4 0 1 2
L C A 1 S T A $ 4 0 2 2
S E T P I A F O R O U T P U T M O D E
; T H I S P A R T C F T H E P P C G F A M S E T S A L L P I A ' S C O N T R O L ; R t G i ; S T E R S B I T 2 = 1 T C A D D R E S S T H E O U T P U T R E G I S T E R S ; R A T f - E R T H A N T H E D A T A D I R E C T I O N R E G I S T E R S
L D A # $ 4 S T A $ 4 0 C 5
S T A $ 4 0 0 7 S T A $ 4 C C 9 S T A $ 4 0 C B S T A $ 4 0 1 1 S T A $ 4 0 1 3 S T A $ 4 0 2 1 S T A $ 4 C 2 3 S T A $ 4 0 4 1
S T A $ 4 0 4 3
L D X # 0 T X S L D Y # 0
cn
S E T S T A C K P C I N T E R = 1 0 0
(Continued)
I M T I A L I Z A T I C N P A G E
C A R D t f 84 65 86 67 86 89
L Q C C O D E C A R D
; T H I £ P A R T OF T H E PROGRAM S E T S A L L T H E ; F 0 R R I G H T P L A N E A N D L E A D S E L E C T I O N
R E G I S T E R S
9 0 F 0 4 e A 9 0 2 L O A AS2 SI F 0 4 D 8 5 1 9 S T A X L E A D
9 2 F D 4 F O A A S L A
9 3 F D 5 0 8 5 1 A S T A Y L E A D
9 4 F D 5 2 O A A S L A 9 5 F D 5 3 8 5 1 e S T A Z L E A O 9 6 F D 5 5 O A A S L A 9 7 F D 5 6 8 5 C 8 S T A F R P L N
9 8 F D 5 8 O A A S L A 9 9 F D 5 9 8 5 c s S T A T R F L N
1 0 0 F D 5 B A 9 0 7 L D A # $ 7
1 0 1 F D 5 D 3 D C 9 4 0 S T A $ 4 0 0 9
1 0 2 F D 6 0 5 8 C L I
1 0 3 ; W A I T L O O P F O R I N T E R R U P T
1 0 4 1 0 5 1 0 6 F 0 6 1 £ 4 0 8 M I C P X F L A G
1 0 7 F 0 6 3 F O F C B E Q M I
F R O M T H E A / D C O N V E R T E R S
Figure 21. (Continued)
T H I S R C U T 1 : N E L O A D S C A T A P A G E 4
CARD » 1 0 9
110 1 1 1
1 1 2
113 114 1 1 5
L O C C O D E C A R D
; T H E A D D R E S S E S O F T H E X - L E A D . Y - L E A C A N D Z - L E A D ; A R E 4 0 0 8 , 4 0 0 A , 4 0 2 0 R E S P E C T I V E L Y ( T H I S R O U T I N E L O A D S D A T A ( F R O M T H E A / D C O N V E R T E R S : T H E S P E C I F I E D M E M O R Y L O C A T I C N S
IN
1 1 6 F D 6 5 A O 0 a 4 0 A D I S R L D A $ 4 0 0 8 1 1 7 F D 6 8 9 1 O C S T A ( X P T R )
1 1 8 F D 6 A A D 0 A 4 0 L D A $ 4 0 0 A
1 1 9 F D C D S I O E S T A ( Y P T R )
1 2 0 F D 6 F A O 2 0 4 0 L D A $ 4 0 2 0 1 2 1 F C 7 2 9 1 1 0 S T A ( Z P T R )
1 2 2 F D 7 4 C 8 I N Y
1 2 3 F D 7 5 C 4 0 B C P Y F L A G 1 2 4 F D 7 7 D O E 8 B N E M I
1 2 5 F D 7 9 C 4 O A C P Y S F L A G 1 2 6 F D 7 B D O 0 5 B N E S E C P A G
1 2 7 F D 7 0 £ 6 08 I N C F L A G
1 2 8 F 0 7 F 4 C 8 D F D J M P I S R O O T 1 2 9 F 0 6 2 C 6 0 A S E C P i X G D E C S F L A G
1 3 0 F D £ 4 E 6 oo I N C X P T R + 1
1 3 1 F D 8 6 E 6 O F I N C Y P T R + 1
1 3 2 F D S B E 6 1 1 I N C Z P T R + 1
1 3 3 F D 8 A 4 C 6 i F D J M P M I
A D I S R F F F E . F F F F
<_n cn
1 3 4 D O N E L O A D I N G D A T A
Figure 22. Data acquisition routine
THIS ROUTINE IS TO CCNTROL DISPLAY PAGE 5
CARD * LCC CODE CA'RC 1 36 1 37 FD80 78 ESROIJT SE I 138 1 39 ;THI 3 PART OF THE PROGRAM LOADS THE STARTING 140 ;ANO S TOPPING ADDRESS FRCM THE THUMBWHEEL SWITCHES 14 1 ;AND C ALLS THE BCD TO HEX CCNVERSICN ROUTINE 142 143 144 F08E AD 4 0 4 O LOOPL LDA $4040 FETCH THE STARTING ADDRESS 145 F 091 29 OF AND #$0F 146 FD93 85 1 4 STA BCDL 147 FD95 AD 4 2 40 LDA $4042 148 FD98 29 0 F AND 4$0F 1 49 FD9A 85 1 5 STA BCD2 150 FD9C 20 8C FE JSR BCD M 151 F09F A5 1 8 LDA BC0M3 1 5 2 FDAL 85 00 STA LPTR 153 FOA3 A5 16 LDA BCDML 154 FDA5 18 CLC 1 55 FDA6 69 0 2 ADC «S2 156 FDA8 85 0 1 STA LPTR+1 157 FOAA EA NOP 158 FCA8 EA NOP 1 59 F DAC EA NOP
Figure 2 3 . Program to scan the front panel switches
F E T C H S T O P P I N G A D D R E S S
C A R D # L O C 1 6 1 1 6 2 1 6 3 1 6 4 1 6 5 F O A D A D 1 6 6 F D B O 2 9 1 6 7 F D B 2 8 5 1 6 8 F D B 4 A D 1 6 9 F O B 7 2 9 1 7 0 F O B 9 8 5 1 7 1 F D B B 2 0 1 7 2 F O B E A 5 1 7 3 F D C O 8 5 1 7 4 F D C 2 A 5 1 7 5 F D C 4 1 8 1 7 6 F C C 5 6 9 1 7 7 F D C 7 6 5 1 7 8 F D C 9 A 5 1 7 9 F D C B 3 5 1 8 0 F D C D 8 5 1 8 1 F D C F A 5 1 8 2 F O D l 8 5 1 8 3 F D D 3 8 5 1 8 4 F D D 5 A 9 1 8 5 F D D 7 . 3 D
CARD
U > A A N C S T A L D A A N D S T A
J S R
L D A S T A 1 _ D A C i - C A D C S T A
L D A
S T A S T A L D A S T A S T A L D A S T A
CODE
0 4 4 0 O F 1 4 0 6 4 0 O F 1 5 ac F E 1 a 06 1 6
O 2 0 7 00 0 2 0 4 0 1
0 3 0 5 00 2 2 4 0
Figure 23. (Continued)
P A G E
$ 4 0 0 4 * $ 0 F B C D ! $ 4 0 0 6 #$0F B C 0 2 BCDM B C D M 3 H P T R B C D M 1
# $ 2 H P T R + 1 L P T R P L P T R T L P T R L P T R + 1 P L P T R + 1 T L P T R + 1 *$0
$ 4 0 2 2
sc AN SWITCHES PA
ARD « LOC CODE CARD 187 ;THIS PART OF THE PROGRAM SCANS THE PLANE SELECT 188 ;s ITCHES so THAT THE DESIRED PLANE OR LEAD 189 ;CAN as D I SPLAYED 190 FDOA AD 2 2 4 0 LDA $4022 191 FOOD 29 FE AND «$FE 192 FDCF AO 00 LD Y *0 193 FDEL <15 1 9 CMP XLEAD 194 FOE3 FO 78 B E a XLDISF 195 FOES (:5 1 A CMP YLEAD 196 FOE7 FO 6 A BEG VLDISP 197 F0E9 C5 1 8 CMP 2LEAD 1 98 FOES 4=0 5 E BEQ ZLOISP 199 FOED ( :5 0 8 CMP FRFLN 200 FCEF f -0 1 4 BEQ FRPDS 201 FDFL ( :5 C9 CMP TRPLN 20 2 FOF3 FO 08 BEQ TRPDS 203 F0F5 £E6 0 1 INC LPTR+ 1 20 4 FDF7 t ie 01 INC LPTR+1 205 FDF9 f î6 0 1 I NC LPTR+ 1 206 FDFB E6 0 1 INC LPTR+1 207 FOFO E:6 05 TRPDS INC TLPTR+1 2 0 8 F OFF £•6 05 INC TLPTR+I 209 FEO 1 E6 05 INC TLPTR+1 210 FE03 E6 05 INC TLPTR+1 21 1 FEO 5 E :6 05 FRPDS INC TLPTR+1 212 FE07 E.6 05 INC TLPTR+1 213 FE09 E :6 05 INC TLPTR+1 21 4 FEOB E:6 05 I NC TLPTR+1 21 £ FEOD A9 34 OX SPL LDA #$34 216 FEOF SO 1 1 40 STA $401 1
Figure 23. (Conti nued)
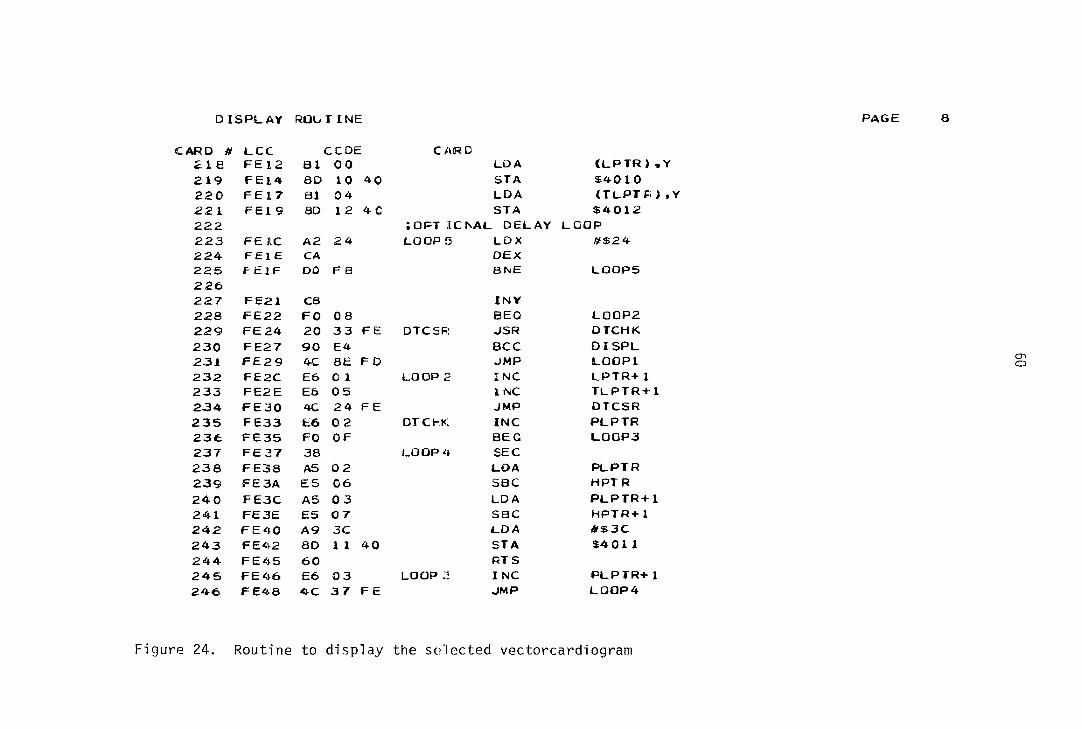
D I S P S - A Y ROUTINE P A G E a
C A R D » L C C C C D E C A R D 2 1 8 F E 1 2 B 1 0 0 L D A ( L P T R ) , Y
2 1 9 F E 1 4 S D 1 0 4 0 S T A $ 4 0 1 0
2 2 0 F E 1 7 S I 0 4 L D A ( T L P T P ) , Y
2 2 1 F E l 9 8 D 1 2 4 C S T A $ 4 0 1 2
2 2 2 ; O F T I C N A C D E L A Y L O O P
2 2 3 F E A C A 2 2 4 L O O P 5 L D X # $ 2 4 2 2 4 F E 1 Ê C A D E X 2 2 5 F E l F D O F B B N E L O O P S 2 2 6 2 2 7 F E 2 1 C 8 I N Y 2 2 8 F E 2 2 F O 0 8 B E Q L O O P 2 2 2 9 F E 2 4 2 0 3 3 F E D T C S R J S R O T C H K
2 3 0 F E 2 7 9 0 E 4 B C C D I S P L 2 3 1 F E 2 9 4C 8 E F D J M P L O O P l 2 3 2 F E 2 C E 6 0 1 L O O P 2 I N C L P T R + 1 2 3 3 F E 2 E E 6 0 5 I N C T L P T R + 1
2 3 4 F E 3 0 4 C 2 4 F E J M P D T C S R 2 3 5 F E 3 3 f c 6 0 2 D T C K K . I N C P L P T R 2 3 f c F E 3 5 F O O F B E G L O O P 3 2 3 7 F E 3 7 3 8 L O O P 4 S E C 2 3 8 F E 3 8 A 5 0 2 L O A P L P T R
2 3 9 F E 3 A E 5 0 6 S B C H P T R
2 4 0 F E 3 C A S 0 3 L D A P L P T R + 1
2 4 1 F E 3 E E 5 0 7 S B C H P T R + 1
2 4 2 F E 4 0 A 9 3 C L D A « $ 3 C
2 4 3 F E 4 2 a o 1 1 4 0 S T A $ 4 0 1 1
2 4 4 F E 4 5 6 0 R T S 2 4 5 F E 4 6 £ 6 0 3 L O O P I N C P L P T R + 1
2 4 6 F E 4 8 4 C 3 7 F E J M P L O O P 4
Figure 24. Routine to display the selected vectorcardiogram
D I S P L A V
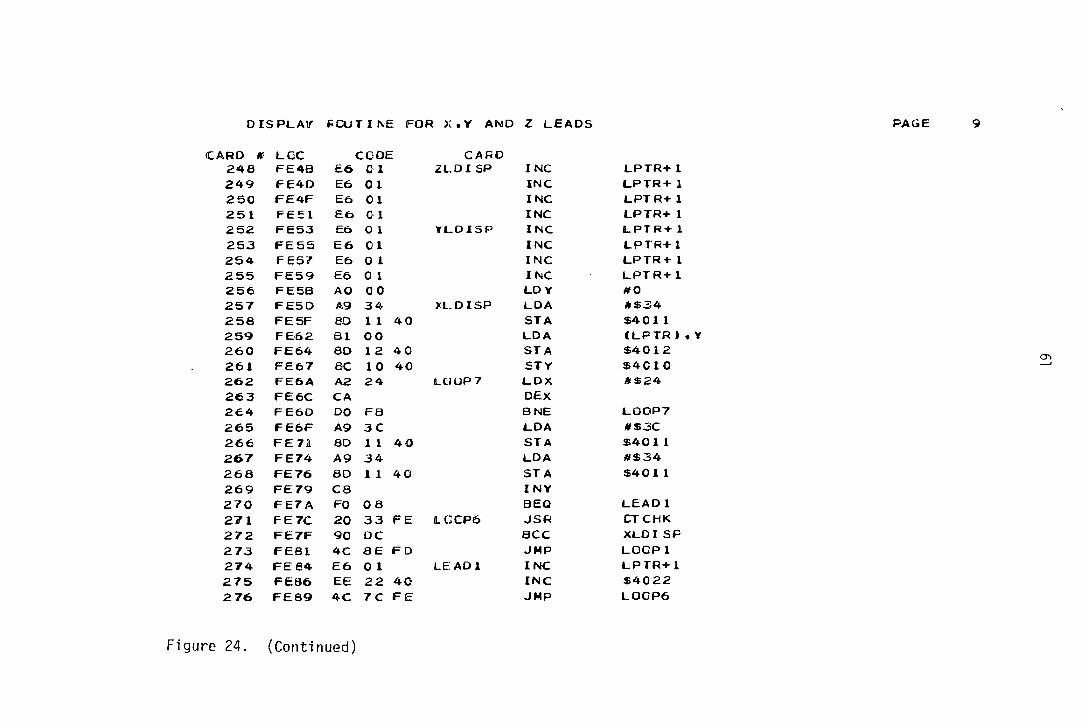
C A R D * LOG 2 4 8 F E 4 B 2 4 9 F E 4 D 2 5 0 F E 4 F 2 5 1 F E e i 2 5 2 F E 5 3 2 5 3 F E 5 S 2 5 4 F E 5 7 2 5 5 F E 5 9 2 5 6 F E 5 B 2 5 7 F E 5 D 2 5 8 F E 5 F 2 5 9 F E 6 2 2 6 0 F E 6 4 2 6 1 F E 6 7 2 6 2 F E 6 A 2 6 3 F E 6 C 2 6 4 F E 6 0 2 6 5 F E 6 F 2 6 6 F E 7 a 2 6 7 F E 7 4 2 6 8 F E 7 6 2 6 9 F E 7 9 2 7 0 F E 7 A 2 7 1 F E 7 C 2 7 2 F E 7 F 2 7 3 F E B l 2 7 4 F E 8 4 2 7 5 F E B 6 2 7 6 F E 8 9
P O U T I N E F O R X , Y A N D Z L E A D S
CODE CARD E6 0 1 2LDI SP INC E6 0 1 INC E6 0 1 INC E6 0 1 INC E6 0 1 YLDISP INC E6 01 INC E6 0 1 INC E6 0 1 INC AO 0 0 LD Y A9 34 XL D I SP LDA 80 1 1 40 STA 31 0 0 LDA 8D 1 2 40 STA 8C 1 0 40 STY A2 24 LOOP 7 LDX CA DEX DO FB BNE A9 3C LDA 8D 1 1 40 STA A9 34 LDA ao 1 1 40 STA cs I NY FO 0 8 BEQ 20 33 FE LCCP6 JSR 90 DC see 4 C S E F D J M P E6 0 1 L E A D l INC EE 22 40 INC 4C 7 C F E J M P
Figure 24. (Continued)
L P T R + 1 L P T R + 1 L P T R + 1 L P T R + 1 L P T R + 1 L P T R + I L P T R + 1 L P T R + 1 # 0
$ 4 0 1 1 ( L P T R ) , $ 4 0 1 2 $ 4 0 1 0 #$24
L O G P 7 * $ 3 C $ 4 0 1 1 # $ 3 4 $ 4 0 1 1
L E A D 1 C T C H K X L D I S P L O O P 1 L P T R + 1 $ 4 0 2 2 L O O P 6
R O U T I N E T C C O N V E R T B J Î N A R V C O O E D D E C I M A L N U M B E R T O H E X A O E C I M A P A G E 1 0
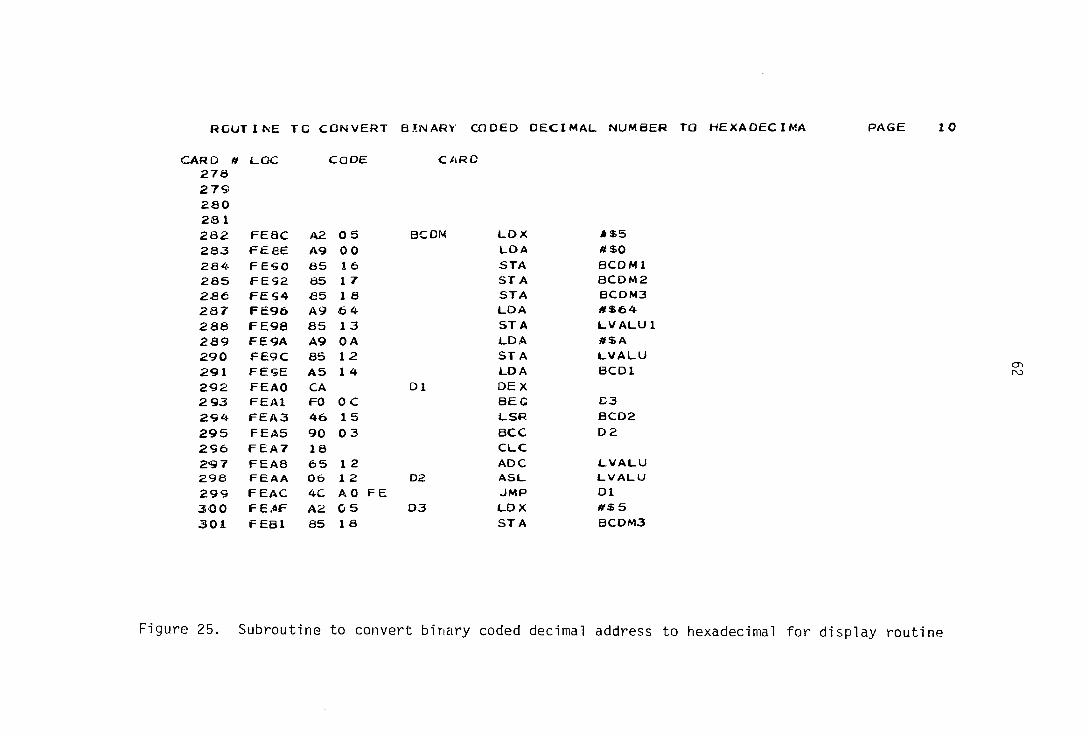
CARD Of L.QC CODE CARD 2 7 8 2 7 9 2 8 0
28 1
2 8 2 F E 8 C A 2 0 5 B C D M C O X * $ 5
2 8 3 F e e E A 9 0 0 U O A * $ 0
2 8 4 F E 9 0 8 5 1 6 S T A B C D M l 2 8 5 F E 9 2 8 5 I 7 S T A B C D M 2 2 8 6 F E S 4 8 5 1 8 S T A B C D M 3
2 8 7 F E 9 6 A 9 6 4 C D A * $ 6 4
2 8 8 F E 9 8 8 5 1 3 S T A L V A L U 1
2 8 9 F E 9 A A 9 O A L D A * $ A
2 9 0 F E 9 C 8 5 1 2 S T A L V A L U
2 9 1 F E 9 E A 5 1 4 L D A B C D l
2 9 2 F E A O C A D l D E X 2 9 3 F E A l F O 0 C B E G C 3
2 9 4 F E A 3 4 6 1 5 i _ S R B C D 2
2 9 5 F E A 5 9 0 0 3 B C C D 2
2 9 6 F E A 7 1 8 C L C
2 9 7 F E A 8 6 5 1 2 A D C L V A L U 2 9 8 F E A A 0 6 1 2 D 2 A S U L V A L U
2 9 9 F E A C 4 C A O F E J M P D l 3 < 0 0 F E ^ F A 2 0 5 0 3 ( _ D X 5
3 0 1 F E B l 8 5 1 8 S T A B C O M 3
Figure 25. Subroutine to convert binary coded decimal address to hexadecimal for display routine
BCD T C H E X C O N T J t N U E D P A G E 1 1
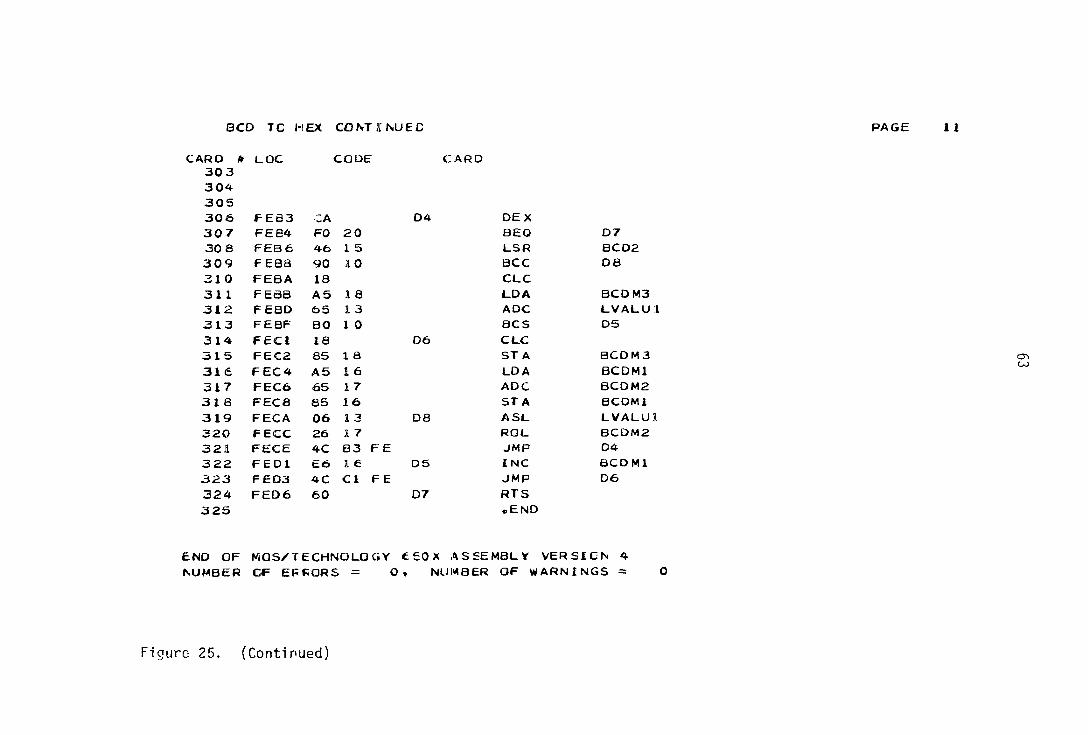
C A R D A 3 0 3 3 0 4 3 0 5
L O C CODE C A R D
3 0 6 F E B 3 : A 0 4 D E X 3 0 7 F E G 4 F O 2 0 B E Q D 7 3 0 8 F E B 6 4 6 1 5 L S R B C D 2 3 0 9 F E B B 9 0 1 0 B C C D 8
3 1 0 F E B A 1 8 C L C 3 1 1 F E B B A S 1 8 L D A B C D M 3 3 1 2 F E B D 6 5 1 3 A D C L V A L U I 3 1 3 F E B F B O 1 0 BCS D5 3 1 4 F E C I 1 8 0 6 C L C 315 F E C 2 85 1 8 ST A B C D M 3
3 1 e F E C 4 A S 1 6 L D A B C D M l 3 1 7 F E C 6 65 1 7 ADC B C D M 2 3 1 8 F E C a 8 5 1 6 ST A B C D M l
3 1 9 F E C A 0 6 I 3 D 8 A S L L V A L U i
3 2 0 F E C C 2 6 1 7 R O L B C D M 2
321 F E C E 4 C S3 FE JMP 04 322 FED! £6 I e D5 INC BCDMl 323 FED3 4 C C l F E JMP 0 6
3 2 4 F E 0 6 6 0 0 7 H T S
3 2 5 « E N D
cr, CO
E N D O F M O S / T E C H N O L O G Y t S O X A S S E M B L Y V E R S I O N 4 N U M B E R C F E R R O R S = 0 . N U M B E R O F W A R N I N G S = 0
Figure 25. (Continued)
1 0 0 0 1 A D I S R F D 6 5 a C O M F E 8 C B C D M 1 0 0 1 6 B C O M Z C O l 7 1 0 0 0 2 B C 0 M 3 001 a B C O l 0 0 1 4 B C 0 2 0 0 1 5 D I S P L F E O D 1 0 0 0 3 DTCHK F E 3 3 o r c s R F E 2 4 oi F E A O D 2 F E A A 1 0 0 0 4 D 3 F E A F D < r F E B 3 D 5 F E D l D a F E C 1 1 0 0 0 5 D 7 F E 0 6 D e i F E C A F L A G O O O B F R P D S F E 0 5 1 0 0 0 6 F R P L N 000 e HP T R 0 0 0 6 I S R O U T F D B D L E A D l F E 8 4 100 or L C C P l F D 8 E L O O P 2 F E 2 C L O O P 3 F E 4 6 L O O P 4 F E 3 7 1 0 0 0 3 L O O P S F E l C L O O P 6 F E 7 C L O O P 7 F E 6 A LPTR 0000 1 0 0 0 9 L V A L U 00 1 2 L V A L U l 0 0 1 3 M I F 0 6 1 PLPTR 0 0 0 2 lOOOA S E C P A G F D 8 2 S FLAG 0 0 0 A START F D O O TLPTR 0 0 0 4
1 0 0 0 1 3 T R P D S F O F O T f i P L N 0 0 0 9 X L O I S P F E 5 D XLEAD 0 0 1 9 lOOOC X P T R 0 0 0 C Y L D I S P F E 5 3 YLEAD OOIA YPTR OOOE lOOOO ZLDISP F E 4 e ZLEAD 0 0 1 B ZPTR 0 0 1 0 0 0 0 0
Figure 26. Dump of the symbol table giving symbols and their values
; 2 0 0 0 i 1 oooo ;2 0 0 0 0 3 0 0 0 0 4 0 0 0 0 5 0 0 0 0
; 2 0 0 0 2 6 0 0 0 2 T 0 0 0 4 8 0 0 0 6 9 0 0 0 8 1 0 0 0 0 9
: 2 0 0 0 3 1 1 C O O A 1 .2 O O O B 1 3 O O O C i l 4 O O O E 1 5 0 0 1 0
3 2 0 0 0 4 1 6 0 0 1 2 IT 0 0 1 3 1 8 0 0 1 4 19 0 0 1 5 2 0 0 0 1 6
; 2 0 0 0 5 2 1 0 0 I I 7 2 ; Î 0 0 1 8 2 3 0 0 1 9 24 0 0 1 * 2 5 0 0 1 B
: 2 0 0 0 6 2 6 00 : i c 2 7 O O l C 2 8 O O l C 2 9 O O l C 3 0 0 0 1 C
: 2 0 0 0 7 3 1 0 0 i C 3 2 0 0 I C 3 3 O O l C 3 4 O O l C 3 5 O O l C
; 2 0 0 0 £ 3 6 0 0 ! L C 3 r O O l C 3 8 O O l C 3 9 F D O O 4 0 F D O 1
; 2 0 0 0 9 4 1 F D 0 3 4 2 F D 0 5 4 3 F O C 7 4 4 F D O S 4 5 F D O B
; 2 0 0 0 A 4 6 F O O D 4 7 F O O E 4 8 F D O F 49 F D I O 5 0 F D l 1
: 2 0 0 0 B 5 I F O i 3 5 ; 2 F D l 4 5 3 F D 1 5 5 4 F D 1 6 5 5 F D l 7
; 2 0 0 0 c 5 6 F D I 1 9 5 7 F D i 9 5 8 F D 1 9 5 9 F D 1 9 6 0 F D I B
: 2 0 0 0 0 6 1 F o i i e 6 2 F D 2 1 6 3 F 0 2 3 6 4 F D 2 6 6 5 F D 2 6
; 2 0 0 0 E 6 6 F D 2 6 6 7 F D 2 6 6 8 F D 2 6 6 9 F D 2 6 7 0 F D 2 8
; 2 0 0 0 F 7 1 F 0 2 B 7;2 F D 2 E 7 3 F D 3 1 7 4 F D 3 4 7 5 F 0 3 7
: 2 0 0 1 0 7 6 F D 3 A 7 7 F D 3 D 7 8 F D 4 0 7 9 F D 4 3 8 0 F D 4 6
:2oo1 1 8 1 F D 4 8 8 : 2 F D 4 9 8 3 F D 4 8 8 4 F D 4 B 8 5 F 0 4 B
3 2 0 0 1 2 8 6 F D 4 8 8 7 F D 4 B 8 8 F D 4 B 8 9 F C 4 B 9 0 F D 4 B
i 2 0 0 1 3 9 1 F O 4 D 9 . 2 F D 4 F 9 3 F D 5 0 9 4 F 0 5 2 9 5 F D 5 3
: 2 0 0 1 4 9 6 F 0 5 5 9 7 F D 5 6 9 8 F D 5 8 9 9 F D 5 S 1 0 0 F D 5 B
; 2 0 0 1 5 1 0 1 F D 5 D 1 0 :2 F D 6 0 1 0 3 F D 6 1 1 0 4 F C 6 1 1 0 5 F D 6 1
; 2 0 0 1 6 1 0 6 F D 6 1 1 0 7 F D 6 3 1 0 8 F D 6 5 1 0 9 F 0 6 5 1 1 0 F D 6 5
; 2 0 0 1 7 1 1 1 F 0 6 5 1 1 ;2 F D 6 5 1 1 3 F D 6 5 1 1 4 F D e s 1 1 5 F D 6 5
;2oo l e 1 1 6 F D 6 5 1 1 7 Foaa 1 1 8 F D 6 A I J l 9 F D 6 D 1 2 0 F D 6 F
; 2 0 0 1 9 1 2 1 F D 7 2 122 F D 7 4 1 2 3 F D 7 5 1 . 2 4 F D 7 7 1 2 5 F D 7 9
; 2 0 0 1 A 1 2 6 F O ' / a 1 2 7 F 0 7 D 1 2 8 F D 7 F 1 2 9 F D 8 2 1 3 0 F D 8 4
: 2 0 0 1 8 1 3 I FOe 6 1 3 . 2 Foee 1 3 3 F D 8 A 1 3 4 F D 8 D 1 3 5 F D 8 D
5 2 0 0 I C 1 3 6 Foao 1 3 7 F 0 8 D 1 3 8 F D 8 E 1 . 3 9 F D 8 E 1 4 0 F O S E
; 2 0 0 I D 1 4 1 F o a e 1 4 2 F O S E 1 4 3 F D 8 E 1 4 4 F 0 8 E 1 4 5 F D 9 1
; 2 0 0 I E 1 4 6 F D 9 3 1 4 7 F D 9 5 1 4 8 F D S 8 1 4 9 F 0 9 A 1 5 0 F 0 9 C
: 2 0 0 I F 1 5 1 F D 9 F 1 5 . 2 F O A l 1 5 3 F D A 3 1 5 4 F D A 5 1 5 5 F D A 6
; 2 0 0 2 0 1 5 6 F D A 8 1 5 r F O A A 1 5 8 F D A B 1 5 9 F D A C 1 6 0 F O A O
120021 1 6 1 F D A D 1 6 2 F D A D 1 6 3 F D A D 1 6 4 F D A D 1 6 5 F D A D
Value of the program counter at the beginning of each card
; 20022
; 2 0 0 2 3 ; 2002A ; 2 0 0 2 5
; 200 26 ; 2 0 0 2 7 '
; 200 2a
; 2 0 0 2 5 ; 2 0 0 2 A
;200 2E ;200 2C. : 200 20 ; 2 0 0 2 E ; 2 0 0 2 F
; 2 0 0 3 0 Î 20 0 3 1 ; 2 0 0 3 2 : 2 0 0 3 3
: 2 0 0 3 4 : Z O O 3 5
; 2 0 0 3 6 ; 2 0 0 3 7 ' :2003a ; 2 0 0 3 9 ; 2 0 0 3 A ; 2 0 0 3 8 ; 2 0 0 3 C ; 2 0 0 3 D
;20 0 3Ê: ; 2 0 0 3 F
: 2 0 0 4 0
; 2 0 0 4 ]
166 FOBO 171 FOBS 176 FOC5 181 FDCF 186 FODA 191 FOOD 1S6 FDE7 20 1 FDFl 206 FDFQ 2 11 FE05 216 FEOF 221 FE19 226 FE2 1 231 FE29
236 FE35 241 FE3E 246 FE48 251 FE51 256 FE5B 261 FE6 7 266 FE71 271 FE7C 276 FE 89 281 FE8C 286 FE94 29 1 FE9E 296 FEAT 301 FEBl 306 FEB3 31 1 FEBB 316 FEC4 32 1 FECE
167 FDB2 172 FOBE 177 FDC7 .182 F DDI 1 £7 FODA .192 FOOF
9 7 F DE 9 2 0 2 FOF3 20 7 FOFO 212 FE07 217 FE12 2.22 FEIC .= 27 FE21 232 FE2C
237 FE37 242 FE40 24 7 FE4B 252 FE53 257 FE5D 26 2 FE6A 267 FE74 27 2 FE7F .2 7 7 FE8C 282 FE8C 287 FE96 292 FEAO 297 FEAS .302 FEB3 .30 7 FEB4 312 FEBD 317 FEC6
.322 FED!
Figure 27. (Conti nued)
1 68 FDB4 169 FDB7 1 73 FOCO 174 F0C2 1 78 FDC9 179 FDCB 1 83 FD03 184 FDD5 1 88 FODA 189 FODA 193 FDEl 194 F DE3 198 FDEB 199 FDED 203 FDF5 20 4 F OF 7 208 FOFF 20 9 FEOl 213 FE09 214 FEOB 218 FE 12 219 FE 14 223 FEIC 224 FEIE 228 FE22 229 FE24 233 FE2E 234 FE30
238 FE38 239 FE3A 243 FE42 244 FE45 248 FE4B 249 FE4D 253 FE55 25 4 FE57 2 58 FE5F 259 FE62 263 FE6C 264 FE6D 268 FE76 269 FE79 2 73 FE81 274 FE8 4 278 FE 8C 279 FE8C 283 FE8E 284 FE90 2 83 FE98 289 FE9A 293 FEAl 29 4 FEA3 298 FEAA 299 FEAC 3 03 FE63 304 FEB3 308 FE86 309 FEBE 313 FEBF 314 FECI 318 FEC8 319 FECA 323 FE03 324 FED6
FDB9 FDC4 FDCD FDD7 FDOA FOE 5 FDEF FDF9 FE03 FEOD FEl 7 FEIF FE27 FE33
FE3C FE46 FE4F FE59 FE6 4 FE6F FE7A FE86 FE8C FE92 FE9C FEAS F£AF FEB3 FEBA F EC 2 FECC FED 7
170 175 180 185 190 195 200 205 210
215 220 225 230 235
240 245 250 255 260
265 270 275 280 285 290 295 300 30 5 31 0 315 320 325
; 30 OO1 10 0000 OCCOOOOOOOOOOOOO163200000002000Ô 0050 S30002 OC 0010 00 100ACCCOOOOOCOOC0204C6000COOOO 0028 ; 30 003 10 FDOO 78A900850eA903850AA202a600E€EaE8 06C8
:30004 10 FDIO E8e60FE8E8E8E88611A9FF8D10408D12 08D8 {300 0 5 10 F020 40A90 I A D 2 2 4 0 A 9 0«aD0540 SOO7408009 04C2 ; 30006 10 FD30 40SDOB4080I 1408D13408021408D2340 04B4 Î30007 10 FD40 80414O8D4340A2OC9AA000A90285190A 054D : 30 0 0 8 10 F050 85 1AOA85lBOA85080A8509A907aD0940 05FE i S O O O S 10 FD60 58E40BF0FCAO084O910CAD0A40910EAO 0708 53000A 10 FD70 20'<<)9 1 1 0C8C4 ObDOE 8C 40AD0 0 5E60B4C 0730 ;3000B 10 FD80 80FOC60AE600E60FE6114C61FD78AD40 0848 S3000C 10 FOSO 40290F8514AD4240290F8515208CFEA5 0561 530000 10 FDAO 18 & f50 OA 5 16 18 69 02850 lEAE AE A AD04 40 0610 Î3000E 10 FDBO 290F8514AD0640290F8515208CFEA518 04FD SSOOOF 10 FOCO 85C<5A516ia6902£507A500a502a504A5 04AF ;30010 10 FDDO CI€503a505A900aD224OAD224O29FEA0 0581 ;30011 10 FDEO OOCSl9F07aC51AF06AC51EFO5EC508F0 OStA 2300 12 10 FDFO 14C509FCC8E601E601E601E60 IE605E6 0747 530013 10 FEOO 05 E:60 5 £6 05 E60 5 £6 0 5E60 5E60 5A 934 8D 06F 1 2300 14 10 FEIO 11408 I 0CSO 1040BI048D1240 A224CAOO 0503 530015 1 0 F E 2 0 F BC aFOOB2033FE9 0 E 4 4 C8EFDE60 IE 605 CS29 3 30016 10 FE30 4C2AFEE602FOOF38A502E506A503E507 06B3 3300 17 10 FE40 A 9^J<: 80 1 1 40 60E 6034C3 7FEE6 01 £601 E6 0741 5300 18 10 FE50 O 1 EibO 1 E60 1 E60 1 E60 1E60 1 AO OOA 93480 068E 530019 10 FE60 11^031008D12408C1040A224CAD0FBA9 06C1 ;300 lA 10 FE70 3C 80 1 14 0A934 fiO i 1 4 OC 8F008 20 33FE 90 0676 53001B 10 FE80 DC4C8EFDE601EE22404C7CFEA20SA900 0800 Î300 1C 10 FE90 8516851 7e5l8A96'va513A90A8512A514 057C 530010 10 FEAO CA f^OO C 46 1590 03 186 51 206124C AOFEA 2 0SE7 53001E 10 FEBO O 5 €15 1 8C AFO 2046 1 5 90 1 0 1 8 A5 1 865 13 BO 0574 ;3001F 10 FECO 1018851EA51665178516061326174CB3 03EC 3 3 0 0 2 0 0 7 FECO FE 164CC1FE60COOOO0 0 0COCOOCO0 0 0 0465 Î 40000L
Figure 28. Interface file for programming the ROM
S Y M B O L . T A H L E
SYMBOL VALUE LINE DEFINED C R O S S - R E F E R E N C E S
A O I S R F 0 6 5 1 1 6 ****
B C O M F E S C 2 8 2 1 5 0 1 7 1 B C D M l 0 0 1 6 2 0 1 5 3 1 7 4 2 8 4 3 1 6 B C D M 2 C ) C 1 7 2 1 2 8 5 3 1 7 3 2 0 B C O M 3 0 C 1 8 2 2 1 5 1 1 7 2 2 8 6 3 0 1 B C D l C 0 1 4 1 8 1 4 6 1 6 7 2 5 1 B C D 2 0 0 1 5 1 9 1 4 9 1 7 0 2 9 4 3 0 8 O I S P L F E O O 2 1 5 2 3 0 D T C H K F E 3 3 2 3 5 2 2 9 2 7 1 O T C S R F E 2 4 2 2 S 2 3 4 O l F E A O 2 9 2 2 9 9 0 2 F E A A 2 9 8 2 9 5 D 3 F E A F 3 0 0 2 9 3 D 4 F E B 3 3 0 6 J 2 1 0 5 F E D l 3 2 2 3 1 3 0 6 FECI 31 4 3 2 3 D 7 F E D 6 3 2 4 3 0 7 0 8 F E C A 3 1 9 3 0 9 F L A G O O O B 1 2 4 1 1 0 6 1 2 3 1 2 7 F R P O S F E 0 5 2 1 1 2 0 0 FRPCN 0 0 0 8 9 9 7 1 9 9 H P T R 0 0 0 6 8 1 7 3 1 7 7 2 3 9 241 I S i R O U T F c a o 1 3 7 1 2 8 L E A O l F E 8 4 2 7 4 2 7 0 L 0 ( D P 1 F C 8 E 1 4 4 2 3 1 2 7 3
318 32r;
311 315
cri CO
Figure 29. Cross reference listing showing sorted symbol table, value, line defined and line number where symbol was referenced
L O O P 2 F E 2 C 2 3 2 2 2 â L O O P 3 F E 4 6 2 4 5 2 3 6 L 0 C F 4 F E 3 7 2 3 7 2 4 6 L O O P S F E I C 2 2 3 2 2 5 S_ O O P 6 F E 7 C 2 7 1 2 7 6 L O O P 7 F E 6 A 2 6 2 2 6 4 LPTR O C O O 5 1 5 2 1 5 6
2 4 8 2 4 9 L V A L U 0 0 1 2 1 6 2 9 0 2 9 7 L V A L U 1 0 0 1 3 1 7 2 8 8 3 1 2 MI F OS. 1 1 0 6 1 0 7 1 2 4 P L P T R 0 0 0 2 6 1 7 9 1 8 2 S E C P A G F 0 3 2 129 126 S F L A G 0 0 0 A 1 1 4 3 1 2 5 S T A R T F D D O 39 * ***
TLPTR 0 0 0 4 7 1 8 0 1 8 5 2 2 0 2 3 3
TRPDS FDFD 2 0 7 2 0 2 T R F L N 0 009 1 0 99 2 0 1 X L D I S P FEfiO 25 7 194 2 7 2 X L E A D 0 0 t9 23 91 193 X P T R O O O C a 3 45 117 VLOISP FE53 2 5 2 196 Y L E A D 0 0 ] A 2 4 93 1 9 5 Y P T R OOOE 14 5 0 119 Z L O I S P F E A B 2 4 8 198
Z L E A D O O I B 2 5 9 5 1 9 7 Z P T R 0 0 1 0 1 5 5 5 1 2 1
Figure 29. (Continued)
2 3 2 2 7 4
2 1 4 e n
1 3 0
1 3 1
1 3 2
i r a 1 6 1 2 0 3 2 0 4 2 0 5 2 0 6 2 1 8 2 5 0 2 5 1 2 5 2 2 5 3 2 5 4 2 5 5 2 5 9 2 9 8 3 1 9 1 3 3 2 3 5 2 3 8 2 4 0 2 4 5
1 2 9
2 0 7 2 0 8 2 0 9 2 1 0 2 1 1 2 1 2 2 1 3
70
UNIBUS TTY
MEMORY
PDP-1
Min-Mic-1165
Figure 30. Hardware configuration for simulating the software

71
25. A BCD number for each address was given through the teletype. After
the BRK instruction in location 315, the processor status along with the
memory locations for converted numbers was checked and compared to hand
calculated results.
After debugging the conversion subroutine, addresses for plane and
loop selection were accessed from the teletype. The display routine was
checked by using BRK instructions in lines 208 and 225 of Figures 23 and
24. After individually checking these subroutines, the BRK instructions
were removed and the whole program was checked by giving the starting and
stopping address of the loop and the plane in which this loop was to be
displayed. This information was given to the microprocessor through the
teletype. The microprocessor executed the program correctly by printing
the desired x and y coordinates (in hexadecimal) of the loops on the
teletype. Different planes and loops were selected and were successfully
printed on the teletype.
72
CONCLUSION
This microprocessor-controlled vectorcardiographic system was de
signed for the cardiologist's office use and for teaching of vector
cardiography as a diagnostic tool in hospitals and medical schools. Sys
tem hardware design with debugged and checked software is presented.
The hard-wired development of the system was not pursued because of a
number of reasons. One reason was the lack of microprocessor-compatible
and economical interfacing for analog-to-digital conversion. It just does
not make sense to spend ten times the price of a microprocessor on A/D
conversion. Major A/D converter manufacturers are considering the design
and production of A/D converters which would be compatible with micro
processor data and address buses. The second reason was the lack of funds
to purchase the parts and the delay involved in receiving them. A final
reason was the lack of facilities that aid in the development of a micro
processor-controlled system.
System (hardware) development will not be critical if microprocessor-
compatible parts are used. The hardest part of a microprocessor-based
system is the software development. As in Electronics (1976): "It is
true that the microprocessor reduces hardware development time, but the
tough task for the designer is now programming and debugging. Even for
the more experienced, software development is tricky. Learning to pick
the right language and how to work with it effectively is essential."
The following hardware additions, if implemented, would enhance the
effectiveness of the VCG system.
73a
1. A dual display of the VCG and the ECG where VCG is only displayed
for the portion of the ECG wave that is intensified.
2. A cassette recording interface so that different and abnormal
VCG's can be recorded and played back for didactic purposes.
3. An interface for telephone line transmission of stored vector
cardiograms. This would eliminate the use of acoustic MODEM
(modulator and demodulator) that is presently used to transmit
and receive ECG data.
4. An x-y recorder interface to get a hard copy (instead of the
presently used photographic print) of the displayed VCG loops.
Since the data has already been digitized one can program the micro
processor to perform calculations upon the data to determine the amplitude
and angle of elevation of the maximal vectors; to display the heart rate;
to determine spatial velocities and magnitudes; and to provide digital
filtering to increase the signal-to-noise ratio. Any such modifications
in the system only involve changing the software instructions in the ROM
# * r -i v*/«i i t + r mn H t+ ' i a + • i c I u U l I V . I o i i u i i V I I L . V I m v : v . i i i u v ^ ^ I V A v i i i i v ̂
involving very little hardware changes, would greatly increase the flexi
bility of the complete system.
Two things that are not feasible in this system are pattern recogni
tion and statistical analysis. These procedures would increase the com
plexity of the system and would defeat the purpose of providing a simple
diagnostic system.
Since the system can display the VCG loops of the same cardiac cycle
in three planes, it should increase the accuracy of diagnosing cardiac

73b
abnormalities. It also has the capability of displaying each lead with
respect to time. This will allow the physician to correlate the loop and
the lead data.
This system, when completed, would be a very powerful noninvasive
ECG and VCG monitoring device for both diagnostic and didactic purposes.
It should improve health care delivery and reduce the cost of cardio
vascular procedures.

74
REFERENCES
Abildskov, J. A. and E. D. Pence. 1956. Comparative study of spatial vectorcardiograms with the equilateral tetrahedron and a corrected system of electrode placement. Circulation 13:263-269.
Arvedson, 0. 1971. A hardware-software system for the automatic evaluation of electro- and vectorcardiograms. IFIP TC-4 Working Conference on Computer Applications on ECG and VCG Analysis, Hannover, pp. 101-1 1 1 .
Brimberg, L. 1969. A three dimensional display of vectorcardiograms. Cardiv. Res. 3:329.
Burch, G. E. 1952. Vectorcardiography. Arch. Int. Med. 90:137-140.
Burger, H. C. and J. B. van Milaan. 1946. Heart vector and leads. I. Brit. Heart J. 8:157-161.
Burger, H. C. and J. B. van Milaan. 1947. Heart vector and leads. II. Brit. Heart J. 9:154-160.
Burger, H. C. and J. B. van Milaan. 1948. Heart vector and leads. III. Brit. Heart J. 10:229-233.
De Michelli, A. A., G. A. Medrano and D. Sodi-Pallares. 1968. Vectorcardiography in the differential diagnosis of tetralogy and triology of Fallot. Am. J. Cardiol. 21:785.
den Boer, W. 1952. The clinical value of vectorcardiography. Acta Med.
Draper, H. W., C. J. Peffer, F. W. Stallmann, D. Littmann and H. V. Pipberger. 1964. The corrected orthogonal electrocardiogram and vectorcardiogram in 510 normal men. Frank lead system. Circulation 30:853-863.
Einthoven, W., G. Fahr and A. de Waart. 1950. On the direction and the manifest size of the variations of potential in the human heart and on the influence of the position of the heart on the form of the electrocardiogram. Translated by H. E. Hoff and S. P. Sekelj. Am. Heart J. 40:163-211.
Electronics. 1976. Making it with microprocessors. Electronics 49(8): 74-134.
Frank, E. 1954a. The image surface of a homogeneous torso. Am. Heart J. 47:757-768.

75
Frank, E. 1954b. General theory of heart vector projection. Circulation Research 2:258.
Frank, E. 1955. Determination of electrical center of the ventricular depolarization in human heart. Am. Heart J. 49:570-692.
Frank, E. 1956. An accurate clinically practical system for spatial vectorcardiography. Circulation 13:737-749.
Frank, E. and C. F. Kay. 1954. Frontal plane studies of homogeneous torso model. Circulation 9:724-740.
Geddes, L. A. and L. E. Baker. 1968. Principles of applied biomedical instrumentation. John Wiley & Sons, Inc., New York.
Grishman, A. and L. Scherlis. 1952. Spatial vectorcardiography. W. B. Saunders Co., Philadelphia.
Helm, R. A. 1957. An accurate lead system for spatial vectorcardiography. Am. Heart J. 53:415-424.
Hoover, A. W. and H. R. Skutt. 1975. A compact multicolor vectorcardiography display. Proceedings on the 28th Annual Conference on Engineering and Medicine and Biology, New Orleans, Louisiana, Sept. 20-24.
Horcek, B. M. 1971. Torso inhomogeneities. Proceedings of 2nd IFIP TC-4 Working Conference on Computer Applications on ECT and VCG Analysis, Hannover, Oct. 11-14.
Isaac, J. H. 1964. A study of electrical fields - the differential verr.orscope. Am. ,1. Mpci. Flprt- 3:36-40:
Lamberg, L., A. Castellanos and A. G. Arcebal. 1971. The vectorcardiogram in acute left anterior hemiblock. Am. J. Cardiol. 28:483.
Langer, P. H., R. Okada, S. R. Moore and H. C. Fies. 1958. Comparison of four orthogonal systems of vectorcardiography. Circulation 17: 46-54.
Mann, H. 1920. A method of analyzing the clGctrocardioarom, Arch. Int. Med. 25:283-294.
Mann, H. 1931. Interpretation of bundle branch block by means of the monocardiogram. Am. Heart J. 6:447-457.
Mann, H. 1938. The monocardiograph. Am. Heart J. 15:681-689.
McFee, R. and F. D. Johnston. 1953. Electrocardiographic leads. I. Introduction. Circulation 8:554-568.
76
McFee, R. and F. D. Johnston. 1954a. Electrocardiographic leads. II. Analysis. Circulation 9:255-266.
McFee, R. and F. D. Johnston. 1954b. Electrocardiographic leads. III. Synthesis. Circulation 9:868-880.
McFee, R. and A. Parungao. 1961. On orthogonal lead system for clinical electrocardiography. Am. Heart J. 63:93-100.
Miller, B. L., G. A. Medrano and D. Sodi-Pallares. 1968. Vectorcardiography in the differential diagnosis of tetralogy and triology of Fallot. Am. J. Cardiol. 21:785.
MOS Technology, Inc. 1975a. Assembler manual. MOS Technology, Inc., Norristown, Pa.
MOS Technology, Inc. 1975b. Microcomputers. Hardware manual. MOS Technology Inc., Norristown, Pa.
MOS Technology Inc. 1975c. Microcomputers. Software manual. MOS Technology Inc., Norristown, Pa.
Oram, S. 1971. Clinical heart disease. F. A. D=vii, Company, Philadelphia.
Pipberger, H. V. 1959. Current status and persistent problems of electrode placement and lead system for vectorcardiography and electrocardiography. Prog. Cardiovas. Dis. 2:248-262.
Pipberger, H. V., et al. 1975. Recommendations of leads and specifications for instruments in electrocardiography and vectorcardiography. Report of Committee on Vectorcaruioqraphy. American Heart Association. Circulation 52:11-20.
Schaffer, A. I. 1956. The body as a volume conductor in electrocardiography. Am. Heart J. 51:588-608.
Scherlis, L. and Y. C. Lee. 1963. Transient right bundle branch block. An electrocardiographic and vectorcardiographic study. Am. J. Cardiol. 11:173-186.
Schmitt, 0. H. 1947. Cathode ray presentation of three dimensional data. J. Appl. Physics 18:819.
Schmitt, 0. H. 1957. Lead vectors and transfer impedance. Ann. N. Y. Acad. Sci. 65:1092.
Schmitt, 0. H. and E. Simonson. 1955. The present status of vectorcardiography. A.M.A. Arch. Int. Med. 96:574-590.

77
Simonson, E., N. Tuna, N. Okamota and H. Toshima. 1966. Diagnostic accuracy of the vectorcardiogram and electrocardiogram. A comparative study. Am. J. Cardiol. 17:829-878.
Starr, J. W., G. S. Wagner, J. B. Reed, A. Walston and V. S. Behar. 1975. Vectorcardiographic criteria for the diagnosis of anterior myocardial infarction. Circulation 53:229.
van Bemmel, J. H., J. S. Duisterhout, G. van Herpen and L. G. Bierwolf. 1971. Pushbutton VCG/ECG processing system, if IP TC-4 Working Conference on Computer Applications on FCG and VCG Analysis, Hannover, pp. 112-130.
Varriale, P. and R. J. Kenneay. 1972. Right bundle branch block and left posterior fascicular block. Am. J. Cardiol. 29:459.
Waller, A. D. 1889. On the electromotive changes connected with the beat of mammalian heart and of the human heart in particular. Trans. Roy. Soc. London 1808:169-194.
Wartak, J. 1970. Simplified vectorcardiography. J. B. Lippincott Company, Philadelphia.
Wilson, F. N. and F. D. Johnston. 1938. The vectorcardiogram. Am. Heart J. 16:14-28.
Wilson, F. N., F. D. Johnston and C, E. Kossman. 1947. The substitution of a tetrahedran for the Einthoven triangle. Am. Heart J. 33: 594-603.
Wolff, L., R. Wolff, M. D. Samartzis, A. Mazzolini, A. M. Soffe, L. Reinor and S. Matsuka. 1961. Vectorcardiographic diagnosis. A correlation nitu autopsy fiuuinyS 1 il 1967 câSèS. CifculdLiufi 23:861-880.

78
ACKNOWLEDGMENTS
The author wishes to express his appreciation to the staff of the
Biomedical Engineering Program for their support during all his graduate
studies.
I especially wish to thank Dr. Curran Swift, who was my major pro
fessor, for his guidance and professional and exacting thoroughness in
reviewing this dissertation; Drs. R. C. Seagrave, N. R. Choi vin, W. H.
Brockman, R. E. Morton and C. H. Lindahl for serving on my committee;
Drs. Steve Phillips and David Gordon from Des Moines in helping me under
stand vectorcardiography and its clinical importance.
Special thanks are due to my wife for her continuing support, espe
cially during the final stages of this research.
Last, but not least, I would like to thank my parents, brother and
sister-in-law, my sisters and my brother-in-law for their encouragement
and support without which it would not have all been possible.