Embed Size (px)
Citation preview
1516
ABSTRACT
The Late Cretaceous Dehshir ophio lite is an important element within the Inner Zagros (Nain-Baft) ophiolite belt and contains all components of a complete “Penrose ophiolite,” including tectonized harz burgites, gabbros, sheeted dike com-plexes, pillowed basalts, and rare ultra-mafi c-mafi c cumulates. The cumulate rocks of this ophio lite are composed of plagioclase lherzo lite, clinopyroxenite, leucogabbro, and pegmatite gabbro. All the massifs in the Inner Zagros ophiolite belt are overlain by Turonian-Maastrichtian pelagic limestones (93.5–65.5 Ma). Clinopyroxene compositions of Dehshir mafi c rocks are similar to those of both boninites and island-arc tholeiites. Nearly all spinels from the inner ophiolite belt are similar to those of highly depleted harzburgites from intra-oceanic forearcs, although some Dehshir harzburgite spinels plot within the fi eld for abyssal (mid-ocean-ridge basalt) peridotites. All components of the Dehshir and other ophiolites of this belt show strong suprasubduction-zone affi ni ties, from harzburgitic mantle to ophiolitic lavas. Volcanic rocks have a mixture of dominantly arc-like (island-arc tholeiite, boninite, and calc-alkaline) and subordinate mid-ocean-ridge basalt–like compositional features, usually with mid-ocean-ridge basalt–like rocks at the base and arc-like rocks at the top. Our data for the Dehshir ophiolite and the similarity of these results to those for Iranian inner and outer belt ophiolites compel the conclusion that a geographically long, broad, and continuous tract of forearc lithosphere was created at about the same time during the earliest stages of subduc-tion along the southern margin of Eurasia in Late Cretaceous time.
INTRODUCTION
Late Cretaceous ophiolites in the Mediter-ranean eastward through Turkey, Syria, Iran, Oman, Afghanistan, and into Pakistan are fos-sil slices of Neotethyan oceanic lithosphere (Robert son, 2002). In the last few decades, many studies have focused on geochemistry and genesis of crustal as well as mantle sequences from Late Cretaceous ophiolites, especially in Oman, Cyprus, and Turkey (e.g., Dilek et al., 2007; Garfunkel, 2006; Godard et al., 2003, 2006; Robertson, 2002; Floyd et al., 1998; Ala-baster et al., 1982; among others). Despite broad affi nities to other ophiolites in the Tethyan Mediterranean-Oman ophiolite belt, the Late Cretaceous ophiolites of south-central Iran re-main poorly known in terms of geochemistry, petrogenesis, and tectono-magmatic evolution.
The Iranian ophiolite belt, of central interest to this study, lies along the NE fl ank of the Zagros fold-and-thrust belt, which fl anks the Persian Gulf on the southern margin of Eurasia. The Ara-bian plate has been moving north since Late Cre-taceous time as Neotethys was consumed, fi rst as part of Africa, and more recently as a separate plate. The Zagros orogenic belt—in the position of an accretionary prism—manifests this ongo-ing plate convergence, which is in transition now from subduction to continental collision.
Abundant ophiolites in the Zagros orogenic belt define the suture between Arabia and Eurasia, and comprise two parallel belts. Fol-lowing Stocklin (1977), we use “Outer Zagros ophiolite belt” and “Inner Zagros ophiolite belt” to describe the belts containing the Neyriz and Nain-Baft (Dehshir) ophiolites, re-spectively (Fig. 1).
The Neyriz ophiolite lies immediately south-southwest of the Main Zagros Thrust (MZT) and is the best-studied ophiolite of the Outer Zagros ophiolite belt. There is a broad consensus that this ophiolite formed in a suprasubduction-zone environment (e.g., Arvin, 1982; Babaie et al.,
2001, 2005, 2006; Ghazi and Hassanipak, 2000; Ghazi et al., 2003). The formation and tectono-magmatic evolution of Inner Zagros ophiolite belt, including the Nain-Baft ophio-lites and the Dehshir ophiolite of interest here, are controversial and have been variously in-terpreted as: (1) representing a narrow, Red Sea–like ocean, created at a slow spreading center (e.g., Davoudzadeh , 1972; Berberian and King, 1981; McCall and Kidd, 1981; Desmons and Beccaluva , 1983; Şengor, 1990; Arvin and Robin son, 1994; Arvin and Shokri, 1997; Babaie et al., 2001); (2) an arc basin related to Tethyan subduction (e.g., Delaloye and Desmons, 1980; Ghazi and Hassanipak, 2000); and (3) a back-arc basin (Shahabpour, 2005; Agard et al., 2006).
Limited geochronology indicates that inner and outer belt ophiolites formed at the same time during the Late Cretaceous and may have originally been a continuous sheet. Horn-blende gabbros from the inner belt yield a K/Ar age of 93 Ma (Shafaii Moghadam et al., 2007), whereas outer belt Neyriz diabases and hornblende gabbros yield 40Ar/39Ar ages of 86 and 93 Ma, respectively (Lanphere and Pamic, 1983), and Neyriz hornblende gab-bros yield 40Ar/39Ar ages of 92.1 ± 1.7 Ma and 93.2 ± 2.5 Ma (Babaie et al., 2006). These are broadly similar to ages of other ophiolites of the Mediterranean-Oman belt, which get younger toward the west, from ca. 95 Ma for Oman (Hacker et al., 1996) to 90–94 Ma for Cyprus (Mukasa and Ludden, 1987). This similarity in ophiolite ages and suprasubduction-zone chem-istry led Mukasa and Ludden (1987) to iden-tify the Mediterranean-Oman ophiolite belt as “…a[n] ~3000 km long axis of rift-related is-land arcs” (p. 825). The similarity of ages for inner and outer belt ophiolites and their parallel alignment between the Urumieh-Dokhtar arc and the Zagros fold-and-thrust belt suggest that they may be exposed limbs of a deformed and eroded anticlinoria, and may represent forearc basement between the Urumieh-Dokhtar arc
For permission to copy, contact [email protected]© 2010 Geological Society of America
GSA Bulletin; September/October 2010; v. 122; no. 9/10; p. 1516–1547; doi: 10.1130/B30066.1; 16 fi gures; 7 tables.
†E-mail: [email protected]
The Dehshir ophiolite (central Iran): Geochemical constraints on the origin and evolution of the Inner Zagros ophiolite belt
H. Shafaii Moghadam1,†, Robert J. Stern2, and M. Rahgoshay3
1School of Earth Sciences, Damghan University of Basic Sciences, Damghan, Iran2Geosciences Department, University of Texas at Dallas, Richardson, Texas 75083-0688, USA3Faculty of Earth Sciences, Shahid Beheshti University, Tehran, Iran
The Dehshir ophiolite
Geological Society of America Bulletin, September/October 2010 1517
tleBts
urhT-
dloF
sorgaZ
++ +
++
++
+
++
++
++
++
+ +
+
+
++
++
+
++
+ +++
+
50°E 54° 58°
26°
30°
34°N
Caspian Sea
fluG
nais
reP
Gulf of Oman
25 mm/yr
200 km
Tehran
Khoy
Kermanshah
Neyriz
Nain
Shahr-e-Babak
Balvard
Baft
Birjand
SabzevarMashhad
Iranshahr
Band-Zeyarat
A
B
A
Mesozoic ophiolites
+ + Urumieh-Dokhtar arc
Zagros fold-thrust
Main Zagros thrust
belt
nageyaploG
Dehshir
Esfandagheh
Fanuj-Maskutan
enoZnajriS-j
adnanaS
<
< <
<
<
<
< <
<
<
<
<
<
<
<
<
< <
<
<<
<
<
<
<
<
Iranian continental crust
NESW
Persian Gulf
Zagros simplyfolded belt
Outer Zagrosophiolitic belt
Inner Zagrosophiolitic belt (Dehshir)
Urumieh-Dokhtar arcMZT
Sanandaj-Sirjan zone
Imbricated zone
Continental crust
Sedimentary cover
Metamorphic rocks
Magmatic rocks Folding
< <
<
<<<
<<
<
Arabian continental crust
Once-continuous forearc ophiolitic nappeB
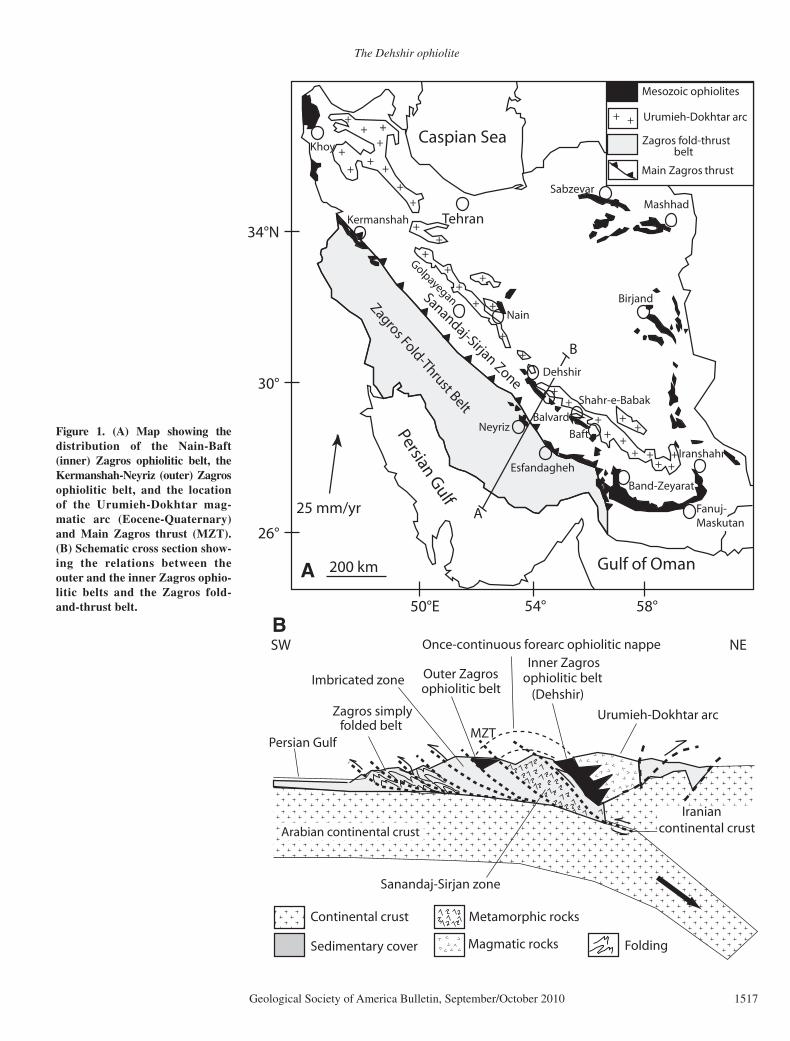
Figure 1. (A) Map showing the distribution of the Nain-Baft (inner ) Zagros ophiolitic belt, the Kermanshah-Neyriz (outer) Zagros ophiolitic belt, and the location of the Urumieh-Dokhtar mag-matic arc (Eocene-Quaternary) and Main Zagros thrust (MZT). (B) Schematic cross section show-ing the relations between the outer and the inner Zagros ophio-litic belts and the Zagros fold-and-thrust belt.

Shafaii Moghadam et al.
1518 Geological Society of America Bulletin, September/October 2010
and the Zagros accretionary prism, developed over a N-dipping subduction zone on the south-ern Eurasian margin. The forearc interpretation is further supported by the ~150 km width of the region encompassed by inner and outer ophio-lites, which is about that of typical forearcs (Stern, 2002). This may be termed the “Iranian forearc hypothesis.”
In this paper, we present fi eld, petrologic, and geochemical data for different lithological units of the Dehshir ophiolite, part of the Inner Zagros ophiolite belt, which is exposed south-southwest of the Urumieh-Dokhtar magmatic arc (Fig. 1). To our knowledge, this is the fi rst modern petro-logic and geochemical study of the Dehshir ophiolite. We use this information and our inter-pretations to test the Iranian forearc hypothesis , i.e., those Zagros ophiolites defi ne the disrupted remnants of a huge (3000-km-long) tract of forearc basement that formed during an episode of subduction initiation along the southern mar-gin of Eurasia in Late Cretaceous time.
GEOLOGICAL OUTLINE
The Zagros orogenic belt consists of fi ve trench-parallel tectonic subdivisions, from un-deformed trench fi ll (SW) to magmatic arc (NE; Alavi, 1994): (1) Mesopotamian foredeep–Persian Gulf; (2) Zagros fold-and-thrust belt; (3) outer ophiolite belt; (4) Sanandaj-Sirjan zone; (5) inner ophiolite belt; and (6) Urumieh-Dokhtar magmatic arc (Fig. 1B). The Zagros orogenic belt plus foredeep defi nes a classic convergent plate margin (Farhoudi and Karig, 1977; Farhoudi, 1978). The foredeep represents a fi lled trench, the Zagros fold-and-thrust belt represents an accretionary prism, the ophiolite belts represent disrupted forearc crust, and the Urumieh-Dokhtar magmatic arc is, of course, the magmatic arc. The last four of these sub-divisions and the Sanandaj-Sirjan zone are de-scribed further next.
Zagros Fold-and-Thrust Belt
The Zagros fold-and-thrust belt (Fig. 1B) refl ects the shortening and offscraping of thick sediments from the northeastern margin of the Arabian platform, essentially behaving as the ac-cretionary prism for the Iranian convergent mar-gin (Farhoudi and Karig, 1977; Farhoudi, 1978). The Zagros Fold-and-Thrust Belt is bounded on the northeast by the Main Zagros thrust (Ber-berian and King, 1981; Berberian, 1995).
Outer Zagros Ophiolitic Belt
Geologic relations observed at the Neyriz ophiolite refl ect those of typical outer belt ophio lites. Three imbricated sheets are recog-
nized in the Neyriz ophiolite, from SW to NE, (Ricou, 1971, 1974, 1976; Ricou et al., 1977). (1) The base of the complex includes abyssal sediments of the Neotethys Ocean as slices of Late Triassic limestone, Middle Jurassic oolitic limestone, and Lower-Middle Cretaceous con-glomeratic limestone, known as the Pichakun Series (Ricou, 1971). (2) Two mélange units consist of exotic blocks of Permian-Triassic limestones asso ciated with radiolarites, alkaline and tholeiitic pillow lavas, serpentinites, alkali gabbros, sandstones, tuffi tes, and metamorphic rocks. This sequence (whole package) is similar to the Hawasina Group of Oman (Bechennec et al., 1990). (3) Tectonic slices of oceanic mantle and crust (the ophiolite component) thrust SW over the Pichakun and mélange series.
Sanandaj-Sirjan Zone
The Sanandaj-Sirjan zone separates the Inner Zagros ophiolite belt from Outer Zagros ophio-lite belt. Rocks of the Sanandaj-Sirjan zone make up the metamorphic core of Zagros belt (Mohajjel et al., 2003). Rocks of the Sanandaj-Sirjan zone span most of Phanerozoic time, including imbricated slices of marine and con-tinental siliciclastic sediments metamorphosed under low- and medium-grade greenschist conditions (Alavi, 1994). Lavas and intrusive bodies accompany these sediments. Because it separates inner and outer belt ophiolites, the na-ture of this zone is a critical test of the Iranian forearc hypothesis. This zone is generally con-sidered to be either an accreted microcontinent that separated from Gondwanaland during the Early Jurassic (e.g., Stocklin, 1968; Golonka, 2004; among others) or a once-active margin of the Central Iranian block (e.g., Berberian and King, 1981; Sheikholeslami et al., 2008; Fazlnia et al., 2009). We think that the nature of Sanandaj-Sirjan zone sediments, their meta-morphism, and their tectonic setting suggest that they are exhumed offscraped sediments of the Arabian plate, which now defi nes an anticlino-rium structurally beneath the forearc ophiolites (Fig. 1B). The presence of such an anticlinorium was fi rst proposed by Alavi (2004, his fi g. 5).
Inner Zagros Ophiolite Belt
The Inner Zagros ophiolite belt (also known as the Nain-Baft ophiolite belt) occurs in several massifs named after nearby towns. These ophio-lites can be traced along strike for ~500–600 km and are, from northwest to southeast, the Nain, Dehshir, Shahr-e-Babak, and Balvard-Baft ophiolites (Fig. 1A). These massifs contain the components of complete “Penrose ophiolites,” including tectonized harzburgites, gabbros,
and pillowed basalts. Sheeted dike complexes and ultramafi c-mafi c cumulates are rare. All the massifs in the Inner Zagros ophiolite belt are overlain by Turonian-Maastrichtian pelagic limestones (93.5–65.5 Ma), consistent with the limited geochronologic evidence that these ophiolites formed by seafl oor spreading ca. 90–95 Ma. Several lines of evidence, such as high Cr content (Cr# > 60) of spinel in harz-burgite, fl at rare earth element (REE) patterns of the lavas, Nb-Ta negative anomalies and large ion lithophile element (LILE) positive anomalies, and the presence of low-Ti clino-pyroxenes in the lavas , indicate that the Inner Zagros ophiolite belt formed above a subduction zone (Delaloye and Desmons, 1980; Ghazi and Hassanipak, 2000; Shafaii Moghadam et al., 2007; Shafaii Moghadam, 2009).
The Urumieh-Dokhtar Magmatic Assemblage
The Urumieh-Dokhtar magmatic assemblage forms an Andean-type magmatic arc associated with subduction of Neotethyan oceanic fl oor (Berberian et al., 1982; Berberian and Ber-berian, 1981; Shahabpour, 2007). Magmatic activity continued from Cretaceous to Pliocene-Quaternary time, but peak activity was in late Eocene time (Farhoudi, 1978; Amidi et al., 1984; Berberian and King, 1981). Early igneous rocks were generally calc-alkaline, changing in Oligocene-Miocene time into shoshonitic and alkaline igneous rocks (Amidi et al., 1984).
FIELD OBSERVATIONS OF THE DEHSHIR OPHIOLITE
The Dehshir ophiolite is exposed discontinu-ously over ~150 km2 (Fig. 2), near the center of the Inner Zagros ophiolite belt. It consists of oceanic mantle and crustal sequences that in-clude harzburgite, gabbro, plagiogranite, sheeted dikes, and pillow lava capped by Turonian-Maastrichtian (93.5–65.5 Ma) Globotrunca-bearing pelagic limestone that rests conformably on the ophiolite (Fig. 3; Sabzehei, 1997). The Dehshir ophiolite has been previously described mainly as part of regional geological mapping (Sabzehei, 1997). No petrologic or geochemical studies have been reported for this ophiolite.
No complete lithostratigraphic succession of the ophiolite is preserved, but a tentative re-construction is presented in Figure 3, based on several sections evaluated in the fi eld (shown on right side of fi gure). The mantle sequence is exclusively harzburgite with minor leucogabbro pockets (Fig. 3). The harzburgite exhibits plas-tic deformation and high-temperature foliation, marked by stretched orthopyroxene and spinel

The Dehshir ophiolite
Geological Society of America Bulletin, September/October 2010 1519
(e.g., Nicolas et al., 1971). Diabasic dikes (<2 m thick) are abundant in the mantle sequence. Intru-sive contacts with the serpentinized peridotite are sharp and regular, suggesting that the harzburgite had cooled at the time of mafi c injection. Some diabase dikes are rooted in small pegmatite gab-bro pods. Rodingitized gabbro dikes, recognized by both their whitish weathered surface and secondary minerals such as pectolite (hydrated Ca-Na silicate, Ca
2NaHSi
3O
9) and wollastonite,
are observed throughout the exposed mantle se-
quence (Fig. 4A). Pegmatite and isotropic gab-bros are common within the mantle sequence (Fig. 4D). Truncation of gabbro-diabase dikes by serpentinized shear zones is common. No relation between the mafi c dikes injected in the peridotite and those in the sheeted dike complex was observed in the fi eld.
The cumulate ultramafi c-mafi c rocks of the Dehshir ophiolite are characterized by inter-layered leucogabbro, clinopyroxenite, and plagio-clase peridotite, as pockets within the peridotites
(Figs. 3 and 4C). These rocks grade upward into unlayered, massive gabbros. Slices of am-phibole gabbro with plagiogranite dikelets can be observed near Aziz-Abad village (Fig. 2), showing faulted contacts with the ophio litic vol-canics. Rare andesitic dikes intrude the amphi-bole gabbro.
Dehshir ophiolite volcanics consist of pillow basalts and massive basalt and andesite lava fl ows (max. 100–200 m thick). The base of the volcanic pile is intruded by compositionally bi-modal dikes that grade down into a sheeted dike complex. In the sheeted dike complex, each dike (<0.5 m thick) has been injected into others ; locally, rhyolite patches are observed as screens between dikes. Most dikes are hydrothermally altered, especially at contacts. Less altered dikes show a chilled margin on one side and a brec-ciated margin on the other side. Dikes are both felsic and mafi c; the felsic dikes are younger because they cut the mafi c dikes. Felsic dikes are about three times more abundant than mafi c dikes. The felsic dikes are not associated with felsic lavas, and there is no clear relationship between felsic dikes and granitic plugs.
Dehshir ophiolite volcanics are stratigraphi-cally overlain by Turonian-Maastrichtian (93.5–65.5 Ma) pelagic limestones and cherts (Fig. 4B). Eocene fl ysch (Qom Formation) and Miocene molasse (red sandstones of the lower Red Formation; Sabzehei, 1997) also rest un-conformably on the ophiolite and Cretaceous pelagic sediments.
The metamorphic sole of the Dehshir ophiolite is dominated by alternating actinolite- chlorite-garnet-muscovite schists and amphibolites, showing faulted contact with other ophiolite rock units near Zoolouzar village (Fig. 2). Small biotite-granite plugs, clearly younger than the metamorphic rocks, crosscut these metamor-phic rocks. The protolith of the metamorphic rocks appears to have been pyroclastic rocks (tuffs and tuffi tes), evidenced by bedding.
Petrography and Mineral Composition of the Dehshir Ophiolite
About 100 thin sections from all rock units of the Dehshir ophiolite were studied. From these, we selected 17 samples for microprobe analyses, including seven peridotites, two leuco-gabbros, three gabbroic rocks, two pillow lavas, one amphibolite, and two samples of diabasic dikes injected into harzburgite. Electron micro-probe analyses were performed on a Cameca SX-50 equipped with four spectrometers and wavelength dispersive system at the University of Paris VI, France. Operating conditions were 20 nA and a focused beam at 15 kV accelerating voltage, using natural standards.
~~~
~ ~~
~~
~~
~
~~
~~
~~
~
~~ ~~
~~
~
~~
~~
~~~
++++
~~ ~~ ~
~ ~ ~ ~
~ ~ ~^ ^
^^
= == ==
=
==
~~ ~~ ~~~
~
~~
~
~ ~~~~
^^^
^^ ^^^ ^^ ^ ^^^
^^ ^^^
=
= ==
===
= =
= =
>
>> > >
>>
~~
~~~~~~~~~~ ~
~ ~ ~~ ~~
^^
^^
^^
^^ ^
^^^
nois
serp
eD
huK-
rab
A
ZoolouzardabA-z
izA
Dizan
Ardan
DehshirN
5 km
~ ~~ ~~
Harzburgite, pyroxenitediabasic dike, spillite
(undivided)
+ ++ Gabbroic rocks
= =
= = Pillow lava, lava flow
^ ^^ ^ Sheeted dike complex
> >
> Metamorphic rocks
Pelagic limestone
Flysch-typesediments
suoecater
C rep
pU
enec
oE
fault t
faB-
rihs
heD
A06-1
A06-2A06-3
AZ06-29
G06-16
DAR05-3DAR05-4
DZ05-4
DAR05-6
AZ06-32
DR05-2A
DAR05-5
AZ06-38
DZ05-1D
D06-10
R-12DR05-3
DI05-12
DZ05-1H
D06-3
DR05-1
G06-17G06-18
G06-11 G06-23
AZ06-8AZ06-11AZ06-36AZ06-31
AZ06-26AZ06-40
G06-13G06-20
DZ05-8DZ05-9DZ05-6AZ06-25
31°15′N
53°45′E
31°00′N
Youngerstrata
Figure 2. Simplifi ed geological map of the Dehshir ophiolite (compiled after Sabzehei, 1997). Location of samples is also shown.

Shafaii Moghadam et al.
1520 Geological Society of America Bulletin, September/October 2010
Dehshir ophiolite Pelagic limestone
Pyroclastic rocks
Amphibole gabbro
Pillow lava
Sheeted dike complex Massive lava
Plagiogranite veins
vvvv v
v
vvvv
v
vv
v
v vv v v v v v vv vv vv v v v vv vv vv v
v
v
vv
vv
vv
v
Metamorphic rocks
Granite plug
Diabasic dike
Pegmatite gabbro
Pyroxenite sill
Dunite pod
Gabbro dike
Cumulate pocket (Leucogabbro)
Isotropic gabbro Plagioclase peridotite
vv v
>
>>> DZ05-8
Harzburgite AZ06-26AZ06-40G06-13
G06-20
G06-6; 11; 17; 18; 23
DR05-1
Rhyolitic patches AZ06-25
DZ05-6
DZ05-9
A06-1; AZ06-29 G06-16; DAR05-3 DAR05-4; DZ05-4
R-12; DI05-12; DR05-3
A06-2A06-3
calc-alkaline pillow
harzburgite
chert
pillow DAR05-6MORB-IAT
pillow, AZ06-32
basaltic dike AZ06-38N-MORB
late dacitic dike AZ06-8; 11; 31; 36
IAT SiO2 = 61.5%
vv v v v
vv vv
vvv
vv
v
vv
v
++
++
+
andesitic dike DZ05-1D(boninite) amphibole gabbro
DZ05-1H; D06-3
vvv
vv vvv
vv
D06-10boninite
DR05-2ADAR05-5
IAT
?Faulted contact
Fig 4B
Fig 4A
Fig 4C
Fig 4D
vv
v
vv
++
++
diabasic dike A06-1calc-alkaline
Figure 3. Simplifi ed stratigraphic column displaying idealized internal lithologic suc-cessions in the Dehshir ophiolite. Approxi-mate stratigraphic positions of samples are also shown, especially for lavas (small column on right). Position of photographs shown in Figure 4 is also shown.
A Harzburgite
Gabbro dike
B
Pillow lava
Chert
C
Gabbro
Harzburgite
600 μm
E
Plag
Cpx
D
Pegmatitic gabbro
Harzburgite
600 μm
F
Plagioclase
Olivine
Figure 4. Field photographs and photomicrographs of the Dehshir ophiolite (approximate positions shown in Fig. 3). (A) Injection of gabbroic dike in harzburgite. The intrusive contacts of the dike are sharp and regular. (B) Stratigraphic contact of pillow lava with overly-ing chert nearing Ardan village (Fig. 2). (C) Layered leucogabbro as magmatic pocket within the harzburgite. (D) Small pod of pegma-tite gabbro with sharp to gradational contact within harzburgite. Photomicrographs (cross-polarized light): (E) leucogabbro (G06–23), altered coarse plagioclase (Plag), and clinopyroxenes (Cpx), showing intergranular texture, and (F) plagioclase lherzolite (G06–20), show-ing altered cumulate olivine and plagioclase.

The Dehshir ophiolite
Geological Society of America Bulletin, September/October 2010 1521
Mantle Sequence
The mantle sequence is dominated by perido-tite residues after melting. These ultramafi c rocks are mostly altered to serpentinite, but relict oli-vines and pyroxenes are common. The intensity of serpentinization ranges from moderate (<40%) to high (>60%). Reconstructed perido tites were mainly harzburgite (<3% modal clinopyroxene) and clinopyroxene-bearing harz burgite (3%–5% clinopyroxene). There is more harzburgite than clinopyroxene-bearing harzburgite in the Dehshir mantle sequence. Textural observa-tions show that clinopyroxenes are magmatic but formed late, perhaps refl ecting melt infi ltra-tion. Harzburgite and clinopyroxene-harzburgite mainly show porphyroclastic texture, with coarse-grained orthopyroxene.
Olivine relicts in harzburgites are homo-geneous, Fo
90 to Fo
91 (Table 1; Table 2), and are
often kink-banded; NiO contents range from 0.23% to 0.44%, typical of mantle olivines (Sobolev et al., 2005). Orthopyroxene por phyro-clasts have compositions between Wo
2En
89Fs
9
and Wo3En
83Fs
14.
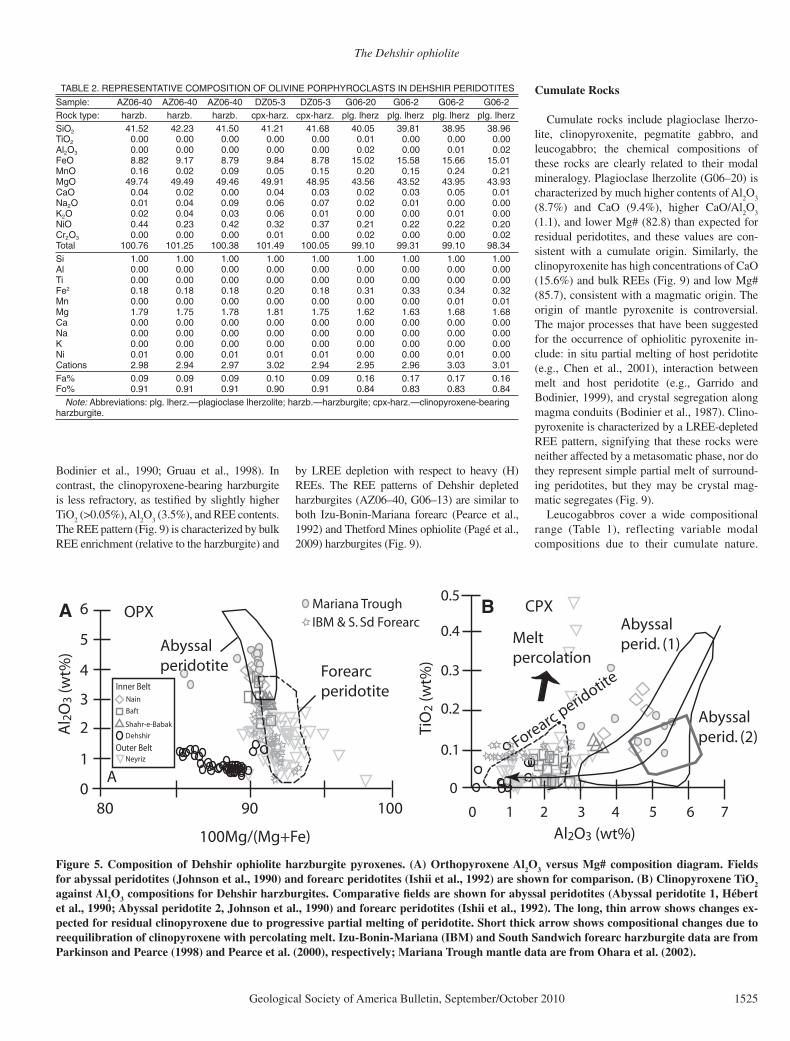
Figure 5A shows some variations in Dehshir ophiolite orthopyroxene (Opx) Mg#. Dehshir perido tite orthopyroxenes have low Al
2O
3 (0.5%–
1.6%) and CaO (0.8%–2.2%) contents (Table 3), resembling depleted harzburgites from mod-ern forearcs (Fig. 5A). Clinopyroxene-bearing harz burgite contains porphyroclasts of diopside to augite, from Wo
40En
52Fs
8 to Wo
49En
40Fs
11.
Al2O
3 and TiO
2 contents of clinopyroxenes
( Table 3) are similar to the very low values found in clinopyroxenes from highly depleted forearc peridotites (Ishii et al., 1992) (Fig. 5B). Dehshir harzburgite clinopyroxenes are chemically dis-tinct from those of moderately depleted abys-sal peridotites, which have signifi cantly higher
Al2O
3 and TiO
2 contents (Hébert et al., 1990;
Johnson et al., 1990) (Fig. 5B).Lobate or vermicular Cr-spinel is the main
accessory phase in Dehshir ophiolite perido-tites. Spinel in clinopyroxene-harzburgites is light brown and Al-rich, with low Cr# (= [100Cr/Cr + Al] = 21–22), whereas depleted harzburgites contain dark brown spinel with high Cr# (61–82; Table 4). These Cr-spinels show chemical variations following both mid-ocean-ridge basalt (MORB) and forearc trends of Dick and Bullen (1984) (Fig. 6A). Spinel compositions are plotted in the discrimination diagram (Fig. 6B; Kamenetsky et al., 2001), where peridotite spinels can be divided into two distinct types: (1) those with low Al
2O
3 and
low TiO2 contents, consistent with the fi eld of
suprasubduction-zone peridotite spinels; and (2) those with more Al
2O
3 and TiO
2, similar to
MORB peridotites. Some low-Al spinels have
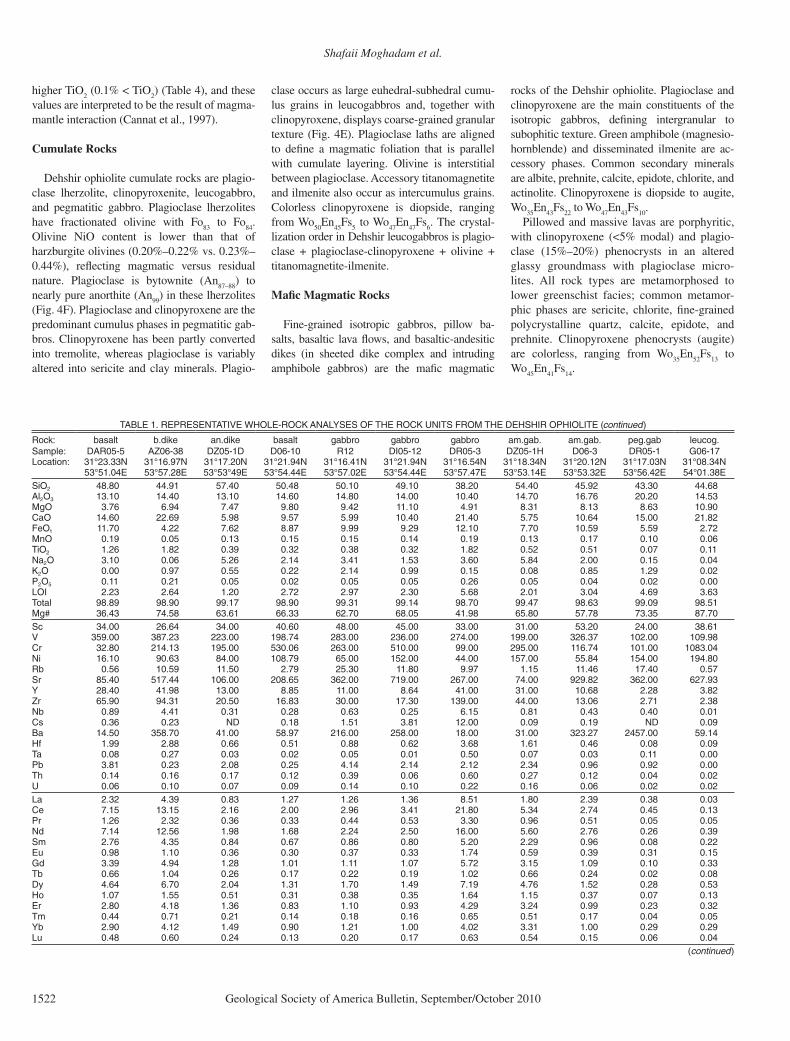
TABLE 1. REPRESENTATIVE WHOLE-ROCK ANALYSES OF THE ROCK UNITS FROM THE DEHSHIR OPHIOLITE
Rock: d.dike d.dike d.dike d.dike d.dike d.dike p. lava p. lava p. lava p. lava basaltSample: A06-1 AZ06-29 G06-16 DAR05-3 DAR05-4 DZ05-4 A06-2 A06-3 DAR05-6 AZ06-32 DR05-2ALocation: 31°23.77N 31°17.08N 31°07.55N 31°23.33N 31°23.33N 31°17.20N 31°23.77N 31°23.77N 31°23.43N 31°17.08N 31°16.41N
53°50.05E 53°57.09E 54°00.49E 53°51.04E 53°51.04E 53°53°49E 53°50.05E 53°50.05E 53°51.08E 53°57.11E 53°57.02ESiO2 51.68 48.73 52.24 52.20 51.10 51.80 46.87 45.42 50.40 61.50 51.00Al2O3 15.51 14.12 15.01 13.90 14.30 14.60 10.78 13.86 13.70 15.48 12.20MgO 7.20 9.64 4.75 5.45 4.26 4.39 6.06 2.59 2.90 1.53 6.82CaO 4.99 12.68 8.22 9.76 8.35 9.27 13.94 12.69 8.23 6.76 6.98FeOt 10.03 9.35 10.65 10.20 12.50 9.87 9.15 10.45 11.80 6.84 13.10MnO 0.16 0.11 0.17 0.16 0.19 0.14 0.15 0.15 0.17 0.20 0.24TiO2 0.93 0.28 0.82 0.78 1.37 0.69 0.44 0.62 1.94 0.50 1.81Na2O 4.40 1.38 5.20 3.79 4.28 5.23 4.60 5.88 5.46 4.58 3.73K2O 1.39 0.06 0.82 0.58 0.17 0.82 0.71 0.15 0.55 0.04 0.88P2O5 0.10 0.02 0.04 0.16 0.11 0.12 0.14 0.30 0.36 0.09 0.24LOI 2.41 2.73 1.03 2.21 1.79 1.96 5.85 7.13 3.32 1.66 1.47Total 98.80 99.10 98.95 99.24 98.45 98.98 98.68 99.24 98.82 99.17 98.50Mg# 56.13 64.78 44.29 48.79 37.80 44.23 54.14 30.61 30.47 28.49 48.14Sc 36.88 46.98 24.49 34.00 36.60 31.00 49.38 37.91 38.00 16.94 43.00V 281.19 236.01 297.23 237.00 381.00 293.00 360.50 290.53 270.00 98.13 363.00Cr 109.90 299.41 14.11 82.00 22.10 62.00 580.29 38.12 161.00 6.12 79.00Ni 58.70 94.63 36.01 32.00 16.80 41.00 211.20 27.34 118.00 4.89 51.00Rb 15.20 0.44 7.51 8.00 2.47 12.60 12.07 1.68 11.10 0.31 9.34Sr 868.73 272.42 210.61 279.00 150.00 701.00 203.72 187.28 240.00 287.90 143.00Y 22.64 8.15 21.83 25.00 29.00 19.90 11.79 15.99 51.60 23.39 56.00Zr 52.49 10.38 33.24 68.20 65.90 49.30 25.33 33.92 163.00 50.15 185.00Nb 1.35 0.29 0.35 1.65 1.02 0.76 0.66 0.91 5.33 1.29 4.84Cs 7.43 0.02 0.11 0.03 0.15 0.53 0.63 0.29 0.43 0.08 0.10Ba 192.01 13.64 27.29 143.00 18.30 15.35 81.81 42.27 74.60 13.43 236.00Hf 1.59 0.37 1.18 1.98 1.98 1.60 0.75 1.03 4.19 1.64 4.81Ta 0.08 0.02 0.03 0.10 0.18 0.05 0.04 0.06 1.07 0.09 0.38Pb 1.32 0.43 0.40 1.84 4.53 4.16 13.68 3.00 3.50 1.53 2.52Th 0.77 0.12 0.08 0.76 0.23 0.50 0.52 0.77 0.54 0.61 0.47U 1.13 0.08 0.05 0.22 0.20 0.16 0.41 0.38 0.24 0.42 0.21La 4.89 0.57 1.04 5.36 2.37 2.99 4.57 5.57 7.83 3.78 7.48Ce 10.63 1.41 3.64 12.10 7.36 7.24 8.01 11.17 20.40 9.03 21.40Pr 1.55 0.24 0.69 1.78 1.33 1.14 1.14 1.59 3.24 1.45 3.44Nd 7.54 1.36 4.01 8.91 7.51 6.08 5.39 7.33 16.80 7.33 17.80Sm 2.31 0.57 1.65 2.86 2.80 2.14 1.47 1.94 5.34 2.30 6.09Eu 0.80 0.21 0.60 1.05 1.15 0.74 0.49 0.64 1.88 0.87 1.80Gd 2.48 0.74 2.09 3.38 3.61 2.53 1.42 1.89 6.76 2.59 6.99Tb 0.52 0.16 0.47 0.60 0.71 0.47 0.27 0.36 1.22 0.53 1.29Dy 3.35 1.11 3.17 4.33 4.82 3.39 1.63 2.25 8.28 3.42 9.14Ho 0.79 0.28 0.77 1.02 1.17 0.78 0.38 0.53 1.94 0.86 2.12Er 2.16 0.79 2.12 2.52 3.10 2.11 1.04 1.41 5.04 2.34 5.66Tm 0.38 0.14 0.38 0.38 0.46 0.34 0.18 0.25 0.77 0.42 0.88Yb 2.15 0.83 2.23 2.66 2.91 2.23 0.99 1.47 4.65 2.41 5.50Lu 0.34 0.12 0.34 0.43 0.51 0.36 0.15 0.22 0.76 0.38 0.87
(continued)
Shafaii Moghadam et al.
1522 Geological Society of America Bulletin, September/October 2010
higher TiO2 (0.1% < TiO
2) (Table 4), and these
values are interpreted to be the result of magma-mantle interaction (Cannat et al., 1997).
Cumulate Rocks
Dehshir ophiolite cumulate rocks are plagio-clase lherzolite, clinopyroxenite, leucogabbro, and pegmatitic gabbro. Plagioclase lherzolites have fractionated olivine with Fo
83 to Fo
84.
Oli vine NiO content is lower than that of harz burgite olivines (0.20%–0.22% vs. 0.23%–0.44%), refl ecting magmatic versus residual nature. Plagioclase is bytownite (An
87–88) to
nearly pure anorthite (An99
) in these lherzolites (Fig. 4F). Plagioclase and clinopyroxene are the predominant cumulus phases in pegmatitic gab-bros. Clinopyroxene has been partly converted into tremolite, whereas plagioclase is variably altered into sericite and clay minerals. Plagio-
clase occurs as large euhedral-subhedral cumu-lus grains in leucogabbros and, together with clinopyroxene, displays coarse-grained granular texture (Fig. 4E). Plagioclase laths are aligned to defi ne a magmatic foliation that is parallel with cumulate layering. Olivine is interstitial between plagioclase. Accessory titanomagnetite and ilmenite also occur as intercumulus grains. Colorless clinopyroxene is diopside, ranging from Wo
50En
45Fs
5 to Wo
47En
47Fs
6. The crystal-
lization order in Dehshir leucogabbros is plagio-clase + plagioclase-clinopyroxene + olivine + titanomagnetite-ilmenite.
Mafi c Magmatic Rocks
Fine-grained isotropic gabbros, pillow ba-salts, basaltic lava fl ows, and basaltic-andesitic dikes (in sheeted dike complex and intruding amphibole gabbros) are the mafi c magmatic
rocks of the Dehshir ophiolite. Plagioclase and clinopyroxene are the main constituents of the isotropic gabbros, defi ning intergranular to subophitic texture. Green amphibole ( magnesio-hornblende) and disseminated ilmenite are ac-cessory phases. Common secondary minerals are albite, prehnite, calcite, epidote, chlorite, and actinolite. Clinopyroxene is diopside to augite, Wo
35En
43Fs
22 to Wo
47En
43Fs
10.
Pillowed and massive lavas are porphyritic, with clinopyroxene (<5% modal) and plagio-clase (15%–20%) phenocrysts in an altered glassy groundmass with plagioclase micro-lites. All rock types are metamorphosed to lower greenschist facies; common metamor-phic phases are sericite, chlorite, fi ne-grained polycrystalline quartz, calcite, epidote, and prehnite. Clinopyroxene phenocrysts (augite) are colorless, ranging from Wo
35En
52Fs
13 to
Wo45
En41
Fs14
.
TABLE 1. REPRESENTATIVE WHOLE-ROCK ANALYSES OF THE ROCK UNITS FROM THE DEHSHIR OPHIOLITE (continued)
Rock: basalt b.dike an.dike basalt gabbro gabbro gabbro am.gab. am.gab. peg.gab leucog.Sample: DAR05-5 AZ06-38 DZ05-1D D06-10 R12 DI05-12 DR05-3 DZ05-1H D06-3 DR05-1 G06-17Location: 31°23.33N 31°16.97N 31°17.20N 31°21.94N 31°16.41N 31°21.94N 31°16.54N 31°18.34N 31°20.12N 31°17.03N 31°08.34N
53°51.04E 53°57.28E 53°53°49E 53°54.44E 53°57.02E 53°54.44E 53°57.47E 53°53.14E 53°53.32E 53°56.42E 54°01.38ESiO2 48.80 44.91 57.40 50.48 50.10 49.10 38.20 54.40 45.92 43.30 44.68Al2O3 13.10 14.40 13.10 14.60 14.80 14.00 10.40 14.70 16.76 20.20 14.53MgO 3.76 6.94 7.47 9.80 9.42 11.10 4.91 8.31 8.13 8.63 10.90CaO 14.60 22.69 5.98 9.57 5.99 10.40 21.40 5.75 10.64 15.00 21.82FeOt 11.70 4.22 7.62 8.87 9.99 9.29 12.10 7.70 10.59 5.59 2.72MnO 0.19 0.05 0.13 0.15 0.15 0.14 0.19 0.13 0.17 0.10 0.06TiO2 1.26 1.82 0.39 0.32 0.38 0.32 1.82 0.52 0.51 0.07 0.11Na2O 3.10 0.06 5.26 2.14 3.41 1.53 3.60 5.84 2.00 0.15 0.04K2O 0.00 0.97 0.55 0.22 2.14 0.99 0.15 0.08 0.85 1.29 0.02P2O5 0.11 0.21 0.05 0.02 0.05 0.05 0.26 0.05 0.04 0.02 0.00LOI 2.23 2.64 1.20 2.72 2.97 2.30 5.68 2.01 3.04 4.69 3.63Total 98.89 98.90 99.17 98.90 99.31 99.14 98.70 99.47 98.63 99.09 98.51Mg# 36.43 74.58 63.61 66.33 62.70 68.05 41.98 65.80 57.78 73.35 87.70Sc 34.00 26.64 34.00 40.60 48.00 45.00 33.00 31.00 53.20 24.00 38.61V 359.00 387.23 223.00 198.74 283.00 236.00 274.00 199.00 326.37 102.00 109.98Cr 32.80 214.13 195.00 530.06 263.00 510.00 99.00 295.00 116.74 101.00 1083.04Ni 16.10 90.63 84.00 108.79 65.00 152.00 44.00 157.00 55.84 154.00 194.80Rb 0.56 10.59 11.50 2.79 25.30 11.80 9.97 1.15 11.46 17.40 0.57Sr 85.40 517.44 106.00 208.65 362.00 719.00 267.00 74.00 929.82 362.00 627.93Y 28.40 41.98 13.00 8.85 11.00 8.64 41.00 31.00 10.68 2.28 3.82Zr 65.90 94.31 20.50 16.83 30.00 17.30 139.00 44.00 13.06 2.71 2.38Nb 0.89 4.41 0.31 0.28 0.63 0.25 6.15 0.81 0.43 0.40 0.01Cs 0.36 0.23 ND 0.18 1.51 3.81 12.00 0.09 0.19 ND 0.09Ba 14.50 358.70 41.00 58.97 216.00 258.00 18.00 31.00 323.27 2457.00 59.14Hf 1.99 2.88 0.66 0.51 0.88 0.62 3.68 1.61 0.46 0.08 0.09Ta 0.08 0.27 0.03 0.02 0.05 0.01 0.50 0.07 0.03 0.11 0.00Pb 3.81 0.23 2.08 0.25 4.14 2.14 2.12 2.34 0.96 0.92 0.00Th 0.14 0.16 0.17 0.12 0.39 0.06 0.60 0.27 0.12 0.04 0.02U 0.06 0.10 0.07 0.09 0.14 0.10 0.22 0.16 0.06 0.02 0.02La 2.32 4.39 0.83 1.27 1.26 1.36 8.51 1.80 2.39 0.38 0.03Ce 7.15 13.15 2.16 2.00 2.96 3.41 21.80 5.34 2.74 0.45 0.13Pr 1.26 2.32 0.36 0.33 0.44 0.53 3.30 0.96 0.51 0.05 0.05Nd 7.14 12.56 1.98 1.68 2.24 2.50 16.00 5.60 2.76 0.26 0.39Sm 2.76 4.35 0.84 0.67 0.86 0.80 5.20 2.29 0.96 0.08 0.22Eu 0.98 1.10 0.36 0.30 0.37 0.33 1.74 0.59 0.39 0.31 0.15Gd 3.39 4.94 1.28 1.01 1.11 1.07 5.72 3.15 1.09 0.10 0.33Tb 0.66 1.04 0.26 0.17 0.22 0.19 1.02 0.66 0.24 0.02 0.08Dy 4.64 6.70 2.04 1.31 1.70 1.49 7.19 4.76 1.52 0.28 0.53Ho 1.07 1.55 0.51 0.31 0.38 0.35 1.64 1.15 0.37 0.07 0.13Er 2.80 4.18 1.36 0.83 1.10 0.93 4.29 3.24 0.99 0.23 0.32Tm 0.44 0.71 0.21 0.14 0.18 0.16 0.65 0.51 0.17 0.04 0.05Yb 2.90 4.12 1.49 0.90 1.21 1.00 4.02 3.31 1.00 0.29 0.29Lu 0.48 0.60 0.24 0.13 0.20 0.17 0.63 0.54 0.15 0.06 0.04
(continued)

The Dehshir ophiolite
Geological Society of America Bulletin, September/October 2010 1523
Diabasic Dikes in Mantle Harzburgites
Diabasic dikes intrude Dehshir mantle harz-burgites. The texture of these rocks ranges from fi ne to medium grained, aphyric to moderately porphyritic, with clinopyroxene (Wo
38En
47Fs
15
to Wo43
En44
Fs13
; <5% modal) and plagioclase (5%–15%) phenocrysts set in an intergranular groundmass. Accessory phases are interstitial amphibole (both hornblende and secondary actino lite) and titanomagnetite.
Acidic Rocks
Dacite dikes are common in the sheeted dike complex. Albite microlites, K-feldspar, and quartz are the main constituents. Plagio-granites occur both as dikelets injected into isotropic gabbros and as small plugs emplaced in metamorphic rocks. Plagioclase, ortho clase,
and anhedral quartz grains are found in these rocks. Accessory phases are amphibole and biotite.
Metamorphic Rocks
The metamorphic sole of the Dehshir ophio-lite is a zone (~50 m thick) of alternating actinolite-chlorite-garnet-muscovite schists and amphibolites. The metamorphic grade varies from greenschist to lower amphibolite facies. These metamorphic rocks show granoblastic to nematoblastic texture with amphibole, feld-spar, quartz, muscovite, biotite, chlorite, garnet, epidote, sphene, and prehnite as predominant phases. Plagioclase compositions range from al-most pure albite to An
36 (andesine). K-feldspar is
almost pure orthoclase (Or98
) (Table 6). Amphi-bole occurs as green hornblende and secondary pale-green actinolite. The most abundant type
is fi brous actinolite (Aliv < 0.5; TiO2 < 0.5%)
( Table 7). Moreover, amphibole compositions de-fi ne a restricted trend from magnesio-hornblende to actinolite in the Mg/Mg + Fe+2 versus Si (in tetrahedral site) diagram (Fig. 7). These amphi-boles plot far from the representative magmatic amphibole compositions for oceanic gabbros defi ned by Coogan et al. (2001), indicating that Dehshir amphiboles are metamorphic.
CLINOPYROXENE COMPOSITIONS OF MAFIC MAGMATIC ROCKS
It is widely accepted that clinopyroxene com-positions in basalts are a useful indicator of dif-ferent magma compositions, and thus tectonic settings (Leterrier et al., 1982), and of differ-ent ophiolite types (Huot et al., 2002). Com-positional contrasts between clino pyroxenes from different mafi c rock units of the Dehshir
TABLE 1. REPRESENTATIVE WHOLE-ROCK ANALYSES OF THE ROCK UNITS FROM THE DEHSHIR OPHIOLITE (continued)
Rock: leucog. leucog. leucog. leucog. dc.dike dc.dike dc.dike dc.dike granite granite amphib.Sample: G06-18 G06-11 G06-23 G06-6 AZ06-8 AZ06-11 AZ06-36 AZ06-31 AZ06-25 DZ05-6 DZ05-9Location: 31°08.34N 31°08.34N 31°07.12N 31°08.34N 31°17.03N 31°17.03N 31°17.05N 31°17.05N 31°16.23N 31°17.32N 31°17.32N
54°01.38E 54°01.38E 54°02.01E 54°01.38E 53°57.79E 53°57.79E 53°57.79E 53°57.79E 53°56.43E 53°53.67E 53°53.67ESiO2 39.73 43.21 43.58 39.38 71.20 63.84 71.26 68.36 76.45 76.60 42.50Al2O3 23.33 22.98 18.07 2.15 12.78 14.52 10.82 14.20 11.36 12.80 14.70MgO 4.17 6.06 10.73 37.61 0.96 2.32 0.10 1.42 0.83 0.77 12.90CaO 24.74 17.33 12.17 0.75 2.57 5.43 11.11 1.53 3.74 1.13 15.10FeOt 1.29 3.12 7.49 8.00 3.98 5.66 3.01 4.75 1.49 1.17 9.28MnO 0.03 0.06 0.11 0.12 0.10 0.12 0.07 0.11 0.02 0.02 0.15TiO2 0.04 0.09 0.20 0.02 0.32 0.35 0.31 0.41 0.11 0.21 0.32Na2O 0.00 0.81 0.37 0.00 5.93 4.70 0.23 6.89 3.80 5.78 0.62K2O 0.00 1.23 2.46 0.00 0.02 0.05 0.00 0.09 0.09 0.41 0.29P2O5 0.01 – 0.00 0.01 0.03 0.04 0.03 0.07 0.00 0.07 0.05LOI 5.58 4.11 3.36 11.23 1.21 2.05 2.10 1.23 1.07 0.87 3.30Total 98.92 99.00 98.56 99.27 99.10 99.08 99.05 99.07 98.97 99.89 99.15Mg# 85.18 77.60 71.86 89.34 30.19 42.28 5.73 34.76 49.68 53.89 71.25Sc 9.49 23.39 46.79 8.92 15.02 23.74 12.58 12.22 2.34 2.00 49.00V 31.93 64.01 168.20 62.44 34.90 102.64 53.69 56.91 33.64 15.00 162.00Cr 734.42 237.71 352.22 2585.78 2.24 42.18 26.56 3.64 6.13 14.00 719.00Ni 132.07 60.46 130.23 1934.00 5.26 18.74 8.85 3.57 16.11 9.00 162.00Rb 0.29 22.85 48.92 0.08 0.41 0.33 0.19 0.71 1.00 7.96 1.72Sr 30.11 407.24 425.71 6.38 88.83 111.28 320.74 121.26 170.50 94.00 55.00Y 1.37 2.46 3.22 1.62 23.03 18.48 32.02 25.20 2.85 9.33 10.00Zr 1.30 1.04 0.98 0.67 57.81 45.02 73.26 61.79 50.25 77.40 13.00Nb 0.00 0.00 0.05 0.00 1.35 1.09 1.97 1.55 0.41 1.35 0.39Cs 0.03 0.84 1.95 0.08 0.02 0.02 0.06 0.12 0.00 ND 0.05Ba 2.28 103.49 147.39 0.34 8.46 6.72 12.76 42.63 22.87 124.00 34.00Hf 0.03 0.04 0.05 0.01 1.84 1.40 2.32 2.00 1.20 1.95 0.46Ta 0.00 0.00 0.00 0.00 0.09 0.07 0.12 0.10 0.03 0.10 0.03Pb 0.42 – 0.99 0.12 1.85 1.49 1.24 1.30 3.00 3.95 17.80Th 0.01 0.00 0.00 0.04 0.70 0.56 1.00 0.78 0.41 0.89 0.29U 0.03 0.02 0.02 0.05 0.33 0.24 0.36 0.40 0.20 0.39 0.14La 0.21 0.25 0.28 0.02 4.16 3.46 6.13 4.74 1.93 3.46 1.00Ce 0.12 0.18 0.20 0.01 9.59 7.87 13.38 11.02 2.16 5.67 2.19Pr 0.02 0.04 0.04 0.00 1.48 1.22 2.02 1.69 0.25 0.70 0.30Nd 0.15 0.24 0.32 0.01 7.23 5.85 9.81 8.32 0.94 2.75 1.55Sm 0.06 0.14 0.20 0.02 2.29 1.84 2.94 2.58 0.23 0.69 0.62Eu 0.14 0.11 0.14 0.01 0.73 0.62 1.16 0.78 0.17 0.25 0.28Gd 0.11 0.24 0.28 0.06 2.42 1.96 3.25 2.77 0.23 0.79 0.82Tb 0.02 0.04 0.05 0.02 0.50 0.40 0.71 0.58 0.05 0.14 0.19Dy 0.15 0.29 0.40 0.13 3.43 2.69 4.74 3.83 0.31 1.30 1.50Ho 0.03 0.07 0.09 0.03 0.82 0.65 1.13 0.91 0.08 0.29 0.36Er 0.09 0.18 0.22 0.10 2.26 1.77 3.16 2.55 0.26 0.87 1.08Tm 0.01 0.03 0.04 0.02 0.40 0.31 0.56 0.44 0.04 0.17 0.18Yb 0.08 0.15 0.21 0.13 2.46 1.90 3.28 2.73 0.34 1.21 1.21Lu 0.01 0.02 0.03 0.02 0.38 0.29 0.48 0.41 0.06 0.22 0.20
(continued)
Shafaii Moghadam et al.
1524 Geological Society of America Bulletin, September/October 2010
ophiolite are revealed by diagrams that plot TiO
2 and Al
2O
3 contents versus Mg# and Cr
2O
3
+ TiO2, respectively (Fig. 8). Although Dehshir
clinopyroxenes have Mg# values ranging from 66.9 to 90.5, only clinopyroxene from leuco-gabbros shows high values (Fig. 8A). The high Mg# of clinopyroxenes is consistent with py-roxene composition in other ophiolites and is-land arcs (De Bari and Coleman, 1989). TiO
2
(<0.8%), Cr2O
3 (<0.7%), and Al
2O
3 (0.5%–4%)
abundances (Table 5) are similar to clinopyrox-enes of both island-arc tholeiites and boninites (Fig. 8B), and the data defi ne a compositional array that is typical of suprasubduction-zone ba-salts. The low TiO
2 contents of Dehshir mafi c
clinopyroxenes likely refl ect a depleted mantle source (e.g., Pearce and Norry, 1979). The low
Na2O content (<0.5%) of Dehshir mafi c pyrox-
enes indicates low-pressure crystallization and the depleted tholeiitic nature of the parental magma (e.g., Bonev and Stampfl i, 2009). The low Ti/Altot ratio places clinopyroxenes in the arc tholeiitic–boninitic fi eld (Leterrier et al., 1982), further indicating formation in a supra-subduction-zone environment.
WHOLE-ROCK GEOCHEMISTRY
Analytical Methods
Major- and trace-element analyses were car-ried out using inductively coupled plasma–mass spectrometry (ICP-MS) and ICP–atomic emis-sion spectrometry (AES) at the Centre de Géo-
chimie de la Surface, Strasbourg (France), using standard methods (Govindaradju, 1994). For analyses using ICP-AES, the relative precision is ±10%, while ICP-MS analyses have a preci-sion of ±5%. Table 1 presents chemical data for 37 whole-rock samples, including peridotites and pyroxenites (fi ve samples), leuco gabbros (four), gabbroic rocks (six), basaltic lavas and pillow lavas (nine), felsic rocks including plagio granites and dacitic dikes in the sheeted dike complex (six), amphibolite (one), and six samples from diabasic dikes that intrude harz-burgite. Samples have variable loss on ignition (LOI; 0.9%–7.1%, except peridotites, which have up to 11.66% LOI), which attests to the variable degree of alteration of these rocks. We therefore use immobile trace elements and rare earth elements (REEs) for the evaluation of geo-chemical signatures and the tectono-magmatic environment of the rocks.
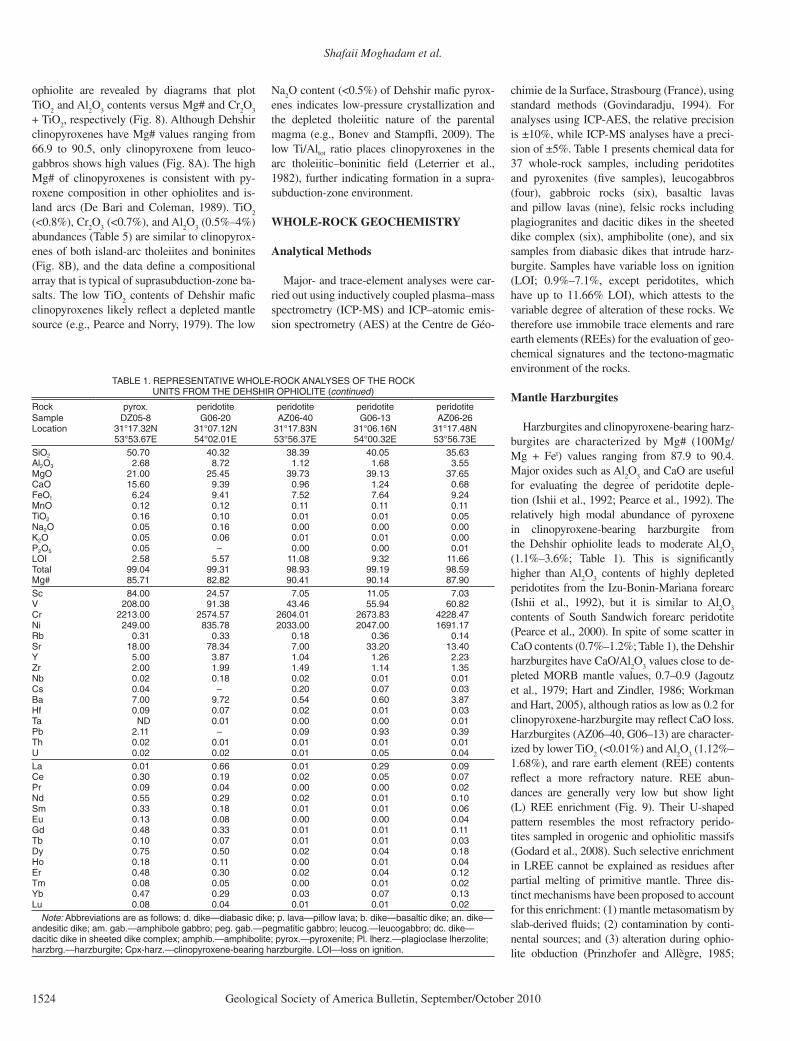
Mantle Harzburgites
Harzburgites and clinopyroxene-bearing harz-burgites are characterized by Mg# (100Mg/Mg + Fet) values ranging from 87.9 to 90.4. Major oxides such as Al
2O
3 and CaO are useful
for evaluating the degree of peridotite deple-tion (Ishii et al., 1992; Pearce et al., 1992). The relatively high modal abundance of pyroxene in clinopyroxene-bearing harzburgite from the Dehshir ophiolite leads to moderate Al
2O
3
(1.1%–3.6%; Table 1). This is signifi cantly higher than Al
2O
3 contents of highly depleted
peridotites from the Izu-Bonin-Mariana forearc (Ishii et al., 1992), but it is similar to Al
2O
3
contents of South Sandwich forearc peridotite (Pearce et al., 2000). In spite of some scatter in CaO contents (0.7%–1.2%; Table 1), the Dehshir harzburgites have CaO/Al
2O
3 values close to de-
pleted MORB mantle values, 0.7–0.9 (Jagoutz et al., 1979; Hart and Zindler, 1986; Workman and Hart, 2005), although ratios as low as 0.2 for clinopyroxene-harzburgite may refl ect CaO loss. Harzburgites (AZ06–40, G06–13) are character-ized by lower TiO
2 (<0.01%) and Al
2O
3 (1.12%–
1.68%), and rare earth element (REE) contents refl ect a more refractory nature. REE abun-dances are generally very low but show light (L) REE enrichment (Fig. 9). Their U-shaped pattern resembles the most refractory perido-tites sampled in orogenic and ophiolitic massifs (Godard et al., 2008). Such selective enrichment in LREE cannot be explained as residues after partial melting of primitive mantle. Three dis-tinct mechanisms have been proposed to account for this enrichment: (1) mantle metasomatism by slab-derived fl uids; (2) contamination by conti-nental sources; and (3) alteration during ophio-lite obduction (Prinzhofer and Allègre, 1985;
TABLE 1. REPRESENTATIVE WHOLE-ROCK ANALYSES OF THE ROCK UNITS FROM THE DEHSHIR OPHIOLITE (continued)
Rock pyrox. peridotite peridotite peridotite peridotiteSample DZ05-8 G06-20 AZ06-40 G06-13 AZ06-26Location 31°17.32N 31°07.12N 31°17.83N 31°06.16N 31°17.48N
53°53.67E 54°02.01E 53°56.37E 54°00.32E 53°56.73ESiO2 50.70 40.32 38.39 40.05 35.63Al2O3 2.68 8.72 1.12 1.68 3.55MgO 21.00 25.45 39.73 39.13 37.65CaO 15.60 9.39 0.96 1.24 0.68FeOt 6.24 9.41 7.52 7.64 9.24MnO 0.12 0.12 0.11 0.11 0.11TiO2 0.16 0.10 0.01 0.01 0.05Na2O 0.05 0.16 0.00 0.00 0.00K2O 0.05 0.06 0.01 0.01 0.00P2O5 0.05 – 0.00 0.00 0.01LOI 2.58 5.57 11.08 9.32 11.66Total 99.04 99.31 98.93 99.19 98.59Mg# 85.71 82.82 90.41 90.14 87.90Sc 84.00 24.57 7.05 11.05 7.03V 208.00 91.38 43.46 55.94 60.82Cr 2213.00 2574.57 2604.01 2673.83 4228.47Ni 249.00 835.78 2033.00 2047.00 1691.17Rb 0.31 0.33 0.18 0.36 0.14Sr 18.00 78.34 7.00 33.20 13.40
32.262.140.178.300.5YZr 2.00 1.99 1.49 1.14 1.35Nb 0.02 0.18 0.02 0.01 0.01Cs 0.04 – 0.20 0.07 0.03Ba 7.00 9.72 0.54 0.60 3.87Hf 0.09 0.07 0.02 0.01 0.03
10.000.000.010.0DNaTPb 2.11 – 0.09 0.93 0.39Th 0.02 0.01 0.01 0.01 0.01
40.050.010.020.020.0ULa 0.01 0.66 0.01 0.29 0.09Ce 0.30 0.19 0.02 0.05 0.07Pr 0.09 0.04 0.00 0.00 0.02Nd 0.55 0.29 0.02 0.01 0.10Sm 0.33 0.18 0.01 0.01 0.06Eu 0.13 0.08 0.00 0.00 0.04Gd 0.48 0.33 0.01 0.01 0.11Tb 0.10 0.07 0.01 0.01 0.03Dy 0.75 0.50 0.02 0.04 0.18Ho 0.18 0.11 0.00 0.01 0.04Er 0.48 0.30 0.02 0.04 0.12Tm 0.08 0.05 0.00 0.01 0.02Yb 0.47 0.29 0.03 0.07 0.13Lu 0.08 0.04 0.01 0.01 0.02
Note: Abbreviations are as follows: d. dike—diabasic dike; p. lava—pillow lava; b. dike—basaltic dike; an. dike—andesitic dike; am. gab.—amphibole gabbro; peg. gab.—pegmatitic gabbro; leucog.—leucogabbro; dc. dike—dacitic dike in sheeted dike complex; amphib.—amphibolite; pyrox.—pyroxenite; Pl. lherz.—plagioclase lherzolite; harzbrg.—harzburgite; Cpx-harz.—clinopyroxene-bearing harzburgite. LOI—loss on ignition.
The Dehshir ophiolite
Geological Society of America Bulletin, September/October 2010 1525
Bodinier et al., 1990; Gruau et al., 1998). In contrast, the clinopyroxene-bearing harzburgite is less refractory, as testifi ed by slightly higher TiO
2 (>0.05%), Al
2O
3 (3.5%), and REE contents.
The REE pattern (Fig. 9) is characterized by bulk REE enrichment (relative to the harzburgite) and
by LREE depletion with respect to heavy (H) REEs. The REE patterns of Dehshir depleted harzburgites (AZ06–40, G06–13) are similar to both Izu-Bonin-Mariana forearc (Pearce et al., 1992) and Thetford Mines ophiolite (Pagé et al., 2009) harzburgites (Fig. 9).
Cumulate Rocks
Cumulate rocks include plagioclase lherzo-lite, clinopyroxenite, pegmatite gabbro, and leucogabbro; the chemical compositions of these rocks are clearly related to their modal mineralogy. Plagioclase lherzolite (G06–20) is characterized by much higher contents of Al
2O
3
(8.7%) and CaO (9.4%), higher CaO/Al2O
3
(1.1), and lower Mg# (82.8) than expected for residual peridotites, and these values are con-sistent with a cumulate origin. Similarly, the clinopyroxenite has high concentrations of CaO (15.6%) and bulk REEs (Fig. 9) and low Mg# (85.7), consistent with a magmatic origin. The origin of mantle pyroxenite is controversial. The major processes that have been suggested for the occurrence of ophiolitic pyroxenite in-clude: in situ partial melting of host peridotite (e.g., Chen et al., 2001), interaction between melt and host peridotite (e.g., Garrido and Bodinier, 1999), and crystal segregation along magma conduits (Bodinier et al., 1987). Clino-pyroxenite is characterized by a LREE-depleted REE pattern, signifying that these rocks were neither affected by a metasomatic phase, nor do they represent simple partial melt of surround-ing peridotites, but they may be crystal mag-matic segregates (Fig. 9).
Leucogabbros cover a wide compositional range (Table 1), reflecting variable modal compositions due to their cumulate nature.
Mariana TroughIBM & S. Sd Forearc
Dehshir
Baft
Shahr-e-Babak
Nain
NeyrizOuter Belt
Inner Belt
80 90 1000
1
2
3
4
5
6
100Mg/(Mg+Fe)
Abyssal peridotite Forearc
peridotite
A
0 1 2 3 4 5 6 7
0
0.1
0.2
0.3
0.4
0.5
etitodirepcraeroF
Melt percolation
BA
TiO
2 (w
t%)
Al2O3 (wt%)
Al 2
O3
(wt%
)
Abyssalperid. (1)
Abyssalperid. (2)
OPX CPX
Figure 5. Composition of Dehshir ophiolite harzburgite pyroxenes. (A) Orthopyroxene Al2O3 versus Mg# composition diagram. Fields for abyssal peridotites (Johnson et al., 1990) and forearc peridotites (Ishii et al., 1992) are shown for comparison. (B) Clinopyroxene TiO2 against Al2O3 compositions for Dehshir harzburgites. Comparative fi elds are shown for abyssal peridotites (Abyssal peridotite 1, Hébert et al., 1990; Abyssal peridotite 2, Johnson et al., 1990) and forearc peridotites (Ishii et al., 1992). The long, thin arrow shows changes ex-pected for residual clinopyroxene due to progressive partial melting of peridotite. Short thick arrow shows compositional changes due to reequilibration of clinopyroxene with percolating melt. Izu-Bonin-Mariana (IBM) and South Sandwich forearc harzburgite data are from Parkinson and Pearce (1998) and Pearce et al. (2000), respectively; Mariana Trough mantle data are from Ohara et al. (2002).
TABLE 2. REPRESENTATIVE COMPOSITION OF OLIVINE PORPHYROCLASTS IN DEHSHIR PERIDOTITES
Sample: AZ06-40 AZ06-40 AZ06-40 DZ05-3 DZ05-3 G06-20 G06-2 G06-2 G06-2Rock type: harzb. harzb. harzb. cpx-harz. cpx-harz. plg. lherz plg. lherz plg. lherz plg. lherzSiO2 41.52 42.23 41.50 41.21 41.68 40.05 39.81 38.95 38.96TiO2 0.00 0.00 0.00 0.00 0.00 0.01 0.00 0.00 0.00Al2O3 0.00 0.00 0.00 0.00 0.00 0.02 0.00 0.01 0.02FeO 8.82 9.17 8.79 9.84 8.78 15.02 15.58 15.66 15.01MnO 0.16 0.02 0.09 0.05 0.15 0.20 0.15 0.24 0.21MgO 49.74 49.49 49.46 49.91 48.95 43.56 43.52 43.95 43.93CaO 0.04 0.02 0.00 0.04 0.03 0.02 0.03 0.05 0.01Na2O 0.01 0.04 0.09 0.06 0.07 0.02 0.01 0.00 0.00K2O 0.02 0.04 0.03 0.06 0.01 0.00 0.00 0.01 0.00NiO 0.44 0.23 0.42 0.32 0.37 0.21 0.22 0.22 0.20Cr2O3 0.00 0.00 0.00 0.01 0.00 0.02 0.00 0.00 0.02Total 100.76 101.25 100.38 101.49 100.05 99.10 99.31 99.10 98.34Si 1.00 1.00 1.00 1.00 1.00 1.00 1.00 1.00 1.00Al 0.00 0.00 0.00 0.00 0.00 0.00 0.00 0.00 0.00Ti 0.00 0.00 0.00 0.00 0.00 0.00 0.00 0.00 0.00Fe2 0.18 0.18 0.18 0.20 0.18 0.31 0.33 0.34 0.32Mn 0.00 0.00 0.00 0.00 0.00 0.00 0.00 0.01 0.01Mg 1.79 1.75 1.78 1.81 1.75 1.62 1.63 1.68 1.68Ca 0.00 0.00 0.00 0.00 0.00 0.00 0.00 0.00 0.00Na 0.00 0.00 0.00 0.00 0.00 0.00 0.00 0.00 0.00K 0.00 0.00 0.00 0.00 0.00 0.00 0.00 0.00 0.00Ni 0.01 0.00 0.01 0.01 0.01 0.00 0.00 0.01 0.00Cations 2.98 2.94 2.97 3.02 2.94 2.95 2.96 3.03 3.01Fa% 0.09 0.09 0.09 0.10 0.09 0.16 0.17 0.17 0.16Fo% 0.91 0.91 0.91 0.90 0.91 0.84 0.83 0.83 0.84
Note: Abbreviations: plg. lherz.—plagioclase lherzolite; harzb.—harzburgite; cpx-harz.—clinopyroxene-bearing harzburgite.

Shafaii Moghadam et al.
1526 Geological Society of America Bulletin, September/October 2010
TAB
LE 3
. RE
PR
ES
EN
TAT
IVE
CO
MP
OS
ITIO
N O
F P
YR
OX
EN
ES
(O
RT
HO
PY
RO
XE
NE
AN
D C
LIN
OP
YR
OX
EN
E)
IN D
EH
SH
IR P
ER
IDO
TIT
ES
Sam
ple:
AZ
06-4
0A
Z06
-40
AZ
06-4
0A
Z06
-40
AZ
06-4
0G
06-1
3G
06-1
3G
06-1
3G
06-1
3G
06-1
3G
06-1
3G
06-1
3G
06-1
3G
06-1
3G
06-1
3D
Z05
-3D
Z05
-3D
Z05
-3R
ock
type
:ha
rzb.
harz
b.ha
rzb.
harz
b.ha
rzb.
harz
b.ha
rzb.
harz
b.ha
rzb.
harz
b.ha
rzb.
harz
b.ha
rzb.
harz
b.ha
rzb.
cpx-
harz
.cp
x-ha
rz.
cpx-
harz
.S
iO2
55.8
356
.79
57.1
156
.96
56.8
755
.79
55.6
655
.73
56.7
656
.55
56.5
457
.06
56.7
453
.45
56.4
855
.33
52.7
256
.48
TiO
20.
000.
030.
010.
000.
040.
000.
000.
010.
030.
090.
000.
000.
000.
070.
000.
030.
070.
00A
l 2O3
1.19
1.25
1.16
1.20
1.18
1.20
1.12
1.14
1.07
1.15
1.11
1.14
1.19
1.57
1.13
1.13
1.54
1.41
FeO
8.78
9.09
8.94
8.82
9.42
8.95
8.87
9.20
8.62
8.55
8.80
8.84
8.92
5.06
9.32
9.29
2.28
6.30
Cr 2
O3
0.37
0.26
0.35
0.22
0.32
0.32
0.21
0.30
0.38
0.33
0.22
0.30
0.26
0.61
0.38
0.26
0.68
0.47
MnO
0.24
0.16
0.13
0.13
0.33
0.23
0.11
0.17
0.14
0.40
0.25
0.21
0.22
0.05
0.12
0.22
0.11
0.16
NiO
0.00
0.16
0.00
0.06
0.05
0.05
0.08
0.18
0.00
0.08
0.08
0.11
0.04
0.14
0.05
0.12
0.01
0.07
MgO
31.8
231
.86
32.0
531
.79
31.5
631
.75
32.3
831
.36
31.5
731
.98
31.8
431
.75
31.6
018
.58
31.5
831
.24
17.9
834
.16
CaO
1.40
1.28
1.30
1.44
1.43
1.25
0.90
1.39
1.46
1.43
1.38
1.38
1.36
20.0
71.
361.
2723
.14
1.23
Na 2
O0.
040.
100.
090.
120.
020.
110.
050.
130.
000.
050.
050.
020.
040.
150.
040.
130.
170.
03K
2O
0.07
0.00
0.03
0.03
0.03
0.04
0.03
0.02
0.00
0.00
0.02
0.00
0.01
0.04
0.02
0.06
0.00
0.05
Tota
l99
.75
100.
9710
1.16
100.
7610
1.25
99.6
999
.41
99.6
410
0.03
100.
6210
0.29
100.
8110
0.37
99.7
910
0.48
99.0
898
.70
100.
36T
Si
1.96
1.97
1.97
1.98
1.97
1.96
1.95
1.96
1.99
1.97
1.97
1.98
1.98
1.95
1.97
1.96
1.93
1.94
TAl
0.04
0.03
0.03
0.02
0.03
0.04
0.05
0.04
0.01
0.04
0.03
0.02
0.02
0.05
0.03
0.05
0.07
0.06
TF
e30.
000.
000.
000.
000.
000.
000.
000.
000.
000.
000.
000.
000.
000.
000.
000.
000.
000.
00M
1Al
0.01
0.02
0.02
0.03
0.02
0.01
0.00
0.01
0.03
0.01
0.02
0.03
0.03
0.02
0.02
0.00
0.00
0.00
M1T
i0.
000.
000.
000.
000.
000.
000.
000.
000.
000.
000.
000.
000.
000.
000.
000.
000.
000.
00M
1Fe3
0.03
0.01
0.00
0.00
0.00
0.04
0.05
0.04
0.00
0.01
0.01
0.00
0.00
0.03
0.01
0.05
0.05
0.05
M1F
e20.
000.
000.
000.
000.
000.
000.
000.
000.
000.
000.
000.
000.
000.
000.
000.
000.
000.
00M
1Cr
0.01
0.01
0.01
0.01
0.01
0.01
0.01
0.01
0.01
0.01
0.01
0.01
0.01
0.02
0.01
0.01
0.02
0.01
M1M
g0.
950.
960.
970.
970.
970.
950.
950.
940.
960.
960.
970.
960.
960.
930.
970.
940.
920.
94M
1Ni
0.00
0.00
0.00
0.00
0.00
0.00
0.00
0.01
0.00
0.00
0.00
0.00
0.00
0.00
0.00
0.00
0.00
0.00
M2M
g0.
710.
690.
690.
680.
660.
710.
750.
700.
690.
700.
690.
680.
680.
080.
680.
710.
060.
82M
2Fe2
0.22
0.25
0.26
0.25
0.27
0.22
0.21
0.23
0.25
0.24
0.25
0.26
0.26
0.13
0.27
0.23
0.02
0.13
M2M
n0.
010.
010.
000.
000.
010.
010.
000.
010.
000.
010.
010.
010.
010.
000.
000.
010.
000.
01M
2Ca
0.05
0.05
0.05
0.05
0.05
0.05
0.03
0.05
0.06
0.05
0.05
0.05
0.05
0.78
0.05
0.05
0.91
0.05
M2N
a0.
000.
010.
010.
010.
000.
010.
000.
010.
000.
000.
000.
000.
000.
010.
000.
010.
010.
00M
2K0.
000.
000.
000.
000.
000.
000.
000.
000.
000.
000.
000.
000.
000.
000.
000.
000.
000.
00S
um_c
at4.
004.
004.
004.
004.
004.
004.
004.
004.
004.
004.
004.
004.
004.
004.
004.
004.
004.
00W
O2.
662.
422.
462.
732.
692.
381.
702.
662.
802.
702.
612.
632.
5940
.21
2.58
2.44
46.2
62.
29E
N83
.98
83.9
284
.18
84.0
182
.93
83.9
885
.06
83.3
684
.11
84.0
983
.99
83.9
583
.81
51.8
083
.43
83.3
350
.01
88.3
4F
S13
.36
13.6
613
.36
13.2
614
.38
13.6
313
.24
13.9
913
.10
13.2
113
.40
13.4
313
.60
7.99
13.9
914
.24
3.73
9.38
Min
eral
Opx
Opx
Opx
Opx
Opx
Opx
Opx
Opx
Opx
Opx
Opx
Opx
Opx
Cpx
Opx
Opx
Cpx
Opx
( con
tinue
d)

The Dehshir ophiolite
Geological Society of America Bulletin, September/October 2010 1527
TAB
LE 3
. RE
PR
ES
EN
TAT
IVE
CO
MP
OS
ITIO
N O
F P
YR
OX
EN
ES
(O
RT
HO
PY
RO
XE
NE
AN
D C
LIN
OP
YR
OX
EN
E)
IN D
EH
SH
IR P
ER
IDO
TIT
ES
(con
tinue
d)
Sam
ple:
DZ
05-3
DZ
05-3
DZ
05-3
DZ
05-3
DZ
05-3
DZ
05-3
DZ
05-3
DZ
05-3
AZ
06-2
6A
Z06
-26
AZ
06-2
6A
Z06
-26
AZ
06-2
6A
Z06
-26
AZ
06-2
6A
Z06
-26
AZ
06-2
6A
Z06
-26
Roc
k ty
pe:
cpx-
harz
.cp
x-ha
rz.
cpx-
harz
.cp
x-ha
rz.
cpx-
harz
.cp
x-ha
rz.
cpx-
harz
.cp
x-ha
rz.
cpx-
harz
.cp
x-ha
rz.
cpx-
harz
.cp
x-ha
rz.
cpx-
harz
.cp
x-ha
rz.
cpx-
harz
.cp
x-ha
rz.
cpx-
harz
.cp
x-ha
rz.
SiO
256
.64
53.5
656
.19
56.8
456
.42
56.4
653
.60
53.4
556
.79
56.4
855
.83
56.7
756
.01
56.0
256
.60
56.2
956
.20
51.7
6Ti
O2
0.00
0.03
0.07
0.00
0.00
0.04
0.01
0.11
0.00
0.05
0.06
0.06
0.05
0.00
0.00
0.06
0.03
0.05
Al 2O
31.
261.
511.
310.
820.
580.
660.
870.
950.
690.
661.
180.
750.
720.
750.
730.
660.
850.
12F
eO6.
402.
565.
828.
517.
368.
253.
593.
108.
298.
629.
347.
567.
208.
357.
287.
337.
356.
73C
r 2O
30.
400.
760.
330.
180.
350.
230.
670.
790.
350.
360.
390.
360.
370.
320.
330.
300.
350.
00M
nO0.
150.
240.
140.
080.
190.
250.
210.
180.
160.
240.
420.
000.
230.
240.
390.
080.
190.
39N
iO0.
210.
060.
250.
160.
010.
020.
000.
000.
130.
060.
120.
000.
160.
060.
000.
000.
290.
00M
gO33
.94
17.5
633
.66
32.9
432
.64
32.8
517
.98
17.4
433
.11
32.7
031
.37
33.1
232
.88
32.4
932
.02
31.4
232
.19
14.6
3C
aO0.
9823
.20
1.16
1.22
1.25
1.22
22.0
722
.88
1.36
1.37
1.50
1.28
1.23
1.23
1.22
2.23
1.15
24.7
5N
a 2O
0.09
0.25
0.10
0.13
0.10
0.09
0.21
0.23
0.06
0.00
0.04
0.04
0.04
0.12
0.20
0.13
0.17
0.07
K2O
0.04
0.04
0.00
0.00
0.00
0.01
0.00
0.05
0.00
0.00
0.01
0.03
0.03
0.02
0.06
0.03
0.00
0.01
Tota
l10
0.11
99.7
799
.03
100.
8898
.90
100.
0899
.21
99.1
810
0.94
100.
5410
0.26
99.9
798
.94
99.6
098
.83
98.5
598
.77
98.5
0T
Si
1.95
1.95
1.96
1.96
1.98
1.96
1.96
1.96
1.96
1.96
1.95
1.97
1.97
1.96
1.99
1.99
1.98
1.95
TAl
0.05
0.05
0.04
0.03
0.02
0.03
0.04
0.04
0.03
0.03
0.05
0.03
0.03
0.03
0.01
0.01
0.02
0.01
TF
e30.
000.
000.
000.
010.
000.
010.
000.
000.
010.
010.
000.
000.
010.
010.
000.
000.
000.
05M
1Al
0.01
0.01
0.01
0.00
0.01
0.00
0.00
0.00
0.00
0.00
0.00
0.00
0.00
0.00
0.02
0.02
0.01
0.00
M1T
i0.
000.
000.
000.
000.
000.
000.
000.
000.
000.
000.
000.
000.
000.
000.
000.
000.
000.
00M
1Fe3
0.04
0.03
0.03
0.04
0.01
0.04
0.03
0.03
0.04
0.03
0.03
0.02
0.03
0.04
0.00
0.00
0.01
0.06
M1F
e20.
000.
000.
000.
000.
000.
000.
000.
000.
000.
000.
000.
000.
000.
000.
000.
000.
000.
11M
1Cr
0.01
0.02
0.01
0.01
0.01
0.01
0.02
0.02
0.01
0.01
0.01
0.01
0.01
0.01
0.01
0.01
0.01
0.00
M1M
g0.
940.
930.
950.
950.
970.
960.
950.
950.
950.
960.
950.
970.
960.
950.
970.
970.
960.
82M
1Ni
0.01
0.00
0.01
0.00
0.00
0.00
0.00
0.00
0.00
0.00
0.00
0.00
0.01
0.00
0.00
0.00
0.01
0.00
M2M
g0.
810.
020.
800.
750.
730.
750.
030.
010.
750.
730.
690.
750.
760.
750.
710.
690.
730.
00M
2Fe2
0.15
0.05
0.14
0.20
0.21
0.20
0.08
0.07
0.19
0.21
0.24
0.20
0.18
0.19
0.21
0.22
0.21
0.00
M2M
n0.
000.
010.
000.
000.
010.
010.
010.
010.
010.
010.
010.
000.
010.
010.
010.
000.
010.
01M
2Ca
0.04
0.91
0.04
0.05
0.05
0.05
0.87
0.90
0.05
0.05
0.06
0.05
0.05
0.05
0.05
0.08
0.04
1.00
M2N
a0.
010.
020.
010.
010.
010.
010.
020.
020.
000.
000.
000.
000.
000.
010.
010.
010.
010.
01M
2K0.
000.
000.
000.
000.
000.
000.
000.
000.
000.
000.
000.
000.
000.
000.
000.
000.
000.
00S
um_c
at4.
004.
004.
004.
004.
004.
004.
004.
004.
004.
004.
004.
004.
004.
004.
004.
004.
004.
00W
O1.
8446
.57
2.20
2.27
2.38
2.28
44.0
946
.03
2.52
2.55
2.84
2.40
2.34
2.31
2.36
4.30
2.23
48.8
5E
N88
.57
49.0
488
.96
85.2
686
.41
85.3
349
.98
48.8
285
.27
84.5
982
.71
86.5
286
.67
85.0
686
.07
84.5
186
.41
40.1
8F
S9.
594.
398.
8412
.47
11.2
212
.39
5.93
5.15
12.2
112
.86
14.4
411
.08
10.9
912
.62
11.5
711
.19
11.3
610
.97
Min
eral
Opx
Cpx
Opx
Opx
Opx
Opx
Cpx
Cpx
Opx
Opx
Opx
Opx
Opx
Opx
Opx
Opx
Opx
Cpx
(con
tinue
d)
Shafaii Moghadam et al.
1528 Geological Society of America Bulletin, September/October 2010
TAB
LE 3
. RE
PR
ES
EN
TAT
IVE
CO
MP
OS
ITIO
N O
F P
YR
OX
EN
ES
(O
RT
HO
PY
RO
XE
NE
AN
D C
LIN
OP
YR
OX
EN
E)
IN D
EH
SH
IR P
ER
IDO
TIT
ES
(con
tinue
d)
Sam
ple:
AZ
06-2
6D
A-2
4D
A-2
4D
A-2
4D
A-2
4D
A-2
4D
A-2
4D
A-2
4D
A-2
4D
A-2
4D
A-2
4D
A-2
4D
A-2
1D
A-2
1D
A-2
1D
A-2
1D
A-2
1D
A-2
1R
ock
type
:cx
p-ha
rz.
harz
b.ha
rzb.
harz
b.ha
rzb.
harz
b.ha
rzb.
harz
b.ha
rzb.
harz
b.ha
rzb.
harz
b.ha
rzb.
harz
b.ha
rzb.
harz
b.ha
rzb.
harz
b.S
iO2
51.2
755
.22
56.3
355
.21
50.6
250
.77
54.5
956
.54
55.4
855
.96
55.1
655
.88
50.0
551
.51
52.3
654
.84
55.9
255
.09
TiO
20.
000.
010.
000.
000.
000.
010.
090.
000.
040.
030.
000.
000.
000.
010.
020.
050.
020.
03A
l 2O3
0.03
0.65
0.69
0.60
0.86
0.80
0.66
0.84
0.67
0.64
0.65
0.67
0.84
0.81
0.54
0.67
0.73
0.66
FeO
7.33
7.38
7.32
7.47
4.01
3.94
7.48
8.92
7.06
7.46
7.92
6.97
3.84
3.36
7.12
7.48
7.28
7.16
Cr 2
O3
0.00
0.37
0.36
0.41
0.61
0.55
0.34
0.31
0.31
0.30
0.20
0.30
0.62
0.63
0.28
0.26
0.35
0.43
MnO
0.38
0.23
0.38
0.26
0.12
0.18
0.08
0.22
0.07
0.05
0.23
0.12
0.07
0.25
0.16
0.20
0.20
0.03
NiO
0.03
0.00
0.00
0.16
0.00
0.00
0.00
0.06
0.00
0.06
0.14
0.09
0.06
0.04
0.17
0.02
0.00
0.00
MgO
14.5
033
.92
32.0
632
.49
17.1
817
.93
33.9
233
.47
33.1
533
.60
33.0
133
.23
18.9
518
.73
28.0
333
.69
34.1
333
.69
CaO
24.7
61.
121.
131.
5624
.55
23.9
11.
400.
781.
261.
511.
401.
4423
.35
23.2
79.
771.
551.
361.
38N
a 2O
0.17
0.03
0.02
0.04
0.23
0.21
0.07
0.02
0.02
0.06
0.04
0.01
0.23
0.27
0.06
0.02
0.09
0.03
K2O
0.03
0.04
0.01
0.00
0.01
0.03
0.00
0.00
0.01
0.01
0.00
0.00
0.01
0.00
0.02
0.01
0.06
0.00
Tota
l98
.49
98.9
798
.29
98.2
298
.18
98.3
298
.63
101.
1698
.07
99.6
998
.75
98.7
398
.02
98.8
898
.52
98.7
910
0.15
98.4
9T
Si
1.93
1.93
2.00
1.95
1.88
1.87
1.91
1.95
1.96
1.94
1.94
1.96
1.84
1.88
1.87
1.92
1.93
1.93
TAl
0.00
0.03
0.00
0.03
0.04
0.04
0.03
0.03
0.03
0.03
0.03
0.03
0.04
0.04
0.02
0.03
0.03
0.03
TF
e30.
070.
050.
000.
020.
000.
000.
060.
020.
010.
030.
030.
010.
000.
000.
000.
050.
040.
04M
1Al
0.00
0.00
0.02
0.00
0.00
0.00
0.00
0.00
0.00
0.00
0.00
0.00
0.00
0.00
0.00
0.00
0.00
0.00
M1T
i0.
000.
000.
000.
000.
000.
000.
000.
000.
000.
000.
000.
000.
000.
000.
000.
000.
000.
00M
1Fe3
0.08
0.06
0.00
0.04
0.00
0.00
0.08
0.05
0.03
0.05
0.06
0.03
0.00
0.00
0.00
0.07
0.07
0.06
M1F
e20.
080.
000.
000.
000.
030.
000.
000.
000.
000.
000.
000.
000.
000.
000.
000.
000.
000.
00M
1Cr
0.00
0.01
0.01
0.01
0.02
0.02
0.01
0.01
0.01
0.01
0.01
0.01
0.02
0.02
0.01
0.01
0.01
0.01
M1M
g0.
810.
930.
970.
950.
950.
980.
910.
940.
960.
940.
930.
960.
980.
980.
990.
920.
920.
93M
1Ni
0.00
0.00
0.00
0.01
0.00
0.00
0.00
0.00
0.00
0.00
0.00
0.00
0.00
0.00
0.01
0.00
0.00
0.00
M2M
g0.
000.
840.
730.
770.
000.
000.
860.
770.
790.
800.
800.
780.
060.
040.
510.
840.
830.
83M
2Fe2
0.00
0.11
0.22
0.16
0.09
0.12
0.08
0.19
0.16
0.14
0.14
0.16
0.12
0.10
0.21
0.10
0.10
0.12
M2M
n0.
010.
010.
010.
010.
000.
010.
000.
010.
000.
000.
010.
000.
000.
010.
010.
010.
010.
00M
2Ca
1.00
0.04
0.04
0.06
0.98
0.95
0.05
0.03
0.05
0.06
0.05
0.05
0.92
0.91
0.37
0.06
0.05
0.05
M2N
a0.
010.
000.
000.
000.
020.
020.
010.
000.
000.
000.
000.
000.
020.
020.
000.
000.
010.
00M
2K0.
000.
000.
000.
000.
000.
000.
000.
000.
000.
000.
000.
000.
000.
000.
000.
000.
000.
00S
um_c
at4.
004.
004.
004.
004.
004.
004.
004.
004.
004.
004.
004.
004.
004.
004.
004.
004.
004.
00W
O48
.60
2.07
2.19
2.96
47.5
045
.92
2.57
1.43
2.38
2.79
2.61
2.71
44.2
644
.62
17.9
42.
842.
492.
56E
N39
.58
86.9
886
.19
85.6
146
.26
47.9
186
.61
85.4
787
.11
86.3
785
.53
86.8
849
.96
49.9
671
.62
86.1
586
.82
87.0
3F
S11
.81
10.9
511
.62
11.4
36.
246.
1710
.82
13.1
010
.51
10.8
411
.86
10.4
15.
785.
4110
.44
11.0
110
.68
10.4
1M
iner
alC
pxO
pxO
pxO
pxC
pxC
pxO
pxO
pxO
pxO
pxO
pxO
pxC
pxC
pxP
igeo
nite
Opx
Opx
Opx
( con
tinue
d)

The Dehshir ophiolite
Geological Society of America Bulletin, September/October 2010 1529
TAB
LE 3
. RE
PR
ES
EN
TAT
IVE
CO
MP
OS
ITIO
N O
F P
YR
OX
EN
ES
(O
RT
HO
PY
RO
XE
NE
AN
D C
LIN
OP
YR
OX
EN
E)
IN D
EH
SH
IR P
ER
IDO
TIT
ES
(con
tinue
d)
Sam
ple:
DA
-21
DA
-21
DA
-21
DA
-21
DA
-21
DA
-7D
A-7
DA
-7D
A-7
DA
-7D
A-7
DA
-7D
A-7
DA
-7D
A-7
DA
-7D
A-7
Roc
k ty
pe:
harz
b.ha
rzb.
harz
b.ha
rzb.
harz
b.ha
rzb.
harz
b.ha
rzb.
harz
b.ha
rzb.
harz
b.ha
rzb.
harz
b.ha
rzb.
harz
b.ha
rzb.
harz
b.S
iO2
56.4
854
.76
55.4
854
.33
55.1
055
.00
54.8
155
.25
53.4
255
.22
54.4
354
.82
54.7
054
.49
53.6
653
.73
54.0
8Ti
O2
0.03
0.00
0.05
0.06
0.02
0.00
0.01
0.00
0.04
0.00
0.01
0.03
0.03
0.00
0.02
0.03
0.00
Al 2O
30.
490.
640.
640.
630.
590.
640.
560.
670.
660.
580.
630.
620.
570.
600.
740.
620.
92F
eO6.
927.
147.
407.
266.
977.
747.
427.
296.
887.
096.
937.
217.
237.
187.
577.
463.
44C
r 2O
30.
150.
330.
300.
400.
210.
400.
300.
230.
410.
320.
290.
250.
340.
310.
340.
250.
69M
nO0.
160.
110.
260.
330.
210.
220.
230.
180.
200.
100.
230.
200.
150.
190.
000.
190.
12N
iO0.
030.
000.
090.
070.
060.
000.
000.
000.
160.
090.
170.
000.
260.
000.
080.
020.
00M
gO34
.01
34.0
033
.18
34.0
034
.05
32.6
633
.74
33.2
434
.76
34.1
734
.10
33.6
333
.37
34.3
135
.13
33.9
318
.17
CaO
0.83
1.34
1.35
1.43
1.43
1.57
1.33
1.42
1.41
1.32
1.49
1.50
1.30
1.16
1.04
1.78
21.5
2N
a 2O
0.01
0.00
0.00
0.06
0.05
0.05
0.06
0.02
0.05
0.04
0.02
0.05
0.03
0.05
0.02
0.08
0.29
K2O
0.00
0.00
0.00
0.00
0.00
0.00
0.04
0.01
0.00
0.00
0.01
0.00
0.02
0.00
0.01
0.05
0.08
Tota
l99
.11
98.3
198
.75
98.5
698
.69
98.2
798
.49
98.3
198
.00
98.9
398
.32
98.3
198
.01
98.2
798
.61
98.1
399
.31
TS
i1.
971.
921.
951.
901.
931.
941.
921.
951.
871.
931.
911.
931.
931.
911.
871.
891.
98TA
l0.
020.
030.
030.
030.
020.
030.
020.
030.
030.
020.
030.
030.
020.
030.
030.
030.
02T
Fe3
0.01
0.05
0.03
0.07
0.05
0.03
0.05
0.03
0.00
0.05
0.07
0.05
0.05
0.07
0.10
0.09
0.00
M1A
l0.
000.
000.
000.
000.
000.
000.
000.
000.
000.
000.
000.
000.
000.
000.
000.
000.
02M
1Ti
0.00
0.00
0.00
0.00
0.00
0.00
0.00
0.00
0.00
0.00
0.00
0.00
0.00
0.00
0.00
0.00
0.00
M1F
e30.
030.
070.
040.
090.
070.
050.
070.
050.
000.
070.
080.
070.
060.
080.
120.
110.
01M
1Fe2
0.00
0.00
0.00
0.00
0.00
0.00
0.00
0.00
0.00
0.00
0.00
0.00
0.00
0.00
0.00
0.00
0.00
M1C
r0.
000.
010.
010.
010.
010.
010.
010.
010.
010.
010.
010.
010.
010.
010.
010.
010.
02M
1Mg
0.97
0.92
0.95
0.90
0.92
0.94
0.92
0.94
0.98
0.92
0.90
0.92
0.92
0.91
0.87
0.88
0.95
M1N
i0.
000.
000.
000.
000.
000.
000.
000.
000.
010.
000.
010.
000.
010.
000.
000.
000.
00M
2Mg
0.80
0.86
0.79
0.88
0.85
0.78
0.85
0.80
0.84
0.86
0.88
0.84
0.84
0.89
0.96
0.90
0.04
M2F
e20.
160.
090.
150.
060.
080.
150.
090.
140.
200.
090.
060.
100.
110.
060.
000.
020.
09M
2Mn
0.01
0.00
0.01
0.01
0.01
0.01
0.01
0.01
0.01
0.00
0.01
0.01
0.01
0.01
0.00
0.01
0.00
M2C
a0.
030.
050.
050.
050.
050.
060.
050.
050.
050.
050.
060.
060.
050.
040.
040.
070.
84M
2Na
0.00
0.00
0.00
0.00
0.00
0.00
0.00
0.00
0.00
0.00
0.00
0.00
0.00
0.00
0.00
0.01
0.02
M2K
0.00
0.00
0.00
0.00
0.00
0.00
0.00
0.00
0.00
0.00
0.00
0.00
0.00
0.00
0.00
0.00
0.00
Sum
_cat
4.00
4.00
4.00
4.00
4.00
4.00
4.00
4.00
4.00
4.00
4.00
4.00
4.00
4.00
4.00
4.00
4.00
WO
1.55
2.46
2.53
2.62
2.62
2.94
2.46
2.65
2.55
2.43
2.74
2.77
2.43
2.12
1.87
3.24
43.4
0E
N88
.16
87.1
286
.29
86.5
487
.07
85.3
986
.54
86.4
587
.45
87.2
787
.01
86.5
386
.79
87.3
687
.55
85.8
950
.99
FS
10.3
010
.42
11.1
810
.84
10.3
111
.67
11.0
010
.90
10.0
010
.30
10.2
510
.71
10.7
710
.53
10.5
810
.87
5.61
Min
eral
Opx
Opx
Opx
Opx
Opx
Opx
Opx
Opx
Opx
Opx
Opx
Opx
Opx
Opx
Opx
Opx
Cpx
Not
e: A
bbre
viat
ions
are
as
follo
ws:
har
zb.—
harz
burg
ite; c
px-h
arz.
—cl
inop
yrox
ene-
bear
ing
harz
burg
ite; o
px—
orth
opyr
oxen
e.
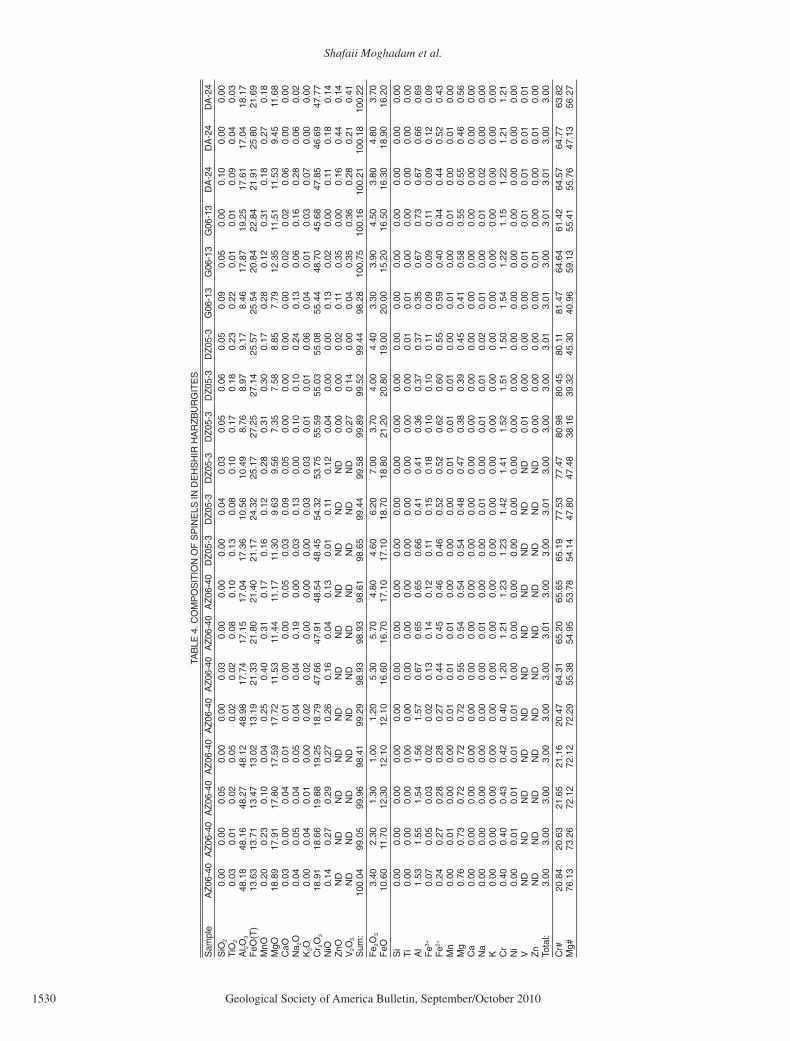
Shafaii Moghadam et al.
1530 Geological Society of America Bulletin, September/October 2010
TAB
LE 4
. CO
MP
OS
ITIO
N O
F S
PIN
ELS
IN D
EH
SH
IR H
AR
ZB
UR
GIT
ES
Sam
ple
AZ
06-4
0A
Z06
-40
AZ
06-4
0A
Z06
-40
AZ
06-4
0A
Z06
-40
AZ
06-4
0A
Z06
-40
DZ
05-3
DZ
05-3
DZ
05-3
DZ
05-3
DZ
05-3
DZ
05-3
G06
-13
G06
-13
G06
-13
DA
-24
DA
-24
DA
-24
SiO
20.
000.
000.
050.
000.
000.
030.
000.
000.
000.
040.
030.
050.
060.
050.
090.
050.
000.
100.
000.
00Ti
O2
0.03
0.01
0.02
0.05
0.02
0.02
0.08
0.10
0.13
0.08
0.10
0.17
0.18
0.23
0.22
0.01
0.01
0.09
0.04
0.03
Al 2O
348
.18
48.1
648
.27
48.1
248
.98
17.7
417
.15
17.0
417
.36
10.5
610
.49
8.76
8.97
9.17
8.46
17.8
719
.25
17.6
117
.04
18.1
7F
eO(T
)13
.63
13.7
113
.47
13.0
213
.19
21.3
321
.80
21.4
021
.17
24.3
225
.17
27.2
527
.14
25.5
725
.54
20.8
422
.84
21.9
125
.80
21.6
9M
nO0.
200.
230.
100.
040.
250.
400.
310.
170.
160.
120.
280.
310.
300.
170.
280.
120.
310.
180.
270.
18M
gO18
.89
17.9
117
.80
17.5
917
.72
11.5
311
.44
11.1
711
.30
9.63
9.56
7.35
7.58
8.85
7.79
12.3
511
.51
11.5
39.
4511
.68
CaO
0.03
0.00
0.04
0.01
0.01
0.00
0.00
0.05
0.03
0.09
0.05
0.00
0.00
0.00
0.00
0.02
0.02
0.06
0.00
0.00
Na 2
O0.
040.
050.
040.
050.
040.
040.
190.
000.
030.
130.
000.
100.
100.
240.
130.
060.
160.
280.
060.
02K
2O
0.00
0.04
0.01
0.00
0.02
0.02
0.00
0.00
0.00
0.03
0.03
0.01
0.01
0.06
0.04
0.01
0.03
0.07
0.00
0.00
Cr 2
O3
18.9
118
.66
19.8
819
.25
18.7
947
.66
47.9
148
.54
48.4
554
.32
53.7
555
.59
55.0
355
.08
55.4
448
.70
45.6
847
.85
46.6
947
.77
NiO
0.14
0.27
0.29
0.27
0.26
0.16
0.04
0.13
0.01
0.11
0.12
0.04
0.00
0.00
0.13
0.02
0.00
0.11
0.18
0.14
ZnO
ND
ND
ND
ND
ND
ND
ND
ND
ND
ND
ND
0.00
0.00
0.02
0.11
0.35
0.00
0.16
0.44
0.14
V2O
5N
DN
DN
DN
DN
DN
DN
DN
DN
DN
DN
D0.
270.
140.
000.
040.
350.
360.
280.
210.
41S
um:
100.
0499
.05
99.9
698
.41
99.2
998
.93
98.9
398
.61
98.6
599
.44
99.5
899
.89
99.5
299
.44
98.2
810
0.75
100.
1610
0.21
100.
1810
0.22
Fe 2
O3
3.40
2.30
1.30
1.00
1.20
5.30
5.70
4.80
4.60
6.20
7.00
3.70
4.00
4.40
3.30
3.90
4.50
3.80
4.80
3.70
FeO
10
.60
11.7
012
.30
12.1
012
.10
16.6
016
.70
17.1
017
.10
18.7
018
.80
21.2
020
.80
19.0
020
.00
15.2
016
.50
16.3
018
.90
16.2
0S
i0.
000.
000.
000.
000.
000.
000.
000.
000.
000.
000.
000.
000.
000.
000.
000.
000.
000.
000.
000.
00Ti
0.00
0.00
0.00
0.00
0.00
0.00
0.00
0.00
0.00
0.00
0.00
0.00
0.00
0.01
0.01
0.00
0.00
0.00
0.00
0.00
Al
1.53
1.55
1.54
1.56
1.57
0.67
0.65
0.65
0.66
0.41
0.41
0.36
0.37
0.37
0.35
0.67
0.73
0.67
0.66
0.69
Fe3+
0.07
0.05
0.03
0.02
0.02
0.13
0.14
0.12
0.11
0.15
0.18
0.10
0.10
0.11
0.09
0.09
0.11
0.09
0.12
0.09
Fe2+
0.24
0.27
0.28
0.28
0.27
0.44
0.45
0.46
0.46
0.52
0.52
0.62
0.60
0.55
0.59
0.40
0.44
0.44
0.52
0.43
Mn
0.00
0.01
0.00
0.00
0.01
0.01
0.01
0.00
0.00
0.00
0.01
0.01
0.01
0.00
0.01
0.00
0.01
0.00
0.01
0.00
Mg
0.76
0.73
0.72
0.72
0.72
0.55
0.54
0.54
0.54
0.48
0.47
0.38
0.39
0.45
0.41
0.58
0.55
0.55
0.46
0.56
Ca
0.00
0.00
0.00
0.00
0.00
0.00
0.00
0.00
0.00
0.00
0.00
0.00
0.00
0.00
0.00
0.00
0.00
0.00
0.00
0.00
Na
0.00
0.00
0.00
0.00
0.00
0.00
0.01
0.00
0.00
0.01
0.00
0.01
0.01
0.02
0.01
0.00
0.01
0.02
0.00
0.00
K0.
000.
000.
000.
000.
000.
000.
000.
000.
000.
000.
000.
000.
000.
000.
000.
000.
000.
000.
000.
00C
r0.
400.
400.
430.
420.
401.
201.
211.
231.
231.
421.
411.
521.
511.
501.
541.
221.
151.
221.
211.
21N
i0.
000.
010.
010.
010.
010.
000.
000.
000.
000.
000.
000.
000.
000.
000.
000.
000.
000.
000.
000.
00V
N
DN
DN
DN
DN
DN
DN
DN
DN
DN
DN
D0.
010.
000.
000.
000.
010.
010.
010.
010.
01Z
n N
DN
DN
DN
DN
DN
DN
DN
DN
DN
DN
D0.
000.
000.
000.
000.
010.
000.
000.
010.
00To
tal:
3.00
3.00
3.00
3.00
3.00
3.00
3.01
3.00
3.00
3.01
3.00
3.00
3.00
3.01
3.01
3.00
3.01
3.01
3.00
3.00
Cr#
20.8
420
.63
21.6
521
.16
20.4
764
.31
65.2
065
.65
65.1
977
.53
77.4
780
.98
80.4
580
.11
81.4
764
.64
61.4
264
.57
64.7
763
.82
Mg#
76.1
373
.26
72.1
272
.12
72.2
955
.38
54.9
553
.78
54.1
447
.80
47.4
838
.16
39.3
245
.30
40.9
659
.13
55.4
155
.76
47.1
356
.27
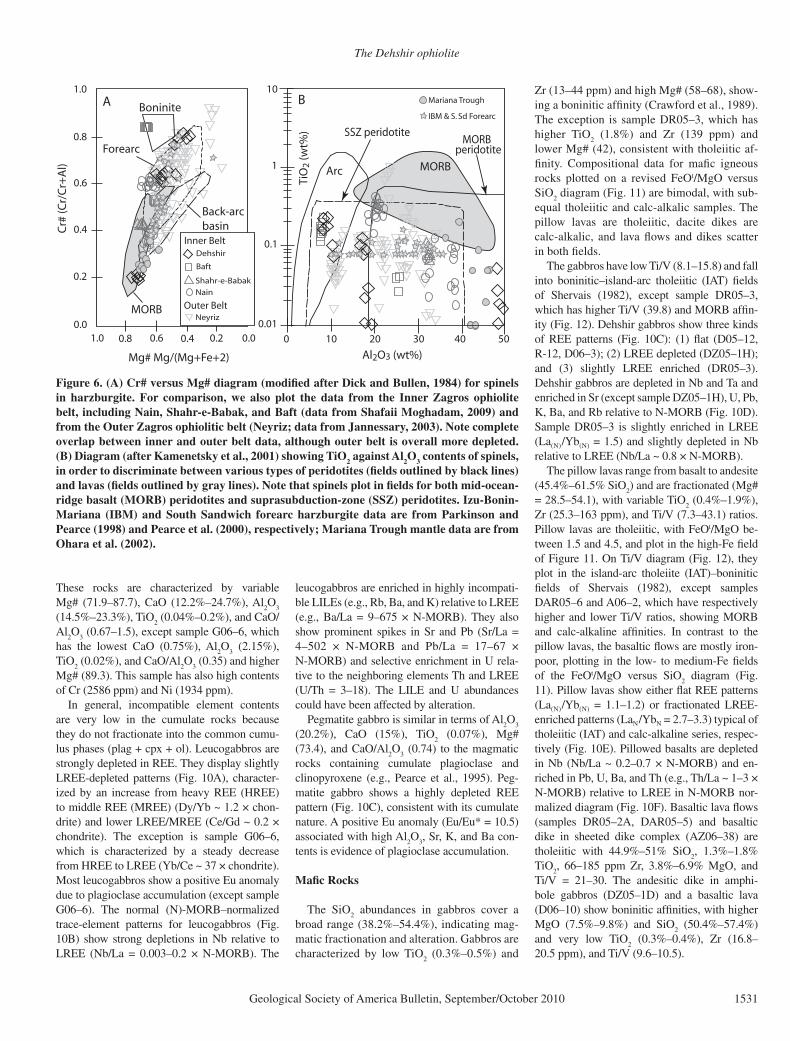
The Dehshir ophiolite
Geological Society of America Bulletin, September/October 2010 1531
These rocks are characterized by variable Mg# (71.9–87.7), CaO (12.2%–24.7%), Al
2O
3
(14.5%–23.3%), TiO2 (0.04%–0.2%), and CaO/
Al2O
3 (0.67–1.5), except sample G06–6, which
has the lowest CaO (0.75%), Al2O
3 (2.15%),
TiO2 (0.02%), and CaO/Al
2O
3 (0.35) and higher
Mg# (89.3). This sample has also high contents of Cr (2586 ppm) and Ni (1934 ppm).
In general, incompatible element contents are very low in the cumulate rocks because they do not fractionate into the common cumu-lus phases (plag + cpx + ol). Leucogabbros are strongly depleted in REE. They display slightly LREE-depleted patterns (Fig. 10A), character-ized by an increase from heavy REE (HREE) to middle REE (MREE) (Dy/Yb ~ 1.2 × chon-drite) and lower LREE/MREE (Ce/Gd ~ 0.2 × chondrite). The exception is sample G06–6, which is characterized by a steady decrease from HREE to LREE (Yb/Ce ~ 37 × chondrite). Most leuco gabbros show a positive Eu anomaly due to plagio clase accumulation (except sample G06–6). The normal (N)-MORB–normalized trace-element patterns for leucogabbros (Fig. 10B) show strong depletions in Nb relative to LREE (Nb/La = 0.003–0.2 × N-MORB). The
leucogabbros are enriched in highly incompati-ble LILEs (e.g., Rb, Ba, and K) relative to LREE (e.g., Ba/La = 9–675 × N-MORB). They also show prominent spikes in Sr and Pb (Sr/La = 4–502 × N-MORB and Pb/La = 17–67 × N-MORB) and selective enrichment in U rela-tive to the neighboring elements Th and LREE (U/Th = 3–18). The LILE and U abundances could have been affected by alteration.
Pegmatite gabbro is similar in terms of Al2O
3
(20.2%), CaO (15%), TiO2 (0.07%), Mg#
(73.4), and CaO/Al2O
3 (0.74) to the magmatic
rocks containing cumulate plagioclase and clinopyroxene (e.g., Pearce et al., 1995). Peg-matite gabbro shows a highly depleted REE pattern (Fig. 10C), consistent with its cumulate nature. A positive Eu anomaly (Eu/Eu* = 10.5) associated with high Al
2O
3, Sr, K, and Ba con-
tents is evidence of plagioclase accumulation.
Mafi c Rocks
The SiO2 abundances in gabbros cover a
broad range (38.2%–54.4%), indicating mag-matic fractionation and alteration. Gabbros are characterized by low TiO
2 (0.3%–0.5%) and
Zr (13–44 ppm) and high Mg# (58–68), show-ing a boninitic affi nity (Crawford et al., 1989). The exception is sample DR05–3, which has higher TiO
2 (1.8%) and Zr (139 ppm) and
lower Mg# (42), consistent with tholeiitic af-fi nity. Compositional data for mafi c igneous rocks plotted on a revised FeOt/MgO versus SiO
2 diagram (Fig. 11) are bimodal, with sub-
equal tholeiitic and calc-alkalic samples. The pillow lavas are tholeiitic, dacite dikes are calc-alkalic, and lava fl ows and dikes scatter in both fi elds.
The gabbros have low Ti/V (8.1–15.8) and fall into boninitic–island-arc tholeiitic (IAT) fi elds of Shervais (1982), except sample DR05–3, which has higher Ti/V (39.8) and MORB affi n-ity (Fig. 12). Dehshir gabbros show three kinds of REE patterns (Fig. 10C): (1) fl at (D05–12, R-12, D06–3); (2) LREE depleted (DZ05–1H); and (3) slightly LREE enriched (DR05–3). Dehshir gabbros are depleted in Nb and Ta and enriched in Sr (except sample DZ05–1H), U, Pb, K, Ba, and Rb relative to N-MORB (Fig. 10D). Sample DR05–3 is slightly enriched in LREE (La(N)/Yb(N) = 1.5) and slightly depleted in Nb relative to LREE (Nb/La ~ 0.8 × N-MORB).
The pillow lavas range from basalt to andesite (45.4%–61.5% SiO
2) and are fractionated (Mg#
= 28.5–54.1), with variable TiO2 (0.4%–1.9%),
Zr (25.3–163 ppm), and Ti/V (7.3–43.1) ratios. Pillow lavas are tholeiitic, with FeOt/MgO be-tween 1.5 and 4.5, and plot in the high-Fe fi eld of Figure 11. On Ti/V diagram (Fig. 12), they plot in the island-arc tholeiite (IAT)–boninitic fi elds of Shervais (1982), except samples DAR05–6 and A06–2, which have respectively higher and lower Ti/V ratios, showing MORB and calc-alkaline affi nities. In contrast to the pillow lavas, the basaltic fl ows are mostly iron-poor, plotting in the low- to medium-Fe fi elds of the FeOt/MgO versus SiO
2 diagram (Fig.
11). Pillow lavas show either fl at REE patterns (La(N)/Yb(N) = 1.1–1.2) or fractionated LREE-enriched patterns (LaN/YbN = 2.7–3.3) typical of tholeiitic (IAT) and calc-alkaline series, respec-tively (Fig. 10E). Pillowed basalts are depleted in Nb (Nb/La ~ 0.2–0.7 × N-MORB) and en-riched in Pb, U, Ba, and Th (e.g., Th/La ~ 1–3 × N-MORB) relative to LREE in N-MORB nor-malized diagram (Fig. 10F). Basaltic lava fl ows (samples DR05–2A, DAR05–5) and basaltic dike in sheeted dike complex (AZ06–38) are tholeiitic with 44.9%–51% SiO
2, 1.3%–1.8%
TiO2, 66–185 ppm Zr, 3.8%–6.9% MgO, and
Ti/V = 21–30. The andesitic dike in amphi-bole gabbros (DZ05–1D) and a basaltic lava (D06–10) show boninitic affi nities, with higher MgO (7.5%–9.8%) and SiO
2 (50.4%–57.4%)
and very low TiO2 (0.3%–0.4%), Zr (16.8–
20.5 ppm), and Ti/V (9.6–10.5).
0.8 0.6 0.4 0.2 0.01.0
Mg# Mg/(Mg+Fe+2)
0.0
0.2
0.4
0.6
1.0
0.8
Cr#
(Cr/
Cr+
Al)
Boninite
MORB
Back-arc basin
Forearc
A
TiO
2 (w
t%)
MORBperidotite
SSZ peridotite
MORB
10
1
0.1
0.01
0 10 20 30 40 50
Al2O3 (wt%)
Arc
B
Dehshir
Baft
Shahr-e-Babak
Nain
NeyrizOuter Belt
Inner Belt
Mariana Trough
IBM & S. Sd Forearc
Figure 6. (A) Cr# versus Mg# diagram (modifi ed after Dick and Bullen, 1984) for spinels in harzburgite. For comparison, we also plot the data from the Inner Zagros ophiolite belt, including Nain, Shahr-e-Babak, and Baft (data from Shafaii Moghadam, 2009) and from the Outer Zagros ophiolitic belt (Neyriz; data from Jannessary, 2003). Note complete overlap between inner and outer belt data, although outer belt is overall more depleted. (B) Diagram (after Kamenetsky et al., 2001) showing TiO2 against Al2O3 contents of spinels, in order to discriminate between various types of peridotites (fi elds outlined by black lines) and lavas (fi elds outlined by gray lines). Note that spinels plot in fi elds for both mid-ocean-ridge basalt (MORB) peridotites and suprasubduction-zone (SSZ) peridotites. Izu-Bonin-Mariana (IBM) and South Sandwich forearc harzburgite data are from Parkinson and Pearce (1998) and Pearce et al. (2000), respectively; Mariana Trough mantle data are from Ohara et al. (2002).

Shafaii Moghadam et al.
1532 Geological Society of America Bulletin, September/October 2010
TAB
LE 5
. CLI
NO
PY
RO
XE
NE
CO
MP
OS
ITIO
NS
IN T
HE
DE
HS
HIR
MA
FIC
RO
CK
S IN
CLU
DIN
G G
AB
BR
OS
, LE
UC
OG
AB
BR
OS
, PIL
LOW
LA
VA
S, A
ND
DIA
BA
SIC
DIK
E S
Sam
ple:
DI0
5-12
DI0
5-12
DI0
5-12
DI0
5-12
DI0
5-12
DI0
5-12
D06
-3D
06-3
D06
-3D
06-3
D06
-3R
-12
R-1
2R
-12
R-1
2G
06-1
6G
06-1
6G
06-1
6R
ock
type
:ga
bbro
gabb
roga
bbro
gabb
roga
bbro
gabb
roga
bbro
gabb
roga
bbro
gabb
roga
bbro
gabb
roga
bbro
gabb
roga
bbro
diab
ase
diab
ase
diab
ase
SiO
249
.62
53.5
752
.49
52.4
752
.93
56.1
252
.33
53.1
553
.93
54.4
854
.48
54.3
853
.13
53.8
653
.68
53.2
951
.59
50.8
1Ti
O2
0.72
0.03
0.30
0.23
0.13
0.05
0.40
0.08
0.03
0.09
0.10
0.00
0.07
0.17
0.23
0.25
0.68
0.67
Al 2O
33.
271.
171.
581.
731.
630.
651.
851.
740.
590.
620.
660.
720.
661.
161.
521.
243.
643.
40F
eO12
.92
5.88
7.58
7.73
5.87
12.6
67.
375.
635.
945.
855.
425.
755.
376.
295.
647.
938.
798.
25C
r 2O
30.
000.
060.
090.
190.
160.
080.
120.
000.
080.
130.
090.
060.
000.
020.
090.
080.
080.
07M
nO0.
410.
000.
330.
250.
110.
270.
190.
230.
180.
150.
260.
260.
160.
130.
190.
160.
270.
36N
iO0.
210.
070.
140.
080.
000.
000.
000.
000.
110.
000.
000.
060.
200.
100.
160.
000.
030.
00M
gO14
.69
15.0
215
.78
15.7
515
.33
27.4
213
.91
15.6
115
.47
15.4
315
.54
15.4
915
.88
14.8
715
.31
15.6
316
.04
15.9
1C
aO16
.83
22.9
719
.83
20.3
522
.40
1.69
22.4
621
.96
23.0
623
.08
23.0
823
.16
22.8
922
.50
22.9
121
.05
18.8
818
.91
Na 2
O0.
450.
270.
290.
170.
120.
050.
260.
250.
080.
090.
150.
060.
160.
010.
180.
190.
320.
30K
2O
0.00
0.05
0.06
0.07
0.03
0.02
0.03
0.01
0.00
0.00
0.00
0.00
0.03
0.00
0.00
0.00
0.00
0.03
Tota
l99
.13
99.1
198
.47
99.0
398
.70
99.0
098
.91
98.6
599
.48
99.9
099
.78
99.9
498
.56
99.0
999
.89
99.8
410
0.32
98.7
0T
Si
1.87
1.99
1.97
1.96
1.98
2.03
1.96
1.98
2.00
2.01
2.01
2.01
1.98
2.01
1.98
1.97
1.90
1.90
TAl
0.13
0.01
0.03
0.04
0.03
0.00
0.04
0.02
0.00
0.00
0.00
0.00
0.02
0.00
0.02
0.03
0.10
0.10
M1A
l0.
020.
040.
040.
030.
050.
030.
050.
060.
030.
030.
030.
030.
010.
050.
050.
030.
050.
05M
1Ti
0.02
0.00
0.01
0.01
0.00
0.00
0.01
0.00
0.00
0.00
0.00
0.00
0.00
0.01
0.01
0.01
0.02
0.02
M1F
e30.
110.
000.
000.
010.
000.
000.
000.
000.
000.
000.
000.
000.
020.
000.
000.
000.
030.
04M
1Fe2
0.03
0.12
0.07
0.07
0.09
0.00
0.16
0.08
0.11
0.12
0.11
0.11
0.08
0.11
0.10
0.10
0.01
0.01
M1C
r0.
000.
000.
000.
010.
010.
000.
000.
000.
000.
000.
000.
000.
000.
000.
000.
000.
000.
00M
1Mg
0.83
0.83
0.88
0.88
0.85
0.97
0.78
0.87
0.86
0.85
0.86
0.85
0.88
0.83
0.84
0.86
0.88
0.89
M1N
i0.
010.
000.
000.
000.
000.
000.
000.
000.
000.
000.
000.
000.
010.
000.
010.
000.
000.
00M
2Mg
0.00
0.00
0.00
0.00
0.00
0.51
0.00
0.00
0.00
0.00
0.00
0.00
0.00
0.00
0.00
0.00
0.00
0.00
M2F
e20.
270.
060.
170.
160.
090.
380.
070.
100.
070.
060.
060.
070.
070.
080.
080.
150.
230.
21M
2Mn
0.01
0.00
0.01
0.01
0.00
0.01
0.01
0.01
0.01
0.01
0.01
0.01
0.01
0.00
0.01
0.01
0.01
0.01
M2C
a0.
680.
920.
800.
810.
900.
070.
900.
880.
920.
910.
910.
920.
910.
900.
910.
840.
740.
76M
2Na
0.03
0.02
0.02
0.01
0.01
0.00
0.02
0.02
0.01
0.01
0.01
0.00
0.01
0.00
0.01
0.01
0.02
0.02
M2K
0.00
0.00
0.00
0.00
0.00
0.00
0.00
0.00
0.00
0.00
0.00
0.00
0.00
0.00
0.00
0.00
0.00
0.00
Sum
_cat
4.00
4.00
4.00
4.00
4.00
4.00
4.00
4.00
4.00
4.00
4.00
4.00
4.00
4.00
4.00
4.00
4.00
4.00
WO
35.3
147
.40
41.3
441
.96
46.2
83.
3947
.08
45.5
146
.71
46.8
846
.97
46.8
846
.43
46.6
846
.98
42.8
539
.12
39.5
9E
N42
.86
43.1
345
.77
45.1
944
.08
76.4
040
.55
45.0
143
.61
43.6
044
.00
43.6
244
.82
42.9
343
.69
44.2
946
.22
46.3
4F
S21
.83
9.47
12.8
912
.85
9.64
20.2
112
.37
9.48
9.68
9.52
9.02
9.50
8.76
10.3
99.
3312
.86
14.6
614
.08
Mg#
66.9
481
.99
78.7
578
.40
82.3
179
.42
77.0
783
.16
82.2
782
.45
83.6
382
.75
84.0
680
.82
82.8
877
.85
76.4
777
.46
(con
tinue
d)
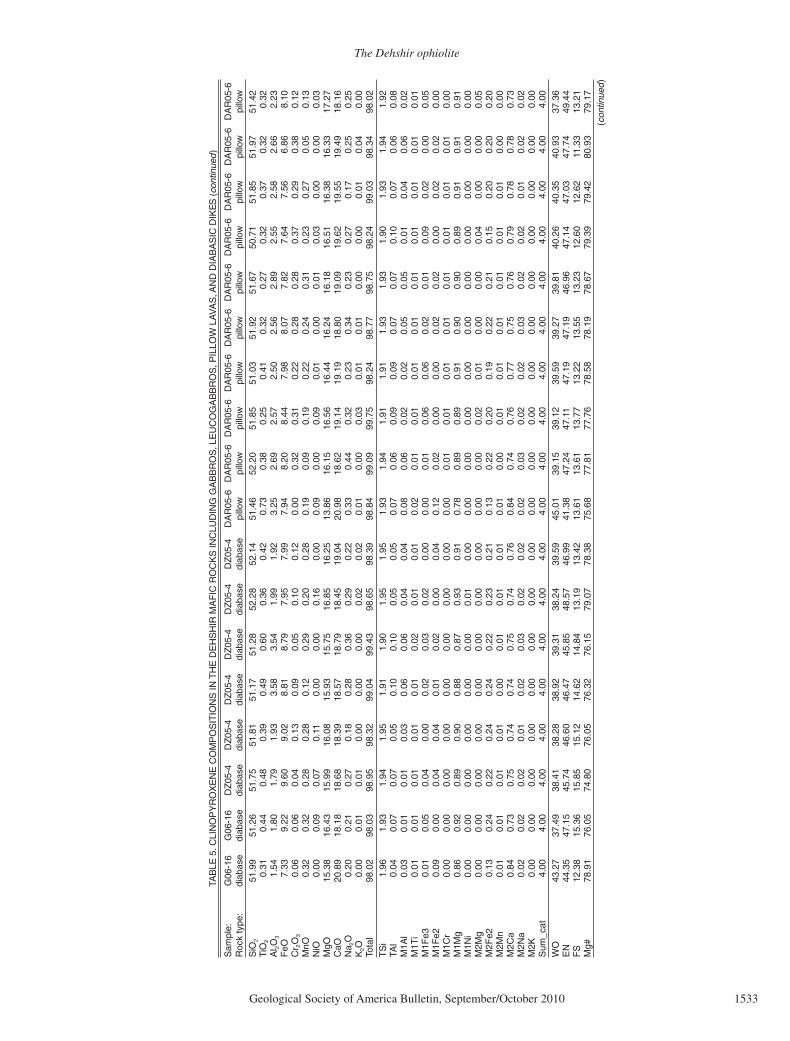
The Dehshir ophiolite
Geological Society of America Bulletin, September/October 2010 1533
TAB
LE 5
. CLI
NO
PY
RO
XE
NE
CO
MP
OS
ITIO
NS
IN T
HE
DE
HS
HIR
MA
FIC
RO
CK
S IN
CLU
DIN
G G
AB
BR
OS
, LE
UC
OG
AB
BR
OS
, PIL
LOW
LA
VA
S, A
ND
DIA
BA
SIC
DIK
ES (
cont
inue
d)
Sam
ple:
G06
-16
G06
-16
DZ
05-4
DZ
05-4
DZ
05-4
DZ
05-4
DZ
05-4
DZ
05-4
DA
R05
-6D
AR
05-6
DA
R05
-6D
AR
05-6
DA
R05
-6D
AR
05-6
DA
R05
-6D
AR
05-6
DA
R05
-6D
AR
05-6
Roc
k ty
pe:
diab
ase
diab
ase
diab
ase
diab
ase
diab
ase
diab
ase
diab
ase
diab
ase
pillo
wpi
llow
pillo
wpi
llow
pillo
wpi
llow
pillo
wpi
llow
pillo
wpi
llow
SiO
251
.99
51.2
651
.75
51.8
151
.17
51.2
852
.28
52.1
451
.46
52.2
051
.85
51.0
351
.92
51.6
750
.71
51.8
551
.97
51.4
2Ti
O2
0.31
0.44
0.48
0.39
0.49
0.60
0.36
0.42
0.73
0.38
0.25
0.41
0.32
0.27
0.32
0.37
0.32
0.32
Al 2O
31.
541.
801.
791.
933.
583.
541.
991.
923.
252.
692.
572.
502.
562.
892.
552.
582.
662.
23F
eO7.
339.
229.
609.
028.
818.
797.
957.
997.
948.
208.
447.
988.
077.
827.
647.
566.
868.
10C
r 2O
30.
060.
060.
040.
130.
090.
050.
100.
120.
000.
320.
310.
220.
280.
280.
370.
290.
380.
12M
nO0.
320.
320.
280.
280.
120.
290.
200.
280.
190.
090.
190.
220.
240.
310.
230.
270.
050.
13N
iO0.
000.
090.
070.
110.
000.
000.
160.
000.
090.
000.
090.
010.
000.
010.
030.
000.
000.
03M
gO15
.38
16.4
315
.99
16.0
815
.93
15.7
516
.85
16.2
513
.86
16.1
516
.56
16.4
416
.24
16.1
816
.51
16.3
816
.33
17.2
7C
aO20
.89
18.1
818
.68
18.3
918
.57
18.7
918
.45
19.0
420
.98
18.6
219
.14
19.1
918
.80
19.0
919
.62
19.5
519
.49
18.1
6N
a 2O
0.20
0.21
0.27
0.18
0.28
0.36
0.29
0.22
0.33
0.44
0.32
0.23
0.34
0.23
0.27
0.17
0.25
0.25
K2O
0.00
0.01
0.01
0.00
0.00
0.00
0.02
0.02
0.01
0.00
0.03
0.01
0.01
0.00
0.00
0.01
0.04
0.00
Tota
l98
.02
98.0
398
.95
98.3
299
.04
99.4
398
.65
98.3
998
.84
99.0
999
.75
98.2
498
.77
98.7
598
.24
99.0
398
.34
98.0
2T
Si
1.96
1.93
1.94
1.95
1.91
1.90
1.95
1.95
1.93
1.94
1.91
1.91
1.93
1.93
1.90
1.93
1.94
1.92
TAl
0.04
0.07
0.07
0.05
0.10
0.10
0.05
0.05
0.07
0.06
0.09
0.09
0.07
0.07
0.10
0.07
0.06
0.08
M1A
l0.
030.
010.
010.
030.
060.
060.
040.
040.
080.
060.
020.
020.
050.
050.
010.
040.
060.
02M
1Ti
0.01
0.01
0.01
0.01
0.01
0.02
0.01
0.01
0.02
0.01
0.01
0.01
0.01
0.01
0.01
0.01
0.01
0.01
M1F
e30.
010.
050.
040.
000.
020.
030.
020.
000.
000.
010.
060.
060.
020.
010.
090.
020.
000.
05M
1Fe2
0.09
0.00
0.04
0.04
0.01
0.02
0.00
0.04
0.12
0.02
0.00
0.00
0.02
0.02
0.00
0.02
0.02
0.00
M1C
r0.
000.
000.
000.
000.
000.
000.
000.
000.
000.
010.
010.
010.
010.
010.
010.
010.
010.
00M
1Mg
0.86
0.92
0.89
0.90
0.88
0.87
0.93
0.91
0.78
0.89
0.89
0.91
0.90
0.90
0.89
0.91
0.91
0.91
M1N
i0.
000.
000.
000.
000.
000.
000.
010.
000.
000.
000.
000.
000.
000.
000.
000.
000.
000.
00M
2Mg
0.00
0.00
0.00
0.00
0.00
0.00
0.00
0.00
0.00
0.00
0.02
0.01
0.00
0.00
0.04
0.00
0.00
0.05
M2F
e20.
130.
240.
220.
240.
240.
220.
230.
210.
130.
220.
200.
190.
220.
210.
150.
200.
200.
20M
2Mn
0.01
0.01
0.01
0.01
0.00
0.01
0.01
0.01
0.01
0.00
0.01
0.01
0.01
0.01
0.01
0.01
0.00
0.00
M2C
a0.
840.
730.
750.
740.
740.
750.
740.
760.
840.
740.
760.
770.
750.
760.
790.
780.
780.
73M
2Na
0.02
0.02
0.02
0.01
0.02
0.03
0.02
0.02
0.02
0.03
0.02
0.02
0.03
0.02
0.02
0.01
0.02
0.02
M2K
0.00
0.00
0.00
0.00
0.00
0.00
0.00
0.00
0.00
0.00
0.00
0.00
0.00
0.00
0.00
0.00
0.00
0.00
Sum
_cat
4.00
4.00
4.00
4.00
4.00
4.00
4.00
4.00
4.00
4.00
4.00
4.00
4.00
4.00
4.00
4.00
4.00
4.00
WO
43.2
737
.49
38.4
138
.28
38.9
239
.31
38.2
439
.59
45.0
139
.15
39.1
239
.59
39.2
739
.81
40.2
640
.35
40.9
337
.36
EN
44.3
547
.15
45.7
446
.60
46.4
745
.85
48.5
746
.99
41.3
847
.24
47.1
147
.19
47.1
946
.96
47.1
447
.03
47.7
449
.44
FS
12.3
815
.36
15.8
515
.12
14.6
214
.84
13.1
913
.42
13.6
113
.61
13.7
713
.22
13.5
513
.23
12.6
012
.62
11.3
313
.21
Mg#
78.9
176
.05
74.8
076
.05
76.3
276
.15
79.0
778
.38
75.6
877
.81
77.7
678
.58
78.1
978
.67
79.3
979
.42
80.9
379
.17
( con
tinue
d)
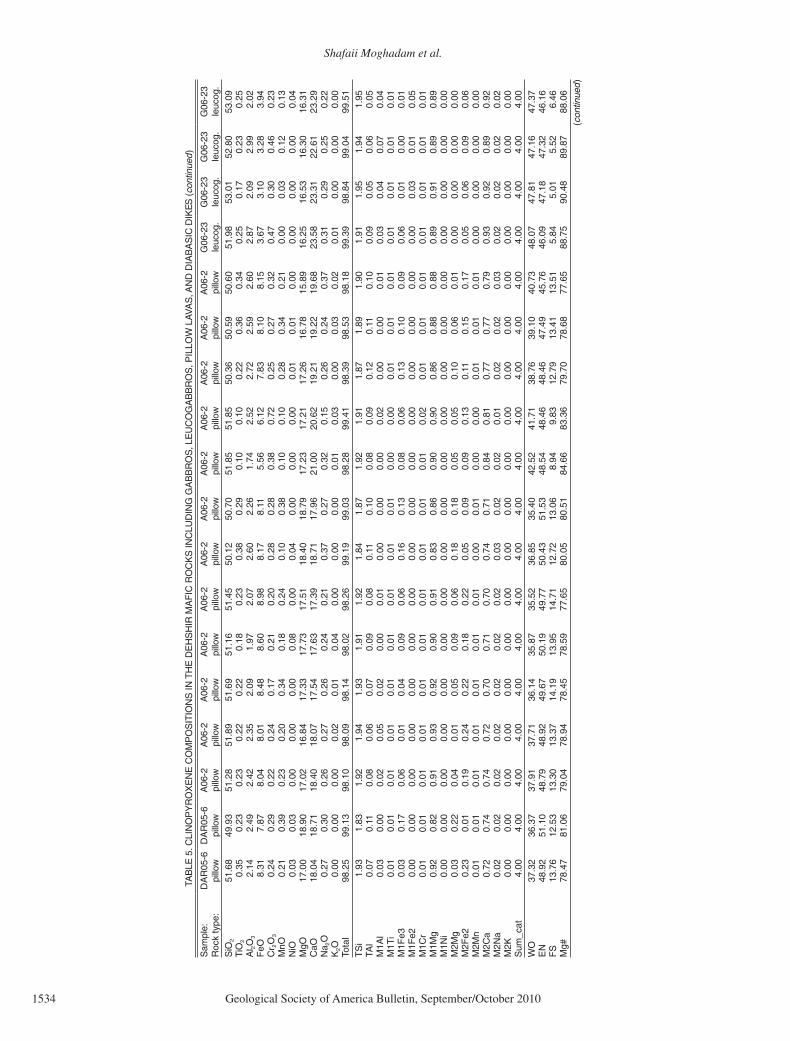
Shafaii Moghadam et al.
1534 Geological Society of America Bulletin, September/October 2010
TAB
LE 5
. CLI
NO
PY
RO
XE
NE
CO
MP
OS
ITIO
NS
IN T
HE
DE
HS
HIR
MA
FIC
RO
CK
S IN
CLU
DIN
G G
AB
BR
OS
, LE
UC
OG
AB
BR
OS
, PIL
LOW
LA
VA
S, A
ND
DIA
BA
SIC
DIK
ES (
cont
inue
d)
Sam
ple:
DA
R05
-6D
AR
05-6
A06
-2A
06-2
A06
-2A
06-2
A06
-2A
06-2
A06
-2A
06-2
A06
-2A
06-2
A06
-2A
06-2
G06
-23
G06
-23
G06
-23
G06
-23
Roc
k ty
pe:
pillo
wpi
llow
pillo
wpi
llow
pillo
wpi
llow
pillo
wpi
llow
pillo
wpi
llow
pillo
wpi
llow
pillo
wpi
llow
leuc
og.
leuc
og.
leuc
og.
leuc
og.
SiO
251
.68
49.9
351
.28
51.8
951
.69
51.1
651
.45
50.1
250
.70
51.8
551
.85
50.3
650
.59
50.6
051
.98
53.0
152
.80
53.0
9Ti
O2
0.35
0.23
0.23
0.22
0.22
0.18
0.23
0.38
0.29
0.10
0.10
0.22
0.36
0.34
0.25
0.17
0.23
0.25
Al 2O
32.
142.
492.
422.
352.
091.
972.
072.
602.
261.
742.
522.
722.
592.
602.
872.
092.
992.
02F
eO8.
317.
878.
048.
018.
488.
608.
988.
178.
115.
566.
127.
838.
108.
153.
673.
103.
283.
94C
r 2O
30.
240.
290.
220.
240.
170.
210.
200.
280.
280.
380.
720.
250.
270.
320.
470.
300.
460.
23M
nO0.
210.
390.
230.
200.
340.
180.
240.
100.
380.
100.
100.
280.
340.
210.
000.
030.
120.
13N
iO0.
030.
030.
000.
000.
000.
080.
000.
040.
000.
000.
000.
010.
010.
000.
000.
000.
000.
04M
gO17
.00
18.9
017
.02
16.8
417
.33
17.7
317
.51
18.4
018
.79
17.2
317
.21
17.2
616
.78
15.8
916
.25
16.5
316
.30
16.3
1C
aO18
.04
18.7
118
.40
18.0
717
.54
17.6
317
.39
18.7
117
.96
21.0
020
.62
19.2
119
.22
19.6
823
.58
23.3
122
.61
23.2
9N
a 2O
0.27
0.30
0.26
0.27
0.26
0.24
0.21
0.37
0.27
0.32
0.15
0.26
0.24
0.37
0.31
0.29
0.25
0.22
K2O
0.00
0.00
0.00
0.02
0.01
0.04
0.00
0.00
0.00
0.01
0.03
0.00
0.03
0.02
0.01
0.00
0.00
0.00
Tota
l98
.25
99.1
398
.10
98.0
998
.14
98.0
298
.26
99.1
999
.03
98.2
899
.41
98.3
998
.53
98.1
899
.39
98.8
499
.04
99.5
1T
Si
1.93
1.83
1.92
1.94
1.93
1.91
1.92
1.84
1.87
1.92
1.91
1.87
1.89
1.90
1.91
1.95
1.94
1.95
TAl
0.07
0.11
0.08
0.06
0.07
0.09
0.08
0.11
0.10
0.08
0.09
0.12
0.11
0.10
0.09
0.05
0.06
0.05
M1A
l0.
030.
000.
020.
050.
020.
000.
010.
000.
000.
000.
020.
000.
000.
010.
030.
040.
070.
04M
1Ti
0.01
0.01
0.01
0.01
0.01
0.01
0.01
0.01
0.01
0.00
0.00
0.01
0.01
0.01
0.01
0.01
0.01
0.01
M1F
e30.
030.
170.
060.
010.
040.
090.
060.
160.
130.
080.
060.
130.
100.
090.
060.
010.
000.
01M
1Fe2
0.00
0.00
0.00
0.00
0.00
0.00
0.00
0.00
0.00
0.00
0.00
0.00
0.00
0.00
0.00
0.03
0.01
0.05
M1C
r0.
010.
010.
010.
010.
010.
010.
010.
010.
010.
010.
020.
010.
010.
010.
010.
010.
010.
01M
1Mg
0.92
0.82
0.91
0.93
0.92
0.90
0.91
0.83
0.86
0.90
0.90
0.86
0.88
0.88
0.89
0.91
0.89
0.89
M1N
i0.
000.
000.
000.
000.
000.
000.
000.
000.
000.
000.
000.
000.
000.
000.
000.
000.
000.
00M
2Mg
0.03
0.22
0.04
0.01
0.05
0.09
0.06
0.18
0.18
0.05
0.05
0.10
0.06
0.01
0.00
0.00
0.00
0.00
M2F
e20.
230.
010.
190.
240.
220.
180.
220.
050.
090.
090.
130.
110.
150.
170.
050.
060.
090.
06M
2Mn
0.01
0.01
0.01
0.01
0.01
0.01
0.01
0.00
0.01
0.00
0.00
0.01
0.01
0.01
0.00
0.00
0.00
0.00
M2C
a0.
720.
740.
740.
720.
700.
710.
700.
740.
710.
840.
810.
770.
770.
790.
930.
920.
890.
92M
2Na
0.02
0.02
0.02
0.02
0.02
0.02
0.02
0.03
0.02
0.02
0.01
0.02
0.02
0.03
0.02
0.02
0.02
0.02
M2K
0.00
0.00
0.00
0.00
0.00
0.00
0.00
0.00
0.00
0.00
0.00
0.00
0.00
0.00
0.00
0.00
0.00
0.00
Sum
_cat
4.00
4.00
4.00
4.00
4.00
4.00
4.00
4.00
4.00
4.00
4.00
4.00
4.00
4.00
4.00
4.00
4.00
4.00
WO
37.3
236
.37
37.9
137
.71
36.1
435
.87
35.5
236
.85
35.4
042
.52
41.7
138
.76
39.1
040
.73
48.0
747
.81
47.1
647
.37
EN
48.9
251
.10
48.7
948
.92
49.6
750
.19
49.7
750
.43
51.5
348
.54
48.4
648
.46
47.4
945
.76
46.0
947
.18
47.3
246
.16
FS
13.7
612
.53
13.3
013
.37
14.1
913
.95
14.7
112
.72
13.0
68.
949.
8312
.79
13.4
113
.51
5.84
5.01
5.52
6.46
Mg#
78.4
781
.06
79.0
478
.94
78.4
578
.59
77.6
580
.05
80.5
184
.66
83.3
679
.70
78.6
877
.65
88.7
590
.48
89.8
788
.06
(con
tinue
d)

The Dehshir ophiolite
Geological Society of America Bulletin, September/October 2010 1535
Geochemical results thus indicate that there are two types of basaltic-andesitic fl ows and dikes: (1) calc-alkaline basalt and andesite that are depleted relative to N-MORB (e.g., Yb = 0.9–1.5 ppm versus N-MORB = 3.05 ppm Yb; Sun and McDonough, 1989), similar to boninite, and (2) tholeiitic basalts with bulk REE con-tents that are similar or slightly enriched rela-tive to N-MORB (e.g., Yb = 2.9–5.5 ppm; Fig. 10G). Most basalt lavas are LREE-depleted (LaN/YbN of 0.4–1). They are enriched in LILE and depleted in high fi eld strength ele-ments (HFSE), so that LILE/HFSE ratios are higher than N-MORB (e.g., Nb/La ~ 0.2–0.7 × N-MORB; Fig. 10H). The exception is sample AZ06–38, which is not so depleted in HFSE (Nb/La ~ 1.1 × N-MORB).
Disruption of rock units during ophio-lite emplacement prohibits reconstruction of ophio litic lava chemostratigraphy in detail, but our fi eld observations in conjunction with results discussed here indicate that basalt lava compositions vary from MORB and/or island-arc tholeiitic (IAT) to both calc-alkaline and boninitic with time (Fig. 3). For example, the base of pillow lavas in Aziz-Abad, Figure 3 right, with island-arc tholeiitic affi nity (sam-ple AZ06–32), is intruded by basaltic-dacitic dike swarms. The fi rst basaltic dikes (sample AZ06–38) are N-MORB, intruded by late
dacitic dikes with a suprasubduction-zone chem-ical signature. There is no fi eld evidence for a break between the MORB-like (lower) and the upper (island-arc tholeiitic/boninite) sequences in the form of an unconformity or intervening sedimentary sequence.
Diabasic Dikes in Mantle Harzburgite
Diabasic dikes intruding harzburgite have a restricted range in silica (48.7%–52.2%). These are fractionated (Mg# = 37.8–64.8) and contain variable TiO
2 (0.3%–1.4%), Zr (10.4–68.2 ppm),
and Ti/V (7.2–21.5). Based on FeOt/MgO, they are more like basaltic lava fl ows than pillow lavas , characterized mostly by low- to medium-Fe contents (Fig. 11), perhaps indicating an H
2O-
rich magma (Arculus, 2003). The dikes fall into island-arc tholeiitic and MORB fi elds of Shervais (1982), while sample AZ06–29 shows boninitic affi nity (Fig. 12) with low abundances of Zr, TiO
2, and Ti/V ratio and higher Mg#. These dikes
have REE contents close to N-MORB (e.g., Yb = 2.2–2.9 ppm). Sample AZ06–29 is distinguished by its lower REE content (e.g., Yb = 0.8 ppm), similar to boninite and to basaltic lavas D06–10 and DZ05–1D. Low REE contents associated with high abundances of compatible elements and Mg# of these samples refl ect melt issued from more refractory mantle source, perhaps as a
result of two-stage melting (e.g., Ernewein et al., 1988; Dilek et al., 2007).
Similar to other Dehshir ophiolite mafi c magmatic rocks, diabasic dikes in harzburgite are characterized by two types of REE pat-terns: (1) some samples (DAR05–4, G06–16, AZ06–29, and DZ05–4) are depleted in LREE relative to HREE (Fig. 10I), with LaN/YbN rang-ing from 0.3 to 0.9 (LaN/YbN = 0.59 for aver-age N-MORB; Sun and McDonough, 1989). Relative to N-MORB, these dikes are enriched in U, Pb, K, Ba, and Sr (e.g., K/La ~ 2–27 × N-MORB) and depleted in Nb and Ta (e.g., Nb/La ~ 0.3–0.5 × N-MORB; Fig. 10J), with high LILE/HFSE ratios. The REE profi le of these dikes is similar to those of island-arc tholeiite. If not refl ecting alteration, their high LILE/HFSE values are most simply interpreted as an island-arc signature, where the LILE-enriched aqueous fl uid derived from the subducted slab has modi-fi ed the mantle wedge, which then has melted to generate basaltic melts with these signatures (e.g., Tatsumi et al., 1986; Stern, 2002). (2) Dia-basic dikes (DAR05–3 and A06–1) have slight LREE enrichment (LaN/YbN = 1.4–1.6) and also are relatively depleted in Nb and Ta (e.g., Nb/La ~ 0.3 × N-MORB), typical of calc-alkaline series. Sample A06–1 is compositionally similar to overlying pillow lavas (which are in faulted contact with peridotite; Fig. 3). All dia basic dikes have high Th/Yb (Fig. 13) distinct from MORB, confi rming their arc-related affi nity.
Metamorphic Rocks
Amphibolite (sample DZ05–9) shows a depleted composition, with SiO
2 (42.5%),
MgO (12.9%), TiO2 (0.32%), Zr (13 ppm),
and Mg# (71.3) abundances similar to de-pleted basalts and gabbros. The amphibolite falls into island-arc tholeiitic–boninite fi eld on the Ti-V diagram (Fig. 12). The rock displays LREE-depleted REE patterns (LaN/YbN = 0.6) (Fig. 10K). Relative to N-MORB, the rock shows negative Nb and Ta anomalies (e.g., Nb/La ~ 0.4 × N-MORB) and positive LILE spikes (U, Pb, Th, Ba; e.g., U/La ~ 8 × N-MORB) (Fig. 10L). Geochemically, amphibolite is simi-lar to depleted basaltic rocks (DZ05–1D or D06–10), and, therefore, its protolith is thought to have been depleted mafi c rocks.
Felsic Rocks
Dacites in the sheeted dike complex have high SiO
2 (63.8%–71.3%), and low K
2O (0%–
0.09%), TiO2 (0.32%–0.41%), Zr (45–73 ppm),
and Mg# (5.7–42.3), typical of suprasubduction zone–related felsites. Na
2O abundances are vari-
able (0.2%–6.9%), probably due to alteration.
TABLE 5. CLINOPYROXENE COMPOSITIONS IN THE DEHSHIR MAFIC ROCKS INCLUDING GABBROS, LEUCOGABBROS, PILLOW LAVAS, AND DIABASIC DIKES (continued)
Sample: G06-23 G06-23 G06-17 G06-17 G06-17 G06-17 G06-17 G06-17Rock type: leucog. leucog. leucog. leucog. leucog. leucog. leucog. leucog.SiO2 52.08 52.68 53.23 51.73 51.84 52.14 51.86 52.71TiO2 0.33 0.22 0.24 0.27 0.21 0.14 0.33 0.28Al2O3 2.73 2.63 2.63 3.64 3.21 3.27 3.29 2.66FeO 3.32 3.01 3.18 3.44 3.09 3.43 3.18 3.57Cr2O3 0.47 0.38 0.43 0.40 0.38 0.30 0.39 0.38MnO 0.03 0.12 0.03 0.12 0.13 0.17 0.12 0.09NiO 0.00 0.08 0.11 0.01 0.11 0.01 0.01 0.01MgO 16.17 15.92 16.44 16.22 16.33 16.19 16.13 16.54CaO 23.38 24.22 23.00 22.26 22.70 22.77 23.24 22.84Na2O 0.30 0.29 0.23 0.29 0.22 0.33 0.30 0.30K2O 0.00 0.03 0.00 0.01 0.02 0.00 0.00 0.01Total 98.80 99.57 99.51 98.40 98.24 98.75 98.87 99.39TSi 1.92 1.93 1.95 1.91 1.92 1.92 1.91 1.93TAl 0.08 0.07 0.05 0.09 0.08 0.08 0.09 0.07M1Al 0.04 0.04 0.06 0.07 0.06 0.06 0.05 0.05M1Ti 0.01 0.01 0.01 0.01 0.01 0.00 0.01 0.01M1Fe3 0.03 0.03 0.00 0.01 0.01 0.02 0.03 0.02M1Fe2 0.02 0.04 0.02 0.01 0.01 0.01 0.01 0.01M1Cr 0.01 0.01 0.01 0.01 0.01 0.01 0.01 0.01M1Mg 0.89 0.87 0.90 0.90 0.90 0.89 0.89 0.90M1Ni 0.00 0.00 0.00 0.00 0.00 0.00 0.00 0.00M2Mg 0.00 0.00 0.00 0.00 0.00 0.00 0.00 0.00M2Fe2 0.05 0.02 0.08 0.09 0.08 0.07 0.06 0.08M2Mn 0.00 0.00 0.00 0.00 0.00 0.01 0.00 0.00M2Ca 0.92 0.95 0.90 0.88 0.90 0.90 0.92 0.90M2Na 0.02 0.02 0.02 0.02 0.02 0.02 0.02 0.02M2K 0.00 0.00 0.00 0.00 0.00 0.00 0.00 0.00Sum_cat 4.00 4.00 4.00 4.00 4.00 4.00 4.00 4.00WO 48.22 49.62 47.54 46.75 47.36 47.33 48.17 46.89EN 46.40 45.37 47.28 47.41 47.39 46.82 46.50 47.25FS 5.39 5.01 5.17 5.84 5.25 5.85 5.34 5.87Mg# 89.67 90.39 90.21 89.36 90.40 89.37 90.02 89.20

Shafaii Moghadam et al.
1536 Geological Society of America Bulletin, September/October 2010
TAB
LE 6
. RE
PR
ES
EN
TAT
IVE
CO
MP
OS
ITIO
N O
F P
LAG
IOC
LAS
E IN
DE
HS
HIR
AM
PH
IBO
LIT
ES
AN
D P
LAG
IOC
LAS
E L
HE
RZ
OLI
TE
S
Roc
k ty
pe:
Am
phib
Am
phib
Am
phib
Am
phib
Am
phib
Am
phib
Am
phib
Am
phib
Am
phib
Am
phib
Am
phib
Am
phib
Am
phib
Am
phib
Am
phib
Am
phib
plg
lher
zpl
g lh
erz
plg
lher
zpl
g lh
erz
Sam
ple:
DZ
05-9
DZ
05-9
DZ
05-9
DZ
05-9
DZ
05-9
DZ
05-9
DZ
05-9
DZ
05-9
DZ
05-9
DZ
05-9
DZ
05-9
DZ
05-9
DZ
05-9
DZ
05-9
DZ
05-9
DZ
05-9
G06
-20
G06
-20
G06
-20
G06
-20
SiO
269
.11
65.3
857
.11
69.4
468
.44
59.2
861
.25
66.5
865
.31
58.3
869
.00
69.3
363
.78
63.8
869
.07
69.1
541
.02
46.4
546
.44
46.0
5Ti
O2
0.00
0.02
0.00
0.05
0.05
0.08
0.00
0.09
0.07
0.06
0.03
0.00
0.05
0.00
0.00
0.03
0.04
0.01
0.01
0.04
Al 2O
319
.55
19.5
926
.49
19.6
819
.58
25.9
024
.39
20.0
920
.54
25.1
219
.64
19.8
318
.38
18.8
819
.81
19.4
431
.75
34.2
934
.49
34.9
4F
eO0.
020.
000.
140.
170.
000.
050.
080.
240.
140.
030.
000.
060.
190.
190.
120.
001.
680.
270.
280.
28M
nO0.
000.
000.
000.
000.
040.
140.
000.
020.
000.
000.
000.
040.
070.
000.
000.
000.
100.
060.
030.
02M
gO0.
000.
020.
000.
000.
000.
010.
020.
010.
050.
000.
010.
000.
010.
000.
010.
000.
130.
010.
000.
00C
aO0.
100.
336.
580.
020.
057.
446.
340.
220.
256.
210.
050.
100.
000.
030.
120.
0523
.49
17.8
918
.02
18.0
7N
a 2O
11.4
412
.61
8.51
12.0
711
.70
7.44
8.25
11.9
611
.69
8.14
11.2
311
.54
0.11
0.17
11.5
711
.68
0.10
1.36
1.38
1.48
K2O
0.04
0.34
0.11
0.02
0.07
0.06
0.15
0.08
0.13
0.11
0.04
0.11
15.6
615
.86
0.05
0.06
0.01
0.01
0.01
0.00
Cl
0.06
0.81
0.02
0.02
0.08
0.00
0.00
0.00
0.17
0.02
0.02
0.02
0.02
0.03
0.00
0.00
0.02
0.00
0.00
0.01
Cr 2
O3
0.05
0.00
0.05
0.04
0.00
0.13
0.07
0.00
0.00
0.00
0.06
0.00
0.00
0.00
0.00
0.04
0.01
0.00
0.00
0.00
Tota
l10
0.38
99.1
099
.01
101.
5110
0.00
100.
5210
0.55
99.2
798
.35
98.0
710
0.07
101.
0298
.25
99.0
410
0.75
100.
4498
.32
100.
3510
0.66
100.
89S
i6.
005.
915.
176.
005.
985.
285.
455.
905.
845.
315.
995.
995.
975.
945.
986.
014.
194.
284.
274.
23A
l2.
002.
092.
832.
002.
022.
722.
552.
102.
162.
692.
012.
022.
032.
072.
021.
993.
823.
723.
733.
78Ti
0.00
0.00
0.00
0.00
0.00
0.01
0.00
0.01
0.01
0.00
0.00
0.00
0.00
0.00
0.00
0.00
0.00
0.00
0.00
0.00
Fe2
0.00
0.00
0.01
0.01
0.00
0.00
0.01
0.02
0.01
0.00
0.00
0.00
0.02
0.02
0.01
0.00
0.14
0.02
0.02
0.02
Mn
0.00
0.00
0.00
0.00
0.00
0.01
0.00
0.00
0.00
0.00
0.00
0.00
0.01
0.00
0.00
0.00
0.01
0.00
0.00
0.00
Mg
0.00
0.00
0.00
0.00
0.00
0.00
0.00
0.00
0.01
0.00
0.00
0.00
0.00
0.00
0.00
0.00
0.02
0.00
0.00
0.00
Ca
0.01
0.03
0.64
0.00
0.00
0.71
0.60
0.02
0.02
0.61
0.01
0.01
0.00
0.00
0.01
0.00
2.57
1.77
1.77
1.78
Na
1.93
2.21
1.50
2.02
1.98
1.29
1.42
2.06
2.03
1.44
1.89
1.93
0.02
0.03
1.94
1.97
0.02
0.24
0.25
0.26
K0.
010.
040.
010.
000.
010.
010.
020.
010.
020.
010.
010.
011.
871.
880.
010.
010.
000.
000.
000.
00C
atio
ns9.
9410
.29
10.1
610
.04
10.0
010
.02
10.0
510
.11
10.0
910
.06
9.91
9.96
9.92
9.93
9.97
9.98
10.7
610
.04
10.0
510
.07
X8.
008.
008.
008.
008.
008.
018.
008.
018.
018.
008.
008.
008.
008.
008.
008.
008.
008.
008.
008.
00Z
1.94
2.29
2.16
2.04
2.00
2.02
2.05
2.11
2.08
2.06
1.90
1.96
1.91
1.93
1.97
1.98
2.76
2.04
2.04
2.06
Ab
99.2
096
.90
69.6
099
.80
99.4
064
.20
69.6
098
.60
98.1
069
.90
99.5
098
.90
1.10
1.60
99.1
099
.40
0.80
12.1
012
.20
12.9
0A
n0.
501.
4029
.80
0.10
0.20
35.5
029
.50
1.00
1.20
29.5
00.
300.
500.
000.
200.
600.
2099
.20
87.8
087
.80
87.1
0O
r0.
301.
700.
600.
100.
400.
300.
800.
400.
700.
600.
300.
6098
.90
98.3
00.
300.
400.
000.
100.
000.
00
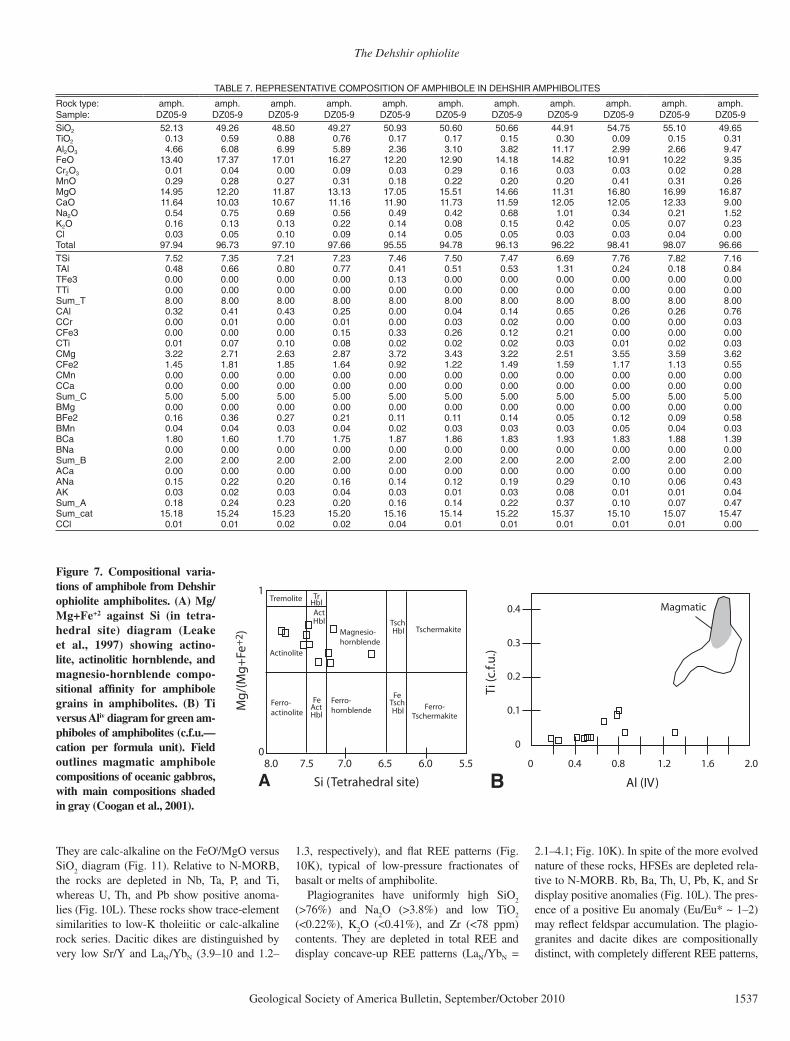
The Dehshir ophiolite
Geological Society of America Bulletin, September/October 2010 1537
They are calc-alkaline on the FeOt/MgO versus SiO
2 diagram (Fig. 11). Relative to N-MORB,
the rocks are depleted in Nb, Ta, P, and Ti, whereas U, Th, and Pb show positive anoma-lies (Fig. 10L). These rocks show trace-element similarities to low-K tholeiitic or calc-alkaline rock series. Dacitic dikes are distinguished by very low Sr/Y and LaN/YbN (3.9–10 and 1.2–
1.3, respectively), and fl at REE patterns (Fig. 10K), typical of low-pressure fractionates of basalt or melts of amphibolite.
Plagiogranites have uniformly high SiO2
(>76%) and Na2O (>3.8%) and low TiO
2
(<0.22%), K2O (<0.41%), and Zr (<78 ppm)
contents. They are depleted in total REE and display concave-up REE patterns (LaN/YbN =
2.1–4.1; Fig. 10K). In spite of the more evolved nature of these rocks, HFSEs are depleted rela-tive to N-MORB. Rb, Ba, Th, U, Pb, K, and Sr display positive anomalies (Fig. 10L). The pres-ence of a positive Eu anomaly (Eu/Eu* ~ 1–2) may refl ect feldspar accumulation. The plagio-granites and dacite dikes are compositionally distinct, with completely different REE patterns ,
Si (Tetrahedral site)
Mg
/(M
g+
Fe+
2 )
TschermakiteTschHblMagnesio-
hornblende
ActHbl
HblTrTremolite
Actinolite
Ferro-actinolite
Ferro-hornblende
FeTschHbl
TschermakiteFerro-Act
Hbl
Fe
8.0 7.5 7.0 6.5 6.0 5.5 0
1
A Al (IV)
Ti (c
.f.u
.)
0
0.1
0.2
0.3
0.4
0 0.4 0.8 1.2 1.6 2.0
Magmatic
B
Figure 7. Compositional varia-tions of amphibole from Dehshir ophiolite amphibolites. (A) Mg/Mg+Fe+2 against Si (in tetra-hedral site) diagram (Leake et al., 1997) showing actino-lite, actinolitic hornblende, and magnesio-hornblende compo-sitional affi nity for amphibole grains in amphibolites. (B) Ti versus Aliv diagram for green am-phiboles of amphibolites (c.f.u.—cation per formula unit). Field outlines magmatic amphibole compositions of oceanic gabbros, with main compositions shaded in gray (Coogan et al., 2001).
TABLE 7. REPRESENTATIVE COMPOSITION OF AMPHIBOLE IN DEHSHIR AMPHIBOLITES
Rock type: amph. amph. amph. amph. amph. amph. amph. amph. amph. amph. amph.Sample: DZ05-9 DZ05-9 DZ05-9 DZ05-9 DZ05-9 DZ05-9 DZ05-9 DZ05-9 DZ05-9 DZ05-9 DZ05-9SiO2 52.13 49.26 48.50 49.27 50.93 50.60 50.66 44.91 54.75 55.10 49.65TiO2 0.13 0.59 0.88 0.76 0.17 0.17 0.15 0.30 0.09 0.15 0.31Al2O3 4.66 6.08 6.99 5.89 2.36 3.10 3.82 11.17 2.99 2.66 9.47FeO 13.40 17.37 17.01 16.27 12.20 12.90 14.18 14.82 10.91 10.22 9.35Cr2O3 0.01 0.04 0.00 0.09 0.03 0.29 0.16 0.03 0.03 0.02 0.28MnO 0.29 0.28 0.27 0.31 0.18 0.22 0.20 0.20 0.41 0.31 0.26MgO 14.95 12.20 11.87 13.13 17.05 15.51 14.66 11.31 16.80 16.99 16.87CaO 11.64 10.03 10.67 11.16 11.90 11.73 11.59 12.05 12.05 12.33 9.00Na2O 0.54 0.75 0.69 0.56 0.49 0.42 0.68 1.01 0.34 0.21 1.52K2O 0.16 0.13 0.13 0.22 0.14 0.08 0.15 0.42 0.05 0.07 0.23
00.040.030.030.050.050.041.090.001.050.030.0lCTotal 97.94 96.73 97.10 97.66 95.55 94.78 96.13 96.22 98.41 98.07 96.66
61.728.767.796.674.705.764.732.712.753.725.7iST48.081.042.013.135.015.014.077.008.066.084.0lAT
TFe3 0.00 0.00 0.00 0.00 0.13 0.00 0.00 0.00 0.00 0.00 0.0000.000.000.000.000.000.000.000.000.000.000.0iTT
Sum_T 8.00 8.00 8.00 8.00 8.00 8.00 8.00 8.00 8.00 8.00 8.0067.062.062.056.041.040.000.052.034.014.023.0lAC
CCr 0.00 0.01 0.00 0.01 0.00 0.03 0.02 0.00 0.00 0.00 0.03CFe3 0.00 0.00 0.00 0.15 0.33 0.26 0.12 0.21 0.00 0.00 0.00
30.020.010.030.020.020.020.080.001.070.010.0iTCCMg 3.22 2.71 2.63 2.87 3.72 3.43 3.22 2.51 3.55 3.59 3.62CFe2 1.45 1.81 1.85 1.64 0.92 1.22 1.49 1.59 1.17 1.13 0.55CMn 0.00 0.00 0.00 0.00 0.00 0.00 0.00 0.00 0.00 0.00 0.00CCa 0.00 0.00 0.00 0.00 0.00 0.00 0.00 0.00 0.00 0.00 0.00Sum_C 5.00 5.00 5.00 5.00 5.00 5.00 5.00 5.00 5.00 5.00 5.00BMg 0.00 0.00 0.00 0.00 0.00 0.00 0.00 0.00 0.00 0.00 0.00BFe2 0.16 0.36 0.27 0.21 0.11 0.11 0.14 0.05 0.12 0.09 0.58BMn 0.04 0.04 0.03 0.04 0.02 0.03 0.03 0.03 0.05 0.04 0.03BCa 1.80 1.60 1.70 1.75 1.87 1.86 1.83 1.93 1.83 1.88 1.39BNa 0.00 0.00 0.00 0.00 0.00 0.00 0.00 0.00 0.00 0.00 0.00Sum_B 2.00 2.00 2.00 2.00 2.00 2.00 2.00 2.00 2.00 2.00 2.00ACa 0.00 0.00 0.00 0.00 0.00 0.00 0.00 0.00 0.00 0.00 0.00ANa 0.15 0.22 0.20 0.16 0.14 0.12 0.19 0.29 0.10 0.06 0.43
40.010.010.080.030.010.030.040.030.020.030.0KASum_A 0.18 0.24 0.23 0.20 0.16 0.14 0.22 0.37 0.10 0.07 0.47Sum_cat 15.18 15.24 15.23 15.20 15.16 15.14 15.22 15.37 15.10 15.07 15.47
10.0lCC 0.01 0.02 0.02 0.04 0.01 0.01 0.01 0.01 0.01 0.00
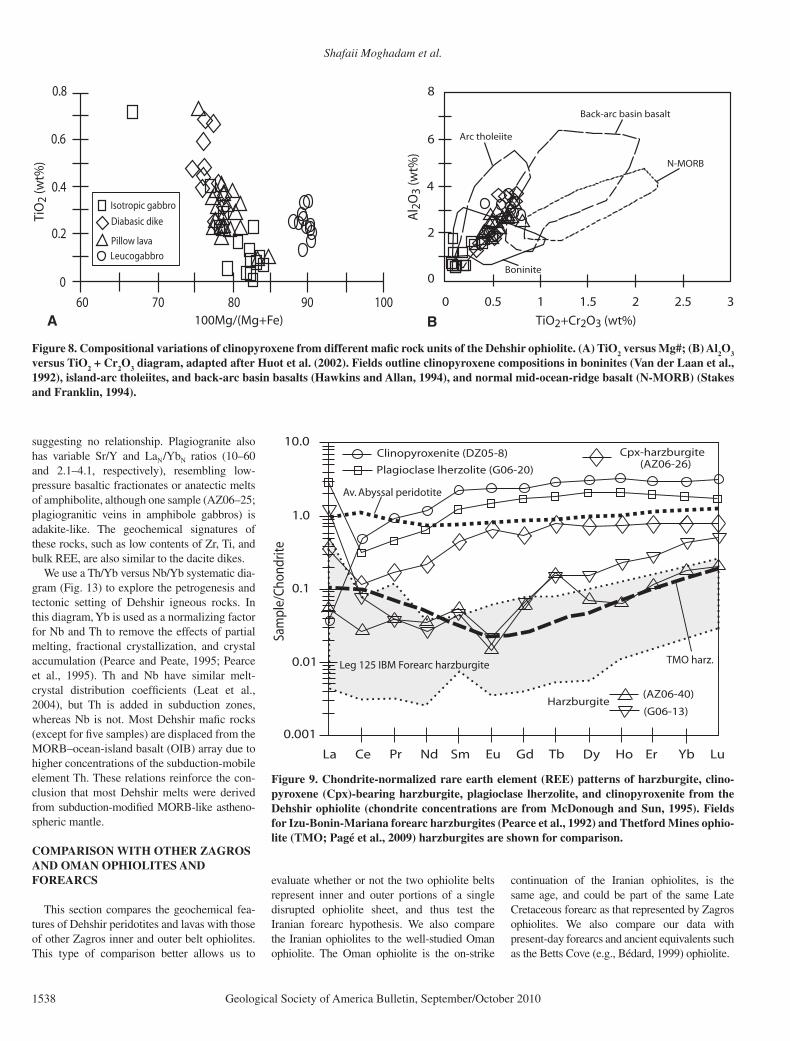
Shafaii Moghadam et al.
1538 Geological Society of America Bulletin, September/October 2010
suggesting no relationship. Plagiogranite also has variable Sr/Y and LaN/YbN ratios (10–60 and 2.1–4.1, respectively), resembling low-pressure basaltic fractionates or anatectic melts of amphibolite, although one sample (AZ06–25; plagiogranitic veins in amphibole gabbros) is adakite-like. The geochemical signatures of these rocks, such as low contents of Zr, Ti, and bulk REE, are also similar to the dacite dikes.
We use a Th/Yb versus Nb/Yb systematic dia-gram (Fig. 13) to explore the petrogenesis and tectonic setting of Dehshir igneous rocks. In this diagram, Yb is used as a normalizing factor for Nb and Th to remove the effects of partial melting, fractional crystallization, and crystal accumulation (Pearce and Peate, 1995; Pearce et al., 1995). Th and Nb have similar melt-crystal distribution coeffi cients (Leat et al., 2004), but Th is added in subduction zones, whereas Nb is not. Most Dehshir mafi c rocks (except for fi ve samples) are displaced from the MORB–ocean-island basalt (OIB) array due to higher concentrations of the subduction-mobile element Th. These relations reinforce the con-clusion that most Dehshir melts were derived from subduction-modifi ed MORB-like astheno-spheric mantle.
COMPARISON WITH OTHER ZAGROS AND OMAN OPHIOLITES AND FOREARCS
This section compares the geochemical fea-tures of Dehshir peridotites and lavas with those of other Zagros inner and outer belt ophiolites. This type of comparison better allows us to
evaluate whether or not the two ophiolite belts represent inner and outer portions of a single disrupted ophiolite sheet, and thus test the Iranian forearc hypothesis. We also compare the Iranian ophiolites to the well-studied Oman ophiolite. The Oman ophiolite is the on-strike
continuation of the Iranian ophiolites, is the same age, and could be part of the same Late Cretaceous forearc as that represented by Zagros ophio lites. We also compare our data with present-day forearcs and ancient equivalents such as the Betts Cove (e.g., Bédard, 1999) ophiolite.
60 70 80 90 100100Mg/(Mg+Fe)
0
0.2
0.4
0.6
0.8
TiO
2 (w
t%)
Leucogabbro
Pillow lava
Diabasic dike
Isotropic gabbro
0 0.5 1 1.5 2 2.5 3
TiO2+Cr2O3 (wt%)
Al 2
O3
(wt%
)
0
2
4
6
8
N-MORB
Back-arc basin basalt
Arc tholeiite
Boninite
A B
Figure 8. Compositional variations of clinopyroxene from different mafi c rock units of the Dehshir ophiolite. (A) TiO2 versus Mg#; (B) Al2O3 versus TiO2 + Cr2O3 diagram, adapted after Huot et al. (2002). Fields outline clinopyroxene compositions in boninites (Van der Laan et al., 1992), island-arc tholeiites, and back-arc basin basalts (Hawkins and Allan, 1994), and normal mid-ocean-ridge basalt (N-MORB) (Stakes and Franklin, 1994).
La Ce Pr Nd Sm Eu Gd Tb Dy Ho Er Yb Lu
0.01
0.1
1.0
10.0
Sam
ple/
Chon
drite
Clinopyroxenite (DZ05-8)
Plagioclase lherzolite (G06-20)
Harzburgite(AZ06-40)
(G06-13)
Cpx-harzburgite(AZ06-26)
0.001
Av. Abyssal peridotite
Leg 125 IBM Forearc harzburgite TMO harz.
Figure 9. Chondrite-normalized rare earth element (REE) patterns of harzburgite, clino-pyroxene (Cpx)-bearing harzburgite, plagioclase lherzolite, and clinopyroxenite from the Dehshir ophiolite (chondrite concentrations are from McDonough and Sun, 1995). Fields for Izu-Bonin-Mariana forearc harzburgites (Pearce et al., 1992) and Thetford Mines ophio-lite (TMO; Pagé et al., 2009) harzburgites are shown for comparison.
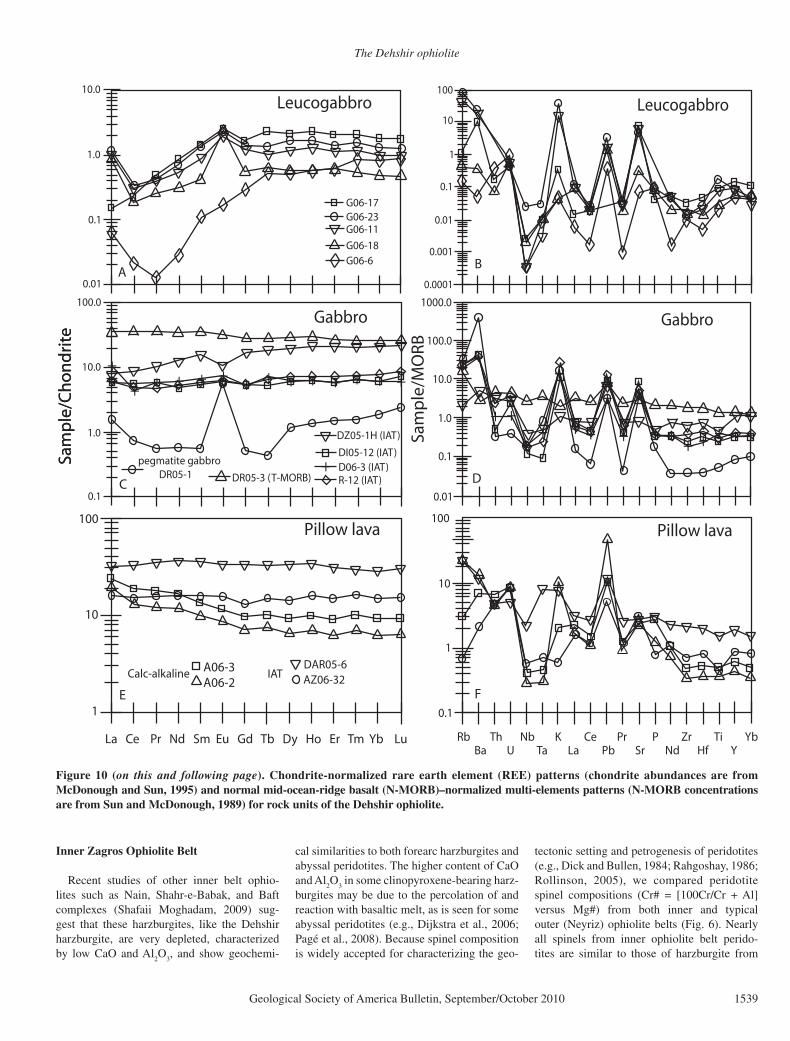
The Dehshir ophiolite
Geological Society of America Bulletin, September/October 2010 1539
Inner Zagros Ophiolite Belt
Recent studies of other inner belt ophio-lites such as Nain, Shahr-e-Babak, and Baft complexes (Shafaii Moghadam, 2009) sug-gest that these harzburgites, like the Dehshir harz burgite, are very depleted, characterized by low CaO and Al
2O
3, and show geochemi-
cal similarities to both forearc harzburgites and abyssal peridotites. The higher content of CaO and Al
2O
3 in some clinopyroxene-bearing harz-
burgites may be due to the percolation of and reaction with basaltic melt, as is seen for some abyssal peridotites (e.g., Dijkstra et al., 2006; Pagé et al., 2008). Because spinel composition is widely accepted for characterizing the geo-
tectonic setting and petrogenesis of peridotites (e.g., Dick and Bullen, 1984; Rahgo shay, 1986; Rollinson, 2005), we compared peridotite spinel compositions (Cr# = [100Cr/Cr + Al] versus Mg#) from both inner and typical outer (Neyriz) ophiolite belts (Fig. 6). Nearly all spinels from inner ophiolite belt perido-tites are similar to those of harzburgite from
0.01
0.1
1.0
10.0
Leucogabbro
G06-6
G06-17
G06-18
G06-23G06-11
0.0001
0.001
0.01
0.1
1
10
100
Leucogabbro
0.1
1.0
10.0
100.0
+++++++++++++
++
Gabbro
pegmatite gabbroDR05-1
+
DZ05-1H (IAT)
DI05-12 (IAT)D06-3 (IAT)R-12 (IAT)DR05-3 (T-MORB)
+ + + + +++
+
+
+
++
+
++
++
++
Gabbro
0.01
0.1
1.0
10.0
100.0
1000.0
La Ce Pr Nd Sm Eu Gd Tb Dy Ho Er Tm Yb Lu
1
10
100Pillow lava
A06-2A06-3Calc-alkaline IAT AZ06-32
DAR05-6
Rb Th Nb K Ce Pr P Zr Ti YbBa U Ta La Pb Sr Nd Hf Y
0.1
1
10
100Pillow lava
AB
C D
E F
Sam
ple
/Ch
on
dri
teSa
mp
le/C
ho
nd
rite
Sam
ple
/MO
RB
Figure 10 (on this and following page). Chondrite-normalized rare earth element (REE) patterns (chondrite abundances are from McDonough and Sun, 1995) and normal mid-ocean-ridge basalt (N-MORB)–normalized multi-elements patterns (N-MORB concentrations are from Sun and McDonough, 1989) for rock units of the Dehshir ophiolite.

Shafaii Moghadam et al.
1540 Geological Society of America Bulletin, September/October 2010
intraoceanic forearcs, such as Izu-Bonin-Mariana and South Sandwich forearcs (Fig. 6), although some Dehshir harzburgite spinels plot with abyssal (MORB) peridotite.
It has been demonstrated that Al2O
3 content
in orthopyroxene and clinopyroxene of residual harzburgite is sensitive to the extent of partial melting and thus tectonic environment (e.g.,
Dick and Bullen, 1984; Michael and Bonatti, 1985), because Al behaves as a moderately in-compatible element during mantle melting and is progressively depleted during partial melting (Niu and Hékinian, 1997). Orthopyroxene and clinopyroxene porphyroclasts of other inner ophiolite belt harzburgites are also depleted in Al
2O
3, resembling those of harzburgites from
Izu-Bonin-Mariana and South Sandwich fore-arcs (Fig. 5A).
Dehshir lavas have geochemical signatures similar to those of other inner ophiolite belt lavas . Nearly all of these fall into island-arc tholeiitic and boninite fi elds on a Ti-V diagram, similar to both depleted Lasail lavas (V
2 lavas)
of Oman and as Izu-Bonin-Mariana forearc
Figure 10 (continued).
0.01
0.1
1
10
100Basaltic-andesitic rocks
1
10
100Basaltic-andesitic rocks
DR05-2A lava
AZ06-38 basaltic dikesheeted dike complex
DAR05-5 lava
DZ05-1D andesitic dikein amphibole gabbro
D06-10 lava
0.1
1
10
100
Sam
ple
/N-M
OR
B
Diabasic dikes
1
10
100
Sam
ple
/Ch
on
dri
te
Diabasic dikesA06-1
DAR05-3Calc-alkaline
G06-16DARo5-4
DZ05-4IAT
AZ06-29Boninite
La Ce Pr Nd Sm Eu Gd Tb Dy Ho Er Tm Yb Lu
1
10
100
AZ06-8AZ06-11
AZ06-31AZ06-36
Dacitic dikesSheeted dike cmplx
0.01
0.1
1
10
100
Rb Th Nb K Ce Pr P Zr Ti YbBa U Ta La Pb Sr Nd Hf Y
Amphibolite (DZ05-9)
plagiogranite (DZ05-6)plagiogranite (AZ06-25)
G H
I J
K L

The Dehshir ophiolite
Geological Society of America Bulletin, September/October 2010 1541
boninites , with some exceptions showing af-fi nity to MORB (Figs. 14A and 14C). Dehshir lavas also are similar to other inner belt ophi-olitic lavas in terms of nearly fl at REE patterns and trace-elements patterns with similar spikes in LILEs, Pb, and Sr and depletions in Nb and Ta (Figs. 15A and 15B). The lavas with low REE abundances are also distinguished by very low HFSE contents relative to N-MORB, sug-gesting similarity to boninitic melts produced by melting of highly depleted mantle. Barring unusually systematic alteration, the similarity in positive spikes for both Dehshir lavas and other inner belt ophiolites shows participation of slab-derived fl uids in the mantle wedge (Fig. 15B).
Similar to Oman ophiolitic lavas, Dehshir lavas show two trends: (1) some have REE pat-terns similar to Geotimes (V1; lower sequence) lavas, consistent with tholeiitic affi nities (Fig. 15E), and (2) others have depleted REE pat-terns similar to Lasail (V2; upper sequence units) lavas, showing a more arc-like source (Fig. 15E). However, Dehshir depleted lavas are more depleted in HREE and HFSE compared to Lasail lavas, suggesting a highly refractory source, such as that responsible for Izu-Bonin-Mariana and Betts Cove boninites (Fig. 15G). A highly depleted residue was also suggested for generation of Izu-Bonin-Mariana and Betts Cove fore-arc boninites (e.g., Pearce et al., 1992; Bédard, 1999).
Outer Zagros Ophiolite Belt
Among outer belt ophiolites, only the Neyriz ophiolite has been studied in suffi cient detail to be useful here. Whole-rock compositions of
40 45 50 55 60 65 70 75
SiO2 (wt%)
0
1
2
3
4
5
FeO
t /M
gO
high-Fe
calc-alkalic
tholeiitic
low-Fe
medium-Fe
Diabase dike
Pillow lava
Lava flow
Dacitic dike
Figure 11. FeOt/MgO versus SiO2 projection (volatile free, normalized to 100% total) for the Dehshir mafi c rocks and dacitic dikes. Boundaries between tholeiitic and calc-alkaline suites (thin solid line) and between low-, medium-, and high-Fe suites (thick, dashed lines) are from Miyashiro (1974) and Arculus (2003), respectively.
Oman V1
Oman V2
0 5 10 15 20 25
Ti (ppm)/1000
0
100
200
300
400
500
600
)m
pp(
V
Arc tholeiites MORB & BABB
etini
no
B
Diabase dike
Pillow lava
Lava flow
Gabbro
Amphibolite
Figure 12. Ti versus V diagram (after Shervais, 1982) for Dehshir mafi c rocks and amphibolite. Most Dehshir mafi c rocks occupy island-arc tholeiitic (IAT) and boninite (Ti/V < 10) fi elds, although some mafi c rocks fall into MORB/BABB fi eld. For comparison, fi elds for the V1 (lower, Geotimes unit) and V2 (upper, Lasail unit) lavas of the Oman ophiolite (data from Alabaster et al., 1982) are shown.
0.1 1 10 100 Nb/Yb
0.01
0.1
1.0
bY/hT
10.0
volcanic arc array yarraBIO-BROM
N-MORB
E-MORB
OIB
Diabase dike
Pillow lava
Lava flow
Gabbro
noitc
ud
buS
tne
no
pm
oc
Figure 13. Th/Yb versus Nb/Yb diagram (after Leat et al., 2004) for the Dehshir ophio lite. Most mafic rocks from the Dehshir ophiolite have high Th/Yb and plot above the mantle array near the volcanic arc array, with some exceptions that are mid-ocean-ridge basalt (MORB)–like.

Shafaii Moghadam et al.
1542 Geological Society of America Bulletin, September/October 2010
Neyriz ophiolite peridotites are highly depleted in both CaO (0.25%–0.45%) and Al
2O
3 (0.18%–
0.43%) (Jannessary, 2003). Orthopyroxenes in both porphyroclastic and granoblastic harz-burgites are also depleted in Al
2O
3. Neyriz
harzburgite spinel is characterized by high Cr#, like those from Mariana trench and other forearc peridotites (Fig. 6). All of these characteristics are similar to those of modern (e.g., Izu-Bonin-Mariana ; Pearce et al., 1992) or ancient (e.g., Thetford Mines ophiolite; Pagé et al., 2009) forearc harzburgite. Like inner belt ophiolites,
Neyriz ophiolite basalts, diabasic dikes, andesites , dacites, and rhyolites show spikes in LILEs and depletions in HFSEs and HREEs (Fig. 15D). Neyriz ophiolite lavas generally have higher Ti/V than Dehshir lavas, falling mostly in the MORB-BABB (Back-Arc Basin Basalt) fi eld (Fig. 14B). Many Dehshir lavas are more depleted in HREE and HFSE relative to Neyriz lavas (Fig. 15D). Compositionally, the Neyriz lavas are interme-diate between tholeiitic lavas of the Oman Geo-times unit and depleted lavas of the Lasail unit (Figs. 14B, 15E, and 15F).
TECTONIC SETTING OF DEHSHIR AND OTHER SW IRANIAN OPHIOLITES
Considered together, our data for the Dehshir ophiolite, and the similarity of these results to those for Iranian inner and outer belt ophio-lites along with the better studied Troodos and Oman ophiolites, compel the conclusion that a long, broad, and continuous tract of oceanic lithosphere was created at about the same time during the Late Cretaceous along the southern
B
0 5 10 15 20 250
100
200
300
400
500
600
etininoB
Nain lavas
Dehshir lavas
Shahr-e-Babak lavas
Baft lavas
Oman V1
Oman V2
0 5 10 15 20 250
100
200
300
400
500
600 Neyriz lavas with 47%<SiO2<78%
Dehshir mafic rocks
A Arc tholeiites
)mpp(
V
MORB & BABB
0 5 10 15 20 250
100
200
300
400
500
600 IBM forearc boninite
Dehshir mafic rocks
C
Ti (ppm)/1000
)mpp(
V
Betts Cove boninite
Figure 14. (A) Comparison of Ti/V for Dehshir ophiolite lavas with other inner belt ophiolitic lavas (data from Shafaii Moghadam, 2009), (B) with lavas from a typical outer belt ophiolite, the Neyriz ophiolite (data from Jannessary, 2003), and (C) with boninites from Izu-Bonin-Mariana forearc (Pearce et al., 1992) and Betts Cove ophiolites (Bédard, 1999). Nearly all lavas from the inner ophiolitic belt plot in island-arc tholeiitic (IAT) and boninite fi elds, while the Neyriz lavas are distinguished by higher, mid-ocean-ridge basalt (MORB)–like Ti/V.

The Dehshir ophiolite
Geological Society of America Bulletin, September/October 2010 1543
Neyriz lavas
1
10
100
etirdnohC/elpmaS
Comparison of Dehshir lavas with lavas from the outer Zagros ophiolitic belt
1
10
100 Comparison of Dehshir lavas with lavas from the inner Zagros ophiolitic belt
Nain pillow lavasShahr-e-Babak pillow lavas
Baft basaltic rocks
0.01
0.1
1
10
100
BRO
M-N/elpmaS
0.01
0.1
1
10
100
A B
C D
0.01
0.1
1
10
100
E FGeotimes lavas (lower)
Lasail lavas (upper)
1
10
100 Comparison of Dehshir lavas with Oman ophiolite lavas
0.01
0.1
1
10
100
Rb Th Nb K Ce Pr P Zr Ti YbBa U Ta La Pb Sr Nd Hf Y
G H
La Ce Pr Nd Sm Eu Gd Tb Dy Ho Er Tm Yb Lu
1
10
100 Comparison of Dehshir lavas with IBM and Betts Cove
forearc/ophiolite boninitesIBM forearc boninites
Betts Cove boninites
Av. BC boninites
Figure 15. Chondrite-normalized rare earth element (REE; left) and normal (N) mid-ocean-ridge basalt–normalized (MORB; right) trace-elements patterns of Dehshir ophiolitic lavas and diabasic dikes injected into peridotite, compared with lavas from other inner ophiolite belt (A, B), outer ophiolite belt (C, D), Geotimes and Lasail units of Oman ophiolite (E, F) and Izu-Bonin-Mariana (IBM) forearc and Betts Cove ophiolite boninites (G, H; see text for more detail). Data are after Jannessary (2003) for the Neyriz ophiolite, after Alabaster et al. (1982) and Godard et al. (2003) for Oman lavas, and from Pearce et al. (1992) and Pagé et al. (2009) for Izu-Bonin-Mariana forearc and Betts Cove (BC) ophiolite boninites, respectively.

Shafaii Moghadam et al.
1544 Geological Society of America Bulletin, September/October 2010
margin of Eurasia. This tract extended beyond Iran through Syria and Turkey as far as Cyprus to the west and Oman and perhaps Pakistan to the east. The similarity of ages for igneous rocks and overlying sediments, both along (from Cy-prus to Oman) and across (inner to outer belt) the ophiolite belt indicates that a successful model should explain all of these occurrences.
All components of the Dehshir and other ophio-lites of this belt show strong suprasubduction-zone affi nities, from harzburgitic mantle to lavas . Most volcanic sections have mixtures of arc-like and MORB-like compositions, usually MORB-like at the base and arc-like at the top. Mid-ocean-ridge–like basalts do not require a mid-ocean-ridge tectonic environment be-cause such lavas are not diagnostic of tectonic environment, only that asthenospheric mantle melted to ~10%–20% due to decompression. A two-phase tectonic model would be required if there was evidence for a signifi cant hiatus between MOR-like lower basalts and arc-like upper basalts, but this is nowhere reported. In-stead, the volcanic succession appears to refl ect progressive depletion of originally fertile mantle due to increased water fl ux when the founder-ing lithosphere reached a certain depth and true subduction started. This interpretation is consis-tent with results of recent Shinkai 6500 diving on the inner trench wall of the Mariana Trench, which found MORB-like basalts, interpreted as fi rst-stage melts of asthenospheric mantle when subduction started there in Eocene time (Ohara et al., 2008). This inference precludes models calling for the Dehshir and other SW Iranian ophiolites to have formed at a normal mid-ocean ridge, a small Red Sea–like basin, or anywhere except at a strongly extensional, incipient con-vergent margin. This is consistent with the ob-servation that Zagros ophiolites formed when relative plate motions in the region changed dra-matically (Garfunkel, 2006).
The important remaining questions become: (1) where exactly in an intraoceanic arc system did these ophiolites form, arc, back-arc basin, or forearc? (2) Did these ophiolites largely form in place adjacent to the southern margin of Eurasia (autochthonous or para-autochthonous) or are they far-traveled, exotic fragments of oceanic lithosphere (allochthonous)? Given that supra-subduction-zone ophiolites form by seafl oor spreading at a convergent margin, this could be either a back-arc basin or a forearc during the earliest stages of subduction (Pearce, 2003). Lava compositions do not distinguish between these options, although boninites are rare in back-arc basins (Bédard et al., 1998). Peridotite compositions do serve to distinguish between forearc and back-arc settings. Dehshir and other SW Iranian ophiolitic peridotites include ultra-
depleted harzburgites that today are only found in modern intraoceanic forearcs. At some point in their evolution, the shallow upper mantle beneath the forearcs experienced much more extensive melting—to the point of clinopyrox-ene exhaustion—than is found anywhere else in present-day Earth (Bonatti and Michael, 1989; Neumann and Simon, 2009). Because modern forearcs are cold and incapable of generat-ing melts, this catastrophic melting must have occurred under very special conditions, most likely when subduction began. A much larger volume of magma is produced when a subduc-tion zone fi rst forms than for mature arcs (Stern and Bloomer, 1992; Jicha et al., 2006). Such large volumes of melt generation require re-sidual peridotites to be unusually depleted. This is consistent with the observation that boninites and very depleted tholeiitic basalts are produced during subduction initiation and are common in the well-exposed Izu-Bonin-Mariana forearc (Stern, 2004).
The interpretation that Dehshir and other Zagros ophiolites formed in a back-arc basin also meets tectonic diffi culties because there is no obvious associated arc. Any such arc to the north requires S-dipping subduction, collision with Eurasia sometime after 90 Ma, and reversal of subduction polarity, for which there is no evi-dence. Alternatively, an arc to the SW, overlying a N-dipping subduction zone, must have been completely obliterated. There is no evidence that anything like either of these scenarios hap-pened. Instead, the SW Iranian ophiolites today lie in a forearc position, which is most simply explained as being forearc crust preserved in situ since Late Cretaceous time.
The preferred scenario, whereby a broad tract of ophiolites formed along the southern mar-gin of Eurasia during a subduction initiation event, is summarized for Dehshir, SW Iranian ophiolites, and other Late Cretaceous ophiolites from Cyprus to Oman in Figure 16. This inter-pretation answers the second question as well:
Figure 16. Generation of SW Iranian ophio lites as part of a forearc formed during subduc-tion initiation, modifi ed for the Late Cretaceous evolution of southern Eurasia after Stern (2004). Left panels are sections perpendicular to the evolv-ing plate boundary, and right panels are map views. (A–B) Initial (>95 Ma) confi guration. Two lithospheres of differing density (buoyant Eurasia, dense Tethys) are juxtaposed across a transform fault or fracture zone. (C–D) Old, dense lithosphere sinks asymmetrically, with maxi mum subsidence nearest the transform fault or fracture zone. Asthenosphere migrates over the sinking lithosphere and propagates in directions that are both orthogonal to the original trend of the transform/fracture zone as well as in both directions parallel to it. Strong extension in the region above the sinking lithosphere leads to seafl oor spreading, forming infant arc crust of the proto-forearc. This is when the Dehshir ophiolite and other SW Iranian ophiolites form, ca. 93 Ma. (D) This panel shows that this process is asynchronous along the margin; ophiolite ages indicate that subduction propagated from E (Oman) to W (Cyprus) between 95 and 90 Ma. (E–F) Beginning of downdip motion of the lithosphere marks the beginning of true subduction (<90 Ma). Strong extension in the forearc and trenchward migration of asthenosphere ends, cooling the subforearc mantle, which becomes forearc lithosphere; further addition of water leads only to serpentinization. The locus of igneous activity retreats ~200 km away from the trench, to the region where asthenospheric advection continues, forming the Urumieh-Dokhtar arc. This forearc today defi nes the Oman (Om), SW Iran (SI), and Cyprus (Cy) ophiolites.
Eurasia(buoyant)
Transform or fracture zone
Spreading(proto-forearc)
Retreatinghinge
Urumieh-DokhtarArc
SW Iran ophiolites (forearc)
OB
Sinking
True subduction
A
C
>95 Ma
90–95 Ma
E<90 Ma
Tethys
B
D
F
Eurasia
Tethys(dense)
OBIB
Om
SI
Cy
N S

The Dehshir ophiolite
Geological Society of America Bulletin, September/October 2010 1545
these ophiolites formed essentially where they are today, attached to the southern margins of Eurasia. They are not far-traveled, exotic frag-ments of oceanic lithosphere but are partially preserved fragments of an oceanic forearc that formed when subduction began along the south-ern margin of Eurasia, ca. 95 Ma.
CONCLUSIONS
The Dehshir ophiolite is an important ele-ment within the Inner Zagros ophiolite belt. Along with other Zagros ophiolites, Dehshir represents autochthonous forearc lithosphere that formed by seafl oor spreading along the southern margin of Eurasia during Late Creta-ceous time. This forearc crust was once continu-ous, both across the two belts as well as from Cyprus to Oman. This forearc has been dis-rupted by continued shortening, especially since collision began with Arabia in Miocene time, as well as by underplating beneath the forearc and subsequent exhumation of the underplate to form the Sanandaj-Sirjan zone. Zagros ophio-lites and correlatives from Cyprus to Oman con-stitute a tract of oceanic lithosphere that formed along the southern margin of Eurasia during a subduction initiation event. Since that event, the Zagros orogen has evolved as a convergent plate margin, with the Persian Gulf representing a fi lled trench, the Zagros fold-and-thrust belt rep-resenting an accretionary prism that continues to grow, and the Urumeih-Dokhtar magmatic complex representing a waning magmatic arc. This interpretation provides a robust and simple framework for understanding the tectonic evolu-tion of the region.
ACKNOWLEDGMENTS
This study was supported fi nancially by the French Centre National de la Recherche Scientifi que (CNRS) (contribution of the UMR 7516 “Institut de Physique du Globe,” Strasbourg, France), and the Cultural Service of the French Embassy at Tehran. We are deeply indebted to Sixte Blanchy, Christian Duhamel, and Hubert Whitechurch for their assistance. R. Boutin at Universite de Louis Pasteur greatly contributed to the whole-rock analyses. Finally, we are very grateful to Réjean Hébert and Jean Bédard for their construc-tive reviews of the manuscript. Editorial suggestions by J. Brendan Murphy and Yildirim Dilek are highly appreciated.
REFERENCES CITED
Agard, P., Monie, P., Gerber, W., Omrani, J., Molinaro, M., Meyer, B., Labrousse, L., Vrielynck, B., Jolivet, L., and Yamato, P., 2006, Transient, synobduction exhumation of Zagros blueschists inferred from P-T, deformation, time, and kinematic constraints: Implications for Neo-Tethyan wedge dynamics: Journal of Geophysical Re-search, v. 111, p. B11401, doi: 10.1029/2005JB004103.
Alabaster, T., Pearce, J.A., and Malpas, J., 1982, The vol-canic stratigraphy and petrogenesis of the Oman ophio-lite: Contributions to Mineralogy and Petrology, v. 81, p. 168–183, doi: 10.1007/BF00371294.
Alavi, M., 1994, Tectonic of the Zagros orogenic belt of Iran: New data and interpretations: Tectonophysics, v. 229, p. 211–238, doi: 10.1016/0040-1951(94)90030-2.
Alavi, M., 2004, Regional stratigraphy of the Zagros fold-thrust belt of Iran and its proforeland evolution: Ameri-can Journal of Science, v. 304, p. 1–20, doi: 10.2475/ajs.304.1.1.
Amidi, S.M., Emami, M.H., and Michel, R., 1984, Alkaline character of Eocene volcanism in the middle part of Iran and its geodynamic situation: Geologische Rund-schau, v. 73, p. 917–932, doi: 10.1007/BF01820882.
Arculus, R.J., 2003, Use and abuse of the term calcalkaline and calcalkalic: Journal of Petrology, v. 44, p. 929–935, doi: 10.1093/petrology/44.5.929.
Arvin, M., 1982, Petrology and Geochemistry of Ophio-lites and Associated Rocks from the Zagros Suture, Neyriz, Iran [Ph.D. thesis]: London, London Univer-sity, 299 p.
Arvin, M., and Robinson, P.T., 1994, The petrogenesis and tectonic setting of lavas from the Baft ophiolitic mélange , southwest of Kerman, Iran: Canadian Journal of Earth Sciences, v. 31, p. 824–834.
Arvin, M., and Shokri, E., 1997, Genesis and eruptive envi-ronment of basalts from the Gogher ophiolitic mélange, southwest of Kerman, Iran: Ofi oliti, v. 22, p. 175–182.
Babaie, H.A., Ghazi, A.M., Babaei, A., La Tour, T.E., and Hassanipak, A.A., 2001, Geochemistry of arc volcanic rocks of the Zagros crush zone, Neyriz, Iran: Journal of Asian Earth Sciences, v. 19, p. 61–76, doi: 10.1016/S1367-9120(00)00012-2.
Babaie, A., Babaie, H.A., and Arvin, M., 2005, Tectonic evolution of the Neyriz ophiolite, Iran: An accretionary model: Ofi oliti, v. 30, p. 65–74.
Babaie, H.A., Babaei, A., Ghazi, A.M., and Arvin, M., 2006, Geochemical, 40Ar/39Ar age, and isotopic data for crustal rocks of the Neyriz ophiolite, Iran: Cana-dian Journal of Earth Sciences, v. 43, p. 57–70, doi: 10.1139/e05-111.
Bechennec, F., Le Metour, J., Rabu, D., Bourdilon-de-Grissac , C., de Wever, P., and Villey, M., 1990, The Hawasina Nappes: Stratigraphy, palaeogeography and structural evolution of a fragment of the south-Tethyan passive continental margin: Geological Society of London Special Publication, v. 49, p. 213–223, doi: 10.1144/GSL.SP.1992.049.01.14.
Bédard, J.H., 1999, Petrogenesis of boninites from the Betts Cove ophiolite, Newfoundland, Canada: Identifi cation of subducted source components: Journal of Petrol-ogy, v. 40, p. 1853–1889, doi: 10.1093/petrology/40.12.1853.
Bédard, J.H., Lauzière, K., Tremblay, A., and Sangster, A., 1998, Evidence from Betts Cove ophiolite boninites for forearc seafl oor-spreading: Tectonophysics, v. 284, p. 233–245, doi: 10.1016/S0040-1951(97)00182-0.
Berberian, F., and Berberian, M., 1981, Tectono-plutonic epi sodes in Iran, in Gupta, H.K., and Delany, F.M., eds., Zagros, Hindukush, Himalaya Geodynamic Evolution: Washington, D.C., American Geophysical Union, p. 5–32.
Berberian, F., Muir, I.D., Pankhurst, R.J., and Berberian, M., 1982, Late Cretaceous and early Miocene Andean type plutonic activity in northern Makran and Central Iran: Journal of the Geological Society of London, v. 139, p. 605–614, doi: 10.1144/gsjgs.139.5.0605.
Berberian, M., 1995, Master blind thrust faults hidden under the Zagros folds: Active basement tectonics and sur-face morphotectonics: Tectonophysics, v. 241, p. 193–224, doi: 10.1016/0040-1951(94)00185-C.
Berberian, M., and King, G.C.P., 1981, Towards a paleo-geog raphy and tectonic evolution of Iran: Canadian Journal of Earth Sciences, v. 18, p. 210–265, doi: 10.1139/e81-163.
Bodinier, J.L., Guiraud, M., Fabries, J., Dostal, J., and Dupuy , C., 1987, Petrogenesis of layered pyroxenites from the Lherz, Freychinède and Prades ultramafi c bodies (Ariège, French Pyrenées): Geochimica et Cosmochimica Acta, v. 51, p. 279–290, doi: 10.1016/0016-7037(87)90240-7.
Bodinier, J.L., Vasseur, G., Vemieres, J., Dupuy, C., and Fabries , J., 1990, Mechanisms of mantle metasoma-tism: Geochemical evidence from the Lherz orogenic peridotite: Journal of Petrology, v. 31, p. 597–628.
Bonatti, E., and Michael, P.J., 1989, Mantle peridotites from continental rifts to ocean basins to subduction zones: Earth and Planetary Science Letters, v. 91, p. 297–311, doi: 10.1016/0012-821X(89)90005-8.
Bonev, N., and Stampfl i, G., 2009, Gabbro, plagiogranite and associated dykes in the supra-subduction zone Evros ophiolites, NE Greece: Geological Magazine, v. 146, p. 72–91, doi: 10.1017/S0016756808005396.
Cannat, M., Chatin, F., Whitechurch, H., and Ceuleneer, G., 1997, Gabbroic rocks trapped in the upper mantle at the Mid-Atlantic Ridge, in Karson, J.A., Cannat, M., Miller, D.J., Elthon, D., et al., Proceeding of the Ocean Drilling Program (ODP), Scientifi c Results, Volume 153: College Station, Texas, Ocean Drilling Program, p. 243– 264.
Chen, S., O’Reilly, S.Y., Zhou, X., Griffi n, W.L., Zhang, G., Sun, M., Feng, J., and Zhang, M., 2001, Thermal and petrological structure of the lithosphere beneath Hannuoba, Sino-Korea craton, China: Evidence from xenoliths: Lithos, v. 56, p. 267–301, doi: 10.1016/S0024-4937(00)00065-7.
Coogan, L.A., Wilson, R.N., Gillis, K.M., and MacLeod, C.J., 2001, Near-solidus evolution of oceanic gabbros : Insights from amphibole geochemistry: Geochimica et Cosmochimica Acta, v. 65, p. 4339–4357, doi: 10.1016/S0016-7037(01)00714-1.
Crawford, A.J., Falloon, T.J., and Green, D.H., 1989, Classi-fi cation, petrogenesis and tectonic setting of boninites, in Crawford, A.J., ed., Boninites and Related Rocks: London, Unwin Hyman, p. 1–49.
Davoudzadeh, M., 1972, Geology and Petrography of the Area North of Nain, Central Iran: Geological Survey of Iran Report 14, 89 p.
De Bari, S.M., and Coleman, R.G., 1989, Examination of the deep levels of an island-arc: Evidence from the Tunisia ultramafi c-mafi c assemblage, Tonisia, Alaska: Journal of Geophysical Research, v. 94, p. 4373–4391, doi: 10.1029/JB094iB04p04373.
Delaloye, M., and Desmons, J., 1980, Ophiolites and mélange terranes in Iran: A geochronological study and its paleotectonic implications: Tectonophysics, v. 68, p. 83–111, doi: 10.1016/0040-1951(80)90009-8.
Desmons, J., and Beccaluva, L., 1983, Mid-ocean ridge and island arc affi nities in ophiolites from Iran: Paleo-graphic implications: Chemical Geology, v. 39, p. 39–63, doi: 10.1016/0009-2541(83)90071-2.
Dick, H.J.B., and Bullen, T., 1984, Chromian spinel as a petrogenetic indicator in abyssal and Alpine-type perido tites and spatially associated lavas: Contribu-tions to Mineralogy and Petrology, v. 86, p. 54–76, doi: 10.1007/BF00373711.
Dijkstra, A.H., Brouwer, F.M., Cunningham, W.D., Buchan , C., Badarch, G., and Mason, P.R.D., 2006, Late Neoproterozoic proto-arc ocean crust in the Dariv Range, Western Mongolia: A supra-subduction zone end-member ophiolite: Journal of the Geological So-ciety of London, v. 163, p. 363–373, doi: 10.1144/0016-764904-156.
Dilek, Y., Furnes, H., and Shallo, M., 2007, Suprasubduc-tion zone ophiolite formation along the periphery of Mesozoic Gondwana: Gondwana Research, v. 11, p. 453–475, doi: 10.1016/j.gr.2007.01.005.
Ernewein, M., Pfl umino, C., and Whitechurch, H., 1988, The death of an accretion zone as evidenced by the magmatic history of the Sumail ophiolite (Oman): Tectonophysics, v. 151, p. 247–274, doi: 10.1016/0040-1951(88)90248-X.
Farhoudi, G.H., 1978, A comparison of Zagros geology to island-arcs: The Journal of Geology, v. 86, p. 323–334.
Farhoudi, G., and Karig, D.E., 1977, Makran of Iran and Pakistan as an active arc system: Geology, v. 5, p. 664–668, doi: 10.1130/0091-7613(1977)5<664:MOIAPA>2.0.CO;2.
Fazlnia, A., Schenk, V., Van der Straaten, F., and Mirmo-hammadi, M., 2009, Petrology, geochemistry and geo-chronology of trondhjemites from the Qori complex, Neyriz, Iran: Lithos, v. 112, no. 3–4, p. 413–433.
Floyd, P.A., Yaliniz, M.K., and Goncuoglu, M.C., 1998, Geochemistry and petrogenesis of intrusive and extru-sive ophiolitic plagiogranites, Central Anatolian crys-talline complex, Turkey: Lithos, v. 42, p. 225–241, doi: 10.1016/S0024-4937(97)00044-3.

Shafaii Moghadam et al.
1546 Geological Society of America Bulletin, September/October 2010
Garfunkel, Z., 2006, Neotethyan ophiolites: Formation and obduction within the life cycle of the host basins, in Robertson, A.H.F., and Mountrakis, D., eds., Tectonic development of the Eastern Mediterranean Region: Geological Society of London Special Publication 260, p. 301–326, doi: 10.1144/GSL.SP.2006.260.01.13.
Garrido, C.J., and Bodinier, J.L., 1999, Diversity of mafi c rocks in the Ronda peridotite: Evidence for pervasive melt–rock reaction during heating of subcontinental lithosphere by upwelling asthenosphere: Journal of Petrology, v. 40, p. 729–754, doi: 10.1093/petrology/40.5.729.
Ghazi, A.M., and Hassanipak, A.A., 2000, Petrology and geo-chemistry of the Shahr-Babak ophiolite, Central Iran, in Dilek, Y., Moores, E.M., Elthon, D., and Nicolas, A., eds., Ophiolites and Oceanic Crust: New insight from fi eld and the Ocean Drilling Program: Geological Soci-ety of America Special Paper 349, p. 485–497.
Ghazi, A.M., Pessagno, E.A., Hassanipak, A.A., Kariminia, S.M., Duncan, R.A., and Babaie, H.A., 2003, Bio-stratigraphic zonation and 40Ar/39Ar ages for the Neo-Tethyan Khoy ophiolite of NW Iran: Palaeogeography, Palaeoclimatology, Palaeoecology, v. 193, p. 311–323, doi: 10.1016/S0031-0182(03)00234-7.
Godard, M., Dautria, J.M., and Perrin, M., 2003, Geo-chemical variability of the Oman ophiolite lavas: Re-lationship with spatial distribution and paleomagnetic directions: Geochemistry, Geophysics, Geosystems (G3), v. 4, no. 6, 8609, doi: 10.1029/2002GC000452.
Godard, M., Bosch, D., and Einaudi, F., 2006, A MORB source for low-Ti magmatism in the Semail ophiolite: Chemical Geology, v. 234, p. 58–78, doi: 10.1016/j.chemgeo.2006.04.005.
Godard, M., Lagabrielle, Y., Alard, O., and Harvey, J., 2008, Geochemistry of the highly depleted peridotites drilled at ODP Sites 1272 and 1274 (Fifteen-Twenty Fracture Zone, Mid-Atlantic Ridge): Implications for mantle dynamics beneath a slow spreading ridge: Earth and Planetary Science Letters, v. 267, p. 410–425, doi: 10.1016/j.epsl.2007.11.058.
Golonka, J., 2004, Plate tectonic evolution of the southern margin of Eurasia in the Mesozoic and Cenozoic: Tectonophysics, v. 381, p. 235–273, doi: 10.1016/j.tecto.2002.06.004.
Govindaradju, K., 1994, Compilation of working values and sample description for 383 geostandards: Geostandards Newsletter, v. 18, p. 1–158.
Gruau, G., Griffi ths, J.B., and Lecuyer, C., 1998, The origin of U-shaped rare earth patterns in ophiolite peridotites: Assessing the role of secondary alteration and melt/rock reaction: Geochimica et Cosmochimica Acta, v. 62, p. 3545–3560, doi: 10.1016/S0016-7037(98)00250-6.
Hacker, B.R., Mosenfelder, J.L., and Gnos, E., 1996, Rapid emplacement of the Oman ophiolite: Thermal and geochronologic constraints: Tectonics, v. 15, p. 1230–1247, doi: 10.1029/96TC01973.
Hart, S.R., and Zindler, A., 1986, In search of a bulk-earth composition: Chemical Geology, v. 57, p. 247–267, doi: 10.1016/0009-2541(86)90053-7.
Hawkins, J.W., and Allan, J.F., 1994, Petrologic evolution of Lau Basin sites 834 through 839, in Hawkins, J.W., et al., Proceedings of the Ocean Drilling Program, Sci-entifi c Results, Volume 135: College Station, Texas, Ocean Drilling Program, p. 427–470.
Hébert, R., Adamson, A.C., and Komor, S.C., 1990, Meta-morphic petrology of ODP 109, Hole 670A serpen-tinized peridotites: Serpentinization processes at a slow spreading ridge environment, in Detrick, R., et al., Pro-ceedings of the Ocean Drilling Program, Scientifi c Re-sults, Volume 106/109: College Station, Texas, Ocean Drilling Program, p. 103–115.
Huot, F., Hébert, R., Varfalvy, V., Beaudoin, G., Wang, C.S., Liu, Z.F., Cotten, J., and Dostal, J., 2002, The Beima-rang mélange (southern Tibet) brings additional con-straints in assessing the origin, metamorphic evolution and obduction processes of the Yarlung Zangbo ophio-lite: Journal of Asian Earth Sciences, v. 21, p. 307–322, doi: 10.1016/S1367-9120(02)00053-6.
Ishii, T., Robinson, P.T., Maekawa, H., and Fiske, R., 1992, Petrological studies of peridotites from diapiric serpenti-nite seamounts in the Izu-Ogazawara-Mariana forearc, Leg 125, in Fryer, P., et al., Proceedings of the Ocean
Drilling Program, Scientifi c Results, Volume 125: College Station, Texas, Ocean Drilling Program, p. 445–485.
Jagoutz, E., Palme, H., Baddenhausen, H., Blum, K., Cen-dales, M., Dreibus, G., Spettel, B., Lorenz, V., and Vanke, H., 1979, The abundance of major, minor and trace elements in the Earth’s mantle as derived from primitive ultramafi c nodules: Geochimica et Cosmo-chimica Acta, v. 11, p. 2031–2050.
Jannessary, M.R., 2003, Les Ophiolites de Neyriz (sud de l’Iran): Naissance d’Une Dorsale en Pied de Marge Continentale (Etude des Structures Internes, de la Fab-rique du Manteau, et de l’Evolution Petro-Geochimique des Magmas) [Thèse]: Strasbourg, France, Université de Louis Pasteur, 221 p.
Jicha, B.R., Scholl, D.W., Singer, B.S., Yogodzinski, G.M., and Kay, S.M., 2006, Revised age of Aleutian Island arc formation implies high rate of magma production: Geology, v. 34, p. 661–664, doi: 10.1130/G22433.1.
Johnson, K.T.M., Dick, H.J.B., and Shimizu, N., 1990, Melting in the oceanic upper mantle: An ion micro-probe study of diopsides in abyssal peridotites: Journal of Geophysical Research, v. 95, p. 2661–2678, doi: 10.1029/JB095iB03p02661.
Kamenetsky, V.S., Crawford, A.J., and Meffre, S., 2001, Fac-tors controlling chemistry of magmatic spinel: An em-pirical study of associated olivine, Cr-spinel and melt inclusions from primitive rocks: Journal of Petrology, v. 42, p. 655–671, doi: 10.1093/petrology/42.4.655.
Lanphere, M.A., and Pamic, T., 1983, 40Ar/39Ar ages and tec-tonic setting of ophiolites from Neyriz area, south-east Zagros Range, Iran: Tectonophysics, v. 96, p. 245–256, doi: 10.1016/0040-1951(83)90220-2.
Leake, B.E., and 21 others, 1997, Nomenclature of amphi-boles: Report of the Subcommittee on Amphiboles of the International Mineralogical Association Com-mission on New Minerals and Mineral Names: Min-eralogical Magazine, v. 61, p. 295–321, doi: 10.1180/minmag.1997.061.405.13.
Leat, P.T., Pearce, J.A., Barker, P.F., Millar, I.L., Barry, T.L., and Larter, R.D., 2004, Magma genesis and mantle fl ow at a subducting slab edge: The South Sandwich arc-basin system: Earth and Planetary Science Letters, v. 227, p. 17–35, doi: 10.1016/j.epsl.2004.08.016.
Leterrier, J., Maury, R.C., Thonon, P., Girard, D., and Marchal, M., 1982, Clinopyroxene composition as a method of identifi cation of the magmatic affi nities of paleo-volcanic series: Earth and Planetary Science Letters, v. 59, p. 139–154, doi: 10.1016/0012-821X(82)90122-4.
McCall, G.J.H., and Kidd, R.G.W., 1981, The Makran, southeastern Iran: The anatomy of a convergent plate margin active from Cretaceous to present, in Leggett, L., ed., Trench–Fore Arc Geology: Geological Society of London Special Publication 10, p. 387–397.
McDonough, W.F., and Sun, S.S., 1995, The composition of the Earth: Chemical Geology, v. 120, p. 223–253, doi: 10.1016/0009-2541(94)00140-4.
Michael, P.J., and Bonatti, E., 1985, Peridotite composi-tion from the North Atlantic: Regional and tectonic variations and implications for partial melting: Earth and Planetary Science Letters, v. 73, p. 91–104, doi: 10.1016/0012-821X(85)90037-8.
Miyashiro, A., 1974, Volcanic rock series in island arcs and active continental margins: American Journal of Sci-ence, v. 274, p. 321–355.
Mohajjel, M., Fergusson, C.L., and Sahandi, M.R., 2003, Cretaceous-Tertiary convergence and continental col-lision, Sanandaj-Sirjan zone, western Iran: Journal of Asian Earth Sciences, v. 21, p. 397–412, doi: 10.1016/S1367-9120(02)00035-4.
Mukasa, S., and Ludden, J.N., 1987, Uranium-lead iso-topic ages of plagiogranites from the Troodos ophio-lite, Cyprus , and their tectonic signifi cance: Geology, v. 15, p. 825–828, doi: 10.1130/0091-7613(1987)15<825:UIAOPF>2.0.CO;2.
Neumann, E.-R., and Simon, N.S.C., 2009, Ultra-refractory mantle xenoliths from ocean islands: How do they compare to peridotites retrieved from oceanic sub-arc mantle?: Lithos, v. 107, p. 1–16, doi: 10.1016/j.lithos.2008.06.003.
Nicolas, A., Bouchez, J.L., Boudier, F., and Mercier, J.C., 1971, Textures, structures and fabrics due to solid state
fl ow in some European lherzolites: Tectonophysics, v. 12, p. 55–86, doi: 10.1016/0040-1951(71)90066-7.
Niu, Y., and Hékinian, R., 1997, Spreading-rate dependence of the extent of mantle melting beneath ocean ridges: Nature, v. 385, p. 326–329, doi: 10.1038/385326a0.
Ohara, Y., Stern, R.J., Ishii, T., Yurimoto, H., and Yamazaki, T., 2002, Peridotites from the Mariana Trough: First look at the mantle beneath an active back-arc basin: Contributions to Mineralogy and Petrology, v. 143, p. 1–18.
Ohara, Y., Reagan, M.K., Bloomer, Fryer, P., Fujii, A., Hickey-Vargas, R., Imoto, H., Ishii, T., Ishizuka, O., Johnson, J., Michibayashi, K., Ribiero, J., Stern, R.J., and Uehara, S., 2008, Studies of the southern Izu- Bonin-Mariana (IBM) forearc using Shinkai 6500: Watery glimpses of an in situ forearc ophiolite: Ameri-can Geophysical Union, Fall meeting (abs.).
Pagé, P., Bédard, J.H., Schroetter, J.-M., and Tremblay, A., 2008, Mantle petrology and mineralogy of the Thetford Mines ophiolite complex: Lithos, v. 100, p. 255–292, doi: 10.1016/j.lithos.2007.06.017.
Pagé, P., Bédard, J.H., and Tremblay, A., 2009, Geochemical variations in a depleted forearc mantle: The Ordovo-cian Thetford Mines ophiolite: Lithos (in press).
Parkinson, I.J., and Pearce, J.A., 1998, Peridotites from the Izu-Bonin-Mariana forearc (ODP Leg 125): Evidence for mantle melting and melt-mantle interaction in a supra-subduction zone setting: Journal of Petrology, v. 39, p. 1577–1618, doi: 10.1093/petrology/39.9.1577.
Pearce, J.A., 2003, Supra-subduction zone ophiolites: The search for modern analogues, in Dilek, Y., and New-comb, S., eds., Ophiolite Concept and the Evolution of Geological Thought: Geological Society of America Special Paper 373, p. 269–293.
Pearce, J.A., and Norry, M.J., 1979, Petrogenetic implica-tions of Ti, Zr, Y and Nb variations in volcanic rocks: Contributions to Mineralogy and Petrology, v. 69, p. 33–47, doi: 10.1007/BF00375192.
Pearce, J.A., and Peate, D.W., 1995, Tectonic implications of the composition of volcanic arc magmas: Annual Review of Earth and Planetary Sciences, v. 23, p. 251–285, doi: 10.1146/annurev.ea.23.050195.001343.
Pearce, J.A., Barker, P.F., Edwards, S.J., Parkinson, I.J., and Leat, P.T., 2000, Geochemistry and tectonic signifi cance of peridotites from the South Sandwich arc-basin system, South Atlantic: Contributions to Mineralogy and Petrol-ogy, v. 139, p. 36–53, doi: 10.1007/s004100050572.
Pearce, J.A., Vander Laan, S.R., Arculus, R.J., Murton, B.J., Ishii, T., Peate, D.W., and Parkinson, I.J., 1992, Boninite and harzburgite from Leg 125 (Bonin-Mariana forearc): A case study of magma genesis dur-ing the initial stages of subduction, in Fryer, P., et al., Proceeding of the Ocean Drilling Program, Scientifi c Results, Site 778–786: Bonin-Mariana Region: College Station, Texas, Ocean Drilling Program, p. 623–659.
Pearce, J.A., Baker, P.E., Harvey, P.K., and Luff, I.W., 1995, Geochemical evidence for subduction fl uxes, mantle melting and fractional crystallization beneath the South Sandwich arc: Journal of Petrology, v. 36, p. 1073–1109.
Prinzhofer, A., and Allègre, C.J., 1985, Residual perido-tites and the mechanisms of partial melting: Earth and Planetary Science Letters, v. 74, p. 251–265, doi: 10.1016/0012-821X(85)90025-1.
Rahgoshay, M., 1986, Les Chromites et Leurs Gisements dans les Complexes Ophiolitiques de la Chaine du Taurus (Turquie), Comparaison avec les Gisements Omanais [These Doc. d’Etat]: Strasbourg, France, Université Louis Pasteur, 206 p.
Ricou, L.E., 1971, Le croissant ophiolitique peri-Arabe une ceinture de nappes mise en place au cretace superieur: Revue de Géographie Physique et de Géologie Dy-namique, v. 13, p. 327–350.
Ricou, L.E., 1974, L’Étude Géologique de la Région de Neyriz (Zagros Iranien) et l’Évolution Structurale des Zagrides [Thèse d’Etat]: Orsay, Paris-Sud, 300 p.
Ricou, L.E., 1976, Evolution Structurale des Zagrides. La Région Clef de Neyriz (Zagros Iranien): Memoire So-cieté Geologie de la France 125, 140 p. (Thèse Orsay, 1974).
Ricou, L.E., Braud, J., and Brunn, J.H., 1977, Le Zagros: Memoire Societé Geologie de la France 8, p. 33–52.

The Dehshir ophiolite
Geological Society of America Bulletin, September/October 2010 1547
Robertson, A.H.F., 2002, Overview of the genesis and em-placement of Mesozoic ophiolites in the Eastern Medi-terranean Tethyan region: Lithos, v. 65, p. 10–67, doi: 10.1016/S0024-4937(02)00160-3.
Rollinson, H., 2005, Chromite in the mantle section of the Oman ophiolite: A new genetic model: The Island Arc, v. 14, p. 542–550, doi: 10.1111/j.1440-1738.2005.00482.x.
Sabzehei, M., 1997, The Geological Map of Dehshir, 1:100,000 Series: Tehran, Iran, Geological Survey of Iran, Sheet 6752, scale 1:100,000.
Şengor, A.M.C., 1990, A new model for the late Paleozoic–Mesozoic tectonic evolution of Iran and implications for Oman, in Robertson, A.H.F., Searle, M.P., and Ries, A.C., eds., The Geology and Tectonics of the Oman Region: Geological Society of London Special Publi-cation 49, p. 797–831.
Shahabpour, J., 2005, Tectonic evolution of the orogenic belt in the region located between Kerman and Neyriz: Journal of Asian Earth Sciences, v. 24, p. 405–417, doi: 10.1016/j.jseaes.2003.11.007.
Shahabpour, J., 2007, Island-arc affi nity of the Central Ira-nian volcanic belt: Journal of Asian Earth Sciences, v. 30, p. 652–665, doi: 10.1016/j.jseaes.2007.02.004.
Shafaii Moghadam, H., 2009, The Nain-Baft Ophiolites (Central Iran): Age, Structure and Origin [Ph.D. thesis ]: Tehran, Iran, Shahid Beheshti University, 532 p.
Shafaii Moghadam, H., Rahgoshay, M., and Whitechurch, H., 2007, The Nain-Baft ophiolites: An evidence of back-arc basin spreading in the active margin of the Ira-nian continent: European Geophysical Union Confer-ence 9, SRef-ID: 1607–7962/gra/EGU2007-A-00791.
Sheikholeslami, M.R., Pique, A., Mobayen, P., Sabzehei, M., Bellon, H., and Hashem Emami, M., 2008, Tec-tono-metamorphic evolution of the Neyriz metamor-phic complex, Quri-Kor-e-Sefi d area (Sanandaj-Sirjan zone, SW Iran): Journal of Asian Earth Sciences, v. 31, p. 504–521, doi: 10.1016/j.jseaes.2007.07.004.
Shervais, J.W., 1982, Ti-V plots and the petrogenesis of modern ophiolitic lavas: Earth and Planetary Science Letters, v. 59, p. 101–118, doi: 10.1016/0012-821X(82)90120-0.
Sobolev, A.V., Hofmann, A.W., Soboloev, S.V., and Niko-gosian, I.K., 2005, An olivine-free mantle source of Hawaiian shield basalts: Nature, v. 434, p. 590–597, doi: 10.1038/nature03411.
Stakes, D.S., and Franklin, J.M., 1994, Petrology of igneous rocks at Middle Valley, Juan de Fuca Ridge, in Mottl, M.J., Davis, E.E., Fisher, A.T., et al., Proceedings of the Ocean Drilling Program, Scientifi c Results, Vol-ume 139: College Station, Texas, Ocean Drilling Pro-gram, p. 79–102.
Stern, R.J., 2002, Subduction zones: Reviews of Geophys-ics, v. 40, no. 4, 1012, doi: 10.1029/2001RG000108.
Stern, R.J., 2004, Subduction initiation: Spontaneous and induced: Earth and Planetary Science Letters, v. 226, p. 275–292.
Stern, R.J., and Bloomer, S.H., 1992, Subduction zone in-fancy: Examples from the Eocene Izu-Bonin-Mariana and Jurassic California arcs: Geological Society of America Bulletin, v. 104, p. 1621–1636, doi: 10.1130/0016-7606(1992)104<1621:SZIEFT>2.3.CO;2.
Stocklin, J., 1968, Structural history and tectonics of Iran: A review: The American Association of Petroleum Geol-ogists Bulletin, v. 52, p. 1229–1258.
Stocklin, J., 1977, Structural correlation of the Alpine range between Iran and Central Asia: Societé Geologie de la France Memoire Hors-Serve 8, p. 333–353.
Sun, S.S., and McDonough, W.F., 1989, Chemical and iso topic systematics of oceanic basalts: Implications for mantle composition and processes, in Saunders, A.D., Norry, M.J., eds., Magmatism in Ocean Basins: Geological Society of London Special Publication 42, p. 313–345.
Tatsumi, Y., Hamilton, D.L., and Nesbitt, R.W., 1986, Chemical characteristics of fl uid phase related from a subducted lithosphere and origin of arc magmas: Evidence from high pressure experiments and natu-ral rocks: Journal of Volcanology and Geothermal Research, v. 29, p. 293–309, doi: 10.1016/0377-0273(86)90049-1.
Van der Laan, S.R., Arculus, R.J., Pearce, J.A., and Murton, B.J., 1992, Petrography, mineral chemistry, and phase relations of the basement boninite series of Site 786, Izu-Bonin forearc, in Fryer, P., et al., Proceedings of the Ocean Drilling Program, Scientifi c Results, Vol-ume 125: College Station, Texas, Ocean Drilling Pro-gram, p. 171–201.
Workman, R., and Hart, S.R., 2005, Major and trace element composition of the depleted MORB mantle (DMM): Earth and Planetary Science Letters, v. 231, p. 53–72, doi: 10.1016/j.epsl.2004.12.005.
MANUSCRIPT RECEIVED 5 APRIL 2009REVISED MANUSCRIPT RECEIVED 23 AUGUST 2009MANUSCRIPT ACCEPTED 24 AUGUST 2009
Printed in the USA