Embed Size (px)
Citation preview

Malaysian Journal of Analytical Sciences, Vol 21 No 1 (2017): 52 - 59
DOI: http://dx.doi.org/10.17576/mjas-2017-2101-07
52
MALAYSIAN JOURNAL OF ANALYTICAL SCIENCES
Published by The Malaysian Analytical Sciences Society
THE COMMON PITFALL OF USING ENRICHMENT FACTOR IN
ASSESSING SOIL HEAVY METAL POLLUTION
(Kepincangan Penggunaan Faktor Pengkayaan dalam Menilai Pencemaran Logam Berat
di dalam Tanah)
Seng-Chee Poh* and Norhayati Mohd Tahir
School of Marine and Environmental Sciences,
Universiti Malaysia Terengganu, 21030 Kuala Terengganu, Terengganu, Malaysia
*Corresponding author: [email protected]
Received: 5 November 2016; Accepted: 8 December 2016
Abstract
A soil pollution assessment of heavy metal Zn, Cu, Cr, Cd, Ni and Pb was carried out in Kuala Terengganu, Malaysia. A total of
245 surface soil samples were sampled and have been subjected to a total digestion and analyzed by inductive couple plasma-
optical emission spectrometry (ICP-OES). The contamination of the soils was assessed on the basis of enrichment factors (EFs).
Large discrepancies in results of enrichment factor associated with the choices of reference elements in the EFs’ calculation have
been observed. Our study show that the choice of four commonly-used reference elements (Al, Fe, Ca and Mn) in enrichment
calculation could easily alter the enrichment factor values of element of interest by more than 4-folds although the results were
supposed to be similar regardless of which reference elements being used. This could lead to serious misinterpretation of soil
quality assessment result.
Keywords: soil quality assessment, Malaysia soil, elemental analysis, acid digestion
Abstrak
Satu penilaian pencemaran logam berat Zn, Cu, Cr, Cd, Ni dan Pb dalam tanah telah dijalankan di Kuala Terengganu, Malaysia.
Sebanyak 245 sampel tanah telah diambil, diproses berdasarkan kaedah penghadaman asid dan kepekatan logam berat telah
dianalisa dengan menggunakan spektrofotometer pancaran plasma gandingan aruhan (ICP-OES). Pencemaran tanah telah dinilai
menggunakan pendekatan faktor pengkayaan. Kajian ini menunjukan nilai-nilai faktor pengkayaan boleh berbeza dengan ketara
apabila pengiraan faktor pengkayaan dirujukkan kepada elemen rujukan yang berbeza. Kajian kami mendapati nilai-nilai faktor
pengkayaan boleh berbeza sebanyak empat kali ganda apabila pengiraan faktor pengkayaan merujuk kepada Al, Fe, Ca dan Mn
dan perbezaan nilai-nilai faktor pengkayaan boleh membawa wujudnya kesilapan dalam mentafsir kualiti tanah yang dikaji.
Kata kunci: kajian kualiti tanah, tanah Malaysia, analisa unsur, penghadaman asid
Introduction
Heavy metals like Cd, Pb, Zn, Cu, Cr and Ni in soil have received wide attention due to their potential toxic impact
on the environment if present in excessive concentrations. It is critically important to carry out soil quality
monitoring program on a regular basis, particularly in urban watershed to support sustainable planning and
development for better livelihood. There are three common approaches of assessing soil quality: (1) take
measurements periodically over the time to monitor changes or trends in soil quality; (2) compare measured values
to a standard or reference soil condition (i.e. Netherlands’ Dutch Target, Australia’s Soil Investigation Level,
ISSN
1394 - 2506

Poh & Mohd Tahir: THE COMMON PITFALL OF USING ENRICHMENT FACTOR IN ASSESSING SOIL
HEAVY METAL POLLUTION
53
USEPA Ecological Screening Levels, British Soil Guideline and Japanese Environmental Quality Standards). The
former method is commonly used by stakeholders to identify areas where problems occur, to identify areas of
special interest, or to compare fields under different management systems over time and latter generally adopted by
law enforcement authorities for soil pollution control and mitigation. Finally, the third approach is based on
calculation of enrichment factors (EFs) to evaluate anthropogenic influences on soil quality.
Enrichment factor is an index used as a proxy to assess the heavy metals contamination level in soil by estimating
the differential of heavy metal concentrations against uncontaminated background or reference levels [1,2]. An
enrichment factor can be defined as in equation 1:
EF𝑖 =(y/x)sample
(y/x)background (2)
where, y is concentration of target metal, x is concentration of reference element or normalizer in soil and in
background or baseline reference material. In soil quality study, the interpretation of enrichment factor is based on
the deviation of the ratio between a metal of interest and a reference element that exhibit conservative and immobile
behavior in environment in a sample to the equivalent ratio in a reference material from unity (Efs = 1). Enrichment
factor equal to one is generally taken to mean that there has been no net gain or loss of a metal in the sampled soil
respective to the reference material. Enrichment factor ratio should increase (Efs > 1) if there has been a net gain of
metal concentration due to extra input (e.g. anthropogenic sources), and a net loss of metal concentration in the
system (e.g. due to weathering, biological assimilation) should decrease the ratio value (Efs < 1).
Enrichment factor is practice widely in environmental studies. Nevertheless, the assumption of enrichment factor as
pollution detection tool inherits many theoretical shortcomings [3,4]. The work done by Reimann and de Caritat
[3,4] concluded that EFs calculation is strongly influenced by the natural variable composition of the reference
material, biogeochemical processes and physico-chemical alteration of elements in crust materials. The authors
regarded using EFs to interpret pollution event in any environmental sudies as doubtful. The primary objective of
this study is to determine the metal concentrations in soil of Kuala Terengganu. Fortuitously, this study will allow to
test the reliability of enrichment factor as a pollution proxy for soil quality assessment.
Materials and Methods
Soil sampling The soil quality assessment was carried out in Kuala Terengganu district, Malaysia (5.33°N, 103.1°E, Figure 1).
Sampling of soil had been accomplished on 245 cells of 1 km x 1 km square grid using the topographic maps.
About 1 kg of soil sample was collected from the first 10-15cm of the upper soil horizon using a plastic spade at
each grid. The collected samples were air-dried, ground, and passed through sieve of a 0.6 mm mesh size for
subsequent acid digestion.
Soil digestion and chemical analysis
All soil digestion and element analysis was performed in analytical chemistry laboratory of Universiti Malaysia
Terengganu (UMT). All apparatus used in this experiment were acid-cleaned with 10% HNO3. The soil digestion
procedure for heavy metal analysis was carried out using USEPA method 3052. In general, an acid mixture of
HNO3:HCl:HF (9:4:1) ml ratio was added to 0.5 g of soil sample inside a Teflon vessel. Later, digestions of soils
were performed in a microwave-heated oven (Ethos Plus Milestone, USA) at 210 °C for 20 minutes. After
digestion, small amount of saturated H3BO3 acid was added into solution to neutralize remaining active HF in
solution. The digested solution then makes up to 25 ml of final volume with ultrapure deionized water. A complete
digested soil sample will normally yield a clear solution. Quality control and quality assurance also carried out by
using two standard reference materials SRM-2709 and SRM-2711 obtained from the National Institute of Standards
and Technology (NIST, USA). The SRMs were subjected to similar sample treatment procedures as described
above. All samples and SRMs were analyzed for Al, Fe, Mn, Ca, Zn, Cu, Cr, Cd, Ni and Pb by inductive couple
plasma optical emission spectrometer (Varian Vista Pro, Australia). SRMs recovery result shows that the analytical
accuracy for all measured metals in SRM (n = 12) was within 5-15% error for all metals, expect for Cr which was
10-25% error.

Malaysian Journal of Analytical Sciences, Vol 21 No 1 (2017): 52 - 59
DOI: http://dx.doi.org/10.17576/mjas-2017-2101-07
54
Figure 1. The sampling site in Kuala Terengganu district
Enrichment factor calculation and geochemical mapping
The calculation of a normalized enrichment factor for a given metal for this study is represented by equation 1.
Where, EFi is the enrichment factor of target metal i, (y/x)sample is the target metal to reference (conservative)
element’ ratio in the samples of interest; while (y/x)background is the target metal to reference metal ratio in world soil
baseline reference taken from Ure and Berrow [5].
Results and Discussion
Heavy metals concentration in Kuala Terengganu soil
The concentration range of metals in Kuala Terengganu soils and their mean values are given in Table 1. The mean
concentration values of all metals, except Cd in surface soil of Kuala Terengganu were lower than those reported in
worldwide average values [5].
Level of Al (0.45%), Ca (0.14%), Mn (82.9 mg/kg) in the soil samples studied was found much lower (10 fold) than
those reported by Ure and Berrow [5] for world average values 6.65%, 1.96% and 760 mg/kg, respectively. The
studied soil samples were relatively poor in Fe, Cu, Cr, Zn and Ni. The mean values of these metals were lower than
those reported by Zarcinas et al. [7] for Malaysian agricultural soils (Table 2) and for world average value [5].
Level of Pb (23.6 mg/kg) detected in the soil samples were similar to those found in Zarcinas et al. [7] (26.4 mg/kg)
and worldwide average value (29.2 mg/kg). Conversely, the content of Cd in studied soil ranged between 0.38 and
6.78 mg/kg with the median concentration of 1.28 mg/kg and was found to be two times greater than the mean
concentration of world average (0.62 mg/kg).
The Baging, Rhutapai, Rusila and Rudua soil series associated to BRIS (Beach Ridges Interspersed with Swales)
were reported as dominant soils in these areas [6]. The low heavy metal concentrations in Kuala Terengganu soil
indicates the sampled soils are mainly originated from highly weathered BRIS soils. The decreasing order of
concentration on the different metals Fe>Al>Ca>Mn>Zn>Pb>Cr>Cu>Ni>Cd reflects their abundance in BRIS soil
are associated with low cation exchange capacity, low organic matter content, and excessively-drained sandy soil
properties promote leaching losses.

Poh & Mohd Tahir: THE COMMON PITFALL OF USING ENRICHMENT FACTOR IN ASSESSING SOIL
HEAVY METAL POLLUTION
55
Table 1. The range, median, mean of selected metals in surface soil of Kuala Terengganu (in mg kg-1
, n=245)
Metal Range Median Mean Worldwide Average [5]
Al* 0.14-1.44 0.42 0.45 6.65
Fe* 0.22-7.70 1.54 1.57 3.20
Mn 2.53-356 51.3 82.9 760
Ca* 0.01-1.17 0.08 0.14 1.96
Zn 4.61-204 31.4 38.3 59.8
Cu 0.82-148 9.39 10.9 25.8
Cr 3.05-50.1 21.6 20.5 84.0
Cd 0.38-6.78 1.21 1.28 0.62
Ni 1.91-16.7 7.18 7.02 33.7
Pb 2.54-160 21.9 23.6 29.2
*values reported in weight percent, wt.%
Soil pollution assessment of heavy metals using enrichment factor
To allow quantitative comparisons between degrees of metals enrichment in the soil pollution assessment,
Sutherland [8] and Loska et al [9] had distinguished five contamination categories of the enrichment factor. An EF
< 2 is deficiency of minimal enrichment, suggestive of no or minimal pollution; EF 2 - 5 is moderate enrichment;
EF 5 - 20 is significant enrichment; EF 20 - 40 is very high enrichment and EF > 40 is extremely high enrichment,
indicating an extreme pollution signal. Several elements are utilized as normalizer in enrichment factor, in particular
element that have been associated with rock-forming minerals (see summary in Table 2).
Table 2. Selection and justification of reference element for enrichment factor calculation in relation to assess
anthropogenic impact
Normalizer Justification Reference
Al Al has no significant anthropogenic input compared to the large
of geogenic element; Ion potential of Al is close to target
elements, reduce variation in comparison
[10]
Mn Mn is one of largest components of soil [11]
Fe Fe is abundant in soils; considered to be free from anthropogenic
contribution
[1, 12]
Ca Ca is one of the main components of the Earth’s Crust,
concentration in soil is connected with the matrix, lower mining
interference factor (MIF) compared to Al and Zr
[9]
Zr Zr has no significant anthropogenic source and resides primarily
in the weathering-resistant heavy mineral Zircon
[13]
Sc Sc is stable to supergene processes associated with oxidation and
chemical weathering
[14]
Sr Sr is one of the main components of the Earth’s Crust,
concentration in soil is connected with the matrix
[15]
Ti Ti is a common rock-forming element and very resistant to
weathering in the soil.
[16]
The scatter plot in Figure 2 illustrates a comparison study of selected elements EF against different normalizers (Fe,
Al, Ca and Mn) and the obtained results showed that EF values of metal were different corresponding to the
Malaysian Journal of Analytical Sciences, Vol 21 No 1 (2017): 52 - 59
DOI: http://dx.doi.org/10.17576/mjas-2017-2101-07
56
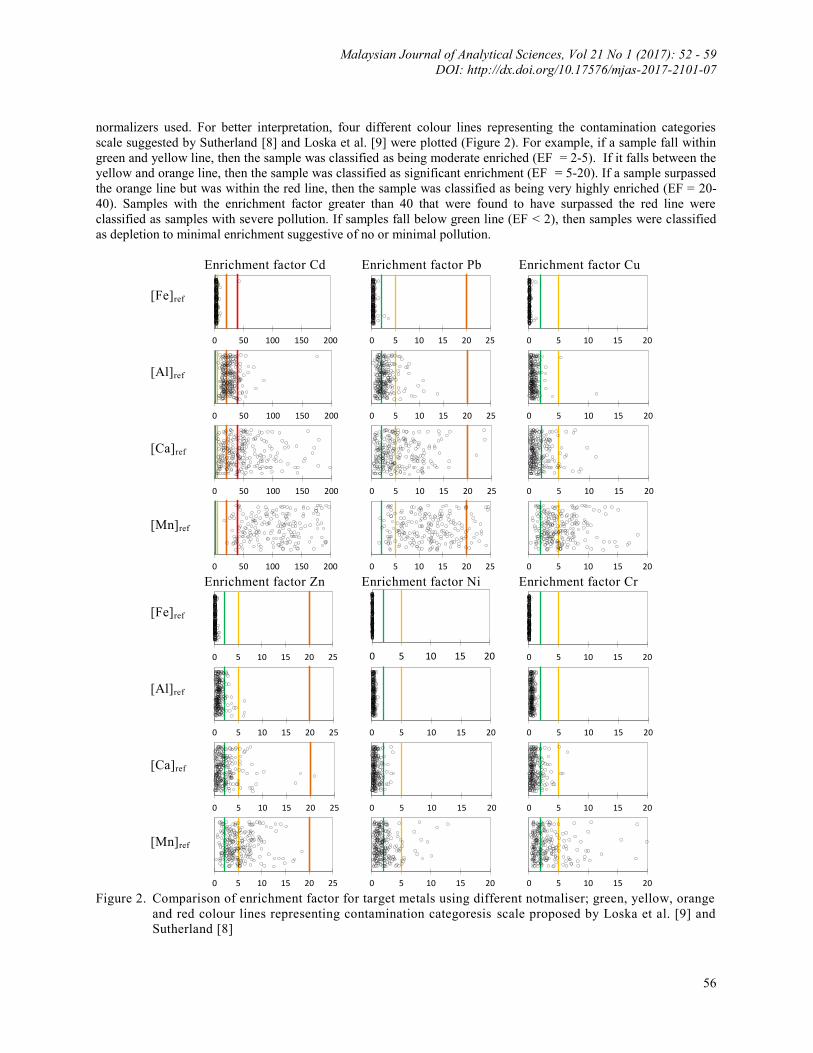
normalizers used. For better interpretation, four different colour lines representing the contamination categories
scale suggested by Sutherland [8] and Loska et al. [9] were plotted (Figure 2). For example, if a sample fall within
green and yellow line, then the sample was classified as being moderate enriched (EF = 2-5). If it falls between the
yellow and orange line, then the sample was classified as significant enrichment (EF = 5-20). If a sample surpassed
the orange line but was within the red line, then the sample was classified as being very highly enriched (EF = 20-
40). Samples with the enrichment factor greater than 40 that were found to have surpassed the red line were
classified as samples with severe pollution. If samples fall below green line (EF < 2), then samples were classified
as depletion to minimal enrichment suggestive of no or minimal pollution.
Enrichment factor Cd Enrichment factor Pb Enrichment factor Cu
[Fe]ref
[Al]ref
[Ca]ref
[Mn]ref
Enrichment factor Zn Enrichment factor Ni Enrichment factor Cr
[Fe]ref
[Al]ref
[Ca]ref
[Mn]ref
Figure 2. Comparison of enrichment factor for target metals using different notmaliser; green, yellow, orange
and red colour lines representing contamination categoresis scale proposed by Loska et al. [9] and
Sutherland [8]
0 50 100 150 200
0 50 100 150 200
0 50 100 150 200
0 50 100 150 200
0 5 10 15 20 25
0 5 10 15 20 25
0 5 10 15 20 25
0 5 10 15 20 25
0 5 10 15 20
0 5 10 15 20
0 5 10 15 20
0 5 10 15 20
0 5 10 15 20 25
0 5 10 15 20 25
0 5 10 15 20 25
0 5 10 15 20 25
0 5 10 15 20
0 5 10 15 20
0 5 10 15 20
0 5 10 15 20
0 5 10 15 20
0 5 10 15 20
0 5 10 15 20
0 5 10 15 20
Poh & Mohd Tahir: THE COMMON PITFALL OF USING ENRICHMENT FACTOR IN ASSESSING SOIL
HEAVY METAL POLLUTION
57
Theoretically, the selection of reference element used in EFs calculation should hardly be affected by weathering
processes and should show little variability of occurrence [3]. If different reference elements are selected to
calculate EFs, they should all show similar pollution signals regardless of which normalizers were being used. In
this study, however, all four sets of EFs calculation (refer Figure 2) bear no relationship to each other.
Figure 2 show EFs values for all metals derived from all four normalizers differ in the range from 1 to 4-folds. EFs
derived from Ca and Mn normalizer generally had overestimated amount compared to Al and Fe. We found that
93% and 6% of the Cd samples were classified as extremely high polluted and very high polluted respectively when
Mn was used as reference element. These outcomes are very different to the other reference elements, in particular
to Fe normalizer. For Fe reference-EFs, 95% of Cd samples were classified as moderate enriched or lower. Al and
Ca normalizer also produced a wide range of EFs for Cd samples and these values ranged between Fe and Mn
references derived EFs. These discrepancies reflect that EFs do not provide a simple technique to differentiate
particular suite of metals was whether of anthropogenic origin or vice versa.
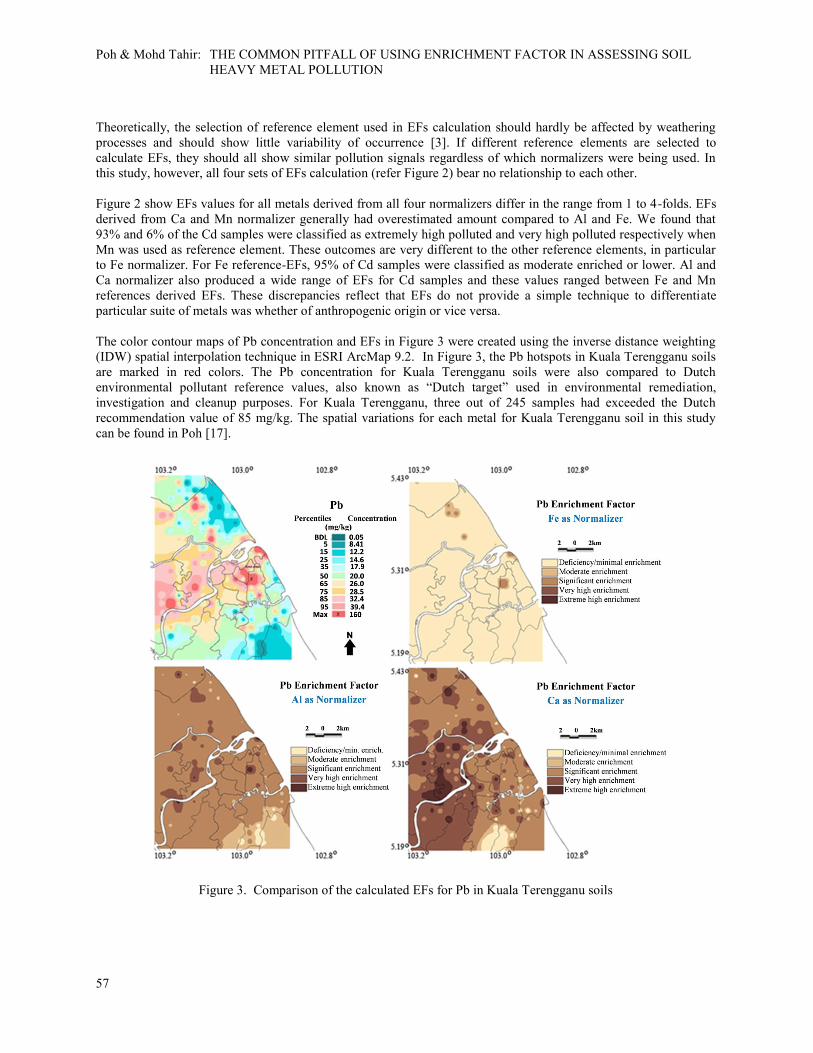
The color contour maps of Pb concentration and EFs in Figure 3 were created using the inverse distance weighting
(IDW) spatial interpolation technique in ESRI ArcMap 9.2. In Figure 3, the Pb hotspots in Kuala Terengganu soils
are marked in red colors. The Pb concentration for Kuala Terengganu soils were also compared to Dutch
environmental pollutant reference values, also known as “Dutch target” used in environmental remediation,
investigation and cleanup purposes. For Kuala Terengganu, three out of 245 samples had exceeded the Dutch
recommendation value of 85 mg/kg. The spatial variations for each metal for Kuala Terengganu soil in this study
can be found in Poh [17].
Figure 3. Comparison of the calculated EFs for Pb in Kuala Terengganu soils

Malaysian Journal of Analytical Sciences, Vol 21 No 1 (2017): 52 - 59
DOI: http://dx.doi.org/10.17576/mjas-2017-2101-07
58
Three striking features of the EFs pattern of Pb are evident in Figure 3. First, the EFs for Pb show great spatial
variation compared to Pb distribution pattern in Kuala Terengganu soil. Second, this variation is multidimensional;
that is three different set of reference element show mainly independent of EFs variation. For example, when EFs
was calculated relative to the Pb/Al ratio, the pattern of high Pb enrichment was recorded at the same areas in the Pb
concentration map. However, when the EFs Pb/Fe ratio distribution was compared to Pb concentration map, it turns
out, several high enrichment values near the central part of the map disappeared. Furthermore, when EFs Pb/Ca
ratio distribution was compared, the high anomaly near to river mouth was no longer present in the map.
Meanwhile, an unexpected extremely high EFs had appeared scattered in the central part of the map. Third,
these EFs patterns have a pervasive missed-interpretation of pollution signal. In this case, EFs Pb/Al ratio
distribution showed 50% of Kuala Terengganu soils were significantly enriched by Pb but EFs Pb/Fe ratio
distribution, on the other hand illustrated that 99% of areas were still less contaminated by Pb. The results could
overestimate, underestimate, or simply incorrectly estimate the environmental pollution.
The potential sources of errors for EFs technique mentioned above can be explained in a number of ways. First, a
huge natural variation in concentration of the different elements in reference materials (i.e. continental crust value,
world soil average) exist and using single mean value from a skewed distribution dataset (i.e. Ure and Berrow [5])
does not permit a reasonable EFs assessment. Ure and Berrow [5] reported Pb concentration in world soil is ranges
from 1 – 888 mg/kg with average value of 29.2 mg/kg, obviously the given mean value does not reflect the true
average Pb concentration for world average soil. This is one of a very good example to show that using the mean
world soil value as a proxy of “natural background values” in enrichment factor inherent a serious flaw to estimate
pollution signal in environment.
Second, an inhomogeneous distribution of reference elements in the study area could also lead to misinterpretation
in EFs. Overestimation of EFs occurs when the chosen reference elements (normalizer) showed a natural spatial
variation that was as large as, or larger than, that of the target metal of interest [4]. In this study, we used quartile
coefficient of dispersion (cqv) statistical analysis to compare the dispersion of the maximum concentration
differences between Pb and other reference elements. The calculated cqv for Ca, Fe and Al against Pb was 2.2, 1.1
and 0.7 respectively, indicated that the natural spatial variation of Ca was found 2 times greater than Pb. We found
that the large dispersion of Ca concentration has attributed greater EFs value of Pb in Kuala Terengganu and the
Pb/Ca ratio EFs was found greater than Pb/Al and Pb/Fe ratio EFs by order of two magnitudes (Figure 3).
The large discrepancies in EFs value could be due to two other factors: (i) the differential solubility of refractory
minerals in acid digestion protocols as well as grain size fractionation effect resulted different concentration of
metal elements in Earth materials and; (ii) the significance of biogeochemical and weathering processes that control
element concentration in Earth surface are not considered in EFs assessment on pollution studies. Reimann and de
Caritat [3,4] and Desaules [18] have provide a detailed explanation and references in conceptual shortcomings of
EFs in environmental studies.
Conclusion
Our work demonstrated that application of enrichment factor in the assessment of soil pollution level in Kuala
Terengganu inherent a major weakness. One unanticipated finding was that the choice of four commonly-used
reference elements (Al, Fe, Ca and Mn) for enrichment calculation could easily alter the enrichment factor values of
Pb by more than 4-folds although the results were supposed to be similar regardless of which reference elements
being used. This bias can be attributed to the absent of a reliable “natural background value” or references. Another
shortcoming of EFs approach in assessing the level of anthropogenic sources to environment is EFs did not take into
account the natural variation of element concentration in environmental samples in relation to biogeochemical and
localized lithogenic processes as mentioned in Reimann and de Caritat [3,4] and Desaules [18]. Therefore,
application of enrichment factor as a way to fingerprint the anthropogenic source of heavy metals in soils requires
extra caution in future study.
Acknowledgements
This work was supported by the Universiti Malaysia Terengganu. We especially thank Foo Toon Fong and Mohd
Rafie Rosly for assistance with soil sampling.

Poh & Mohd Tahir: THE COMMON PITFALL OF USING ENRICHMENT FACTOR IN ASSESSING SOIL
HEAVY METAL POLLUTION
59
References
1. Dragović, S., N. Mihailović, and B. Gajić (2008). Heavy metals in soils: Distribution, relationship with soil
characteristics and radionuclides and multivariate assessment of contamination sources. Chemosphere, 72(3):
491 – 495.
2. Luo, X.-S., S. Yu, Y.-G. Zhu, and X.-D. Li (2012). Trace metal contamination in urban soils of China. Science
of The Total Environment, 421–422:17 – 30.
3. Reimann, C. and Caritat, P. D. (2000). Intrinsic flaws of element enrichment factors (EFs) in environmental
geochemistry. Environmental Science & Technology, 34(24):5084 – 5091.
4. Reimann, C. and Caritat, P. D. (2005). Distinguishing between natural and anthropogenic sources for elements
in the environment: Regional geochemical surveys versus enrichment factors. Science of The Total
Environment, 337(1–3): 91 – 107.
5. Ure, A. M. and Berrow, M. L. (1982). The elemental constituents of soils, in environmental chemistry: Volume
2, H.J.M. Bowen, Editor. The Royal Society of Chemistry: pp. 94 – 204.
6. Biot, Y. Z. and Razak, A. H. (1982). Semi-detailed soil survey report of the Terengganu river basin.
Department of Agriculture, Malaysia.
7. Zarcinas, B. A., Ishak, C. F., McLaughlin, M. J. and Cozens, G. (2004). Heavy metals in soils and crops in
Southeast Asia. Environmental Geochemistry and Health, 26(4): 343 – 357.
8. Sutherland, A. R. (2000). Bed sediment-associated trace metals in an urban stream, Oahu, Hawaii.
Environmental Geology, 39(6): 611 – 627.
9. Loska, K., D. Wiechuła, and Korus, I. (2004). Metal contamination of farming soils affected by industry.
Environment International, 30(2): 159 – 165.
10. Bourennane, H., Douay, F., Sterckeman, T., Villanneau, E., Ciesielski, H., King, D. and Baize, D. (2010).
Mapping of anthropogenic trace elements inputs in agricultural topsoil from Northern France using enrichment
factors. Geoderma, 157(3–4): 165 – 174.
11. Chen, H., Teng, Y., Lu, S., Wang, Y. and Wang, J. (2015). Contamination features and health risk of soil heavy
metals in China. Science of The Total Environment, 512–513: 143 – 153.
12. Ye, C., Li, S., Zhang, Y. and Zhang, Q. (2011). Assessing soil heavy metal pollution in the water-level-
fluctuation zone of the Three Gorges Reservoir, China. Journal of Hazardous Materials, 191(1–3): 366 –372.
13. Schulin, R., Curchod, F., Mondeshka, M., Daskalova, A. and Keller, A. (2007). Heavy metal contamination
along a soil transect in the vicinity of the iron smelter of Kremikovtzi (Bulgaria). Geoderma, 140(1–2): 52 – 61.
14. Qin, F., Ji, H., Li, Q., Guo, X., Tang, L. and Feng, J. (2014). Evaluation of trace elements and identification of
pollution sources in particle size fractions of soil from iron ore areas along the Chao River. Journal of
Geochemical Exploration, 138: 33 – 49.
15. Krishna, A. K. and Govil, P. K. (2008). Assessment of heavy metal contamination in soils around Manali
industrial area, Chennai, Southern India. Environmental Geology, 54(7): 1465 – 1472.
16. Szolnoki, Z., Farsang, A., and Puskás, I. (2013). Cumulative impacts of human activities on urban garden soils:
Origin and accumulation of metals. Environmental Pollution, 177: 106 – 115.
17. Poh, S. C. (2008). Distribution and source apportionment of elements in urban soil of Kuala Terengganu,
Malaysia, Thesis Universiti Malaysia Terengganu, Malaysia.
18. Desaules, A., (2012). Critical evaluation of soil contamination assessment methods for trace metals. Science of
The Total Environment, 426: 120 – 131.