Embed Size (px)
Citation preview
TransacTions & resTrucTuring
The Common Determinants of
M&A SuccessWhat Factors Contribute to Deal Success?
2011
in conjunction with Professor steven Kaplan of the university of
chicago Booth school of Business
kpmg.com

b | The common Determinants of M&a success
© 2011KPMg LLP, a Delaware limited liability partnership and the u.s. member firm of the KPMg network of independent member firms affiliated with KPMg international cooperative (“KPMg international”), a swiss entity. 24693nss
The common Determinants of M&a success | 1
1 Merger Tracker, July 2011, William Blair & company.
2 We have conducted two prior related studies, one published in 2007 that looked at deals announced between 2000 and 2004, and one published in 2010 that examined deals announced between 2002 and 2006. Both of those prior studies are available at kpmg.com.
For the M&A Deals Announced in 2007 and 2008, What Factors Helped
Contribute to Deal Success?
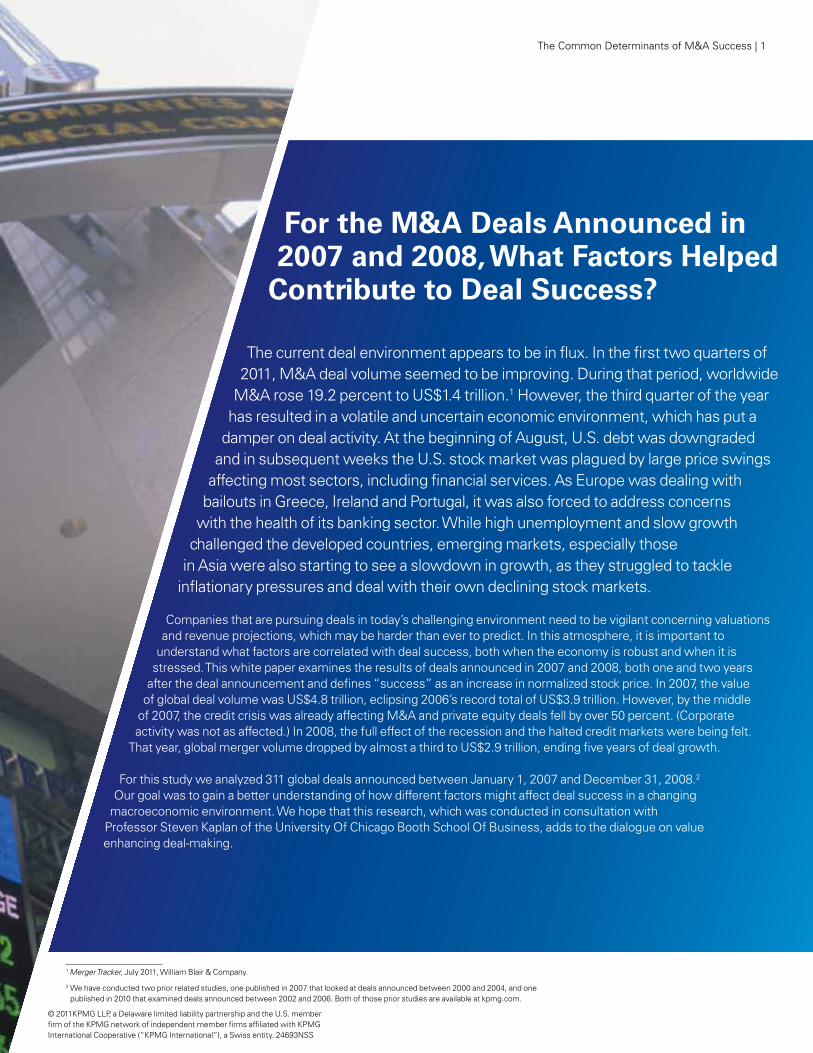
The current deal environment appears to be in flux. in the first two quarters of 2011, M&a deal volume seemed to be improving. During that period, worldwide
M&a rose 19.2 percent to us$1.4 trillion.1 However, the third quarter of the year has resulted in a volatile and uncertain economic environment, which has put a
damper on deal activity. at the beginning of august, u.s. debt was downgraded and in subsequent weeks the u.s. stock market was plagued by large price swings
affecting most sectors, including financial services. as europe was dealing with bailouts in greece, ireland and Portugal, it was also forced to address concerns
with the health of its banking sector. While high unemployment and slow growth challenged the developed countries, emerging markets, especially those
in asia were also starting to see a slowdown in growth, as they struggled to tackle inflationary pressures and deal with their own declining stock markets.
companies that are pursuing deals in today’s challenging environment need to be vigilant concerning valuations and revenue projections, which may be harder than ever to predict. in this atmosphere, it is important to
understand what factors are correlated with deal success, both when the economy is robust and when it is stressed. This white paper examines the results of deals announced in 2007 and 2008, both one and two years
after the deal announcement and defines “success” as an increase in normalized stock price. in 2007, the value of global deal volume was us$4.8 trillion, eclipsing 2006’s record total of us$3.9 trillion. However, by the middle
of 2007, the credit crisis was already affecting M&a and private equity deals fell by over 50 percent. (corporate activity was not as affected.) in 2008, the full effect of the recession and the halted credit markets were being felt.
That year, global merger volume dropped by almost a third to us$2.9 trillion, ending five years of deal growth.
For this study we analyzed 311 global deals announced between January 1, 2007 and December 31, 2008.2 our goal was to gain a better understanding of how different factors might affect deal success in a changing
macroeconomic environment. We hope that this research, which was conducted in consultation with Professor steven Kaplan of the university of chicago Booth school of Business, adds to the dialogue on value
enhancing deal-making.
© 2011KPMg LLP, a Delaware limited liability partnership and the u.s. member firm of the KPMg network of independent member firms affiliated with KPMg international cooperative (“KPMg international”), a swiss entity. 24693nss
2 | The common Determinants of M&a success
Methodologyin this study, we analyzed the stock performance of companies that announced deals between 2007 and 2008, one and two years after the deal announcement. stock prices were normalized on an industry basis. When we refer to a variable or acquisition characteristic as being “successful”, the characteristic is associated with stock returns that are both positive and statistically significant. The deals included in this study involved acquisitions where acquirers purchased 100 percent of the target, where the target constituted at least 20 percent of the revenue of the acquirer and where the purchase price was in excess of us$100 million. The average deal size of the transactions in this study was us$2.3 billion; the median was us$620 million.
The variables that we examined included the following:
• How the deal was financed—stock vs. cash
• The size of the acquirer
• The price-to-earnings (P/e) ratio of the acquirer
• The P/e ratio of the target
• The prior deal experience of the acquirer
• Whether or not the deal was cross-border
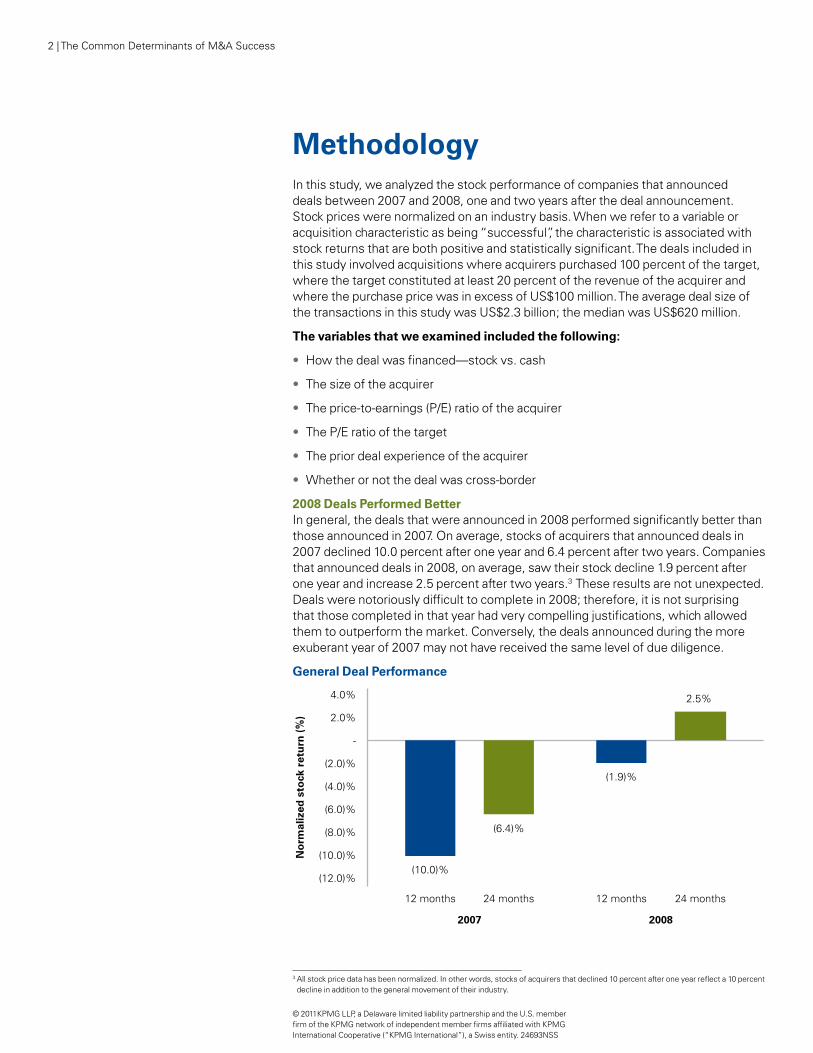
2008 Deals Performed Betterin general, the deals that were announced in 2008 performed significantly better than those announced in 2007. on average, stocks of acquirers that announced deals in 2007 declined 10.0 percent after one year and 6.4 percent after two years. companies that announced deals in 2008, on average, saw their stock decline 1.9 percent after one year and increase 2.5 percent after two years.3 These results are not unexpected. Deals were notoriously difficult to complete in 2008; therefore, it is not surprising that those completed in that year had very compelling justifications, which allowed them to outperform the market. conversely, the deals announced during the more exuberant year of 2007 may not have received the same level of due diligence.
General Deal Performance
(10.0)%
(6.4)%
(1.9)%
2.5%
-
(12.0)%
(10.0)%
(8.0)%
(6.0)%
(4.0)%
(2.0)%
2.0%
4.0%
12 months 24 months 12 months 24 months
2007 2008
No
rmal
ized
sto
ck r
etu
rn (
%)
3 all stock price data has been normalized. in other words, stocks of acquirers that declined 10 percent after one year reflect a 10 percent decline in addition to the general movement of their industry.
© 2011KPMg LLP, a Delaware limited liability partnership and the u.s. member firm of the KPMg network of independent member firms affiliated with KPMg international cooperative (“KPMg international”), a swiss entity. 24693nss
The common Determinants of M&a success | 3
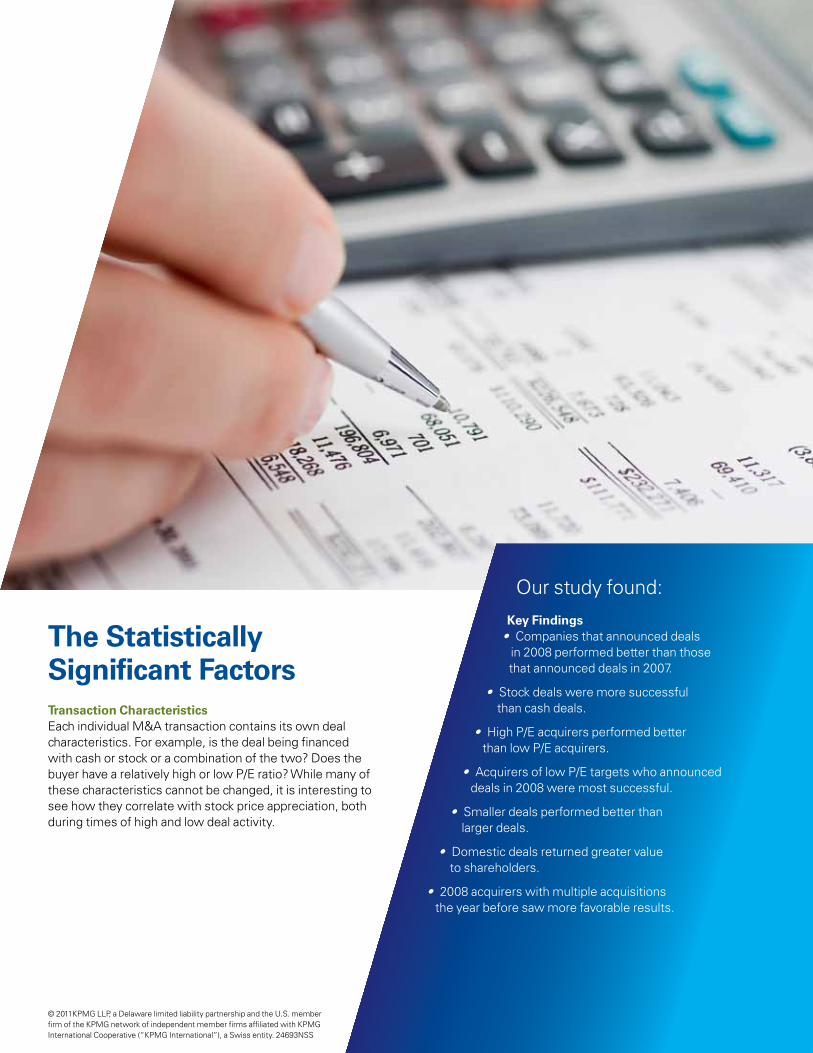
The Statistically Significant FactorsTransaction Characteristicseach individual M&a transaction contains its own deal characteristics. For example, is the deal being financed with cash or stock or a combination of the two? Does the buyer have a relatively high or low P/e ratio? While many of these characteristics cannot be changed, it is interesting to see how they correlate with stock price appreciation, both during times of high and low deal activity.
our study found:
Key Findings• companies that announced deals
in 2008 performed better than those that announced deals in 2007.
• stock deals were more successful than cash deals.
• High P/e acquirers performed better than low P/e acquirers.
• acquirers of low P/e targets who announced deals in 2008 were most successful.
• smaller deals performed better than larger deals.
• Domestic deals returned greater value to shareholders.
• 2008 acquirers with multiple acquisitions the year before saw more favorable results.
© 2011KPMg LLP, a Delaware limited liability partnership and the u.s. member firm of the KPMg network of independent member firms affiliated with KPMg international cooperative (“KPMg international”), a swiss entity. 24693nss
4 | The common Determinants of M&a success
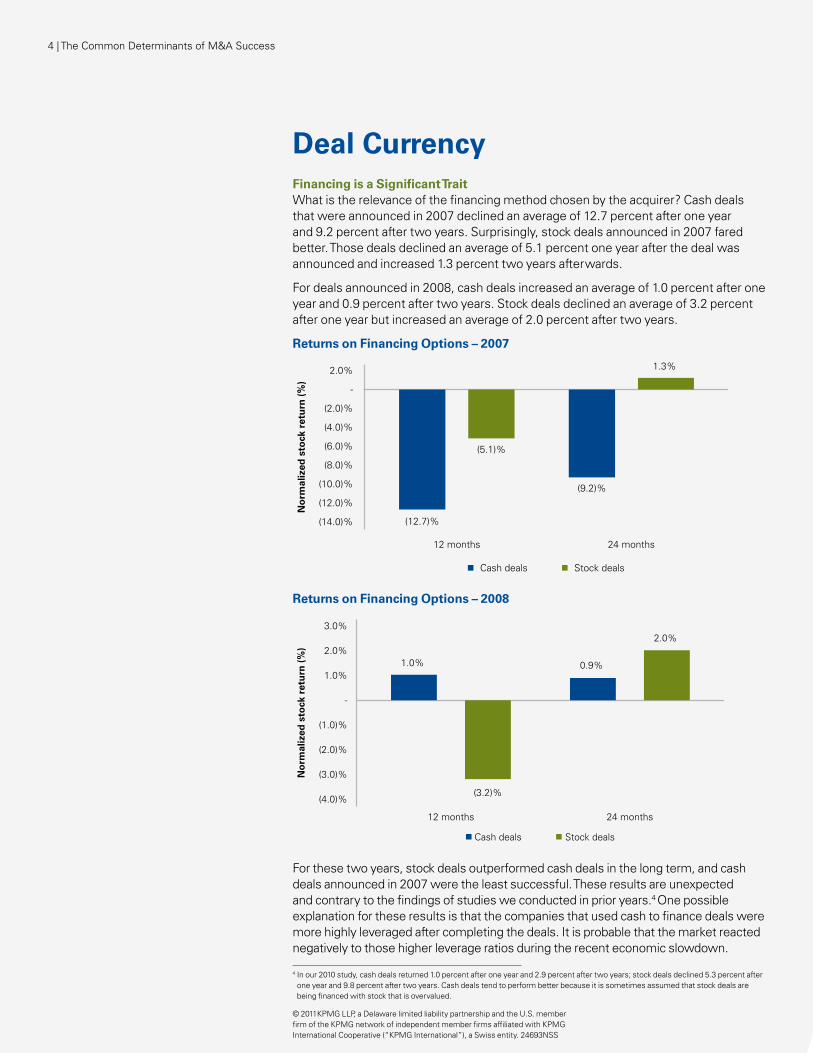
Deal CurrencyFinancing is a Significant TraitWhat is the relevance of the financing method chosen by the acquirer? cash deals that were announced in 2007 declined an average of 12.7 percent after one year and 9.2 percent after two years. surprisingly, stock deals announced in 2007 fared better. Those deals declined an average of 5.1 percent one year after the deal was announced and increased 1.3 percent two years afterwards.
For deals announced in 2008, cash deals increased an average of 1.0 percent after one year and 0.9 percent after two years. stock deals declined an average of 3.2 percent after one year but increased an average of 2.0 percent after two years.
Returns on Financing Options – 2007
(12.7)%
(5.1)%
(9.2)%
1.3%
(14.0)%
(12.0)%
(10.0)%
(8.0)%
(6.0)%
(4.0)%
(2.0)%
-
2.0%
12 months 24 months
No
rmal
ized
sto
ck r
etu
rn (
%)
Cash deals Stock deals
Returns on Financing Options – 2008
1.0%
(3.2)%
0.9%
2.0%
(4.0)%
(3.0)%
(2.0)%
(1.0)%
-
1.0%
2.0%
3.0%
12 months 24 months
No
rmal
ized
sto
ck r
etu
rn (
%)
Cash deals Stock deals
For these two years, stock deals outperformed cash deals in the long term, and cash deals announced in 2007 were the least successful. These results are unexpected and contrary to the findings of studies we conducted in prior years.4 one possible explanation for these results is that the companies that used cash to finance deals were more highly leveraged after completing the deals. it is probable that the market reacted negatively to those higher leverage ratios during the recent economic slowdown.
4 in our 2010 study, cash deals returned 1.0 percent after one year and 2.9 percent after two years; stock deals declined 5.3 percent after one year and 9.8 percent after two years. cash deals tend to perform better because it is sometimes assumed that stock deals are being financed with stock that is overvalued.
© 2011KPMg LLP, a Delaware limited liability partnership and the u.s. member firm of the KPMg network of independent member firms affiliated with KPMg international cooperative (“KPMg international”), a swiss entity. 24693nss
The common Determinants of M&a success | 5The common Determinants of M&a success | 5
© 2011KPMg LLP, a Delaware limited liability partnership and the u.s. member firm of the KPMg network of independent member firms affiliated with KPMg international cooperative (“KPMg international”), a swiss entity. 24693nss
6 | The common Determinants of M&a success
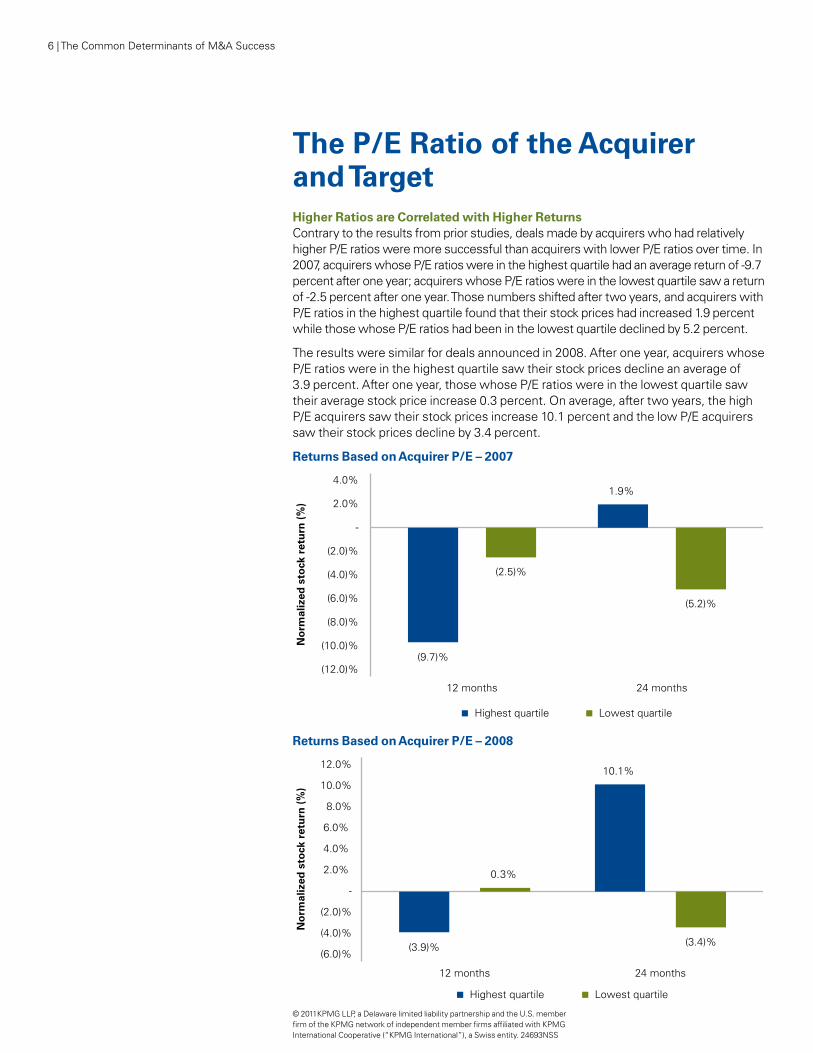
The P/E Ratio of the Acquirer and TargetHigher Ratios are Correlated with Higher Returnscontrary to the results from prior studies, deals made by acquirers who had relatively higher P/e ratios were more successful than acquirers with lower P/e ratios over time. in 2007, acquirers whose P/e ratios were in the highest quartile had an average return of -9.7 percent after one year; acquirers whose P/e ratios were in the lowest quartile saw a return of -2.5 percent after one year. Those numbers shifted after two years, and acquirers with P/e ratios in the highest quartile found that their stock prices had increased 1.9 percent while those whose P/e ratios had been in the lowest quartile declined by 5.2 percent.
The results were similar for deals announced in 2008. after one year, acquirers whose P/e ratios were in the highest quartile saw their stock prices decline an average of 3.9 percent. after one year, those whose P/e ratios were in the lowest quartile saw their average stock price increase 0.3 percent. on average, after two years, the high P/e acquirers saw their stock prices increase 10.1 percent and the low P/e acquirers saw their stock prices decline by 3.4 percent.
Returns Based on Acquirer P/E – 2007
(9.7)%
(2.5)%
1.9%
(5.2)%
(12.0)%
(10.0)%
(8.0)%
(6.0)%
(4.0)%
(2.0)%
-
2.0%
4.0%
12 months 24 months
No
rmal
ized
sto
ck r
etu
rn (
%)
Highest quartile Lowest quartile
Returns Based on Acquirer P/E – 2008
(3.9)%
0.3%
10.1%
(3.4)%
12 months 24 months
(6.0)%
(4.0)%
(2.0)%
-
2.0%
4.0%
6.0%
8.0%
10.0%
12.0%
No
rmal
ized
sto
ck r
etu
rn (
%)
Highest quartile Lowest quartile
© 2011KPMg LLP, a Delaware limited liability partnership and the u.s. member firm of the KPMg network of independent member firms affiliated with KPMg international cooperative (“KPMg international”), a swiss entity. 24693nss
The common Determinants of M&a success | 7
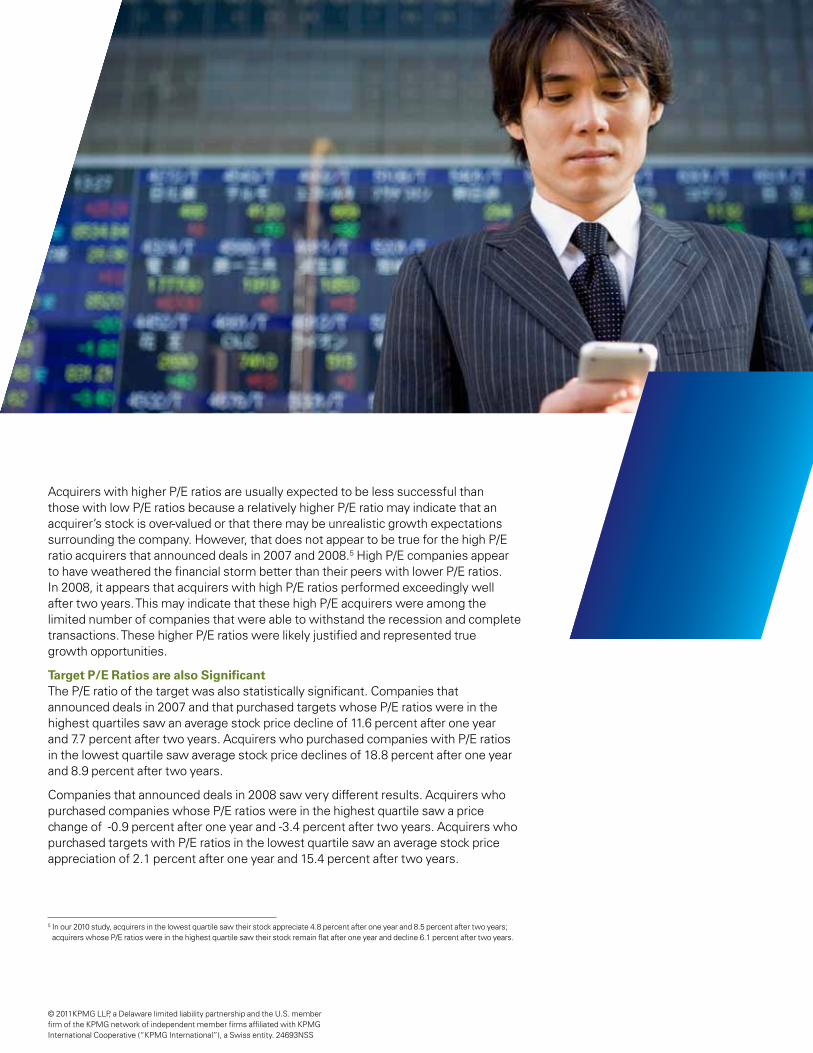
acquirers with higher P/e ratios are usually expected to be less successful than those with low P/e ratios because a relatively higher P/e ratio may indicate that an acquirer’s stock is over-valued or that there may be unrealistic growth expectations surrounding the company. However, that does not appear to be true for the high P/e ratio acquirers that announced deals in 2007 and 2008.5 High P/e companies appear to have weathered the financial storm better than their peers with lower P/e ratios. in 2008, it appears that acquirers with high P/e ratios performed exceedingly well after two years. This may indicate that these high P/e acquirers were among the limited number of companies that were able to withstand the recession and complete transactions. These higher P/e ratios were likely justified and represented true growth opportunities.
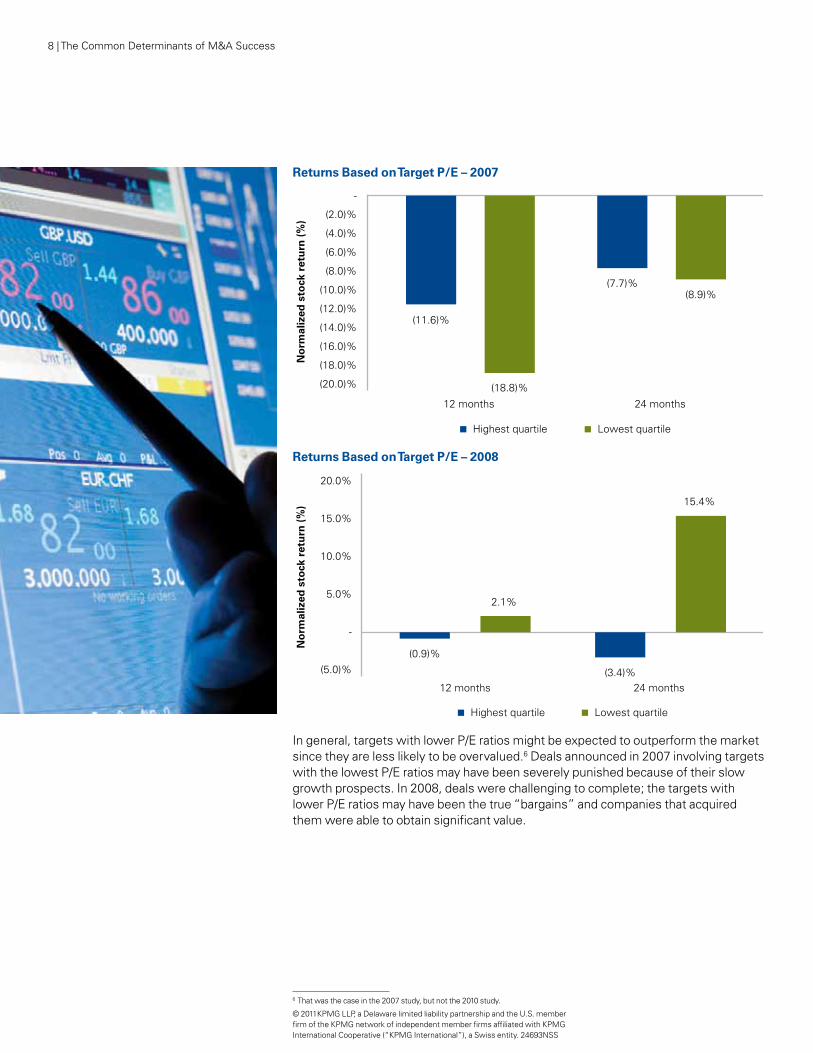
Target P/E Ratios are also SignificantThe P/e ratio of the target was also statistically significant. companies that announced deals in 2007 and that purchased targets whose P/e ratios were in the highest quartiles saw an average stock price decline of 11.6 percent after one year and 7.7 percent after two years. acquirers who purchased companies with P/e ratios in the lowest quartile saw average stock price declines of 18.8 percent after one year and 8.9 percent after two years.
companies that announced deals in 2008 saw very different results. acquirers who purchased companies whose P/e ratios were in the highest quartile saw a price change of -0.9 percent after one year and -3.4 percent after two years. acquirers who purchased targets with P/e ratios in the lowest quartile saw an average stock price appreciation of 2.1 percent after one year and 15.4 percent after two years.
5 in our 2010 study, acquirers in the lowest quartile saw their stock appreciate 4.8 percent after one year and 8.5 percent after two years; acquirers whose P/e ratios were in the highest quartile saw their stock remain flat after one year and decline 6.1 percent after two years.
© 2011KPMg LLP, a Delaware limited liability partnership and the u.s. member firm of the KPMg network of independent member firms affiliated with KPMg international cooperative (“KPMg international”), a swiss entity. 24693nss
8 | The common Determinants of M&a success
Returns Based on Target P/E – 2007
(11.6)%
(18.8)%
(7.7)%(8.9)%
(20.0)%
(18.0)%
(16.0)%
(14.0)%
(12.0)%
(10.0)%
(8.0)%
(6.0)%
(4.0)%
(2.0)%
-
12 months 24 months
No
rmal
ized
sto
ck r
etu
rn (
%)
Highest quartile Lowest quartile
Returns Based on Target P/E – 2008
(0.9)%
2.1%
(3.4)%
15.4%
(5.0)%
-
5.0%
10.0%
15.0%
20.0%
12 months 24 months
No
rmal
ized
sto
ck r
etu
rn (
%)
Highest quartile Lowest quartile
in general, targets with lower P/e ratios might be expected to outperform the market since they are less likely to be overvalued.6 Deals announced in 2007 involving targets with the lowest P/e ratios may have been severely punished because of their slow growth prospects. in 2008, deals were challenging to complete; the targets with lower P/e ratios may have been the true “bargains” and companies that acquired them were able to obtain significant value.
6 That was the case in the 2007 study, but not the 2010 study.
© 2011KPMg LLP, a Delaware limited liability partnership and the u.s. member firm of the KPMg network of independent member firms affiliated with KPMg international cooperative (“KPMg international”), a swiss entity. 24693nss
The common Determinants of M&a success | 9
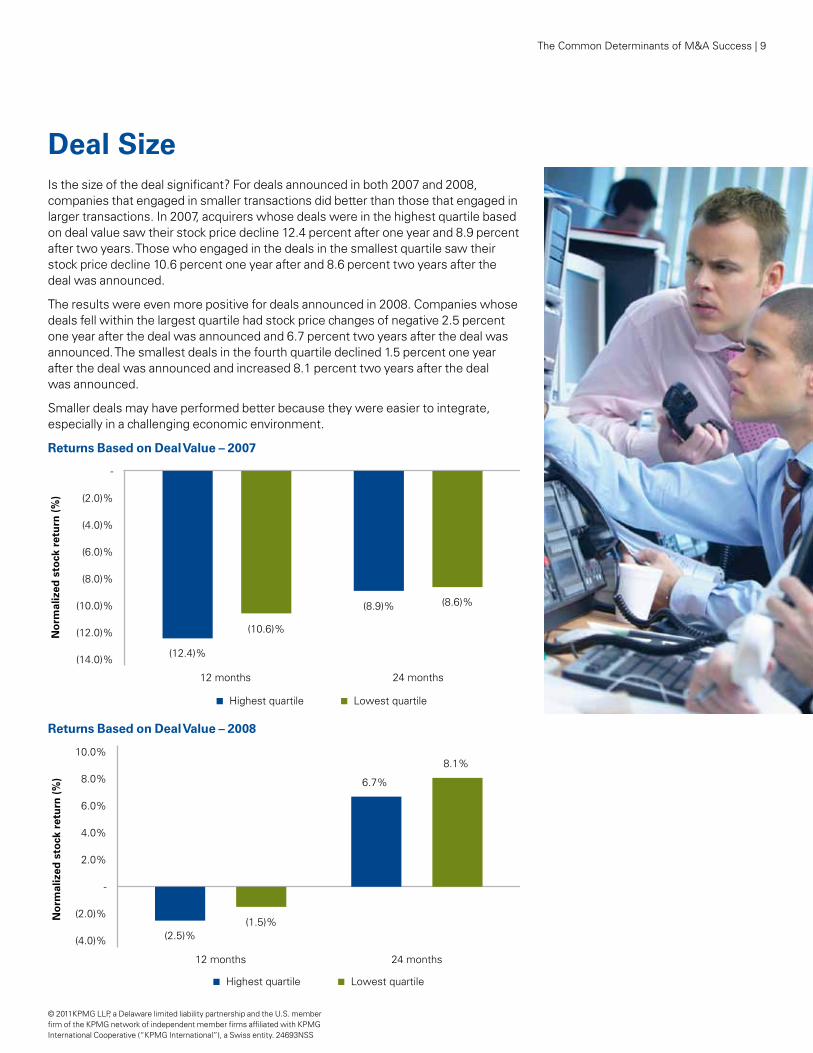
Deal Sizeis the size of the deal significant? For deals announced in both 2007 and 2008, companies that engaged in smaller transactions did better than those that engaged in larger transactions. in 2007, acquirers whose deals were in the highest quartile based on deal value saw their stock price decline 12.4 percent after one year and 8.9 percent after two years. Those who engaged in the deals in the smallest quartile saw their stock price decline 10.6 percent one year after and 8.6 percent two years after the deal was announced.
The results were even more positive for deals announced in 2008. companies whose deals fell within the largest quartile had stock price changes of negative 2.5 percent one year after the deal was announced and 6.7 percent two years after the deal was announced. The smallest deals in the fourth quartile declined 1.5 percent one year after the deal was announced and increased 8.1 percent two years after the deal was announced.
smaller deals may have performed better because they were easier to integrate, especially in a challenging economic environment.
Returns Based on Deal Value – 2007
(12.4)%
(10.6)%
(8.9)% (8.6)%
(14.0)%
(12.0)%
(10.0)%
(8.0)%
(6.0)%
(4.0)%
(2.0)%
-
12 months 24 months
No
rmal
ized
sto
ck r
etu
rn (
%)
Highest quartile Lowest quartile
Returns Based on Deal Value – 2008
(2.5)%(1.5)%
6.7%
8.1%
(4.0)%
(2.0)%
-
2.0%
4.0%
6.0%
8.0%
10.0%
12 months 24 months
No
rmal
ized
sto
ck r
etu
rn (
%)
Highest quartile Lowest quartile
© 2011KPMg LLP, a Delaware limited liability partnership and the u.s. member firm of the KPMg network of independent member firms affiliated with KPMg international cooperative (“KPMg international”), a swiss entity. 24693nss
10 | The common Determinants of M&a success
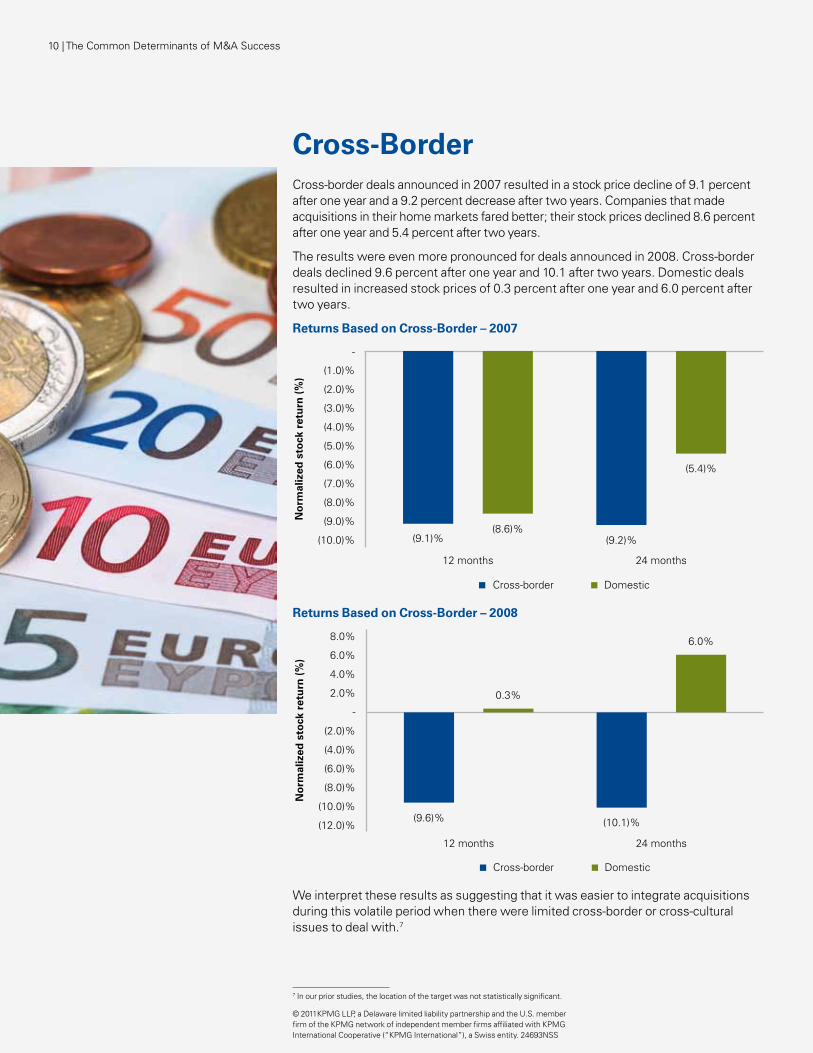
Cross-Bordercross-border deals announced in 2007 resulted in a stock price decline of 9.1 percent after one year and a 9.2 percent decrease after two years. companies that made acquisitions in their home markets fared better; their stock prices declined 8.6 percent after one year and 5.4 percent after two years.
The results were even more pronounced for deals announced in 2008. cross-border deals declined 9.6 percent after one year and 10.1 after two years. Domestic deals resulted in increased stock prices of 0.3 percent after one year and 6.0 percent after two years.
Returns Based on Cross-Border – 2007
(9.1)%(8.6)%
(9.2)%
(5.4)%
(10.0)%
(9.0)%
(8.0)%
(7.0)%
(6.0)%
(5.0)%
(4.0)%
(3.0)%
(2.0)%
(1.0)%
-
12 months 24 months
No
rmal
ized
sto
ck r
etu
rn (
%)
Cross-border Domestic
Returns Based on Cross-Border – 2008
(9.6)%
0.3%
(10.1)%
6.0%
(12.0)%
(10.0)%
(8.0)%
(6.0)%
(4.0)%
(2.0)%
-
2.0%
4.0%
6.0%
8.0%
12 months 24 months
No
rmal
ized
sto
ck r
etu
rn (
%)
Cross-border Domestic
We interpret these results as suggesting that it was easier to integrate acquisitions during this volatile period when there were limited cross-border or cross-cultural issues to deal with.7
7 in our prior studies, the location of the target was not statistically significant.
© 2011KPMg LLP, a Delaware limited liability partnership and the u.s. member firm of the KPMg network of independent member firms affiliated with KPMg international cooperative (“KPMg international”), a swiss entity. 24693nss
The common Determinants of M&a success | 11
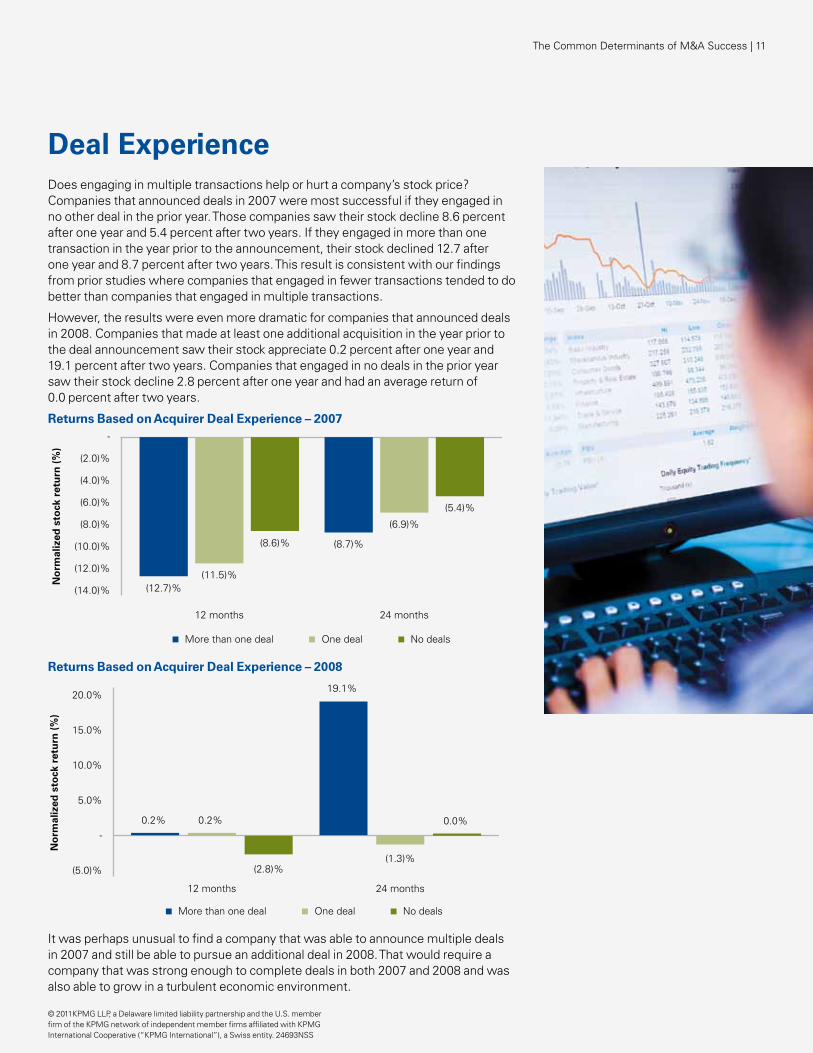
Deal ExperienceDoes engaging in multiple transactions help or hurt a company’s stock price? companies that announced deals in 2007 were most successful if they engaged in no other deal in the prior year. Those companies saw their stock decline 8.6 percent after one year and 5.4 percent after two years. if they engaged in more than one transaction in the year prior to the announcement, their stock declined 12.7 after one year and 8.7 percent after two years. This result is consistent with our findings from prior studies where companies that engaged in fewer transactions tended to do better than companies that engaged in multiple transactions.
However, the results were even more dramatic for companies that announced deals in 2008. companies that made at least one additional acquisition in the year prior to the deal announcement saw their stock appreciate 0.2 percent after one year and 19.1 percent after two years. companies that engaged in no deals in the prior year saw their stock decline 2.8 percent after one year and had an average return of 0.0 percent after two years.
Returns Based on Acquirer Deal Experience – 2007
(12.7)%(11.5)%
(8.6)% (8.7)%
(6.9)%
(5.4)%
(14.0)%
(12.0)%
(10.0)%
(8.0)%
(6.0)%
(4.0)%
(2.0)%
-
12 months 24 months
No
rmal
ized
sto
ck r
etu
rn (
%)
More than one deal One deal No deals
Returns Based on Acquirer Deal Experience – 2008
0.2% 0.2%
(2.8)%
19.1%
(1.3)%
0.0%
(5.0)%
-
5.0%
10.0%
15.0%
20.0%
12 months 24 months
No
rmal
ized
sto
ck r
etu
rn (
%)
More than one deal One deal No deals
it was perhaps unusual to find a company that was able to announce multiple deals in 2007 and still be able to pursue an additional deal in 2008. That would require a company that was strong enough to complete deals in both 2007 and 2008 and was also able to grow in a turbulent economic environment.
© 2011KPMg LLP, a Delaware limited liability partnership and the u.s. member firm of the KPMg network of independent member firms affiliated with KPMg international cooperative (“KPMg international”), a swiss entity. 24693nss
ConclusionThis study reveals what deal makers have known all along. each deal situation is unique and due diligence must also include an understanding of the changing economic environment. statistically, it appears that companies that announced deals in 2008, when the deal environment was so challenging, performed significantly better than those that announced deals the year before. Those results are not unexpected. However, this year’s study did result in several surprises, such as the fact that stock deals performed better than cash deals and that acquirers with high P/e ratios performed better than acquirers with low P/e ratios . Those results may have been caused in part by the unprecedented economic events of the last several years.
We hope that this white paper continues to spark interesting discussions about deal-making in different types of economic environments and helps both acquirers and targets to pursue the most successful transactions.
© 2011KPMg LLP, a Delaware limited liability partnership and the u.s. member firm of the KPMg network of independent member firms affiliated with KPMg international cooperative (“KPMg international”), a swiss entity. 24693nss

© 2011KPMg LLP, a Delaware limited liability partnership and the u.s. member firm of the KPMg network of independent member firms affiliated with KPMg international cooperative (“KPMg international”), a swiss entity. 24693nss
secTors anD THeMes
Title hereadditional information in univers
45 Light 12pt on 16pt leading
kpmg.com
credits and authors in univers 45 light 12pt on 16pt leading
The information contained herein is of a general nature and is not intended to address the circumstances of any particular individual or entity. although we endeavor to provide accurate and timely information, there can be no guarantee that such information is accurate as of the date it is received or that it will continue to be accurate in the future. no one should act on such information without appropriate professional advice after a thorough examination of the particular situation.
KPMg is a global network of professional firms providing audit, Tax, and advisory services. We operate in 146 countries and have 140,000 people working in member firms around the world. The independent member firms of the KPMg network are affiliated with KPMg international cooperative, a swiss entity. each KPMg firm is legally distinct and separate entity, and describes itself as such.
Written by sherrie nachman, new York, nY
© 2011 KPMg LLP, a Delaware limited liability partnership and the u.s. member firm of the KPMg network of independent member firms affiliated with KPMg international cooperative (“KPMg international”), a swiss entity. The KPMg name, logo and “cutting through complexity” are registered trademarks or trademarks of KPMg international. all rights reserved. Printed in the u.s.a.” 24693nss
For more information, please contact:
Daniel D. Tiemann Transaction Services – Global and AmericasT: +1 312-665-3599 E: [email protected]
John Kelly Transaction Services—EMA T: + 44 (207) 694 3528 E: [email protected]
Warren Phillips Transaction Services – ASPACT: + 85 221 402 809 E: [email protected]
kpmg.com