Embed Size (px)
Citation preview
www.elsevier.com/locate/rse
Remote Sensing of Environment 91 (2004) 320–331
The classification of late seral forests in the Pacific Northwest,
USA using Landsat ETM+ imagery
Hong Jianga,b,*, James R. Strittholta, Pamela A. Frosta, Nicholas C. Slossera
aConservation Biology Institute, 260 SW Madison Avenue Suite 106, Corvallis, OR 97333, USAb International Institute of Earth System Science, Nanjing University, Hankou Road 22, Nanjing 210093, China
Received 2 December 2003; received in revised form 9 March 2004; accepted 13 March 2004
Abstract
To conserve the Earth’s most extraordinary expressions of temperate biodiversity in the Pacific Northwest (PNW), USA, the mapping of
late seral (old and mature) conifer forests plays a critical role. For this paper, we define old conifer forests as >150 years and mature conifer
forest between 50 and 150 years. We offer a new Optimal Iterative Unsupervised Classification (OIUC) procedure for mapping late seral
conifer forests over an eight-ecoregion area. The key steps of the OIUC classification were: (1) fully using the Landsat 7 Enhanced Thematic
Mapper Plus (ETM+) 15 m panchromatic channel merged with other 30 m bands 3 and 5 to make a pan-sharpened false color composite for
high resolution image interpretation; (2) splitting the ETM+ scene by ecologically distinct areas, or ecoregions, to create relatively
homologous images for classification; (3) using a procedure similar to cluster busting where multiple iterative manipulation of the ISODATA
clusters was employed; and (4) edge matching of sub-scenes to form ecoregions, then later merged together to form a map for the entire
PNW. Supporting data and information included ancillary spatial GIS data layers, aerial photos, Digital Ortho Quad images (DOQs), field
investigations, and previously reported forest age results. Classification accuracy was assessed using 2081 stratified random locations on 105
individual DOQs covering the entire region. Approximately 4.7 million ha (f 19%) of the PNW was classified as old conifer forest (>150
years). Another 4.8 million ha (f 19%) was classified as mature conifer forest (50–150 years). Over 9.48 million ha (f 38%) of the PNW
was late seral conifer forest. The extent of late seral forests (old and mature conifer cover classes) varied greatly between the eight ecoregions.
The Central and Southern Cascades and Klamath–Siskiyou ecoregions contained the highest amount of late seral forest in the region. The
results showed high accuracy of the late seral forest classification for the PNW with an overall accuracy of 90.72% and KAPPA test K value
0.8534. Producer’s (Omission) accuracy for old and mature forests were 91.36% and 80.40%, User’s (Commission) accuracy were 89.42%
and 80.59%, respectively. Accuracy levels differed for the different ecoregions examined. In general, mature conifer forests exhibited higher
levels of confusion than did old conifer forests, due to the spectral influences of high-density young conifer stands and terrain shadow effects.
The results fill an important data gap needed for ongoing conservation planning purposes throughout the region. We found that for relatively
large geographic areas the OIUC method is an efficient and cost-effective alternative that yields high quality results.
D 2004 Elsevier Inc. All rights reserved.
Keywords: Conifer forest; Pacific Northwest; Landsat ETM+
1. Introduction and mature forest as 50–150 years. Substantial effort, both
The Pacific Northwest (PNW), USA, ranks among the
most ecologically diverse regions of North America (Frank-
lin & Dyrness, 1988), and late seral (old and mature) conifer
forests play an important role in maintaining that diversity
(Whittaker, 1960; Defenders of Wildlife, 1998). For this
study, old conifer forest was defined as being >150 years
0034-4257/$ - see front matter D 2004 Elsevier Inc. All rights reserved.
doi:10.1016/j.rse.2004.03.016
* Corresponding author. Conservation Biology Institute, 260 SW
Madison Avenue Suite 106, Corvallis, OR 97333, USA. Tel.: +1-541-
757-0687; fax: +1-541-752-0518.
E-mail address: [email protected] (H. Jiang).
political and scientific, has been directed toward conserva-
tion of old-growth conifer forests and associated species in
this region. However, the extent of these forests, which once
dominated much of the PNW, has been drastically reduced
by logging and other forest clearing activities, especially
since 1940 over much of the region (Franklin & Spies,
1991). Consequently, the conifer forests of the PNW have
become a heterogeneous mosaic of original old-growth
forests, second-growth stands, young forest, plantations of
various ages, and clearcuts (Spies et al., 1994, Tunner et al.,
1996). Successful conservation of late seral forests through-
out the Pacific Northwest requires spatially explicit data on

H. Jiang et al. / Remote Sensing of Environment 91 (2004) 320–331 321
its current extent so it can be utilized in conservation
planning efforts at the regional level.
Regional conservation planning is becoming increasingly
sophisticated (i.e., more inclusive of different conservation
values which are then incorporated into quantitative analyt-
ical and modeling tools such as nature reserve selection
algorithms) as more accurate and extensive spatially explicit
data become available and the computing capacity to use
these data more robust and affordable. Despite the many
advances, important data layers (e.g., extent and condition
of forest cover) are still needed to adequately address
important regional conservation questions, and remote sens-
ing technology is important in filling at least some of the
existing data gaps. For example, possessing spatially ex-
plicit data on forest condition is fundamental to developing
regional forest sustainability plans.
The PNW continues to be a major focal area for remote
sensing research, particularly as it is applied to forests.
Some regional studies have addressed changes in land cover
over time. Tunner et al. (1996), for example, used the
Landsat Multispectral Scanner (MSS) and Thematic Mapper
(TM) imagery for four time periods (from 1975 to 1991) and
interpreted land cover in the Olympic area of Washington
using the unsupervised ISODATA method. Similarly, Sachs
et al. (1998) used Landsat Multispectral Scanner (MSS) and
TM imagery to map forest cover and detect major distur-
bances between 1975 and 1992 in British Columbia, Can-
ada. The researchers also used unsupervised ISODATA
results to differentiate between closed conifer, semi-open
conifer, deciduous, and mixed forest classes, as well as three
closed conifer age classes—young, mature, and old.
In two separate studies (Eby, 1987; Green & Congalton,
1990), mapped old-growth forests in western Washington
and Oregon using Landsat MSS and TM data. Morrison et
al. (1991) and Congalton et al. (1993) used satellite imagery
to quantify and map the locations of late seral forests on
nine national forests in the PNW region. These two studies
used the same Forest Service data to conduct their analyses,
but reported very different late seral forest areal extent
estimates. Overall, the two studies differed by approximate-
ly 25%, but for a few forests, they differed by as much as
100%. Cohen and Spies (1992) and Cohen et al. (1995,
2001) used 1988 Landsat TM imagery to model forest
vegetation attributes, including age, across western Oregon
using a multi-image mosaic. Similarly, Ohmann and Greg-
ory (2002) employed direct gradient analysis and nearest-
neighbor imputation to predict detailed ground attributes of
vegetation in a digital landscape map of the Oregon Coast.
While many of these studies focused on forest age, they
differ in terms of method, areal extent, ownership focus, and
age class definitions. For example, Boyd et al. (2002) used
three methods: vegetation indices, regression analysis, and
neural networks to estimate conifer forest cover (approxi-
mately 30–40 years and older) in the western Cascade
Mountains. Cohen et al. (1995) estimated the age and
structure of forests using two ( < 200 and >200), three
( < 80, 80–200, and >200), and five ( < 40, 40–80, 80–
120, 120–200, and >200) age classes. Cohen et al. (2001)
later modeled continuous variables instead of discrete age
classes. Alternatively, Ohmann and Gregory (2002) de-
scribed the Oregon Coast forests in terms of vegetation
density, species composition, and size class, rather than by
age or age class.
Additionally, differences in the underlying data sources
(dates of acquisition, resolution, and ancillary data support)
represent other sources of divergence among the studies.
Consequently, despite the wealth of data available, reason-
ably accurate and timely spatial database for late seral
conifer forests for the entire PNW region for conservation
planning purposes was not available, The goal of this
project was to provide such a data layer filling an important
data gap. However, our study was intentionally restricted
and in no way was intended to compete with ongoing
government mapping efforts (e.g., Interagency Vegetation
Mapping Project), which will undoubtedly add greater depth
to our understanding of the regional vegetation complexity.
2. Methods
2.1. Study area
The study area in this assessment covered approximately
25 million hectares across portions of Washington, Oregon,
and California. We elected to subdivide the study area using
ecoregions as defined by World Wildlife Fund (WWF) for
forest assessment purposes (Fig. 1). An ecoregion is defined
as a relatively large area of land or water that contains a
geographically distinct assemblage of natural communities.
These communities (1) share a large majority of their
species, dynamics, and environmental conditions, and (2)
function together effectively as a conservation unit at global
and continental scales (Olson et al., 2001). In addition to
being a useful ecological unit of analysis for conservation
purposes, ecoregions are also useful in mapping vegetation
as focusing on ecologically distinct areas usually minimizes
confusion of discrete land cover classes that appear spec-
trally similar on an image (Lachowski et al., 1996).
We examined eight ecoregions (Fig. 1). They included
Cascade Mountains Leeward Forests (CMLF), Northern
Cascades Forests (NCF), Puget Lowland Forests (PLF),
Central Pacific Coastal Forests (CPCF), Central and South-
ern Cascades Forests (CSCF), Eastern Cascade Forests
(ECF), Klamath–Siskiyou Forests (KSF), and Willamette
Valley Forests (WVF). Ecoregion boundaries were simpli-
fied in two instances by removing island polygons. The
Olympic Mountains were incorporated into the CPCF ecor-
egion instead of being an island polygon of the NCF
ecoregion and two small CSCF island polygons were
removed and incorporated in the ECF ecoregion. A detailed
description of these eight ecoregions can be found in
Ricketts et al. (1999).

Fig. 1. Map of study area showing the WWF ecoregions in the PNW, USA [Cascade Mountains Leeward Forests (CMLF), Northern Cascades Forests (NCF),
Puget Lowland Forests (PLF), Central Pacific Coastal Forests (CPCF), Central and Southern Cascades Forests (CSCF), Eastern Cascade Forests (ECF),
Klamath–Siskiyou Forests (KSF), and Willamette Valley Forests (WVF)].
H. Jiang et al. / Remote Sensing of Environment 91 (2004) 320–331322
2.2. Data
The study was based on the classification of 23 Landsat 7
Enhanced TM plus (ETM+) satellite images acquired from
July to September 2000. The projection system used was
Universal Transverse Mercator (UTM) Zone 10; Spheroid
was Clarke 1866; and Datum was NAD27. ERDAS Imagine
software (version 8.5) was used to carry out all classification
and mapping tasks. In addition to the ETM+ satellite
imagery, we acquired and utilized numerous other ancillary
datasets.
Ecoregion boundaries were obtained as Arc/Info poly-
gons (1:2,000,000 scale) from World Wildlife Fund (WWF).
A GIS coverage for roads (1:24,000) was acquired from the

H. Jiang et al. / Remote Sensing of Environment 91 (2004) 320–331 323
Bureau of Land Management (BLM) and used for image
rectification. Digital Elevation Model (DEM) data at 30 m
resolution was acquired from the USGS. Aspect results were
generated from the DEM and used to stratify the imagery
further (fully illuminated aspects versus less illuminated
aspects in areas with rugged terrain (CMLF, NCF, CSCF,
KSF, and portions of CPCF) prior to conducting the
unsupervised classification. GAP vegetation data (Jennings,
2000, http://www.gap.uidaho.edu) layers were used to help
discern the coarse level plant community differences across
the region.
Oregon Digital Ortho Quad (DOQ) images, created by
the U.S. Geological Survey (USGS) and U.S. Forest Service
(USFS), were acquired from the Oregon Geographic Infor-
mation Council (OGIC, http://www.sscgis.state.or.us/), and
DOQ imagery available for Washington and California were
purchased from the USGS.
2.3. Image processing
The Landsat 7 ETM+ imagery was georeferenced to the
UTM zone 10 projection. To improve subregional accuracy,
the image was rectified using the 1:24,000 roads data
acquired from the BLM to less than 0.5 pixel root mean-
square error (RMSE) using the third-order polynomial and
resampled to 30 m pixels using the nearest-neighbor option.
Rather than relying solely on RMSE values to assess the
quality of the rectification, which relies on a pixel-by-pixel
correction, we elected to use the roads coverage (1:24,000)
to refine the image rectification. Once satisfied with the
results, we proceeded to actual image classification.
We also decreased the heterogeneity of the spectral
classification results in the ETM+ imagery by dividing
individual scenes into pieces based on ecoregion bound-
aries. These pieces, similar ecologically, formed the basic
analytical units for running the unsupervised classification
process, thus avoiding the influences of more complicated
spectral, geographic, and forest community variations. At
the macro level, having the entire study area subdivided into
ecologically meaningful subregions allowed for greater
concentration on just the forest communities present in
any given area. For example, the CPCF ecoregion is
dominated by various Douglas-fir (Pseudotsuga menziesii)
communities with a high level of hardwood intermixing.
Very different conifer community types (e.g., Jeffrey pine;
Pinus jeffreyi or Ponderosa pine Pinus ponderosa) were not
present to confound classification. The most challenging
ecoregion from the standpoint of forest community variabil-
ity was the Klamath–Siskiyou which contained a wide
range of conifer forest communities.
Visual interpretation of Landsat imagery has been dem-
onstrated as a useful tool in land cover and vegetation
mapping (Scott et al., 1993; Lillesand & Kiefer, 2000;
Zheng et al., 1997; Cohen et al., 1995; Wilson & Sader,
2002). Therefore, we merged the 30-m-resolution multi-
spectral data (bands 3 and 5) and 15-m-resolution panchro-
matic data (band 8), yielding effectively a 15-m-resolution
multispectral image (Lillesand & Kiefer, 1999). We used the
pan-sharpened false color composite (bands 5, 8, and 3; see
Fig. 2) along with approximately 50 out of 155 DOQ
images (1992–1995), over 500 aerial photos (1993–
1999), and limited ground truth data (Midcoast OR in CPCF
ecoregion) to assign the various classes.
The main advantage of frequently referring to higher
resolution data is in deciphering complexities in the land-
scape that would be nearly impossible for computer soft-
ware to interpret alone. Using these data has been reported
to be particularly useful for broad area assessments where
classification of individual pixels would not be appropriate
(Lachowski et al., 1996; Zheng et al., 1997; Jensen, 1999;
Lillesand & Kiefer, 2000; Cohen et al., 2001; Wilson &
Sader, 2002).
Unsupervised classification provides the most compre-
hensive information on the spectral characteristics of an
area, presents spectrally pure clusters for labeling, and gives
the analyst the freedom to group similar clusters together.
However, the unsupervised classification method can also
potentially mismatch spectral signature clusters and themat-
ic classes (Cihlar, 2000). Other classification problems can
result depending on how certain parameters (e.g. number of
clusters and allowable dispersion around a cluster mean) are
controlled since changes in these parameters by the analyst
can produce very different final clusters for the same dataset
(Cihlar, 2000; Lachowski et al., 1996). A recent method for
trying to minimize this problem entails producing a large
number of clusters, typically 100–400 (Homer et al., 1997;
Wayman et al., 2001), and then reducing this broad classi-
fication by well-defined merging steps.
We chose the unsupervised classification approach for
mapping late seral conifer forests in the PNW using an
Optimal Iterative Unsupervised Classification (OIUC) meth-
od developed for this project to overcome the stated
limitations of unsupervised classification. The OIUC
includes the following steps: (1) development of reference
data sets; (2) optimal iterative classification using ISODATA
clustering; and (3) post classification treatment. The first
step was to construct a useful reference dataset upon which
to base the satellite image classification. The importance of
including ancillary datasets is widely recognized for im-
proving the accuracy and quality of remote sensing-derived
land cover classification (Jensen, 1996a; Lachowski et al.,
1996). In this case, we utilized the DOQ data, aerial photos,
and limited field investigation.
The OIUC method strives to overcome the problems of
parameter variability and mismatching of spectral clusters
and thematic classes in the least number of iterations. In the
OIUC method, the homogeneity of a cluster is produced
through an iterative approach (Fig. 3). In the initial unsu-
pervised classification by Iterative Self-Organizing Data
Analysis Technique (ISODATA), 60–80 clusters (using
bands 1–5 and band 7) were produced using the ISODATA
command in ERDAS Imagine. These clusters were then

Fig. 2. Pan-sharpened false color composite mosaic for PNW study area (bands 5, 8, and 3) and WWF ecoregion boundaries (orange).
H. Jiang et al. / Remote Sensing of Environment 91 (2004) 320–331324
matched with reference imagery and data. Spectral classes
that agreed with observed age classes observed using higher
resolution imagery were considered good matches, labeled,
and removed from further consideration. Spectral classes
that were less clear were put back into the remaining pixel
pool and rerun again. This was repeated as many times as
needed to assign our final classification result. In some
instances, the first iteration was adequate to delineate a
particular land cover class. Other pixels were more difficult
to assign the proper class and required multiple iterations.

Fig. 3. Flow chart diagram of Optimal Iteration Unsupervised Classification (OIUC) used in the study.
H. Jiang et al. / Remote Sensing of Environment 91 (2004) 320–331 325
Before combining the sub-scenes together forming the
final result, the pixel-based classification results were gen-
eralized slightly. For this application, we were more inter-
ested in patch-level spatial patterns than by results of
individual pixels. Therefore, using the CLUMP and ELIM-
INATE commands, we removed all pixel clusters that were
smaller than five cells (or 0.45 ha).
2.4. Forest cover classes
Mapping forest age is complex and difficult, especially
over large geographic extents such as the PNW. In fact, the
multispectral signatures derived from sensors such as Land-
sat ETM+ does not measure age at all but some composite
of stand structure, tree density, and cover condition impact-
ed to varying degrees by atmospheric and terrain influences.
Because of this complexity, we elected to concentrate on the
conifer-dominated component of the forest vegetation as
have other researchers. For conservation planning purposes,
however, this is the majority of the regional forest cover and
of greatest region-wide ecological concern. That is not to
say that mapping old growth Oregon white oak (Quercus
garryana) is not important, it is just far more difficult than
mapping closed-canopy conifer forests.
Published definitions for late seral forests throughout the
region vary greatly based on forest type, environmental
conditions, and other factors, both ecological and economic
(Cohen et al., 1995; Fierst, 1992; Franklin & Spies, 1991;
Sachs et al., 1998). For example, Douglas-fir stands older
than 40 years were defined as late seral by Sachs et al.
(1998). For other cases, Douglas-fir forests were defined as
late seral if they were older than 80 years (Franklin &
Spies, 1991; Spies & Franklin, 1991; Spies, 1991) and
even 100 years (Bingham & Sawyer, 1991). Similarly,
definitions of ‘‘old-growth’’ Douglas-fir have ranged from
older than 150 years to older than 250 years (Hayens,
1986). Of course, the PNW is more than just Douglas-fir
forests. In one review, Fierst (1992) summarized old
growth thresholds for a number of different regional forest
types (Table 1).

Table 1
Forest age and old growth threshold for forest types within Region 6 of the
USDA Forest Service (Fierst, 1992)
Location Forest type Site condition Main canopy
age (years)
Central Oregon White fir/Grand fir Low and medium 150
High 150
Blue Mountains White fir/Grand fir Low and medium 150
High 150
Westside Douglas-fir Low 200
Medium 205
High 190
Western Pacific silver fir Sites 2 and 3 180
Site 4 200
Site 5 260
Site 6 360
Westside Western hemlock Site 1 200
Site 2 200
SW Oregon Port-Orford cedar All 240
Eastside Douglas-fir All 150
Eastside Ponderosa pine Low 150–200
Medium and high 150–200
Eastside Subalpine fir Low 150
High 150
H. Jiang et al. / Remote Sensing of Environment 91 (2004) 320–331326
To avoid the extreme difficulty of trying to account for
each separate mature and old growth threshold for each
community type throughout the region, we chose a uniform
definition that would apply to the entire study area: 50–150
years for mature forests, and older than 150 years for old-
growth forests. We originally intended to define mature
forest as being between 80 and 150 years to fit the majority
of published definitions available for the region based
largely on ecological criteria. However, with logging rota-
tions falling well below the 80-year mark over much of the
region, we elected to drop the threshold to 50 years instead
since the final product was to be used for conservation
planning purposes. In this paper, we focus on late seral
forest (mature and old growth); however, we mapped other
land cover classes in the study as outlined below, but lump
them here as ‘‘other lands’’. The classes included:
(1) Old conifer forest (> 150 years)
(2) Mature conifer forest (50–150 years)
Table 2
Area (ha) and percent area of old conifer and mature conifer forests in the Pacifi
Ecoregion Total ecoregion
area (ha)
Old conifer
area (ha)
Cascade Mountains Leeward Forests (CMLF) 1,600,444 420,394
Northern Cascades Forests (NCF) 1,278,056 511,396
Puget Lowland Forests (PLF) 1,719,726 106,149
Central Pacific Coastal Forests (CPCF) 4,267,988 668,281
Central Southern Cascades Forests (CSCF) 4,481,279 1,328,796
Eastern Cascade Forests (ECF) 5,398,139 687,836
Klamath–Siskiyou Forests (KSF) 5,033,181 946,394
Willamette Valley Forests (WVF) 1,487,769 34,993
Entire PNW 25,266,582 4,704,240
(3) Other lands (including early regeneration (0–10 years),
young conifer (10–50 years), deciduous forest, open
forest/woodland, non-forest, clouds, and shadows)
(4) Water
Assigning age to conifer forest image data can take the
form of continuous values or discrete classes. Both methods
have utility and value to different users. We chose the later
because we wanted to generate results quickly and we knew
that an extensive field effort would not be possible.
2.5. Accuracy assessment
Map accuracy assessment was conducted using the
DOQ image data. A total of 2081 random distribution
points were assigned and evaluated. Because of the time
difference between the satellite imagery (2000 and 2001)
and DOQ images (early and mid-1990s), we removed all
accuracy assessment sample points where obvious human
or natural disturbance had occurred between dates (e.g.,
older forest in 1992 and open field in 2000). Dozens of
sample points were removed during the accuracy assess-
ment process. We used the KAPPA statistic, which
expresses the proportionate error generated by a classifi-
cation process relative to the error of completely random
classification, to evaluate accuracy. KAPPA analysis is a
discrete multivariate technique that is widely used (Con-
galton, 1991; Ma & Redmond, 1995; Jensen, 1996b;
Elmore et al., 2000). The accuracy and error matrices
showing errors of commission and omission were gener-
ated for all mapped cover classes.
3. Results and discussion
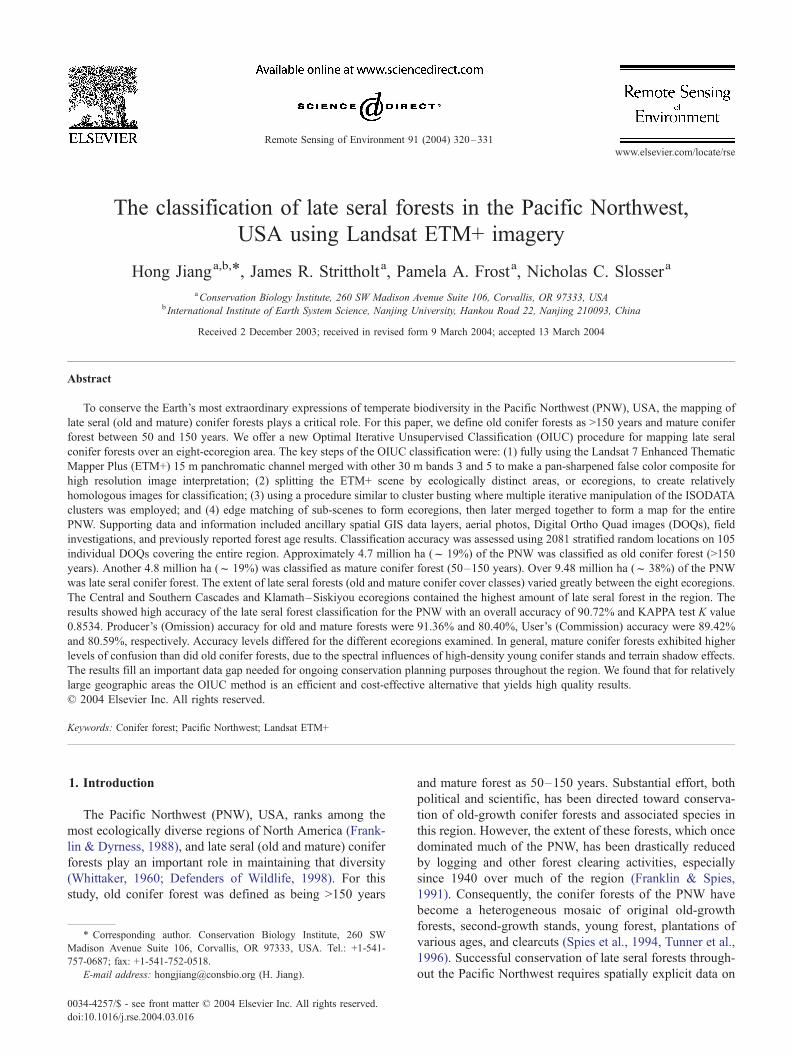
Nearly 19% of the PNW (4.7 million ha) was mapped as
old conifer forest and another 19% mapped (4.8 million ha)
as mature conifer forest. Thus, a total of over 9.48 million
ha (f 38%) of the PNW were mapped as late seral conifer
forest. The extent of late seral forests (old and mature
conifer cover classes) varied greatly between the eight
ecoregions (Table 2; Fig. 4). The Central and Southern
c Northwest, USA according to ecoregion
Percent of
ecoregion
Mature conifer
area (ha)
Percent of
ecoregion
Combined
area (ha)
Percent of
ecoregion
26.27 285,441 17.84 705,835 44.10
40.01 203,994 15.96 715,391 55.97
6.17 248,698 14.46 354,847 20.63
15.66 683,098 16.01 1,351,379 31.66
29.65 899,266 20.07 2,228,063 49.72
12.74 947,215 17.55 1,635,051 30.29
18.80 1,239,586 24.63 2,185,980 43.43
2.35 270,362 18.17 305,355 20.52
18.62 4,777,659 18.91 9,481,900 37.53
Fig. 4. Late seral forest mapping results for the PNW, USA.
H. Jiang et al. / Remote Sensing of Environment 91 (2004) 320–331 327
Cascades Forests (CSCF) led all other ecoregions with
approximately 1.3 million ha of old conifer forest followed
by the Klamath–Siskiyou Forests (KSF) with approximate-
ly 0.95 million ha. The Northern Cascades Forests (NCF)
contained the highest percent area of old conifer forest by
ecoregion than any other ecoregion (f 40%) followed by
the Central and Southern Cascades Forests (CSCF) with
nearly 30% and the Cascade Mountains Leeward Forests
(CMLF) with over 26%.
The Klamath–Siskiyou Forests (KSF) contained the
largest amount of mature conifer forest with over 1.2 million
ha followed by 0.95 million ha in the Eastern Cascade
Forests (ECF) and 0.89 million ha in Central and Southern
Cascades Forests (CSCF).

H. Jiang et al. / Remote Sensing of Environment 91 (2004) 320–331328
The percent area of mature conifer forest by ecoregion
was quite uniform for the eight ecoregions examined rang-
ing from 25% for the Klamath–Siskiyou Forests (KSF) to
14% for the Puget Lowland Forests (PLF).
Extent of old and mature conifer forest is not the only
important factor to consider when planning for forest
conservation. Spatial pattern is also extremely important
and is discussed in detailed by Jiang et al. (in review) using
this database. Previous studies have found spatial pattern to
vary widely across the forest landscapes of the PNW based
on differing land ownership, management strategies, and
human-induced disturbance regimes (Spies et al., 1994;
Tunner et al., 1996; Staus et al., 2002). Furthermore, what
the mapped results mean for forest conservation with
regards to management and policy in the PNW is currently
being examined as part of this research.
3.1. Map accuracy
A total of 2081 sample points were used including 662
for old conifer forests, 444 for mature conifer forests, and
975 for other lands. The classification of late seral forests
had an overall accuracy of 90.72% with a KAPPA test K
value of 0.8534. User (commission) accuracy results for old
and mature conifer forests were 89.42% and 80.59%,
respectively (Table 3). Results also showed high producer
(omission) accuracy for old conifer forests (91.36%) and
mature conifer forests (80.40%). User and producer accu-
racy was highest for the ‘‘other lands’’ class, 96.21% and
94.94% respectively.
Accuracy varied with the different ecoregions. Overall
accuracy was highest (93.96%) in the Puget Lowland
Forests (PLF), and the lowest (89.33%) in the Central
Pacific Coastal Forests (CPCF). The overall accuracy for
most ecoregions remained around 90% (Table 4).
In general, user accuracy for old conifer forest was
higher than that of mature conifer forest. In most ecor-
egions (except in CMLF where it was 76%), the user
accuracy for old conifer forest was >85%. User accuracy
for mature conifer forest ranged from 73.33% to 86.21%.
Producer accuracy showed a similar trend. Producer accu-
racy of old conifer forest ranged from 72.22% to 93.54%,
Table 3
Error matrix for late seral forest classification results for the Pacific Northwest, U
Classified data Reference data
Class Old conifer forests Mature conife
Old conifer forests 592 57
Mature conifer forests 49 357
Other lands 7 30
Total 648 444
Producer’s (%) 91.36% 80.40%
Overall accuracy (%) 90.72%
K 0.8534
with three ecoregions having an accuracy of over 90%
(PLF, NCF, and CSCF). Mature conifer forest producer
accuracies ranged from 72.58% to 91.66%, with one
ecoregion (WVF) having accuracy >90%. This could be
explained by the fact that the WVF ecoregion is relatively
flat eliminating shadow influence characteristic of the other
ecoregions in the study area. Producer accuracy for mature
conifer forest was >80% in only two ecoregions (NCF and
PLF). Lower producer accuracy for mature conifer forest
was more typical throughout the region, due primarily to
the relatively complex terrain, forest composition variabil-
ity, and the forest management history. For example,
mature conifer forest was most often confused with either
old conifer forest or high-density, younger conifer forest,
which was common in many of the more heavily managed
landscapes. This was especially true for planted Douglas-
fir plantations throughout large portions of the CPCF
ecoregion. Fiorella and Ripple (1993) also found the
highest level of confusion between mature and old-growth
forests. In their study, the mature category had the lowest
accuracy (69%) and the highest percent commission error
(55%). Similarly, Cohen et al. (1995) found user accuracy
for mature conifers low (56% correct) compared to old
conifers (75%).
Our results showed a similar pattern to these two
regional studies (old conifer class showing higher accu-
racy than the mature conifer class); however, our study
also showed a higher overall accuracy for both classes
compared to existing remote sensing studies in the region.
We believe this can be explained in two ways. First,
previous studies relied heavily on spectral features of the
imagery. Our OIUC procedure tried to take advantage of
the spectral features as well as the broader spatial pattern
delineated by using the pan-sharpened false color com-
posite imagery and other ancillary data and by subdivid-
ing the region into meaningful subregions for analysis.
Also, we intentionally allowed younger conifer stands
(50–80 years) to be included as mature conifer forest
unlike most previous remote sensing studies in the region
that usually used a cutoff of 80 years. For our purpose,
using the 50-year cutoff was more useful for input into
regional conservation planning efforts because of short
SA
r forests Other lands Total User’s (%)
13 662 89.42%
37 443 80.59%
939 976 96.21%
989 2081
94.94%

Table 4
Error matrices for late seral forest classification results for the Pacific Northwest, USA by ecoregion
Classified data Reference data
Class Old conifer forests Mature conifer forests Other lands Total User’s (%)
(1) Cascade Mountains Leeward Forests (CMLF)
Old conifer forests 22 6 1 29 75.86%
Mature conifer forests 5 20 0 25 80.00%
Other lands 0 0 34 34 100.00%
Total 27 26 35 88
Producer’s (%) 81.48% 76.93% 97.14%
Overall accuracy (%) 86.36%
K 0.7934
(2) Northern Cascades Forests (NCF)
Old conifer forests 95 3 6 104 91.35%
Mature conifer forests 6 60 4 70 85.71%
Other lands 1 5 136 142 95.77%
Total 102 68 146 316
Producer’s (%) 93.13% 88.24% 93.15%
Overall accuracy (%) 92.08%
K 0.8761
(3) Puget Lowland Forests (PLF)
Old conifer forests 29 3 1 33 87.88%
Mature conifer forests 2 25 2 29 86.21%
Other lands 0 2 56 58 96.55%
Total 31 30 59 120
Producer’s (%) 93.54% 83.33% 94.91%
Overall accuracy (%) 93.96%
K 0.8679
(4) Central Pacific Coastal Forests (CPCF)
Old conifer forests 104 8 0 112 92.85%
Mature conifer forests 12 76 4 92 82.60%
Other lands 2 13 207 222 93.24%
Total 118 97 211 426
Producer’s (%) 88.13% 78.35% 98.10%
Overall accuracy (%) 89.33%
K 0.8523
(5) Central and Southern Cascades Forests (CSCF)
Old conifer forests 165 12 4 181 91.16%
Mature conifer forests 12 55 8 75 73.33%
Other lands 1 3 166 170 97.64%
Total 178 70 178 426
Producer’s (%) 92.69% 78.57% 93.26%
Overall accuracy (%) 90.61%
K 0.8502
(6) Eastern Cascade Forests (ECF)
Old conifer forests 87 14 1 102 85.29%
Mature conifer forests 12 45 1 58 77.58%
Other lands 0 3 191 194 98.45%
Total 99 62 193 354
Producer’s (%) 87.87% 72.58% 98.96%
Overall accuracy (%) 91.24%
K 0.8521
(7) Klamath–Siskiyou Forests (KSF)
Old conifer forests 77 9 0 86 89.53%
Mature conifer forests 9 43 0 52 82.69%
Other lands 3 3 91 97 93.81%
Total 89 55 91 235
Producer’s (%) 86.51% 78.18% 100.00%
Overall accuracy (%) 89.78%
K 0.8428
H. Jiang et al. / Remote Sensing of Environment 91 (2004) 320–331 329
Table 4 (continued)
Classified data Reference data
Class Old conifer forests Mature conifer forests Other lands Total User’s (%)
(8) Willamette Valley Forests (WVF)
Old conifer forests 13 2 0 15 86.67%
Mature conifer forests 5 33 4 42 78.57%
Other lands 0 1 58 59 98.30%
Total 18 36 62 116
Producer’s (%) 72.22% 91.66% 93.55%
Overall accuracy (%) 89.65%
K 0.8263
H. Jiang et al. / Remote Sensing of Environment 91 (2004) 320–331330
forest rotations throughout much of the region. Lowering
the minimum age for mature forest also resulted in higher
accuracies for this class compared to previous studies.
3.2. Optimal Iteration Unsupervised Classification (OIUC)
methodology
The objective of vegetation classification using remote
sensing is to assign the digital image data (in the form of
pixels) into discrete and meaningful categories (Barrent &
Curtis, 1999). A correctly classified image will represent
areas of vegetation that share particular spectral character-
istics as specified by an established classification scheme
(Jensen, 1999; Richards & Jia, 1999; Lillesand & Kiefer,
2000; Dustan et al., 2001). Individual, or single-scene
classification potentially offers better accuracy for mapping
vegetation cover types than a mosaic of multiple scenes,
because of reduced pixel sample size and variability (Homer
et al., 1993; Jensen, 1996a; Franklin et al., 2000). Similarly,
our results showed that subdividing a scene into sub-scenes
provides even greater accuracy in vegetation classification
and forest seral stage identification.
The number of iterations of OIUC needed to produce
relatively pure clusters depends on the variability of spectral
traits within a given image. Sub-scenes covered by high-
density young conifer forests, shadows over variable terrain,
or some high-elevation forest types, generally required more
iterations to get pure clusters. Typically, one sub-scene
required three to four iterations.
Ten years ago, some remote sensing scientist (e.g., Cohen
& Spies, 1992) indicated the Landsat 7 ETM+ sensor, with a
15 m panchromatic channel, would likely be the next most
powerful source of satellite imagery for analysis of forest
stand attributes in the Pacific Northwest. Our results affirmed
the utility of applying ETM+ pan-sharpened 15 m imagery in
identifying the forest seral stages in the Pacific Northwest
when combined with other ancillary data sources.
The OIUC method was demonstrated to produce rela-
tively quick results that are useful to many conservation
applications. As larger government vegetation mapping
efforts continue, more detail will be available and welcomed
by the conservation community. In the meantime, we now
have a useful data layer that will help in regional conserva-
tion planning that covers all ownerships; is of high accuracy
for the classes chosen; and easily repeatable as the regional
forest landscape continues to change.
Acknowledgements
Funding was provided by The Paul G. Allen Forest
Protection Foundation, David and Lucille Packard Founda-
tion, and World Wildlife Fund. We are grateful for free
access the auxiliary GIS data layer from USFS, USGS,
BLM, Oregon Department of Forestry. We thank ERDAS
and the Environment Systems Research Institute (ESRI) for
their continuing support. We also thank R. Robinson and J.
Bergquist for their helpful assistance with image processing,
field survey and early manuscript revision as well as
anonymous reviewers of this manuscript whose comments
greatly improved the clarity of the final paper.
References
Barrent, E. C., & Curtis, L. F. (1999). Introduction to environmental remote
sensing (4th ed.) p. 452. London: Stanley Thornes.
Bingham, B. B., & Sawyer Jr., J. O. (1991). Distinctive features and defi-
nitions of young, mature, and old-growth Douglas-fir/hardwood forests.
In L. F. Ruggiero, K. B. Aubry, A. B. Carey&M.H. Huff (Eds.).Wildlife
and vegetation of unmanaged Douglas-fir forests. US Department of
Agriculture, Forest Service, Pacific Northwest Research Station, Port-
land, Oregon. General Technical Report PNW-GTR-285. pp. 363–378.
Boyd, D. S., Foody, G. M., & Ripple, W. J. (2002). Evaluation of
approaches for forest cover estimation in the Pacific Northwest, USA
using remote sensing. Applied Geography, 22, 375–392.
Cihlar, J. (2000). Land cover mapping of large areas from satellites: Status
and research priorities. International Journal of Remote Sensing, 21(6),
1093–1114.
Cohen, W. B., Maiersperger, T. K., Spies, T. A., & Oetter, D. R. (2001).
Modeling forest cover attributes as continuous variables in a regional
context with Thematic Mapper data. International Journal of Remote
Sensing, 22(12), 2279–2310.
Cohen, W. B., & Spies, T. A. (1992). Estimate structural attributes of
Douglas fir/western hemlock forest stands from Landsat and SPOT
imagery. Remote Sensing of Environment, 41, 1–17.
Cohen, W. B., Spies, T. A., & Fiorella, M. (1995). Estimating the age and
structure of forests in a multi-ownership landscape of western Oregon
U.S.A. International Journal of Remote Sensing, 16(4), 721–746.
Congalton, R. G. (1991). A review of assessing the accuracy of classifica-
tions of remote sensed data. Remote Sensing of Environment, 37, 35–46.
Congalton, R. G., Green, K., & Teply, J. (1993). Mapping old growth
forests on National Forests and Park Lands in the Pacific Northwest

H. Jiang et al. / Remote Sensing of Environment 91 (2004) 320–331 331
from remotely sensed data. Photogrammetric Engineering and Remote
Sensing, 59, 529–535.
Defenders of Wildlife (1998). Oregon’s living landscape: Strategies and
opportunities to conserve biodiversity (p. 210). Washington, DC:
Defenders of Wildlife.
Dustan, P., Dobson, E., & Nelson, G. (2001). Landsat thematic mapper:
Detection of shifts in community composition of coral reefs. Conser-
vation Biology, 15(4), 892–902.
Eby, J. R. (1987). The use of sun incidence angle and infrared reflec-
tance levels in mapping old-growth coniferous forests. Proceeding,
American Society of Photogrammetry and Remote Sensing. Reno,
NV: Fall Convention.
Elmore, A. J., Mustard, J. F., Manning, S. J., & Lobell, D. B. (2000).
Quantifying vegetation change in semiarid environments: Precision
and accuracy of spectral mixture analysis and the Normalized difference
vegetation index. Remote sensing of environment, 73, 87–102.
Fierst, J. (1992). Region 6, interim old growth definition for Douglas-fir
series, Grand fir/White fir series, interior Douglas-fir series, Lodgepole
pine series, Pacific Silver fir series, Ponderosa pine series, Port-Orford-
Cedar and Tanoak (Redwood) series, Subalpine fir series, and Western
hemlock series. Forest Service, USDA, 1993.
Fiorella, M., & Ripple, W. J. (1993). Determining successional stage of
temperate coniferous forests with Landsat satellite data. Photogrammet-
ric Engineering and Remote Sensing, 59, 239–246.
Franklin, J. F., & Dyrness, C. T. (1988). Natural vegetation of Oregon and
Washington (p. 452). Corvallis, OR: Oregon State University Press.
Franklin, S. E., Moskal, L. M., Lavigne, M. B., & Pugh, K. (2000).
Interpretation and classification of partially harvests forest stands in
the Fundy model forest using multitemporal Landsat TM digital data.
Canadian Journal of Remote Sensing, 26(4), 318–333.
Franklin, J. F., & Spies, T. A. (1991). Ecological definitions of Old-growth
Douglas-fir forests. In L. F. Ruggiero, K. B. Aubry, A. B. Carey & M.
H. Huff (Eds.). Wildlife and vegetation of unmanaged Douglas-fir for-
ests. Oregon: US Department of Agriculture, Forest Service, Pacific
Northwest Research Station Portland. General Technical Report
PNW-GTR-285. pp. 61–70.
Green, K., & Congalton, R. G. (1990). Mapping potential old growth
forests and other resources on national forest and parklands in Ore-
gon and Washington. Proceedings, GIS/LIS’ 90, annual convention
( pp. 712–723), Anaheim, CA.
Hayens, R. W. (1986). Inventory and value of old-growth in the Doug-
las-fir region. Research Note PNW-437. Portland, OR: US. Depart-
ment of Agriculture, Forest Service, Pacific Northwest Research
Station. 19 p.
Homer, C. G., Edwards, T. C., Ramsey, R. D., & Price, K. P. (1993). Use of
remote sensing methods in modelling sage grouse winter habitat. Jour-
nal of Wildlife Management, 48, 123–130.
Homer, C. G., Ramsey, R. D., Edwards Jr., T. C., & Falconer, A. (1997).
Landscape cover-type modeling using a multi-scene Thematic Map-
per mosaic. Photogrammetric Engineering and Remote Sensing, 63,
671–677.
Jennings, M. D. (2000). Gap analysis: Concepts, methods, and recent
results. Landscape Ecology, 15, 5–20.
Jensen, J. R. (1996a). Introductory digital image processing: A remote
sensing perspective (p. 325). New Jersey, USA: Prentice-Hall.
Jensen, J. R. (1996b). Introductory digital image processing: A remote
sensing perspective. Upper Saddle River: Prentice-Hall (318 pp.).
Jensen, J. R. (1999). Remote sensing of the environment: An earth resource
perspective (p. 450). New Jersey, USA: Prentice-Hall.
Lachowski, H., Maus, P., Golden, M., Johnson, J., Landrum, V., Powell,
J., Varner, V., Wirth, T., & Gonzales, J. (1996). Guidelines for the use
of digital imagery for vegetation mapping. New York: USDA, Forest
Service, EM-7140-25.
Lillesand, T. M., & Kiefer, R. W. (2000). Remote sensing and image
interpretation (4th ed.) (p. 725). New York: Wiley.
Ma, Z., & Redmond, R. L. (1995). Tau coefficients for accuracy assessment
of classification of remote sensing data. Photogrammetric Engineering
and Remote Sensing, 61, 435–439.
Morrison, P. H., Kloepeer, D., Leversee, D. A., Socha, C. M., & Ferber, D.
(1991). The ancient forests in the Pacific Northwest. Washington, DC:
Report by The Wilderness Society.
Ohmann, J. L., & Gregory, M. J. (2002). Predictive mapping of forest
composition and structure with direct gradient analysis and nearest-
neighbor imputation in coastal Oregon, U.S.A. Canadian Journal of
Forest Research, 32, 725–741.
Olson, D. M., Dinerstein, E., Wikramanayake, E. D., Burgess, N. D.,
Powell, G. V. N., Underwood, E. C., D’Amico, J. A., Itoua, I., Strand,
H. E., Morrison, J. C., Loucks, C. J., Allnutt, T. F., Ricketts, T. H.,
Kura, Y., Lamoreux, J. F., Wettengel, W. W., Hedao, P., & Kassem, K.
R. (2001). Terrestrial ecoregions of the World: A new map of life on
Earth. Bioscience, 51(9), 933–938.
Richards, J. A., & Jia, X. (1999). Remote sensing and digital image ana-
lysis (p. 362). New York: Springer-Verlag.
Ricketts, T. H., Dinerstein, E., Olson, D. M., Loucks, C. J., Eichbaum, W.,
Dellasala, D., Kavanagh, K., Hedao, P., Hurley, P. T., Carney, K. M.,
Abell, R., & Walters, S. (1999). Terrestrial ecoregions of North Amer-
ican, a conservation assessment. Washington, DC: Island Press.
Sabol Jr., D. E., Gillespie, A. R., Adms, J. B., Smith, M. O., & Tucker,
C. J. (2002). Structural stage in Pacific Northwest forest estimated
using simple mixing models of multispectral images. Remote Sensing
of Environment, 80, 1–16.
Sachs, D. L., Sollins, P., & Cohen, W. B. (1998). Detecting landscape
changes in the interior of British Columbia from 1975 to 1992 using
satellite imagery. Canadian Journal of Forest Research, 28, 23–36.
Scott, J. M., Davis, F., Csuiti, B., Noss, R., Butterfield, B., Groves, C.,
Anderson, H., Caicco, S., D’erchia, F., Edwards Jr., T. C., Ulliman, J.,
& Wright, R. G. (1993). Gap analysis: A geographic approach to pro-
tection of biological diversity. Wildlife Monographs. Moscow, ID: A
Publication of the Wildlife Society, University of Idaho (41 pp.).
Spies, T. A. (1991). Plant species diversity and occurrence in young, mature,
and old-growth Douglas-fir stands in western Oregon andWashington. In
L. F. Ruggiero, K. B. Aubry, A. B. Carey & M. H. Huff (Eds.). Wildlife
and vegetation of unmanaged Douglas-fir forests. US Department of
Agriculture, Forest Service, Pacific Northwest Research Station, Port-
land, Oregon. General Technical Report PNW-GTR-285. pp. 111–122.
Spies, T. A., & Franklin, J. F. (1991). Composition, function, and structure
of old-growth Douglas-fir forests. In L. F. Ruggiero, K. B. Aubry, A. B.
Carey & M. H. Huff (Eds.). Wildlife and vegetation of unmanaged
Douglas-fir forests. US Department of Agriculture, Forest Service, Pa-
cific Northwest Research Station, Portland, Oregon. General Technical
Report PNW-GTR-285. pp. 71–82.
Spies, T. A., Ripple, W. J., & Bradshaw, G. A. (1994). Dynamics and
pattern of a managed coniferous forest landscape. Ecological Applica-
tions, 4, 555–568.
Staus, N. L., Strittholt, J. R., Dellasala, D. A., & Robinson, R. (2002). Rate
and pattern of forest disturbance in the Klamath–Siskiyou ecoregion,
USA between 1972 and 1992. Landscape Ecology, 17, 455–470.
Tunner, M. G., Wear, D. N., & Flamm, R. O. (1996). Land ownership and
land-cover change in the southern Appalachian highlands and the
Olympic Peninsula. Ecological Applications, 6, 1150–1172.
Wayman, J. P., Wynne, R. H., Scrivani, J. A., & Reams, G. A. (2001).
Landsat TM-based forest area estimation using iterative guided spectral
class rejection. Photogrammetric Engineering and Remote Sensing, 67,
1155–1166.
Whittaker, R. H. (1960). Vegetation of the Siskiyou Mountains Oregon and
California. Ecological Monographs, 30, 279–338.
Wilson, E. H., & Sader, S. A. (2002). Detection of forest harvest type using
multiple dates of Landsat TM imagery. Remote Sensing of Environment,
80, 385–396.
Zheng, D., Wallin, D. O., & Hao, Z. (1997). Rates and patterns of land-
scape change between 1972 and 1988 in the Changbai Mountain area of
China and North Korea. Landscape Ecology, 12, 241–254.