Embed Size (px)
Citation preview
The Challenge of Terrorism
Todd Sandler, Daniel G. Arce, Walter Enders
Challenge Paper

This paper was produced for the Copenhagen Consensus 2008 project.
The fi nal version of this paper can be found in the book, ‘Global Crises, Global Solutions: Second Edition’,
edited by Bjørn Lomborg
(Cambridge University Press, 2009)
copenhagen consensus 2008 terrorism challenge Paper
Copenhagen Consensus 2008 Challenge Paper
Terrorism
by
Todd Sandler*
and
Daniel G. Arce School of Economic, Political & Policy Sciences
University of Texas at Dallas, GR31 800 W Campbell Road
Richardson, TX 75080-3021 USA 1-972-883-6725
Fax 1-972-883-6486 [email protected] [email protected]
and
Walter Enders Department of Economics and Finance
University of Alabama Tuscaloosa, AL 35487
1-205-348-8972 [email protected]
February 2008
*Todd Sandler is the Vibhooti Shukla Professor of Economics and Political Economy; Daniel Arce is a Professor of Economics; and Walter Enders is the Bidgood Chair of Economics and Finance. Sandler’s research was partially supported by the US Department of Homeland Security (DHS) through the Center for Risk and Economic Analysis of Terrorism Events (CREATE) at the University of Southern California, grant number N00014-05-0630. However, any opinions, findings, and conclusions or recommendations are solely those of the authors and do not necessarily reflect the views of the DHS.
copenhagen consensus 2008 terrorism challenge Paper
Introduction
Major terrorist campaigns date back to the Jewish Zealots’ struggle against the Roman Empire
from 48 AD to 70 AD; the Hindu Thugs’ brutal attacks against innocent travelers in India from
600 AD to 1836 AD; and the Assassins’ actions against the Christian crusaders in the Middle
East from 1090 AD to 1956 AD (Bloom, 2005; Rapoport, 1984). In fact, the Thugs may have
murdered over eight hundred people a year during their twelve-century existence (Hoffman,
2006, 82-83), making them twice as deadly on an annual basis as the modern era of terrorism
(1968-2006). Some form of terrorism has characterized civilization for the last two thousand
years. Each of the two recent globalization periods has been associated with transnational
terrorism that has international implications. In the earlier era of globalization starting in 1878
and ending in 1914, the anarchists waged a terrorist campaign that culminated in World War I.
More recently, leftists and fundamentalists utilized transnational terrorism to capture headlines
during the current era of globalization from the last third of the twentieth century to the present
day.
During the modern era of transnational terrorism, terrorists crossed borders and, in some
instances, staged incidents in foreign capitals to focus world attention on their cause or
grievance. Some high-profile attacks – e.g., Black September’s abduction of Israeli athletes
during the 1972 Munich Olympics, Hezbollah’s suicide bombing of the US Marine barracks in
Beirut on 23 October 1983, Hindu extremists’ downing of Air India flight 182 on 23 June 1985,
the downing of Pan Am flight 103 on 21 December 1988, the truck bombing of the World Trade
Center on 26 February 1993, and the near-simultaneous hijackings on 11 September 2001
(henceforth, 9/11) – made the world acutely aware of the potential threats posed by today’s
resourceful terrorists. The attacks on 9/11 struck at the financial and security symbols of
Copenhagen consensus 2008 Terrorism Challenge Paper
2
America and, in so doing, highlighted the vulnerability to terrorism of even the most powerful
nation on earth. Because it is human nature to overspend on unlikely catastrophic events, it is
likely that terrorists have succeeded in getting the world to overspend on counterterrorism, while
ignoring much more pressing problems for a world besieged with exigencies involving health,
the environment, conflict, and governance. Terrorism is a tactic of asymmetric conflict,
deployed by the weak for a strategic advantage against a strong opponent.
Transnational terrorism presents a unique challenge that differs fundamentally from the
other global crises studied by the Copenhagen Consensus. First, the number of lives lost or
ruined by transnational terrorism is rather minor compared with other challenges considered by
the Copenhagen Consensus. On average only 420 people are killed and another 1249 are injured
each year from transnational terrorist attacks. Nevertheless, the public in rich countries views
transnational terrorism as one of the greatest threats. This is rather ironic since over 30,000
people die on US highways annually, yet highway safety is not as much of a public concern.
Second, protective or defensive counterterrorism measures may merely deflect attacks to softer
targets. For example, the installation of metal detectors in airports in January 1973 decreased
skyjackings, but increased kidnappings and other hostage missions; the fortifications of US
embassies reduced embassy assaults, but increased assassinations of diplomatic officials (Enders
and Sandler, 1993, 2006a). Unlike other challenges, countermeasures may have unintended
harmful consequences: strong offensive measures against terrorists can lead to backlash attacks
as new grievances are created. Third, guarding against transnational terrorism can utilize
resources at an alarming rate without greatly reducing the risks. In contrast, terrorists require
moderate resources to create great anxiety in a targeted public. Fourth, transnational terrorism
poses a real dilemma for liberal democracies: responding too fully compromises democratic
Copenhagen consensus 2008 Terrorism Challenge Paper
3
principles and gains support for the terrorists, whereas responding too meekly loses constituency
support and exposes the government’s failure to protect lives and property (Wilkinson, 1986,
2001). Thus, government actions can become the root of future attacks. Fifth, terrorism can
assume more deadly forms involving chemical, biological, radiological, and nuclear attacks. The
signs of such threats are beginning to emerge (Ivanova and Sandler, 2006, 2007). Sixth,
evaluating solutions or actions against terrorism is particularly difficult owing to counterfactuals
– e.g., the incidence of terrorism without these actions – that are hard to identify. Typically, only
the benefit or cost side of a solution is readily known.
Basic Messages
This chapter has a number of basic messages that are troublesome and, perhaps, surprising.
Unlike many challenges, there is no solution to transnational terrorism because it is a cost-
effective tactic of the weak against a more formidable opponent. Very cheap terrorist attacks can
create significant anxiety – the material cost of a suicide attack may be as little as $150 and on
average kills twelve people (Hoffman, 2006; Pape, 2006). Some rogue nations utilize terrorism
as an inexpensive means to destabilize or harm other nations. Even effective antiterrorism
campaigns will only temporarily work until the terrorists either find new leaders or sources of
resources. Even if a terrorist group is annihilated, a new group may surface for some other
cause. Thus, terrorism can be put into remission but it cannot be eliminated. Granting terrorist
concessions will signal to future terrorists that terrorism pays, so that compromise may fuel
future terrorist campaigns (Sandler and Arce, 2003).
Three of the five “solutions” proposed here – business as usual, increased proactive
responses, and enhanced defensive measures – have very adverse benefit-cost ratios (BCRs)
Copenhagen consensus 2008 Terrorism Challenge Paper
4
under a wide range of scenarios, even when the most promising assumptions are invoked. The
most effective solutions are the cheapest, but they must overcome the greatest obstacles that
require either greater international cooperation or more sensitive and farsighted policymaking.
Such qualities seldom characterize rich countries’ actions. When it comes to security, nations
are especially loath to sacrifice much autonomy. The BCRs associated with some of our
solutions are driven by two primary considerations: the costs of counterterrorism and the losses
in the gross domestic product (GDP) in countries experiencing terrorist attacks. Estimates of
both of these factors are in the billions of US dollars. Unlike many challenges, lives lost and
damaged by transnational terrorism – though tragic – are relatively modest in number. Thus, our
Disability-Adjusted Life Years (DALYs) values for annual terrorism-related deaths and injuries
under various solutions are in the millions of US dollars. As a consequence, expenditures on
counterterrorism on the cost side and saved GDP on the benefit side become the essential
determinants of the BCRs of some solutions.
Both of these determinants are exceedingly difficult to calculate. Most countries do not
publish counterterrorism spending, because this information may be of strategic value to the
terrorists – the United States is an exception. Moreover, relevant expenditures may be in myriad
places in a government’s budget and difficult to allocate to antiterrorism per se. We must,
therefore, devise a means to estimate these expenditures based on what is observable. Because
the application of analytical techniques to the study of terrorism is still in its infancy, there are
only a few studies that have tried to estimate GDP consequences of terrorism. Two recent
studies are Blomberg, Hess, and Orphanides (2004) and Tavares (2004). The former study
allows us to estimate the consequences of transnational terrorism on reduced per capita GDP
growth, which can then be translated into GDP losses. Although today’s terrorists are bent on
Copenhagen consensus 2008 Terrorism Challenge Paper
5
causing great economic harm, the past influence of transnational terrorist attacks on economic
growth has been fortunately small. While this may not be true of a terrorism-ridden region (the
Basque Country in Spain) or a small country (Israel) experiencing a sustained campaign (Abadie
and Gardeazabal, 2003; Eckstein and Tsiddon, 2004), it is generally true of most diversified
countries where economic activities from terrorism-prone sectors shift to more secure sectors
(Sandler and Enders, 2007). Given this limited influence of terrorism on GDP, homeland
security costs of some solutions swamp GDP savings from fewer attacks, thus resulting in
adverse BCRs. We demonstrate that the “war on terror” following 9/11 did reduce transnational
terrorism during the ensuing two years as the al-Qaida network was greatly stressed;
nevertheless, the associated BCR is much less than one.
A study like this one requires many heroic assumptions that obviously affect the BCRs
attached to the solutions. At every decision juncture in the estimates for our enhanced security
solutions, we chose calculation methods that give greater weights to benefits and smaller weights
to costs so as to keep the BCRs as high as possible. Thus, our adverse BCRs for these three
security solutions are robust to alternative assumptions. Even the use of value of life
calculations, which are more in keeping with rich countries’ practices, does not alter our
qualitative conclusions.
Primer
Terrorism is the premeditated use or threat to use violence by individuals or subnational groups
against noncombatants in order to obtain a political or social objective through the intimidation
of a large audience beyond that of the immediate victim. Two essential constituents of the
definition are violence and the presence of a political or social motive. Violent acts for extortion
Copenhagen consensus 2008 Terrorism Challenge Paper
6
purposes are crimes but are not terrorism. Similarly, violence for revenge or sociopathic reasons,
such as the shootings at Columbine High School or Virginia Tech, are crimes that create much
fear and anguish, but are not terrorism since there is no political motive. Without violence or its
threat, terrorists cannot induce a political decision maker to respond to their demands. Even with
the violence, concessions are often not granted. Terrorists broaden their audience beyond their
immediate victims by making their attacks appear to be random, so that everyone feels at risk.
Unlike some criminal acts in large cities, terrorist incidents are not random but well-planned and
often well-executed attacks, where terrorists weigh the risks, costs, and payoffs carefully.
Terrorism definitions contain at least three other key ingredients: the victim, the
perpetrator, and the audience. The identity of the victims is the most controversial. Some
definitions require the victim to be a noncombatant, so that an attack against a soldier of an
occupying force is not considered to be terrorism even when the attackers are asking for political
change – e.g., the pullout of the forces. However, the US Department of Defense’s definition of
terrorism drops the noncombatant distinction. Virtually all definitions consider politically
motivated attacks against civilians as terrorism. The data set International Terrorism: Attributes
of Terrorist Event (ITERATE) includes terrorist actions against peacekeepers, but not against an
occupying army, as acts of terrorism (Mickolus et al., 2006).1 Though less controversial, the
identity of the perpetrator also presents difficulty. Most definitions exclude state terror where a
state or government uses terror tactics against its own citizens (e.g., China’s actions during the
Cultural Revolution). Our definition follows this practice by characterizing the perpetrators as
individuals or subnational groups but not the state itself. States can, however, sponsor terrorists
through funding, training, intelligence, equipment, safe haven, freedom from prosecution, or
other means (Mickolus, 1989). State-assisted terrorism is known as state-sponsored terrorism
Copenhagen consensus 2008 Terrorism Challenge Paper
7
and is included in ITERATE. The downing of Pan Am flight 103 is considered to have been
state sponsored by Libya, since a Libyan intelligence agent has been found guilty of the attack.
Evidence gathered following the La Belle discotheque bombing in West Berlin on 4 April 1986
pointed to Libyan sponsorship. In reaction, the United States launched a retaliatory raid on
Libya on 15 April 1986. The US Department of State (2003) included Cuba, Iran, Iraq, Libya,
North Korea, Sudan, and Syria on a list of state sponsors of terrorism. More recently, Iraq and
Libya have been removed from the list (US Department of State, 2007). Finally, the audience
refers to the target group that the terrorist campaign is meant to intimidate. The 9/11 attacks
were intended to cause anxiety in the flying public and people who work in large cities. Thus,
the audience extended beyond those killed and injured on 9/11. In many ways, 9/11 had a global
audience.
Terrorists desire the widest possible audience so that their demands and horrific events
become known. Their campaign seeks to circumvent the normal political process through threats
and violence. By intimidating a target population, terrorists want this audience to feel
sufficiently vulnerable to apply pressure on decision makers to give into terrorist demands.
Political decision makers must weigh the anticipated costs of conceding, including possible
counter-grievances from other interests, against the expected costs of future attacks. When the
consequences of future incidents outweigh the costs of concessions, the government may grant
the terrorist demands. Traditionally, terrorists pose a greater problem for liberal democracies
than for autocracies (Eubank and Weinberg, 1994, 2001; Weinberg and Eubank, 1998). This
follows because liberal democracies must be restrained in their reaction, while autocracies can be
unrestrained. Many characteristics of liberal democracies – freedom of association, rights of the
accused, freedom of movement, funding opportunities, periodic elections, and information
Copenhagen consensus 2008 Terrorism Challenge Paper
8
availability – provide the perfect environment for terrorists to plan and execute their actions.
Most important, liberal democracies have press freedoms that allow terrorists to seek the media
attention that they crave. Eubank and Weinberg (1994) showed that incipient democracies, as in
some developing countries, are especially prone to terrorist events.
Domestic versus Transnational Terrorism
Another crucial distinction is between domestic and transnational terrorism. Domestic terrorism
is homegrown and has consequences for just the host country, its institutions, citizens, property,
and policies. In a domestic incident, the perpetrators, victims, and audience are all from the host
country. Moreover, there is no foreign sponsorship or involvement in a domestic terrorist event.
Timothy McVeigh’s bombing of the Alfred P. Murrah Building in Oklahoma City in April 1995
was the deadliest domestic terrorist event in US history. Civil wars are often associated with
domestic terrorism that an insurgency can direct at the ruling government or general population.
The government may respond with state terror (e.g., death squads) against a population of
potential supporters of the insurgency.
Targeted liberal democracies have frequently employed the right balance of defensive
and proactive policies against domestic terrorist threats. In Italy, the Red Brigades was brought
to justice; in France, Action Direct members were captured; and in Belgium, Combatant
Communist Cells members were also apprehended. Although these groups engaged in some
transnational terrorist attacks, their biggest threat was to the host country. When confronted with
domestic terrorism, a country cannot sit back and hope that another country will dispose of the
threat, since no other country is at risk. A targeted country has no choice but to confront the
threat with appropriate counterterrorism measures.
Copenhagen consensus 2008 Terrorism Challenge Paper
9
Transnational terrorism involves incidents where the perpetrators, victims, or audience
are from two or more countries. If an incident begins in one country but terminates in another,
then the incident is a transnational terrorist event, as is the case of a midair hijacking of a plane
that leaves Athens bound for Cairo and is made to fly to Algiers. The kidnappings of foreign
workers in Iraq in 2004 are transnational terrorist events. The toppling of the World Trade
Center towers on 9/11 was a transnational terrorist incident because the victims were from ninety
different countries, the mission had been planned and financed abroad, the terrorists were
foreigners, and the targeted audience was global. An attack against a multilateral organization is
a transnational terrorist incident owing to its multicountry impact and victims, as in the case of
the suicide car bombing of the UN headquarters in Baghdad on 19 August 2003. The Popular
Front for the Liberation of Palestine (PFLP) seizure of eleven Organization of Petroleum
Exporting Countries (OPEC) ministers in Vienna on 21 December 1975 is another instance of
transnational terrorism. Most terrorist events directed against the United States and its people
and property do not occur on US soil and, hence, are transnational terrorist events. In fact, 40%
of all transnational terrorism is directed at US interests (Enders and Sandler, 2006a).
[Figure 1 near here]
Based on data from the (National) Memorial Institute for the Prevention of Terrorism
(MIPT)(2006), Figure 1 displays annual amounts of domestic and transnational terrorism. The
domestic terrorism time series starts in 1998 because MIPT only began gathering statistics on
such incidents at that time. The rise in domestic terrorist events is due, in part, to MIPT’s
augmented capability over time in collecting the data. Domestic terrorism is much more
prevalent than transnational terrorism; nevertheless, we focus on transnational terrorism as the
challenge since we are interested in putting this transfrontier problem into perspective with
Copenhagen consensus 2008 Terrorism Challenge Paper
10
respect to the other transfrontier challenges studied by the Copenhagen Consensus. Moreover,
the civil war chapter indirectly includes the consequences of domestic terrorism in its casualty
and economic consequences. Transnational terrorism is a global concern because grievances or
issues in one country can cause a terrorist attack in another country as the perpetrators seek the
maximum media coverage. As rich countries institute tighter security measures at home, this
action can alter the geographical distribution of these events so that prime-target countries’ assets
are hit at softer foreign venues (Enders and Sandler, 2006b).
Terrorism must also be distinguished from some related concepts, such as war, guerrilla
warfare, and insurgencies. War is generally more discriminating than terrorism in its targeting.
In a war, civilians are typically not taken hostage or targeted.2 War also abides by certain
conventions with respect to the treatment of prisoners and the observance of diplomatic
immunity (Hoffman, 2006). In contrast, terrorists make their own rules and go after civilians
because they are easy targets that create maximum anxiety for the population. War is on a much
grander scale than terrorism and involves much greater casualties and damages. In many wars,
especially guerrilla wars, terrorism is one tactic of many deployed by adversaries to weaken the
enemy. Guerrilla warfare involves large paramilitary groups that control territory from which to
launch attacks against targets that often include the host country’s military. In Colombia, Fuerza
Armadas Revolucionarias de Colombia (FARC) is a paramilitary force that numbers in the
thousands and employs terrorism and other methods (e.g., armed attacks) in its confrontation
with the government. Although FARC has conducted some transnational terrorist attacks in
Colombia on foreign interests, FARC relies on domestic terrorism and other operations. Finally,
an insurgency intends to overthrow a government through the use of irregular military operations
that may include terrorism (Hoffman, 2006). Insurgencies are used against occupying forces and
Copenhagen consensus 2008 Terrorism Challenge Paper
11
unpopular governments. As a winning strategy, insurgencies try to gain popular support through
propaganda aimed at exposing the alleged injustices of the government. Civil wars are often
associated with insurgencies and guerrilla warfare.
On Terrorist Rationality
From an economist’s viewpoint, rationality is not determined on the basis of the desirability of
an agent’s objective or tactics. We consider terrorists to be rational actors who respond in an
appropriate and predictable fashion to changes in their constraints as they optimize their
objective while confronting an adversary who is trying to outwit and defeat them. Consequently,
we must anticipate that terrorists will try to minimize the impact of counterterrorism actions of
the government. Thus, actions by governments to protect their officials shifted attacks to
business people and others – tourists and ordinary citizens – as the terrorists accounted for the
augmented security afforded to officials. Such reactions underscore terrorist rationality. As
shown below, terrorists are better adept at making collective decisions than targeted
governments, which often work at cross-purposes with one another (Enders and Sandler, 2006a;
Sandler, 2005). For the analysis of this challenge, terrorist rationality and anticipated reactions
are crucial in evaluating the stream of benefits and costs, associated with the solutions later
offered to this challenge.
Causes of Transnational Terrorism
Terrorism can stem from various causes that include: ethno-nationalism, separatism, social
injustice, nihilism, single issues (e.g., animal rights), fundamentalist beliefs, religious freedom,
anticapitalism, and leftist ideology. Often, terrorist campaigns, fueled by ethno-nationalism or
Copenhagen consensus 2008 Terrorism Challenge Paper
12
separatism, are domestic in orientation as attacks are directed at weakening the government or
else in forcing it to overreact so as to lose popular support. David Rapoport (2004) characterizes
four waves of terrorism since the late 1870s. The first wave was the anarchists whose campaign
had a strong transnational orientation as they tried to internationalize their struggle by exporting
it to other countries including the labor movement in the United States. During the second wave,
the anti-colonialists were active in gaining independence during the 1950s and 1960s – e.g.,
Algeria and Cyprus. Some of these anti-colonial campaigns had transnational implications
through the use of the foreign press to make their grievances known more broadly. The left-
wing terrorists were the dominant influence during the third wave from the late 1960s. This
wave marked the emergence of modern transnational terrorism as terrorists routinely took their
attacks to foreign airports and capitals to get noticed. This was particularly true of the left-wing
Palestine Liberation Organization (PLO) and its offshoots such as the PFLP that sought an
independent Palestinian state. To get the attention of Israel and its supporters, Palestinian
terrorist groups staged some spectacular incidents abroad. Within Europe, leftist terrorist groups
attacked symbols of capitalism and imperialism, which at times included foreign corporations,
foreign military personnel, and multilateral organizations. The fourth, and current, wave consists
of fundamentalist terrorism, which began with the Soviet invasion of Afghanistan and the Iranian
students’ takeover of the US embassy in Tehran in November 19793. Currently, half of the
active transnational terrorist groups are fundamentalist in orientation (Hoffman, 2006). Elements
of past waves remain as a new wave ensues. Although the fundamentalists are the main
influence today, representative groups from the first three waves – especially, the leftists – are
present today (Hoffman, 2006). Today’s leftists carry on anti-globalization campaigns that
attack multilateral and capitalist institutions.
Copenhagen consensus 2008 Terrorism Challenge Paper
13
Fundamentalist terrorism has foundations in all of the major religions – for example,
Hindu extremists brought down Air India flight 182 on 23 June 1985, and a Jewish extremist
assassinated Israeli Prime Minister Yitzhak Rabin in November 1995. Nevertheless, Islamic
fundamentalists are by far the main influence on transnational terrorism today. Their demands
range from an Islamic fundamentalist state to the United States leaving the Gulf states. In other
instances, Islamic fundamentalists call for the destruction of Israel. An al-Qaida loosely
affiliated network includes groups such as al-Qaida Iraq, Abu Sayyaf, Jemaah Islamiyah, al Jihad
(Egyptian Islamic Jihad), al-Qaida Saudi Arabia, and others in many countries such as Tunisia,
Pakistan, Jordan, Egypt, Indonesia, Kuwait, the Philippines, Yemen, Kenya, and Saudi Arabia
(Hoffman, 2003; US Department of State, 2003).
[Table 1 near here]
Table 1 indicates some primary contrasts between the two main terrorist influences today.
Obviously, the fundamentalists present the much greater threat as they target more
indiscriminately and consider any nonbeliever, even women and children, as a legitimate target.
Indeed, even the unintentional death of Muslim bystanders can be tolerated (Wright, 2006, 174-
175). The attacks on 9/11 demonstrate that some of these groups will go to extreme measures to
maximize carnage. Those attacks are estimated to have caused $80-90 billion in costs
(Kunreuther, Michel-Kerjan, and Porter, 2003). Faced with such destructive attacks and the
desire of al-Qaida to employ chemical, biological, radiological, and nuclear attacks (Hoffman,
2006), the huge increases in homeland security expenditures following 9/11 may be easily
understood from the viewpoint of a prime-target nation, such as the United States. Moreover,
Scheuer (2006, 20-21) contends that al-Qaida is unique because it poses a direct national security
threat to America, has more growth potential, and is more religiously motivated than any other
Copenhagen consensus 2008 Terrorism Challenge Paper
14
organization associated with the current wave of terrorism. The contrasts in Table 1 underscore
that the fundamentalists are bent on killing people and can be anticipated to escalate the carnage
by employing ever more deadly means of attacks. Their use of suicide bombing has proven
deadly – twelve times more deadly than conventional terrorism (Pape, 2006).
In contrast to left-wing terrorists, Michael Scheuer (2006, 5) states that, “the United
States and the West have little useful context in which to try to understand Osama bin Laden.”
Scheuer blames the rise of fundamentalist terrorism on failed US foreign policy, including the
stationing of troops in Saudi Arabia, economic sanctions against Iraq, and other actions in the
Middle East and the Muslim world. Scheuer and others (see, e.g., Bloom, 2005) argue that the
Islamic world hates US foreign policy (e.g., support of Muslim world’s absolutist kings and
denial of Palestinian human rights). Bin Laden is able to tap into this hatred in his fatwa and call
to arms. Scheuer’s message is that the United States and its allies can do much to defuse the
terrorism threat by applying a different mindset to its policy that impact Islamic countries so as
to minimize the humiliation that some of their citizens feel. For starters, the United States must
realize that ideas and values must be exploited to US advantage to stem the current wave of
fundamentalist terrorism. Western values do not apply universally and may import poorly to
countries with little experience with democracy. In addition, the war on terror must eschew
overly harsh proactive measures, such as the excesses of Abu Ghraib Prison, that initiated a
kidnapping campaign against foreigners in Iraq. Detentions without trials in Guantánamo Bay
tarnish the principles of American liberty and justice, and create new grievances that can result in
future terrorist attacks. This is a lesson that should have been learned from the French
experience in Algeria and Indochina.
Copenhagen consensus 2008 Terrorism Challenge Paper
15
Statistical Overview
We now present a brief statistical overview of terrorism drawing data from ITERATE, MIPT,
and the non-defunct US Department of State (1989-2004) Patterns of Global Terrorism.4 The
available data are events data that are coded from media accounts of terrorist events. For
example, ITERATE relies on a host of sources for its information, including the Associated
Press, United Press International, Reuters tickers, the Foreign Broadcast Information Services
(FBIS) Daily Reports, and major US newspapers. Mickolus (1982) first developed ITERATE
for the period running from 1968 through 1977. The data set now covers 1968-2005 (Mickolus
et al., 2006). Coders use the descriptions of the various terrorist events to construct time-series
data for forty key variables common to all transnational terrorist incidents. Coding consistency
for the data is achieved by applying identical criteria and maintaining continuity among coders
through the use of overlapping coders and monitors. ITERATE excludes guerrilla attacks on
military targets of an occupying force and all terrorist incidents associated with wars or major
military interventions. MIPT also uses these conventions and is jointly gathered by RAND and
researchers at St. Andrews University, Scotland. US Department of State data also apply a
nearly identical operational definition for transnational terrorism.
[Table 2 near here]
In Table 2, the number of transnational terrorist incidents per year is listed for 1968
through 2006, complete with the number of deaths and injuries. The primary source of this data
is the US Department of State (various years), with figures for 2004-2006 coming from MIPT
(2006). There are some things to note about the data – e.g., on average only 420 persons are
killed and another 1249 are injured annually by transnational terrorism. Thus, transnational
terrorism is associated with relatively few casualties compared with other challenges studied by
Copenhagen consensus 2008 Terrorism Challenge Paper
16
the Copenhagen Consensus. Regarding the number of incidents, the peak of transnational
terrorism occurred in the 1980s, which was the era of state sponsorship. The number of deaths
and injuries varies by year, with some years displaying greater totals. Except for 2001, injuries
show more variability than deaths. Enders and Sandler (1995) show that transnational terrorism
goes through cycles. The figures in Table 2 prove important for our counterfactual exercise,
since they will enable us to identify likely influences of increases in either proactive or defensive
measures that followed 9/11. The variability in casualty totals is due in part to the presence of
large-scale attacks (i.e., “spectaculars”) that can greatly affect yearly totals. In 2001, 9/11 had
the main influence on deaths, while, in 1998, the simultaneous bombings of the US embassies in
Kenya and Tanzania had the primary influence on deaths and injuries. Compared with everyday
events such as automobile accidents, transnational terrorism kills and maims relatively few
individuals.
[Table 3 near here]
In Table 3, domestic incidents and their casualty values are indicated for 1998 and
beyond. The much higher totals in 2005 and 2006 are due to two factors: the insurgency in Iraq
and its many car bombings and MIPT’s improved capability in recording these events over time.
Domestic events are also tabulated by the National Counterterrorism Center, established after
9/11. Table 4 lists some spectacular terrorist events. The date, the event, the perpetrator, and the
number of deaths are indicated in the four columns beginning with the Zionist bombing of the
King David Hotel, which housed the British military headquarters in Jerusalem. This event was
a large factor in the British deciding to give Israel its independence. With the exception of the
Beslan school seizure, bombings and the downing of airplanes are the primary spectacular
events. Fundamentalist terrorists have figured prominently in the spectaculars, thus concurring
Copenhagen consensus 2008 Terrorism Challenge Paper
17
with the lessons drawn from Table 1. Moreover, Table 4 shows that conventional attacks are
capable of killing relatively large numbers of people. Nonetheless, with the exception of 9/11,
the death tolls tend to be in the hundreds for such large-scale incidents.
[Table 4 and Figure 2 near here]
To give a fuller picture of transnational terrorism, Figure 2 indicates the time series plots
of incidents per quarter for bombings and all transnational terrorist incidents, based on ITERATE
data for 1968-2005. A number of features are worth highlighting. First, both series display
peaks and troughs, indicative of cycles. Some large peaks followed key events such as the peak
in the middle of 1986 after the US retaliatory raid on Libya or the peak in early 1991 after the
US-led Gulf War. US foreign policy can instigate waves of terrorist attacks. Second, bombings
are the favorite tactic of terrorists, accounting for about half of all attacks. The bombing series
imparts its general shape to the all-incident series. Third, from the early 1990s to about 2002,
there is a downward trend to both series owing to less state sponsorship during the post-Cold
War era (Enders and Sandler, 2000, 2002; Hoffman, 1998). The fall of the communist regimes
also meant that left-wing ideology lost some of its appeal to potential terrorists and their
supporters. Fourth, there has been some upward drift in attacks in the last couple of years,
following a lull after the war on terror began. Figure 3 displays the proportion of transnational
terrorist incidents with casualties – i.e., attacks with a death or an injury – on a quarterly basis.
This time series also displays peaks and troughs. The key feature is the clear upward drift from
the early 1990s – the time at which fundamentalist terrorists became the dominant force. As
Table 1 implies, the rise of fundamentalist terrorists resulted in more carnage, which came at a
time when transnational terrorist attacks were fewer in numbers. This increase in lethality of
transnational terrorism is what worries the world, particularly prime-target rich nations. The use
Copenhagen consensus 2008 Terrorism Challenge Paper
18
of domestic terrorism in large-scale car bombings in the emerging civil war in Iraq also feeds this
anxiety as some countries fear that such attacks may be eventually employed in transnational
terrorist incidents in major capitals.
[Figure 3 near here]
Economic Consequences of Terrorism
Terrorists are intent to cause economic hardship on targeted economies. Terrorism can impose
costs on a targeted country through a number of avenues. Terrorist incidents have economic
consequences by diverting foreign direct investment (FDI), redirecting public and private funds
to security, or limiting international trade. If a developing country loses sufficient FDI – an
important source of savings – from terrorism, then it may experience reduced economic growth.
Just as capital may take flight from a country plagued by a civil war (see Collier et al., 2003), a
sufficiently intense terrorist campaign may greatly reduce capital inflows (Abadie and
Gardeazabal, 2007; Blomberg and Mody, 2005; Enders and Sandler, 1996; Enders, Sachsida, and
Sandler, 2006). In some instances, terrorism may impact specific industries as 9/11 did on
airlines and tourism (Drakos, 2004; Enders, Sandler, and Parise, 1992; Ito and Lee, 2004). Other
growth-reducing impacts from terrorism can come from investment being redirected to
government expenditure in terms of homeland security (Blomberg, Hess, and Orphanides, 2004).
In general, transnational terrorism increases the costs of doing business in a country and this can
have economic ramifications.
Although the study of the economic consequences of terrorism is not well-researched,
some general principles are emerging from recent studies.5 Given the low intensity of most
transnational terrorist campaigns in a given country, the macroeconomic consequences of
Copenhagen consensus 2008 Terrorism Challenge Paper
19
terrorism are generally modest and short-lived. Transnational terrorism is not on par with civil
or guerrilla wars and, in general, has fairly localized economic effects. The likely candidate
countries for discernible GDP losses are either developing or small countries that experience a
protracted terrorist campaign. A spectacular attack, like 9/11, can affect GDP in any country.
Generally, rich diversified economies are able to endure terrorism with limited GDP influences
because activities will shift to less risky sectors. Moreover, rich countries can apply monetary
and fiscal policies to ameliorate the impact. Such countries can regain citizens’ confidence by
augmenting homeland security, which has some GDP implications. Most of the impact of
transnational terrorism will be to specific sectors that confront enhanced terrorism risks.
Surprisingly, most large-scale terrorist incidents have had little effect on stock markets. The
noteworthy exception is 9/11 where stock market took 30 to 40 days to recover from the initial
and large sell-off (Chen and Siems, 2004).
Why Is Transnational Terrorism So Difficult to Eradicate?
Transnational terrorism is so difficult to eradicate because it is so cheap and effective in
capturing the world’s attention. In essence, terrorists require minimal resources to mount
attacks. A terrorist group can, at times, be annihilated, but new groups will surface, lured by the
power of taking actions against a much more formidable enemy. Moreover, actions to kill a
group’s leaders may result in more ruthless leaders replacing them, as the Israelis discovered
with respect to Black September and Hamas. In Table 5, the size of some of the primary terrorist
groups is listed, based on figures from the US Department of State (2003). A couple of
observations are noteworthy. Despite its huge expenditures on intelligence, governments are ill-
informed about the strength of terrorists. In April 2001, the US Department of State (2001, 69)
Copenhagen consensus 2008 Terrorism Challenge Paper
20
estimated al-Qaida numbers as “several hundreds to several thousands” – far below subsequent
estimates following the US-led invasion of the Taliban in Afghanistan on 7 October 2001.
Although some countries’ armies number in the hundreds of thousands, most terrorist groups are
small and number in the hundreds. An insurgent group, such as FARC, numbers in the
thousands, but this is very unusual.
[Table 5 near here]
The operational budget of al-Qaida was put at $30 million prior to 9/11 (National
Commission on Terrorist Attacks upon the United States, henceforth 9/11 Commission, 2004,
170) with much of the money going into training camps and infrastructure. Generally, terrorist
attacks are inexpensive and create much more damage to the targeted society than they cost. In
Table 6, we present the damage inflicted compared to the material costs of operation for seven
major terrorist attacks. The right-hand column gives the “damage exchange ratio,”6 which
indicates the payback per dollar of operation. These ratios range from 3,200:1 (African
embassies bombings) to 1,270,000:1 (London transportation bombing), thus showing that some
terrorist incidents have an amazing payback in damages relative to the costs of the operation. Of
course, such ratios only include the variable costs of the action and do not put a value on the
lives of any terrorists killed. Even if fixed costs are proportioned to an operation and the
terrorists’ lives are valued, the damage exchange ratios are still huge. In a recent study, Enders,
Sachsida, and Sandler (2006) show that on average each US-directed transnational terrorist
incident in OECD countries reduced US foreign direct investment stock in the targeted country
by $1 million, yet cost very little to execute.
[Table 6 near here]
Given the small costs of such operations, targeted countries have a difficult time in doing
Copenhagen consensus 2008 Terrorism Challenge Paper
21
away with transnational terrorism, because terrorists need to shift very little money to fund a
particular operation. Thus, terrorists can transfer their money in small transactions – under
$5,000 – because only transfers above this ceiling must be reported under current guidelines. In
addition, terrorists can use the hawala system of informal cash transfers, where bookkeeping
balances are held and settled among a network of balance holders at a later time through a wire
transfer or an exchange of commodities. Terrorists have engineered means – e.g., trade in
precious commodities – to transfer funds following efforts after 9/11 to limit the funding of
missions. Transnational terrorism is virtually impossible to eradicate because terrorists need
minimal resources and little manpower to set up shop.
Asymmetries between Terrorists and Targeted Governments
There are many asymmetries between transnational terrorists and their targeted governments
that, unfortunately, work to the terrorists’ advantage. Perhaps, the most essential asymmetry
involves how the terrorists are able to cooperate, thereby solving their collective action problem,
while governments are less able to cooperate. Dating back to the late 1960s, transnational
terrorist groups have collaborated in loose networks (Hoffman, 1998). Terrorist cooperation
assumes many forms, including training, intelligence, safe haven, financial support, logistical
assistance, weapon acquisition, and exchange of personnel (Alexander and Pluchinsky, 1992).
By contrast, governments place a huge value on their autonomy over security matters and this
limits their cooperation, except following an exigency such as 9/11. What other factors explain
this difference in achieving collective action by terrorists and targeted governments? Sandler
(2005) attributes this difference to three asymmetries. First, governments’ strength provides a
false sense of security, thereby blindsiding them to their need for cooperation to be more
Copenhagen consensus 2008 Terrorism Challenge Paper
22
effective against the transnational terrorist threat. By contrast, terrorists’ relative weakness,
compared to the formidable governments that they attack, means that terrorists must pool
resources to augment their modest arsenals. Second, governments often do not agree on which
groups are terrorists – e.g., until recently, the European Union (EU) did not view Hamas as
terrorists. Despite different agendas, supporters, and goals, many groups agree on similar
opponents – the United States and Israel. The Palestinian terrorists and European left-wing
terrorists shared similar ideologies and enemies. Third, governments and terrorists make
decisions with different time horizons. In liberal democracies, government officials display
interests that only extend to the next election period unless they are certain of reelection.
Because governments turn over, past agreements to combat terrorism may not be honored by
new leaders, thus limiting the anticipated gains from such agreements. For example, in reaction
to the 3/11 Madrid train bombings, Spanish Prime Minister Zapatero withdrew his country’s
strong support of Bush’s war on terror following Zapatero’s win in the 2004 national elections.
Government officials tend to show little patience when making counterterrorism policies – i.e.,
they display a high discount rate. Terrorist leaders demonstrate much greater patience because
they are usually tenured for life, so they view intergroup cooperative arrangements as continual.
As such, terrorists place more weight on future benefits than targeted governments. Terrorist
groups know that reneging on pledged cooperation with another group will not only lead to
retribution with that group withholding support in the future, but it also tarnishes the group’s
reputation, thus jeopardizing its ability to cooperate with other groups.
Through successful collective action, terrorists gain an advantage over governments.
With the formation of global networks, terrorists can identify and exploit softer targets wherever
they appear. Given the smaller cooperation among governments, softer targets or weak links are
Copenhagen consensus 2008 Terrorism Challenge Paper
23
ever present for terrorists to exploit. Moreover, terrorists can dispatch their best-equipped cell to
the most opportune target.
Other asymmetries work to the terrorists’ advantage. Liberal democracies present
terrorists with target-rich environments. In contrast, terrorists take a low profile and hide among
the general population, thus they offer a target-poor environment to the government.
Governments have to protect everywhere, while terrorists can focus on vulnerable targets.
Another asymmetry involves the adversaries’ responses: liberal democracies must typically be
restrained in their response, while terrorists – especially, fundamentalists – can be unrestrained.
A targeted government can be less restrained when faced with an incident such as 9/11 where
thousands die. Governments utilize a hierarchical structure, while terrorists employ a
nonhierarchical structure. Enders and Su (2007) show that rational terrorist groups will select a
loosely linked cell structure so that infiltrating one cell may yield little useful intelligence on the
organization. While a cellular structure limits terrorist groups’ vulnerability, it also inhibits their
ability to acquire chemical, biological, radiological, and nuclear substances. Governments are
not well-informed about terrorist groups’ strength as Table 5 illustrated, while terrorists are
reasonably knowledgeable about the government’s strength as some parts of a government
budgets are often a matter of public record. Terrorists have a second-mover advantage, while the
governments have a first-mover disadvantage, because terrorists can observe how governments
harden potential targets and then attack accordingly. This was true of 9/11 where Logan,
Newark, and Dulles airports were viewed as poorly screened. In Table 7, crucial asymmetries
are summarized. These asymmetries give terrorists an advantage that makes eradicating
terrorism very difficult.
[Table 7 near here]
Copenhagen consensus 2008 Terrorism Challenge Paper
24
Other Considerations
There are numerous factors other than asymmetries that make it difficult to either eradicate
transnational terrorism or address it effectively. For instance, “weakest-link” countermeasures
represent major impediments to international cooperation when target nations differ greatly by
income. Counterterrorism policies abide by weakest link when the overall level of security
attained depends on the smallest effort expended by targeted countries. Consider actions to
eliminate a transnational terrorist group’s safe haven, where it trains, plans missions, recruits
operatives, and dispatches teams. If all but a single country denies terrorists a safe haven on
their soil, the one holdout undercuts the efforts of the others. For international airports, the
airport instituting the most lax security essentially determines the overall safety of the flying
public, insofar as a vulnerable airport is apt to attract the terrorists. Measures to freeze terrorist
assets also represent weakest-link countermeasures, since the least vigilant countries influence
disproportionately the ability of terrorists to maintain their assets. There is, thus, a need to
“shore up” the weakest link – i.e., bring their effort level up to an acceptable standard. This
shoring-up process faces a collective action problem as nations wait for others to augment the
efforts of the weakest link(s). Consequently, free riding characterizes steps taken to bring up
effort levels in weakest links. A prime-target country typically does not have sufficient means to
shore up all weakest links so that cooperation is necessary.
Transnational terrorism offers rogue nations, which operate outside of acceptable norms,
a means to destabilize another nation while hiding behind a cloak of secrecy as they sponsor
terrorist attacks abroad. Such actions can be cost effective with a large damage exchange ratio.
Even if the state sponsor is discovered, countries confront a collective action problem in
Copenhagen consensus 2008 Terrorism Challenge Paper
25
retaliating against the sponsor. This follows because countries are inclined to hold back their
response so as to benefit from any response by the country enduring the terrorist incident. Why
put one’s soldiers in harm’s way when some other nation may do so? Retaliation also runs the
risk of condemnation by the world community if the proof of sponsorship is not completely
convincing or else the retaliation kills some innocent people. The latter is likely when terrorists
purposely live within the general population.
Technological advances are also providing terrorists with means that they tailor and
exploit for new atrocities. Thus, terrorists use the internet to augment anxiety with videos of
beheadings. The internet also allows terrorists to spread propaganda, while communicating with
other operatives. Terrorists also utilize the internet to claim credit for events by posting videos.
Since the late 1960s, terrorists are quick to adopt advances in explosive devices – e.g., plastic
explosives, novel timing devices, and innovative detonators. Authorities must view terrorism as
a dynamic threat whose forms and methods are ever morphing. Anticipating novel forms of
attacks can be more challenging than stopping planned conventional attacks.
Another factor promoting terrorism are past successes. In 1983, the departure of the
multinational forces (MNF) from Beirut following the near-simultaneous suicide bombing of the
US Marine barracks and the French Paratroopers sleeping quarters encouraged future terrorist
campaigns. These two suicide truck/car bombings became the prototype for suicide truck
bombings in Sri Lanka, Iraq, Turkey, Saudi Arabia, and elsewhere. Proven methods create a
demonstration effect, copied by terrorists worldwide. The news media unwittingly disperse
terrorist innovations globally in a short period of time. The so-called “Blackhawk down” al-
Qaida attack on US forces in Somalia gave the terrorists a victory as the United States left in
defeat. Any concessions, including withdrawing forces or paying ransoms to kidnapping,
Copenhagen consensus 2008 Terrorism Challenge Paper
26
encourage future terrorism. This poses a real weakest-link problem as the country least able to
resist making concessions or paying ransoms changes the terrorists’ priors about how resistant
other nations will be. As nations cave in, terrorists become more optimistic that others will
follow suit if the right hostage is abducted or spectacular event is executed.
Transference of Terrorist Attacks
Transference is policy-induced changes in terrorist behavior and represents another impediment
in limiting transnational terrorism. This phenomenon again highlights that terrorists are rational
actors who respond to changes in risks in an appropriate manner that, unfortunately, may limit
gains from counterterrorism policies. Actions by governments to guard one venue cause the
terrorists to shift to another venue. Following 9/11, there was an increase in homeland security
in the United States, Canada, and European countries. A recent study shows that since 9/11 there
has been a clear transference of attacks against US interests to the Middle East and Asia (Enders
and Sandler, 2006b). Today’s fundamentalist terrorism is shifting to those countries, where large
support populations exist and terrorists do not have to transcend fortified borders to attack US
and Western assets. With transference, a counterterrorism policy that raises the price of one
mode of attack will induce terrorists to switch to now relatively cheaper modes of attack. Based
on ITERATE data and statistical analyses, Enders and Sandler (2006a) show that the installation
of metal detectors in airports on 5 January 1973 led to an immediate and prolonged drop in
skyjackings. At the same time, there was a significant and large increase in hostage and other
incidents. Unfortunately, metal detectors also resulted in a substitution into more deadly
incidents, an unintended consequence of the policy (Enders and Sandler, 2006a, 81-82). In
another transference, Enders and Sandler (1993) find that securing embassies led to more
Copenhagen consensus 2008 Terrorism Challenge Paper
27
assassinations and attacks against embassy officials in nonsecure venues. The policy message is
simple: counterterrorism measures must either make all modes of attack more difficult or else
reduce terrorist resources if transference is to be avoided. The latter require proactive measures
in which terrorists and their assets are targeted, as the United States and its allies did in
Afghanistan in October 2001.
Transference can also have a temporal nature in response to terror alerts or temporarily
enhanced security. If these actions are announced or visible, then the terrorists will merely shift
an intended attack from the present to the future once the authority’s guard is down. The
homeland security alert system provides terrorists with information that is to their advantage.
Moreover, terrorists can manipulate the system by increasing internet “chatter” or threats to
cause wasteful security enhancements and decreasing chatter or threats when they really intend
to strike. Repressive actions by a targeted government that closes off political means – rallies
and election of representatives – will cause terrorists to rely more on violent attacks. Thus, the
policy message is not to close off legitimate political channels of expression owing to an
undesirable transference (also see Frey, 2004). Very harsh proactive measures can either cause a
backlash attack by sympathetic groups or greater recruitment of terrorists (Rosendorff and
Sandler, 2004; Siqueira and Sandler, 2007). This recruitment can result in a spectacular incident
where greater manpower and resources are needed. The Madrid train bombings on 11 March
2007 and the London transport bombings on 7 July 2005 are backlash attacks by groups
sympathetic to al-Qaida.
Thus, proactive responses have a downside that must be weighed against the likely fall in
terrorism. We show later that the war on terror at the end of 2001 not only decreased the number
of incidents, but also resulted in incidents with more casualties on average. Terrorists responded
Copenhagen consensus 2008 Terrorism Challenge Paper
28
to the higher risks by going after incidents with potentially greater payoffs, which is a rational
response. Moreover, such antiterrorism campaigns lead to a short-term lull in attacks as
terrorists find new hiding places and regroup. Quite simply, transnational terrorism is not so
easy to address.
Geographical Transference
Transference of terrorist attacks can also be geographical, in which heightened security in one
part of the world transfers transnational terrorist incidents to less secure countries. To show the
pattern of transnational terrorist attacks over time, we apply the regional classifications given in
the US Department of State (2003) Patterns of Global Terrorism, where six regions are
characterized. These regions are the Western Hemisphere (North, Central, and South America),
Africa (excluding North Africa), Asia (South and East Asia, Australia, and New Zealand),
Eurasia (Central Asia, Russia, and the Ukraine), Europe (West and East Europe), and the Middle
East (including North Africa). This partition of countries puts most of the Islamic population
into the Middle East, Eurasia, and Asia.
[Figure 4 near here]
In Figure 4, we utilize ITERATE data to show the changing pattern over time of
transnational terrorism by region. Panels 1 and 2 display a sustained decrease in transnational
terrorist attacks beginning in the early 1990s for the Western Hemisphere and Europe,
respectively. From 1968 to 1992, there was a lot of spillover terrorism from the Middle East,
staged in Western Europe. In panel 3, the Middle East is associated with an increase in
transnational terrorism for the start of the 1990s, followed by a fall around 1993, and then an
increase after 9/11. This same post-9/11 rise characterizes Asia and Eurasia. In a recent paper,
Copenhagen consensus 2008 Terrorism Challenge Paper
29
Enders and Sandler (2006b) show statistically that heightened homeland security in parts of the
Western Hemisphere and Europe induced terrorists to shift their attacks on Western interests to
regions where Islamic fundamentalists can rely on indigenous populations for support. This can
be seen in panels 3 and 4. Eurasia experienced an increase in transnational terrorism at the time
when the Western Hemisphere and Europe experienced a decrease. Nevertheless, the number of
transnational terrorist attacks is small in Eurasia compared to the Middle East, Asia, and
elsewhere.
Measurement and Other Problems
Coming up with five solutions and their benefit-cost ratios is particularly difficult for
transnational terrorism. Before we indicate how we circumvented this obstacle, we briefly
describe why transnational terrorism is more problematic to do benefit and cost analysis on than
many other challenges. First, there are no real solutions to transnational terrorism owing to
transference and the other considerations given earlier. The best hope is for action that
ameliorates terrorism in the immediate term. Any stream of benefits and costs from solutions or
policies is limited in time and lasts for two to five years before some new related or unrelated
threat surfaces. Second, there is the counterfactual problem, because there is no true way to
know what terrorism would have been had certain policies not been taken, once they are
imposed. If, for example, nations had cooperated more prior to 9/11, then would 9/11 have been
stopped? No one can know for sure. Sometimes, a researcher can apply econometric techniques
to identify the counterfactual – e.g., the use of a transfer function in time series analysis.7 This
requires estimating the level of a variable – say, the number of tourists – with terrorism present
and then using the estimating equation to ascertain what would happen if terrorism had been
Copenhagen consensus 2008 Terrorism Challenge Paper
30
zero. When estimating benefits and costs for solutions, the counterfactual is relevant for at least
one side of the calculation. Suppose the solution involves greater proactive measures against the
terrorists, then the counterfactual is on the benefit side, since we do not know the reduction in
terrorism in light of these measures. If, instead, we hypothesize augmented international
cooperation, then the counterfactual involves both the cost and benefit sides, because we have
never experienced such levels of cooperation.
Third, policy cost information is often difficult to ascertain. Most countries do not reveal
how much is spent on some components of counterterrorism or homeland security, since it may
be in a country’s strategic interest to keep this information secret. This is particularly true of the
intelligence budget. Even when this information is available, there is still the problem as to what
counts and what does not count as counterterrorism actions. That is, does the US-led invasion of
Afghanistan against the Taliban and al-Qaida count? Most researchers classify this war as a
proactive response to a terrorist threat. Similarly, does the US-led invasion of Iraq on 20 March
2003 count when there was no clear indication that Iraq, at the time, supported or harbored al-
Qaida? Some researchers exclude this war as a proactive response to terrorism.8 In computing
costs, there is also the joint-cost problem when funds are used for multiple activities, because
costs must then be assigned. For example, disaster relief in the United States goes to responding
to both natural and terrorist disasters. In general, the costs of many “solutions” do not lend
themselves to easy calculation. This means that the costs of augmented cooperation must be
proxied. Even the costs of enhanced defensive measures are difficult to ascertain, since we do
not know the costs of current measures in most countries. Thus, a procedure must be devised for
ascertaining these costs. The same is true about the expense of foreign policy changes by prime-
target countries.
Copenhagen consensus 2008 Terrorism Challenge Paper
31
Other measurement problems exist for our study. There are no records kept of the degree
of injuries from terrorist attacks. As seen earlier in Table 2, there is just a tally on the number of
injuries. This then presents an issue when we compute the DALYs associated with transnational
terrorism; however, we are able to address this problem in the next section. Additionally, the
damage inflicted by most terrorist attacks is not readily available, except for a few spectacular
incidents (see Table 6). The best way to address this lacuna is to rely on a method that calibrates
losses in GDP. The alternative is to measure the losses associated with various sectors of the
economy (such as the airlines and tourism industries) and add them to the losses associated with
terrorism-induced reductions in international trade and foreign direct investment. These losses
can then be reduced by benefits accruing to those sectors of the economy that expand as a result
of terrorism (such as law enforcement). However, it is exceedingly difficult to measure the
overall sectoral losses and gains. If, for example, international trade declines as a result of
terrorism, intranational trade should expand as domestic firms replace international firms as
suppliers of goods. Instead of using this in-direct method, we find it to be far easier to compute
the net losses from terrorism as manifested in overall GDP levels.
The Building Blocks to Benefit-Cost Analysis
To calculate the benefits and costs for various solutions, we must first be able to assign a cost to
transnational terrorism in terms of lives lost and injuries sustained, security expense, and GDP
losses. These three building blocks allow us to do counterfactual analyses so as to measure
benefits for the proposed solutions that ameliorate, in the short term, the level of transnational
terrorism.
Copenhagen consensus 2008 Terrorism Challenge Paper
32
Human Costs: Computing DALYs
To establish the human costs, we must compute the DALYs associated with terrorism for either a
given or representative year using casualty figures for transnational terrorism, previously
presented in Table 2 for 1968-2006. This table gives the casualties in terms of deaths and
injuries on an annual basis. In order to calculate the DALYs associated with terrorism, we must
categorize the wounded into their respective injury components (i.e., disability D weights).
Unfortunately, data on the nature of terrorist-induced injuries sustained are unavailable. We can,
however, derive a suitable proxy by appealing to a study conducted by Abenhaim, Dab, and
Salmi (1992) of the physical and psychological injuries associated with a terrorist campaign
involving twenty-one attacks (twenty bombings and one machine gun attack) that occurred in
France during 1982-1987. This campaign resulted from spillover terrorism related to the
political situation in the Middle East. These authors sent surveys to the population of 324
civilian victims, who were registered by the police. There was 85% participation rate to the
survey with 78% returning the completed survey and another 8% responding to a phone
interview. Psychological symptoms were identified from assessing self-reporting on a diagnostic
portion of the survey. Although a few studies exist that document the injuries corresponding to
an isolated terrorist incident, this French study is the most recent longitudinal data set on injuries
stemming from terrorist incidents that we could find. We, therefore, use this study to interpolate
injury categories from wounded tallies in Table 2. Even though transnational terrorism includes
more than bombings, the French study on assessing injuries is an excellent proxy because half of
all transnational terrorist attacks are bombings, which are the most likely attacks to result in
injuries.
[Table 8 near here]
Copenhagen consensus 2008 Terrorism Challenge Paper
33
We employ the distribution of injuries given in the French study to compute DALYs for
transnational terrorist attacks in Table 8 for 2005 as the base or representative year, when 550
people died and 864 were wounded. In the left-most column, the type of lesion and
psychological symptoms are indicated, in which PTSD stands for posttraumatic stress disorder.
The next column lists the percentage of injured that displayed these consequences, where the
injury total is greater than 100% because victims may experience multiple injuries. In the third
column, the number of each type of injury is determined by multiplying the corresponding
percentage by 864 – the number of wounded in 2005. The associated calculation then provides
the number of injuries, N, for ascertaining the years lost to disability (YLD). In the fourth
column, the disability weights, D, for these injuries are taken from Mathers, Lopez, and Murray
(2003). When a complete correspondence between the disability weight and the lesion does not
exist, the following interpretations are applied. The disability weight for hearing loss is that
assigned to a severe or profound treated loss. Head trauma is given the weight for a fractured
skull or an intracranial injury, both of which have the same disability weight. For respiratory
impairment, we use the largest respiratory weight, associated with lower respiratory infection
episodes. Bombings are known to have significant impact on internal organs: shock waves from
the blast induce significant tissue disruption at air-liquid interfaces, a process known as
“spalling” (Frykberg, 2002). For fracture(s) and amputation(s), we equate the loss to a fractured
femur, which is the highest among fractures and exceeds all amputations except foot or leg. We
consistently use the higher weights for ambiguous cases to give injuries the highest possible
monetary consequences. The rather low DALYs later associated with transnational terrorism
cannot be blamed on us taking a conservative approach.
The duration, L, of each injury is treated as permanent for the victim’s remaining life
Copenhagen consensus 2008 Terrorism Challenge Paper
34
span. Given that terrorist attacks rarely target children, we assume that a representative victim
has reached his or her mean life expectancy, averaged across males and females. Consequently,
the duration of the injury is for half of the victim’s life expectancy. For the purpose of
sensitivity analysis, we conduct the analysis for the life expectancy in three geographical regions:
Eastern Mediterranean, European, and the United States, as reported in the World Health
Organization’s mortality tables for each region. The duration is as follows: Eastern
Mediterranean, 31.25 years; Europe, 36.5 years; and the United States, 38.75 years.
Assuming a discount rate of 5% and a value of $1000 per DALY, we calculate the YLD
for each injury or symptom using the following formula:
YLD = $1000 × N × D × [1 – exp(–0.05 × L)]/0.05. (1)
For deaths, the years of life lost (YLL) calculations are performed in a similar fashion, except
that death has a disability weight of one. This calculation is applied to the 550 deaths in 2005.
The three right-hand columns in Table 8 aggregate the YLD and YLL for the three different life
spans to derive the DALYs. For 2005, YLD is almost half the value of YLL. This would not be
true had more people been injured. At a value of $1000 per DALY, the human cost of terrorism
ranges from $13 to $14.1 million in 2005, which is very modest. When a DALY is valued at
$5,000, the human cost of terrorism ranges from $65.1 to $70.5 million in 2005. In Table 9, we
conduct an analogous exercise but use the average annual terrorism deaths (419.79) and injuries
(1249.28) for the 1968-2006 period from Table 2. As shown in Table 9, there is little change in
the range or values of DALYs using an average year, thus indicating a robust analysis. The sole
difference is that YLD and YLL are close in value. Henceforth, we use values from Table 9
associated with the $5,000 DALY.
Copenhagen consensus 2008 Terrorism Challenge Paper
35
[Table 9 near here]
As a basis of comparison, we calculate terrorism DALYs for US life expectancy (which
is the highest) as a percentage of the world DALYs for a selection of the 20 leading global
challenges for 2001. The rankings for these challenges in terms of DALYs are perinatal
conditions (No. 1), HIV/AIDS (No. 5), malaria (No. 8), tuberculosis (No. 10), and road traffic
accidents (No. 11). In Table 10, the transnational terrorism DALYs percentages range from a
mere 0.02 for perinatal conditions and HIV/AIDS to 0.04 for tuberculosis and traffic accidents.9
When measured in terms of DALYs, transnational terrorism is a minor problem because
relatively few people die or are injured each year. If we include deaths and wounds from
domestic terrorism, the percentages would increase by over tenfold since 7,641 persons died and
14,395 were wounded in domestic terrorism during 2005 (see Table 3). Nevertheless, terrorism
DALYs percentages are still relatively small when compared with these other challenges, where
much larger numbers of people die or are injured.
[Table 10 near here]
Homeland Security Costs
The second building block concerns the amount spent on homeland security worldwide. This is
a difficult figure to compute since most countries do not display a line item in their budget for
homeland security. Moreover, homeland security involves many activities including control of
immigration, inspection of imports, hardening of targets, gathering of intelligence, guarding of
borders, security at airports, and other activities. A decision must be made whether to include
just defensive actions or to also include proactive measures such as the US-led invasions of
Afghanistan in October 2001 and Iraq in March 2003.
Copenhagen consensus 2008 Terrorism Challenge Paper
36
We address these difficulties in a number of ways. There are reliable figures for the
United States and the United Kingdom that we can use to proxy estimates for other countries.
This proxy is based on the percentage of GDP devoted to homeland security in the United States
and the United Kingdom following 9/11. The dilemma involves going from US and UK
estimates to a worldwide calculation when such figures are not available. Nine alternative
calculation methods are used, some of which include just defensive measures while others
include defensive and proactive measures. When a proactive response is included, the invasion
and occupation of Iraq is included in two of the calculations and left out of one of the
calculations. Prior to the US invasion in 2003, Iraq had supplied monetary inducements to some
suicide terrorists in Israel and there was some terrorist presence on Iraqi soil (e.g., safe haven to
an ailing Abu Nidal). The invasion of Afghanistan is, however, included in all three of our
calculations involving proactive measures owing to the safe haven given by the Taliban to
Osama bin Laden and al-Qaida. These nine alternative calculations provide both the annual
costs and the capitalized costs (over five years) of homeland security. Even with the most
conservative estimates, we will discover that homeland security is the dominant consideration in
the benefit-cost ratios for some of our proposed solutions.
[Table 11 near here]
Our alternative procedures – numbered M1 through M9 – are best understood in
conjunction with Table 11. We identify 66 countries, listed in the left-hand column of Table 11,
that experienced transnational terrorism in recent years. All major industrial countries are
included in the sample, so that excluded countries, whose GDP are small, would not change
totals by much. The second column displays GDP amounts for 2005 in billions of current US
dollars for each sample country, taken from the World Bank (2007). The next nine columns
Copenhagen consensus 2008 Terrorism Challenge Paper
37
provide homeland security estimates for each of our methods in billions of US dollars.
To illustrate the methods, we first indicate how we assign homeland security
expenditures in the United States and the United Kingdom for the calculations. For the United
States, we appeal to the careful study by Hobijn and Sager (2007) on the increase in homeland
security in 2005, compared with 2001. These authors compute both federal and private sector
augmented homeland security expenditures and put the annual amount at $43.6 billion in 2005,
which is 0.35% of US GDP. This first calculation includes no proactive spending. For the
United Kingdom, we use Treverton et al. (2008) figure for British counterterrorism and domestic
security, which averages to $3.2 billion per year for two recent snapshots in time. This latter
figure is 0.146% of UK GDP in 2005.
In Table 11, Method 1 (M1) applies the US GDP percentage to all sample countries for a
total of $147.19 billion in 2005. To capitalize this value (see column 3), we allow for GDP
growth of 2% to give the future value in 2006 (FV2006). Similar FV values are calculated
through 2009. To get the present value, we apply the appropriate discount factor to each FV –
e.g., we divide FV2006 by (1 + .05) and FV2007 by (1 + .05)2 – and then sum the five
discounted FV terms. Thus, the capitalized value of M1 is $695.09 billion over five years.
Method 1 is a high-end estimate because most sample countries will not have allocated over a
third of one percent of their GDP on enhanced homeland security since 9/11. Method 2 is more
realistic by applying the US percentage to just the United States and the UK homeland security
percentage of 0.146% of GDP to the other 65 sample countries. For M2, the annual value is
$86.81 billion and the five-year capitalized value is $409.94 billion, with the United States
accounting for half of all homeland security spending. This seems to be a realistic share for the
prime-target country, whose interests are attacked on average 40% of the time.
Copenhagen consensus 2008 Terrorism Challenge Paper
38
Method 3 is more controversial because we include the annualized expenditure associated
with the Afghanistan and Iraq Wars, based on figures given in Treverton et al. (2008). These
authors provide an educated guess on the annual cost of US federal spending on homeland
security, Afghanistan/Iraq, and associated activities (e.g., foreign assistance to at-risk countries).
They also include state and local spending on homeland security along with private sector
spending of $10 billion, which is close to private spending amounts in Hobijn and Sager (2007).
According to Treverton et al. (2008), the United States annually spent $92 billion on defensive
and proactive measures since 9/11, which amounts to 0.74% of US GDP in 2005. These authors
offer a smaller figure to augmented homeland security than Hobijn and Sager (2007). M3
applies the 0.74% to the four prime-target nations – the United States, the United Kingdom,
Israel, and Russia – and applies the earlier 0.35% to the other sample countries. Our justification
is that these four countries have proactive campaigns that support the higher percentage. M3
gives an annual costs of $207.78 billion and a capitalized five-year costs of $981.19; M3
represents our top-level estimate and provides an upper bound. Method 4 excludes the Iraq
campaign, since the al-Qaida connection in Iraq prior to the US invasion was not clear-cut in
contrast to Taliban-ruled Afghanistan. According to calculations in Treverton et al. (2008),
$47.2 billion or 0.38% of US GDP in 2005 was spent on augmented homeland security if Iraq
costs are excluded. M4 applies this percentage to the GDP of the four prime-target countries and
uses the smaller 0.35% for the other sample countries. This results in annual costs of $151.85
billion and capitalized five-year costs of $717.09.
Method 5 takes a radically different approach by taking 61% of the US Department of
Homeland Security (DHS) budget for 2005. We use this percentage because officials classify
61% of the DHS budget as going to terrorism-related homeland security activities (DHS, 2004).
Copenhagen consensus 2008 Terrorism Challenge Paper
39
We also add $10 billion of private spending on homeland security to $29.6 billion (= 0.61 ×
$48.5 billion) for a total US spending figure of $39.6 billion or 0.32% of US GDP in 2005. M5
applies this percentage to all sample countries to give annual costs of $134.57 billion and
capitalized five-year costs of $635.51 billion.
Methods 6-9 are variations on the themes thus far introduced. M6 is a conservative
estimate that applies the US defensive spending of 0.35% of GDP to just the four prime-target
countries and applies 0.10% of GDP to all other sample countries for annual costs of $80.89
billion and capitalized five-year costs of $382 billion – estimates similar to M2. Method 7 is
more conservative than M3 because the UK percentage of 0.146 is applied to the United
Kingdom and to all nonprime-target countries. M7 provides a more measured valuation of
defensive and proactive efforts than M3 and is not too different than M4. Method 8 is a
conservative variant of M1 since the US defensive percentage of 0.35 of GDP is only applied to
the United States, Israel, and Russia; the UK percentage of 0.146 of GDP is applied to the United
Kingdom; and a percentage of just 0.10 of GDP is applied to the other 62 sample countries.
Finally, M9 is a variant of M8 where a very conservative 0.05% of GDP is used for the 62
nonprime-target countries. With M9, we have the smallest homeland security cost thus far of
$63.16 billion in 2005 and $298.26 billion when capitalized for five years. The United States
accounts for 68% of these totals.
For our solutions below, we favor two of the above methods – M7 and M9. Since
homeland security is the dominant factor in three of our subsequent benefit-cost calculations, we
intentionally choose the method M9 that offers the smallest defensive expenditures, so that the
adverse ratios cannot later be attributed to our discretion or alleged bias. Given the annual costs
Copenhagen consensus 2008 Terrorism Challenge Paper
40
on US homeland security, M9’s worldwide spending of $63.36 billion is a highly restrained
estimate of augmented defensive measures. For an estimate involving proactive and defensive
efforts, we favor M7 which applies a fairly conservative defensive effort to nonprime-target
countries. Of course, myriad other variants can be examined, but M7 and M9 are reasonable
upper and lower bounds on these estimates. Even though we utilize just two methods, we
provide nine calculations so that the reader can get a feel for how alternative assumptions could
affect our BCR calculations, which we leave to the interested reader. As shown by M7, the
inclusion of proactive measures can greatly augment security spending estimates.
Lost GDP
The third building block involves estimating the annual and capitalized five-year losses in GDP
associated with transnational terrorist incidents on a country’s soil. At the outset, we should
expect such losses to be rather modest unless a country is plagued with transnational terrorism or
else experiences a spectacular terrorist event such as 9/11 (Sandler and Enders, 2007). Most
transnational terrorist incidents kill on average less than one person and have limited economic
consequences (Enders and Sandler, 2006a). We utilize the findings from a study by Blomberg,
Hess, and Orphanides (henceforth BHO) (2004) that estimates the losses in per capita income
growth for countries experiencing one or more transnational terrorist events in that year.10 BHO
(2004) present a panel study of 177 countries for the 1968-2000 sample period. These authors
show that each year of transnational terrorism results, on average, in a fall in income per capita
growth of just 0.048%, which is similar to the findings of Tavares (2004), who puts this loss at
0.038%. To be able to use BHO’s findings to compute terrorism-induced GDP losses, we need
the population (Pop), the per capita GDP in 2005, and the growth rate of per capita GDP between
Copenhagen consensus 2008 Terrorism Challenge Paper
41
2004 and 2005 in percent (denoted by 2005 growth/100) for all countries experiencing
transnational terrorism during 2001-2005.
The results of our computations are indicated in Table 12. In the left-hand column, we
list all countries experiencing one or more terrorist attacks during 2001-2005. Population in
thousands is indicated in the second column, and the number of years of transnational terrorist
events (Ti) in country i during 2001-2005 is listed in the third column. Thus, Algeria experiences
transnational terrorist attacks in two years during 2001-2005, while Bosnia-Herzegovina
experiences such attacks in four of five years. The terrorism data come from ITERATE, while
the Pop and GDP data come from the World Bank (2007). Per capita GDP for 2005 is displayed
in the fourth column, while 2005 per capita GDP growth is given in the fifth column.
[Table 12 near here]
The sixth column indicates the cost of transnational terrorism in terms of lost GDP for
2005 for just those countries experiencing an attack in 2005. The entry in this column is
computed as follows:
(Pop × per capita GDP) × (2005 growth/100) × 0.048.
These figures are in thousands so that the total GDP lost in 2005 is approximately $19.412
billion. In the seventh column, we compute an “average yearly cost” in lost GDP for each
country based on the fraction of years (Ti/5) during 2001-2005 that a country experiences one or
more transnational terrorist attacks. The entry is now computed as:
(Ti/5)(Pop × per capita GDP) × (2005 growth/100) × 0.048.
This latter computation gives a better average picture that is not as dependent on which countries
are attacked during the base year. Thus, a rich nation – e.g., the United States – cannot have
Copenhagen consensus 2008 Terrorism Challenge Paper
42
such a disproportionate influence when the latter method is utilized. In Table 12, the losses in
GDP for this averaging procedure are $17.363 billion in 2005. We favor this latter technique
since it provides a more country-balanced approach; however, there is not a large difference
between the two calculations in Table 12.
To capitalize the losses over five years, we compute the present value entries associated
with the seventh column for each of the following four years, discounted by a 5% interest rate.
For each year after 2005, we also allow GDP to grow at the respective country’s 2005 growth
rate. The five present value terms for 2005-2009 are then summed for the countries’ entries in
the right-hand column displaying the “5 year cost in growth.” The sum over all countries finally
gives the capitalized five-year GDP costs of $83.407 billion. If we had used Tavares’ (2004)
calculations, then these GDP losses would be even smaller. An important insight emerges:
homeland security is much more expensive than average estimated losses in GDP tied to the
impact of transnational terrorism. This situation very much favors the terrorists, whose actions
not only cause harm to targeted economies but also force countries to allocate large amounts of
resources to security. Our calculations suggest that this second impact is worse than the
economic impact. As countries competitively harden potential targets in the hopes of
transferring attacks abroad, the security cost worsens (Sandler and Siqueira, 2006). The $17.363
billion average annual loss in GDP is, however, small compared with the losses of 9/11, valued
at $80-90 billion. But one must remember that there had never been a terrorist attack remotely as
costly as 9/11.
Solutions
We reiterate that there is no true solution to transnational terrorism because this tactic empowers
Copenhagen consensus 2008 Terrorism Challenge Paper
43
the weak. Our solutions are in terms of policy choices that may ameliorate the problem in the
short run with fewer attacks. Even the most clever defenses will be outwitted with time and so
we typically work with a five-year time horizon, unless stated otherwise. Similarly, proactive
measures do not have permanent influences because new generations of terrorists may surface or
the terrorists can replenish lost resources with time. In calculating the associated benefits and
costs for each policy option, we must confront a counterfactual on either the benefit or cost side
as to what would have happened in the absence or presence of the policy. This requires
assumptions that may be controversial.
Solution 1: Business as Usual
“Business as usual” involves doing nothing different than the post-9/11 actions that were
instituted by the United States and other target countries following the unprecedented hijackings
in September 2001. We construct the counterfactual by calculating the average annual attacks
for 2002-2006, compared with those for 1990-2001. This comparison indicates that there are on
average 129 fewer incidents per year for the post-9/11 period when compared with the pre-9/11
twelve years, which is a 34% drop in transnational terrorism (see Table 2). In terms of casualties
in the post-9/11 period, there is both good and bad news. The good news is that there are 120
less injuries per year; the bad news is that there are 67 more deaths per year. The latter follows
because the terrorists performed more deadly incidents to make fewer incidents have a larger
payoff. Also, augmented defensive and proactive measures meant that only the more determined
terrorist groups continued their attacks.
Benefits come, in part, from the reduced GDP losses from the 34% drop in transnational
terrorist incidents. If this fall is assumed to be evenly distributed across target incidents, then
Copenhagen consensus 2008 Terrorism Challenge Paper
44
this results in a capitalized five-year GDP savings of $28.358 billion (= 0.34 × $83.406 billion).
In principle, additional benefits should also stem from reduced casualties from fewer deaths and
injuries; but, in fact, these anticipated benefits are negative based on $5000 DALYs. The 67
more deaths per year give a capitalized five-year loss of $26.1 million, while the 120 fewer
injuries per year give a capitalized five-year gain of $11.3 million, which, in turn, lowers the
benefit of this solution to $28.343 billion.
Costs are associated with security expenditures. To compute these costs, we first use the
most conservative capitalized five-year value of $298.3 billion associated with M9 that includes
just defensive increases following 9/11. This then provides a BCR of 0.095, so that less than ten
cents on a dollar is returned. Next, we use the less conservative capitalized five-year cost of
$725.7 billion associated with M7 that includes proactive and defensive augmentation following
9/11. This higher cost yields a BCR of 0.039 or a return of just under four cents on a dollar.
Given that the two drivers of the BCR calculation – i.e., saved GDP and security expenditures –
are in the billions of dollars while casualty consequences are in the millions of dollars, little
would change with a $1000 DALY, except that the BCR would be slightly higher since net
casualty costs are reduced to about $2.2 million.
An obvious criticism of our computation is that many target countries value lives and
injuries by more than the $5000 DALY, used to investigate the human consequences of
challenges in developing countries. Thus, our procedure may undervalue casualties. To respond
to this criticism, we apply a $2 million value of life – the average compensation paid to the
families of victims of 9/11 (Enders and Sandler, 2006a, 207) – for the 67 additional lives loss per
year with Solution 1 and capitalize this value over five years. This gives a present value loss of
Copenhagen consensus 2008 Terrorism Challenge Paper
45
$609 million. Next, we modify the YLD calculations to be based on a $2 million value of life.11
This gives a savings for the 120 reduced injuries of $345 million when capitalized. With this
higher value of life, our corresponding BCRs are now 0.094 for M9 and 0.039 for M7. The
bottom line is that not much changes, since saved GDP and security costs remain the drivers.
Our BCRs – though potentially controversial – are robust.
Why do countries invest in a policy option that apparently has such an adverse BCR? For
the United States and other prime-target countries, politics and extreme risk aversion surely play
a role. Government officials realize that a single terrorist incident – like 9/11 – could result in
$80-$90 billion loss. If such losses are not weighted by the appropriately small likelihood, then
overspending on security follows. People often overrespond to very low probability catastrophic
events when compared with more certain events with small losses. Moreover, target nations are
in a security race to deflect terrorist attacks onto foreign soil. Consequently, overspending may
result. With reports in July 2007 that al-Qaida has regrouped (US News & World Report, 2007),
the United States will likely raise spending on defensive and proactive measures.
Solution 2: Greater International Cooperation
Solution 2 involves greater cooperation in freezing assets and cutting off terrorists’ resources,
which may come from charitable contributions, drug trafficking, counterfeit goods, commodity
trading, and illicit activities. This solution also concerns extraditing suspected terrorists to face
prosecution and punishment if guilty. Additionally, this solution is tied to increased police
cooperation among countries so that major plots – e.g., the August 2006 plan to blow up trans-
Atlantic flights leaving London with liquid explosives – are foiled. Although this is a relatively
cheap solution that can have a permanent impact if links are maintained, it is a difficult solution
Copenhagen consensus 2008 Terrorism Challenge Paper
46
to consummate because nations do not like to sacrifice autonomy over security and judicial
affairs. Moreover, a single noncooperator – say, a nation that harbors terrorist assets – can undo
much of the efforts of others. This is a particularly difficult solution to evaluate because benefits
and costs involve counterfactuals.
On the cost side, we give high-end and low-end estimates by drawing on the 2005 budget
of Interpol and the 2006 budget of the International Monetary Fund (IMF). In 2005, the entire
operating budget of Interpol was just $58 million (€42.8 million) (Interpol, 2005), 88% of which
was contributed by member states. Interpol fosters interstate police cooperation. This increased
cooperation could involve doubling this budget to $116 million in perpetuity, whose present
value is $2.32 billion if the discount rate is 5%. For monitoring of terrorist funds, we allocate
one tenth of IMF’s monitoring (global, regional, and country), governance, and capacity-building
budget of $709.7 million to enhanced counterterrorism (Committee to Study Sustainable Long-
Term Financing of the IMF, 2007). This $71 million expenditure is an educated guess that is
55% of IMF global monitoring spending. Most IMF activities are country-specific monitoring,
technical assistance, external training, and bilateral surveillance that have little to do with
counterterrorism so that allocating 10% of IMF administrative spending is surely on the high
side. At a 5% discount rate, the perpetual stream of $71 million has present value of $1.42
billion. In total, our high-end cost estimate is a perpetual expenditure stream valued at $3.74
billion (= $2.32 billion + $1.42 billion). Throughout, we assume that extradition is virtually
costless, since countries are merely utilizing the capacity built into their judicial and executive
branches. The low-end estimate for augmented cooperation is to assign just half of the Interpol
budget ($29 million) and 5% of the IMF administrative budget ($35.5 million) to supporting
greater cooperation for an annual spending stream of $64.5 million. At a 5% discount rate, this
Copenhagen consensus 2008 Terrorism Challenge Paper
47
perpetual stream is valued at $1.29 billion.
Because most terrorist acts do not cost very much, increased police and monetary
cooperation is not aimed at curbing small events, such as routine bombings or political
assassinations. Rather, this enhanced cooperation is likely to stop a spectacular event that
involves a great deal of planning and dedicated resources by the terrorists. Conservatively, we
suppose that such actions are able to halt one spectacular terrorist event per year, such as the
August 2006 plot against trans-Atlantic flights or the recent plot to hold members of the
Canadian parliament hostage. The associated yearly benefit would be the average losses
associated with a spectacular terrorist event which can vary from $500 million for the 1993
World Trade Center bombing to $80-$90 billion for 9/11. We conservatively place a value of $1
billion on the damages saved from one less spectacular incident. As a perpetual income stream,
this results in a saving of $20 billion. Similar remarks can be made for enhanced intelligence
expenditures. Antiterrorism intelligence efforts are credited with preventing several potentially
spectacular incidents such as the one to blow up fuel supply tanks at New York’s JFK airport,
revealed in June 2007.
Based on the high-end cost estimate, the BCR is then 5.348; based on the low-end cost
estimate, the BCR is then 15.504. We have clearly made some heroic assumptions.
Nevertheless, the BCR should be greater than one, because police cooperation is very cheap
owing to economies of scope and other considerations, while any large terrorist event avoided
can save hundreds of millions of dollars if not billions. Since our benefits and costs are perpetual
streams, the BCR is independent of the discount rate, which cancels out in the numerator and
denominator.
Surely police forces are cooperating internationally to some extent. What we have tried
Copenhagen consensus 2008 Terrorism Challenge Paper
48
to show is that the payback per dollar from additional cooperation is apt to be high given how
costly spectacular terrorist events can be. To engage in such events, terrorists must take extra
risks owing to the greater manpower, resources, training, and planning that must support such
attacks. Internationally linked police operations are better able to spot such large-scale terrorist
efforts. Although such cooperation has favorable BCRs, countries have jealously guarded their
autonomy over police and security matters.
Solution 3: Increased Proactive Response
This solution calls for increased proactive measures along the lines of the invasion of
Afghanistan and other offensive actions against terrorists and their supporters taken by the
United States and its allies. These actions ranged from the Philippines to Djibouti and
immediately followed 9/11. They are known as Operation Enduring Freedom and do not include
the invasion and occupation of Iraq, which began in 2003 (Belasco, 2007). Thus, we use the
experience of the US-led proactive campaign as a role model for what an increased proactive
response might achieve in terms of BCRs. In some of our cost estimates, we also include
Operation Noble Eagle, which secured US military bases abroad from which to plan and launch
proactive counterterrorism measures.
In order to get a counterfactual, we contrast the level of transnational terrorism in the first
two years following 9/11 when there was the greatest proactive antiterrorist campaign with the
levels in 2002-2006 and 1990-2001. We use only a two-year horizon for this solution, since al-
Qaida and other terrorists had rebounded by 2004 with transnational terrorism back up to pre-
9/11 levels. Moreover, many nations supporting such efforts had dropped out after two years.
The war on terror put transnational terrorism into partial remission for two years but did not cure
Copenhagen consensus 2008 Terrorism Challenge Paper
49
it.
The annual number of transnational terrorist attacks for 2002-2003 is 205 incidents
compared with 255 incidents per year for the post-9/11 period through 2006. We use this
comparison for the counterfactual so as to adjust for the continued presence of defensive
measures throughout the post-9/11 period. Thus, there are 50 less attacks per year or a decline of
13% in attacks over the 1990-2001 period that we attribute to the larger offensive measures.
This translates into $2.257 billion (= 0.13 × $17.363 billion) saving in world GDP for one year.
With 5% discounting and a two-year time horizon, this gives a benefit of $4.41 billion from
saved GDP. Unfortunately, these two years had violent terrorist events that killed 675 people
and injured 2830 others per year. Compared to 1990-2001, there are 159 more deaths and 916
more injuries per year, which is a negative benefit of $75.04 million when evaluated for two
years at a 5% discount rate and a $5000 DALY. When the human losses are deducted from the
GDP savings, we have net benefits of $4.335 billion associated with the third solution.
Next, we turn to costs which have been computed by the Congressional Research Service
(Belasco, 2007). For the relevant two years, Operation Enduring Freedom costs $35.5 billion,
while Operation Noble Eagle costs $21 billion for a total of $56.5 billion. This figure drops to
$35.5 billion if we leave out Operation Noble Eagle on the grounds that it was only indirectly of
a proactive nature. The BCR for the higher costs is 0.077, giving back less than eight cents on a
dollar, while the BCR for the lower costs is 0.122, giving back just over twelve cents on a dollar.
Given the short-term fix of such proactive campaigns and their great expense, the adverse ratios
are not so surprising. It does not help that terrorists tend to respond with more deadly events to
make their fewer operations have a greater anxiety consequence. If we use the $2 million value
Copenhagen consensus 2008 Terrorism Challenge Paper
50
of life calculations, the BCR falls to 0.047 for the high-cost estimate and to 0.075 for the low-
cost estimate. The ratios are even more adverse because the casualties that rose with proactive
measures now have a greater value. In fact, if we were to include expenditures by US allies, the
BCRs would be even more adverse.
A proactive campaign would pay better if there is a way to eliminate the terrorist threat
long term as some European nations did with left-wing terrorists – e.g., Italy with the Red
Brigades, France with Direct Action, and Germany with Red Army Faction. But this assumes
that terrorist groups in one country do not inspire groups in other countries to take up the cause.
Unfortunately, the al-Qaida network encourages groups to take up the holy war. To limit the
negative consequences from a proactive campaign, actions must be measured and properly
justified to the world audience to maintain the high moral ground.
Solution 4: Augmented Defensive Measures
Our fourth solution is to harden targets globally in order to decrease terrorists’ success and to
limit their gains when they are logistically successful. This solution is fraught with difficulties
because there will always be softer targets somewhere so that such actions will cause some
transference of attacks. Transference is, however, not necessarily all bad if the terrorists are
forced to attack a less valuable venue. To begin this thought experiment, we must choose a
percentage increase for defensive measures. In fact, the percentage really does not make much
difference to the BCRs and so we choose a 25% increase for illustration.
Since the increase is only in defensive measures, costs must be based on one of the
methods in Table 11 that includes no proactive response. To be as conservative as possible, we
choose M9 which gives the smallest cost estimate. The capitalized five-year costs of this
Copenhagen consensus 2008 Terrorism Challenge Paper
51
solution are easy to calculate and equal $74.6 billion (= 0.25 × $298.3 billion). Benefits are far
more difficult to compute because of transference; thus, we should anticipate that the number of
attacks will not fall by 25%. To make the strongest possible case for the adverse BCR to follow,
we assume the very best (but unlikely) scenario – that attacks drop by 25%. This assumption
means that our benefits are an upper bound on the true benefits. With this assumption, the
capitalized five-year benefits in saved GDP are $20.852 billion. To these benefits, we must add
the estimated gains from fewer casualties. Again, we allow for the best possible scenario where
the annual average number of deaths and wounds (for the 1968-2006 period) fall by 25%. This
means 313 fewer wounded and 105 less dead per year for capitalized five-year benefits of $76.31
million and $40.86 million, respectively, when based on a $5000 DALY and 5% discount rate.
Thus, total benefits are $20.969 billion so that BCR equals 0.281 or a return of about 28 cents on
a dollar. In fact, benefits are less than this best-case scenario, thus implying a smaller BCR. The
ratio will improve if we use a $2 million value of life, because the best-case benefits from
reduced casualties are $1.854 billion – i.e., $899.58 million from wounded and $954.65 million
from deaths. Now, BCR equals 0.304, which is still adverse.
Virtually, any percentage increase in defensive measures will yield similar BCRs. The
driver of this result is that security costs far outweigh the counterfactual benefits in terms of
lower casualties and saved GDP. Such a solution can be more attractive if transnational
terrorism becomes more deadly or more harmful to the economy. For this to happen, we must
envision chemical, biological, radiological, or nuclear terrorist attacks, which we address later.
Based on current threats, it is not surprising that enhanced security is not an ideal solution,
because nations probably already spend too much on security in strategic actions to shift attacks
Copenhagen consensus 2008 Terrorism Challenge Paper
52
abroad.
Solution 5: More Sensitive Foreign Policies on the Part of a Prime-Target Nation
The last solution is the most difficult to evaluate on either a cost or benefit basis. This solution is
motivated, in part, by Michael Scheuer’s (2006) Through Our Enemies’ Eyes, in which he
explains that fundamentalist-based transnational terrorism has been a reaction to insensitive US
foreign policy.
This solution requires projecting a more positive US image, negating terrorist
propaganda, identifying terrorist hypocrisy (e.g., when they murder Muslims in Jordan and
Egypt), and showing a more humane side of US foreign policy. This may be achieved, in part,
by being more evenhanded by recognizing Israeli and Palestinian rights to exist and prosper. In
other instances, more sensitive foreign policy can be promoted by reallocating and/or increasing
foreign assistance. Currently, the United States gives only 0.17% of gross net income as official
development assistance – some $22.7 billion in 2006 (Organization of Economic Cooperation
and Development (OECD), 2007). Next to Greece, the United States allocates the smallest share
of national income among OECD countries to foreign assistance. Moreover, US aid is highly
skewed to countries that support the United States in its foreign policy agenda. Currently, the
larger shares of US foreign assistance goes to Iraq, Sudan, Afghanistan, Pakistan, Colombia,
Israel, Jordan, and Ethiopia – countries that the United States deem important in its war on terror.
Such aid is not necessarily looked upon as being altruistic, given that the United States is
pursuing policy goals with its gifts. Some redistribution of foreign aid may be a costless way of
winning favor with the world community through efforts to direct aid to helping people without
reciprocity.
Copenhagen consensus 2008 Terrorism Challenge Paper
53
Given its ability to move people and supplies, the United States is in an excellent position
to bring relief to disaster areas. US efforts in Indonesia after the December 2004 tsunami were
an effective way to display a humane side of the United States to a country with a large Muslim
population. Efforts by the United States to expand its humanitarian aid in terms of greater
foreign assistance with no strings attached will gain respect for the United States within the
world community. Certainly, the United States has the capacity to do more to address hunger,
diseases, and poverty.
Terrorists have been adept in winning over people with ideas and values. The United
States and other target countries must also learn to gain the high moral ground through culture-
sensitive policies that do not impose Western values. In this regard, democracy cannot be
rapidly introduced into countries that have had little or no experience with democracy. US
administrations must choose their words carefully, not to insult or humiliate other countries
whose policy goals differ with those of the United States. The United States must also ensure
that its treatment of prisoners maintains the rights and liberties, embodied by international law.
Ill-treatment of prisoners may result in an outbreak of terrorist actions as hostage-taking events
showed following the April 2004 revelations about US abuses at Abu Ghraib. Instead of seeking
military bases in the Middle East, the United States could rely on its aircraft carriers to position
troops and materiel as required. Land bases have led to clashes of culture in the past that have
angered people against the United States.
Although it is difficult, we try to estimate the magnitude of the benefits from a more
sensitive US foreign policy. Suppose that this policy solution decreases attacks against US
interests by 25% a year. This would reduce transnational terrorism by 10% since 40% of all
transnational terrorist attacks are on average directed against US interests, mostly abroad. This
Copenhagen consensus 2008 Terrorism Challenge Paper
54
would then save $8.34 billion in GDP when capitalized over five years. If, moreover, homeland
security could be reduced worldwide by 10% owing to the lessened threat, then this would save
at least another $29.83 billion over five years. These two benefits total $38.17 billion. Reduced
casualties (42 less fatalities and 125 less wounded) from 10% fewer attacks provide additional
benefits of $46.868 million over five years at a $5000 DALY. In total, benefits are estimated at
$38.217 billion if a quarter of attacks against US interests are curbed.
With the exception of increased foreign aid, this solution is virtually costless since
foreign assistance can be redistributed among recipients with little or no costs to the US budget.
Ensuring that the United States respects human rights in its handling of prisoners of war is also
costless. If the 25% reduction in US-oriented attacks is a reasonable assumption, then foreign
aid can be increased by $7 to 8 billion a year and still give a BCR that is 1 or larger. This is
about a 33% increase in US-funded official development assistance. Even if US attacks drop by
less than 25%, this solution has much to offer because any fall in such attacks has a payback with
little expense. The United States needs to understand what it can do through its rhetoric and
policy stance to reduce transnational terrorist attacks against its interests that have negative
consequences for countries where attacks are staged.
Of course, it is very difficult to know what type of foreign assistance will do the most to
win favor with people worldwide and to curb transnational terrorism. We believe that assistance
that responds to dire needs and has no reciprocity implied holds the best chances in this regard.
A recent study indicates that regimes with greater civil liberties are better able to curb
transnational terrorism (Krueger and Maleckova, 2003). Tavares (2004) shows that regimes with
more civil liberties sustain smaller GDP losses from terrorism.
Copenhagen consensus 2008 Terrorism Challenge Paper
55
Solution Summary
Table 13 provides a summary of the five solutions and their basic variants in terms of benefits,
costs, and BCRs. For four of the solutions (all except Solution 2), we calculate the consequences
of casualties in terms of $5000 DALY and a $2 million value of life. Little would change to the
BCRs if we used $1000 DALY since savings in GDP and spending on security are driving our
results. If we were to use a discount rate of 3% instead of 5%, then this will have little effect on
the BCRs for Solutions 1, 3, and 4. For example, the BCRs for Solution 1 rise slightly to 0.098
and 0.040 as benefits increase slightly relative to costs. A lower discount rate will leave the
ratios for the two variants of Solution 2 unaffected owing to our long time horizon. For Solution
5, a lower discount rate will make the benefits more favorable. In the Appendix, Table 13A
indicates benefits, costs, and BCRs for our solutions using a 3% discount rate. The Appendix
also gives the calculations for the cost of homeland security (Table 11A) and lost GDP due to
terrorism using a 3% discount rate. Regardless of the discount rate, our basic message remains
the same: security-based solutions display adverse BCRs. We favor low-cost solutions that
either augment international cooperation of target governments or else put forward a more
sensitive foreign policy stance. Neither of these solutions are easy to implement.
[Table 13 near here]
Prognosis for the Future and Conclusions
The biggest unknown is what types of attacks may be used by terrorists in the future. Our
adverse BCRs for costly Solutions 1, 3, and 4 are because transnational terrorism has not killed
or injured many people and has done relatively little damage to economies. But more deadly and
damaging attacks in the future may eventually justify the high cost of defensive and proactive
Copenhagen consensus 2008 Terrorism Challenge Paper
56
expenditures. Surely, this fear drives US expenditure on homeland security and its global war on
terrorism. As al-Qaida strengthens, the United States has good reason to be vigilant and
proactive against new terrorist attacks that can be very costly.
For the future, the most worrying terrorist attacks are chemical, biological, radiological,
or nuclear (CBRN) in nature. Table 14 lists examples of each kind of CBRN terrorist attacks.
Chemical attacks may involve nerve, blood, choking, or blistering agents, which if dispersed in
confined areas can murder large numbers of people. The March 1995 sarin attack on the Tokyo
subway had this potential but fortunately did not disperse as planned and so only twelve people
died. For biological terrorist attacks, viruses and bacteria pose the greatest concern because once
deployed they can replicate themselves and be passed among the victims. Fortunately, bacteria,
such as anthrax, are difficult to “weaponize” so that the bacteria will be inhaled in sufficient
quantity by the victims. The optimal aerosol particle size is one to five microns, which is
sufficiently tiny to remain airborne for hours and sufficiently light to be readily dispersed
through air-exchange systems in buildings and other closed spaces. The most worrisome
radiological attack is a dirty bomb, which is an explosive device used to disperse highly
radioactive substances. A dirty bomb in Manhattan or Los Angeles can create huge economic
consequences by making parts of the city uninhabitable if plutonium has been used. Nuclear
terrorist attacks are the most unlikely.
[Table 14 near here]
In recent papers, Ivanova and Sandler (2006, 2007) investigate the likely nature of future
CBRN terrorist attacks, based on data on past CBRN terrorist incidents, gathered by the
Monterey Institute of International Studies. On average, past CBRN incidents killed a half of a
person, thus making them only half as deadly as conventional terrorist attacks (Ivanova and
Copenhagen consensus 2008 Terrorism Challenge Paper
57
Sandler, 2006). This does not mean that future CBRN terrorist attack will kill few people;
rather, it means that conventional terrorism has, until now, posed a greater threat. As a potential
hazard, CBRN terrorism presents a great potential risk that justifies vigilance and security
precautions. In past incidents, the most common CBRN agent was chemical substances (205
incidents), which account for almost two-thirds of all sample incidents.12 Biological events are
second with 42 instances. There were relatively few radiological events (26) and even fewer
nuclear incidents (8). Ivanova and Sandler (2006, 2007) demonstrate that religious cults and
terrorist groups with a transnational orientation pose the largest threat. Moreover, groups that
engaged in a past CBRN incident are more likely to participate in future CBRN incidents. Rich
democratic countries are the likely venue for future CBRN attacks.
When CBRN terrorism becomes a greater possibility, the BCRs for Solutions 1, 3, and 4
will become much larger as benefits grow relative to costs. Fortunately, there are some
inhibitors for this disturbing scenario. The cellular structure of today’s terrorist groups makes it
difficult for them to surmount acquisition and weaponization barriers. CBRN agents pose a
handling risk that many terrorists are reluctant to assume. A deadly CBRN terrorist attack is apt
to alienate supporters of some terrorist groups. Moreover, such attacks will induce a target
country to unleash an unrestrained retaliation that many groups cannot survive – e.g., Aum
Shinrikyo following the sarin attack on the Tokyo subway. Finally, a conventional attack like
9/11 is sufficiently deadly to limit the need for CBRN terrorist attacks.
We conclude with some basic insights. First, there is no panacea for transnational
terrorism – effective action buys a government some time until a new group surfaces or terrorists
discover novel ways to circumvent barriers. Transnational terrorism favors terrorists over a more
capable government. Second, solutions that rely on massive defensive and/or proactive measures
Copenhagen consensus 2008 Terrorism Challenge Paper
58
have adverse BCRs, primarily because such actions are very expensive. Third, transnational
terrorism has, in the past, been associated with relatively few casualties and small economic
consequences. Fourth, the best remedies are the cheap ones that either foster international
cooperation or make prime-target nations think through foreign policy choices. These solutions
are the most difficult to achieve. We do not advocate that governments concede to terrorists’
demands; rather, we recommend that foreign policy be evenhanded, farsighted, and respectful of
other cultures.
We fully recognize that many people will fault our efforts as “making up numbers.”
Based on calibrated losses of GDP, past casualties, and expenditures on homeland security, we
devise counterfactuals to ascertain the payback per dollar for certain solutions to transnational
terrorism. Our BCRs are very robust to alternative assumptions. We hope that our study
motivates others to ask: are current policy choices with respect to transnational terrorism worth
the expenditures? This question needs to be asked and answered. Also, the global community
must consider expenditures on transnational terrorism relative to other challenges such as
disease, hunger, and the environment. This study is a first step to addressing such questions.
Copenhagen consensus 2008 Terrorism Challenge Paper
59
Footnotes
1. On ITERATE, see Mickolus (1980, 1982) and Mickolus, Sandler, and Murdock
(1989).
2. The bombing of London, Tokyo, and Dresden in World War II are clear exceptions to
the general rule since civilians were the target in these attacks. Other exceptions include the US
atomic bombs dropped on Hiroshima and Nagasaki.
3. In a statistical analysis, Enders and Sandler (2000) trace the start of fundamentalist
terrorism to the fourth quarter of 1979 when these two events took place.
4. The US Department of State’s Patterns of Global Terrorism was replaced by annual
reports on terrorism by the National Counterterrorism Center (NCC), which does not distinguish
between domestic and transnational incidents. Moreover, it includes insurgent attacks against an
occupying military force. Thus, recent NCC reports give the false impression that transnational
terrorism is worsening in terms of the number of events.
5. This paragraph draws from Sandler and Enders (2008).
6. This terminology is from Shubik, Zelinsky, and Krstic (2006).
7. For example, we can regress the number of tourists in period t against past values of
tourists and the current (and past) value(s) of terrorist attacks. Once this equation is estimated,
we can determine the level of tourism with current and past levels of terrorism. Next, we set the
coefficients on the terrorism terms in the estimated equation equal to zero (i.e., the
counterfactual) and again ascertain the level of tourism. The difference in tourism with and
without terrorism for the estimated equation indicates terrorism’s influence on tourism (Enders,
Sandler, and Parise, 1992).
8. Terrorism became a problem in Iraq in 2004 after the ouster of Saddam Hussein and
Copenhagen consensus 2008 Terrorism Challenge Paper
60
the insurgency began.
9. These ratios are the same for $1000 and $5000 DALYs.
10. These authors measure transnational terrorism as a dummy variable equal to 1 if
there are one or more attacks in a given year and zero otherwise. They do not include the level
of terrorism – i.e., number or severity of transnational terrorist incidents as an independent
variable.
11. This modification is to multiply i i iN D∑ (see Tables 8-9) where i denotes the
various injury classifications by $2 million. (Remember that 1iD < for injuries.) The resulting
figure is then capitalized over a five-year period at a discount rate of 5%. Note that deaths mean
that i i iN D∑ equals the number of deaths since 1iD = and i iN∑ sums those who have died.
12. The statistics in this paragraph come from Ivanova and Sandler (2007).
Copenhagen consensus 2008 Terrorism Challenge Paper
61
References
Abadie, A., and J. Gardeazabal, 2003: The economic cost of conflict: a case study of the Basque
country, American Economic Review, 93(1), 113-132.
2007: Terrorism and the world economy, Working Paper, Kennedy School of Government,
Harvard University.
Abenhaim, L., W. Dab, and L. R. Salmi, 1992: Study of civilian victims of terrorist attacks
(France 1982-1987), Journal of Clinical Epidemiology, 45(2), 103-109.
Alexander, Y., and D. Pluchinsky, 1992: Europe’s red terrorists: the fighting communist
organizations, Frank Cass, London.
Belasco, A., 2007: The cost of Iraq, Afghanistan, and other global war on terror operations since
9/11, Congressional Research Service (CRS) Report for Congress, Code RL33110, CRS,
Washington, DC.
Blomberg, S. B., and A. Mody, 2005: How severely does violence deter international
investment?, mimeo, Department of Economics, Claremont McKenna College,
Claremont, CA.
Blomberg, S. B., G. D. Hess, and A. Orphanides, 2004: The macroeconomic consequences of
terrorism, Journal of Monetary Economics, 51(5), 1007-1032.
Bloom, M., 2005: Dying to kill: the allure of suicide terror, Columbia University Press, New
York.
Chen, A. H., and T. F. Siems, 2004: The effects of terrorism on global capital markets,
European Journal of Political Economy, 20(2), 249-266.
Copenhagen consensus 2008 Terrorism Challenge Paper
62
Collier, P., L. Elliot, H. Hegre, A. Hoeffler, M. Reynal-Querol, and N. Sambanis, 2003:
Breaking the conflict trap: civil war and development policy, Oxford University Press,
Oxford.
Committee to Study Sustainable Long-Term Financing of the IMF, 2007: Final report
(Crockett Report), International Monetary Fund (IMF), Washington, DC.
Cronin, A. K., 2006: How al-Qaida ends: the decline and demise of terrorist groups,
International Security, 31(1), 7-48.
Department of Homeland Security (DHS), 2004: Budget in brief, DHS, Washington, DC,
http://www.dhs.gov/interweb/assetlibrary/FY_2005_BIB_4.pdf.
Drakos, K., 2004: Terrorism-induced structural shifts in financial risk: airline stocks in the
aftermath of the September 11th terror attacks, European Journal of Political Economy,
20(2), 436-446.
Eckstein, Z., and D. Tsiddon, 2004: Macroeconomic consequences of terror: theory and the case
of Israel, Journal of Monetary Economics, 51(5), 971-1002.
Enders, W., and T. Sandler, 1993: The effectiveness of anti-terrorism policies: a vector-
autoregression-intervention analysis, American Political Science Review, 87(4), 829-844.
1995: Terrorism: theory and applications. In K. Hartley and T. Sandler (eds.), Handbook of
defense economics, vol. 1, North-Holland, Amsterdam, 213-249.
1996: Terrorism and foreign direct investment in Spain and Greece, Kyklos, 49(3), 331-352.
2000: Is transnational terrorism becoming more threatening? A time-series investigation,
Journal of Conflict Resolution, 44(3), 307-322.
2002: Patterns of transnational terrorism, 1970-1999: alternative time-series estimates,
International Studies Quarterly, 46(2), 145-165.
Copenhagen consensus 2008 Terrorism Challenge Paper
63
2006a: The political economy of terrorism, Cambridge University Press, Cambridge.
2006b: Distribution of transnational terrorism among countries by income class and
geography after 9/11, International Studies Quarterly, 50(2), 367-393.
Enders, W., and X. Su, 2007: Rational terrorists and optimal network structure, Journal of
Conflict Resolution, 51(1), 33-57.
Enders, W., A. Sachsida, and T. Sandler, 2006: The impact of transnational terrorism on US
foreign direct investment, Political Research Quarterly, 59(4), 517-531.
Enders, W., T. Sandler, and G. F. Parise, 1992: An econometric analysis of the impact of
terrorism on tourism, Kyklos, 45(4), 531-554.
Eubank, W. L., and L. B. Weinberg, 1994: Does democracy encourage terrorism?, Terrorism
and Political Violence, 6(4), 417-435.
2001: Terrorism and democracy: perpetrators and victims, Terrorism and Political Violence,
13(1), 155-164.
Frey, B. S., 2004: Dealing with terrorism – stick or carrot?, Edward Elgar, Cheltenham, UK.
Frykberg, E. R., 2002: Medical management of disasters and mass casualties from terrorist
bombings: how can we cope?, Journal of TRAUMA, Injury, Infections, and Critical Care,
53(2), 201-212.
Hobijn, B., and E. Sager, 2007: What has homeland security cost? An assessment: 2001-2005,
Current Issues in Economics and Finance, 13(2), 1-7,
http://www.newyorkfed.org/research/current_issues.
Hoffman, B., 1998: Inside terrorism, Columbia University Press, New York.
2003: Al Qaeda, trends in terrorism, and future potentialities: an assessment, Studies in
Conflict and Terrorism, 26(6), 429-442.
Copenhagen consensus 2008 Terrorism Challenge Paper
64
2006: Inside terrorism, revised ed., Columbia University Press, New York.
Institute of Medicine, 2002: Biological threats and terrorism: assessing the science and
response capabilities, National Academy Press, Washington, DC.
Interpol, 2005: Interpol at work, finances, 30-31,
http://www.interpol.int/Public/ICPO/InterpolAtWork/iaw2005.pdf.
Ito, H., and D. Lee, 2004: Assessing the impact of the September 11 terrorist attacks on US
airline demand, unpublished paper, Brown University, Providence, RI.
Ivanova, K., and T. Sandler, 2006: CBRN incidents: political regimes, perpetrators, and targets,
Terrorism and Political Violence, 18(3), 423-448.
2007: CBRN attack perpetrators: an empirical study, Foreign Policy Analysis, 3(4), 273-294.
Krueger, A. B., and J. Maleckova, 2003: Education, poverty, and terrorism: is there a casual
connections?, Journal of Economic Perspective, 17(4), 119-144.
Kunreuther, H., E. Michel-Kerjan, and B. Porter, 2003: Assessing, managing and financing
extreme events: dealing with terrorism, Working Paper 10179, National Bureau of
Economic Research, Cambridge, MA.
Mathers, C. D., A. D. Lopez, and C. J. L. Murray, 2003: The burden of disease and mortality by
condition: data, methods and results for 2001, http://files.dcp2.org/pdf/GBD/GBD03.pdf.
Memorial Institute for the Prevention of Terrorism (MIPT), 2006: Countering terrorism and
knowledge, http://www.mipt.org.
Mickolus, E. F., 1980: Transnational terrorism: a chronology of events 1968-1979, Greenwood
Press, Westport, CT.
1982: International terrorism: attributes of terrorist events, 1968-1977 (ITERATE 2), Inter-
University Consortium for Political and Social Research, Ann Arbor, MI.
Copenhagen consensus 2008 Terrorism Challenge Paper
65
1989: What constitutes state support of terrorism? Terrorism and Political Violence, 1(3),
287-293.
Mickolus, E. F., and S. L. Simmons, 1997: Terrorism, 1992-1995: a chronology of events and a
selectively annotated bibliography, Greenwood Press, Westport, CT.
Mickolus, E. F., T. Sandler, and J. M. Murdock, 1989: International terrorism in the 1980s: a
chronology of events, 2 vols., Iowa State University Press, Ames, IA.
Mickolus, E. F., T. Sandler, J. M. Murdock, and P. Flemming, 2006: International terrorism:
attributes of terrorist events, 1968-2005 (ITERATE), Vinyard Software, Dunn Loring,
VA.
National Commission on Terrorist Attacks upon the United States, 2004: The 9/11
commission report, Norton, New York.
Organization of Economic Cooperation and Development (OECD), 2007: Table 1: net
official development assistance in 2006 (preliminary data for 2006),
http://www.oecd.org/dataoed/14/5/38354517.pdf.
Pape, R. A., 2006: Dying to win: the strategic logic of suicide terrorism, Random House, New
York.
Quillen, C., 2002a: A historical analysis of mass casualty bombers, Studies in Conflict and
Terrorism, 25(5), 279-292.
2002b: Mass casualty bombings chronology, Studies in Conflict and Terrorism, 25(5), 293-
302.
Copenhagen consensus 2008 Terrorism Challenge Paper
66
Rapoport, D. C., 1984: Fear and trembling: terrorism in three religious traditions, American
Political Science Review, 78(3), 658-677.
2004: Modern terror: the four waves. In A. K. Cronin and J. M. Ludes (eds.), Attacking
terrorism: elements of a grand strategy, Georgetown University Press, Washington, DC,
46-73.
Rosendorff, B. P., and T. Sandler, 2004: Too much of a good thing? The proactive response
dilemma, Journal of Conflict Resolution, 48(5), 657-671.
Sandler, T., 2005: Collective versus unilateral responses to terrorism, Public Choice, 124(1-2),
75-93.
Sandler, T., and D. G. Arce, 2003: Terrorism and game theory, Simulation and Gaming, 34(3),
319-337.
Sandler, T., and W. Enders, 2008: Economic consequences of terrorism in developed and
developing countries: an overview. In P. Keefer and N. Loayza (eds.), Terrorism and
economic development, Cambridge University Press, Cambridge, forthcoming.
Sandler, T., and K. Siqueira, 2006: Global terrorism: deterrence versus pre-emption, Canadian
Journal of Economics, 39(4), 1370-1387.
Scheuer, M., 2006: Through our enemies’ eyes, revised ed., Potomac Books, Washington, DC.
Shubik, M., A. Zelinsky, and L. Krstic, 2006: Terrorism: who pays?, Social Science Research
Network, Working Paper Series, http://ssrn.com/abstract=956403.
Siqueira, K., and T. Sandler, 2007: Terrorist backlash, terrorism mitigation, and policy
delegation, Journal of Public Economics, 91(9), 1800-1815.
Tavares, J., 2004: The open society assesses its enemies: shocks, disaster and terrorist attacks,
Journal of Monetary Economics, 51(5), 1039-1070.
Copenhagen consensus 2008 Terrorism Challenge Paper
67
Treverton, G. F., J. L. Adams, J. Dertouzos, A. Dutta, S. S. Everingham, and E. V. Larson,
2008: The costs of responding to the terror threat: the US case. In P. Keefer and N.
Loayza (eds.), Terrorism and economic development, Cambridge University Press,
Cambridge, forthcoming.
United States Department of State, various years: Patterns of global terrorism, US Department
of State, Washington, DC.
2007: Country reports on terrorism, http://www.state.gov/s/ct/rls/2006.
US News & World Reports, 2007: Al Qaeda regroups, News desk, July 16,
http://www.usnews.com/blogs/news-desk/2007/7/12/al-qaeda-regroups.html.
Weinberg, L. B., and W. L. Eubank, 1998: Terrorism and democracy: what recent events
disclose, Terrorism and Political Violence, 10(1), 108-118.
White, J. R., 2003: Terrorism: 2002 update, 4th ed., Wadsworth/Thomson Learning, Belmont,
CA.
Wilkinson, P., 1986: Terrorism and the liberal state, revised ed., Macmillan, London.
2001: Terrorism versus democracy: the liberal state response, Frank Cass, London.
World Bank, 2007: World development indicators, http://devdata.worldbank.org/dataonline
Wright, L., 2006: The looming tower. Al-Qaeda and the road to 9/11, Knoft, New York.
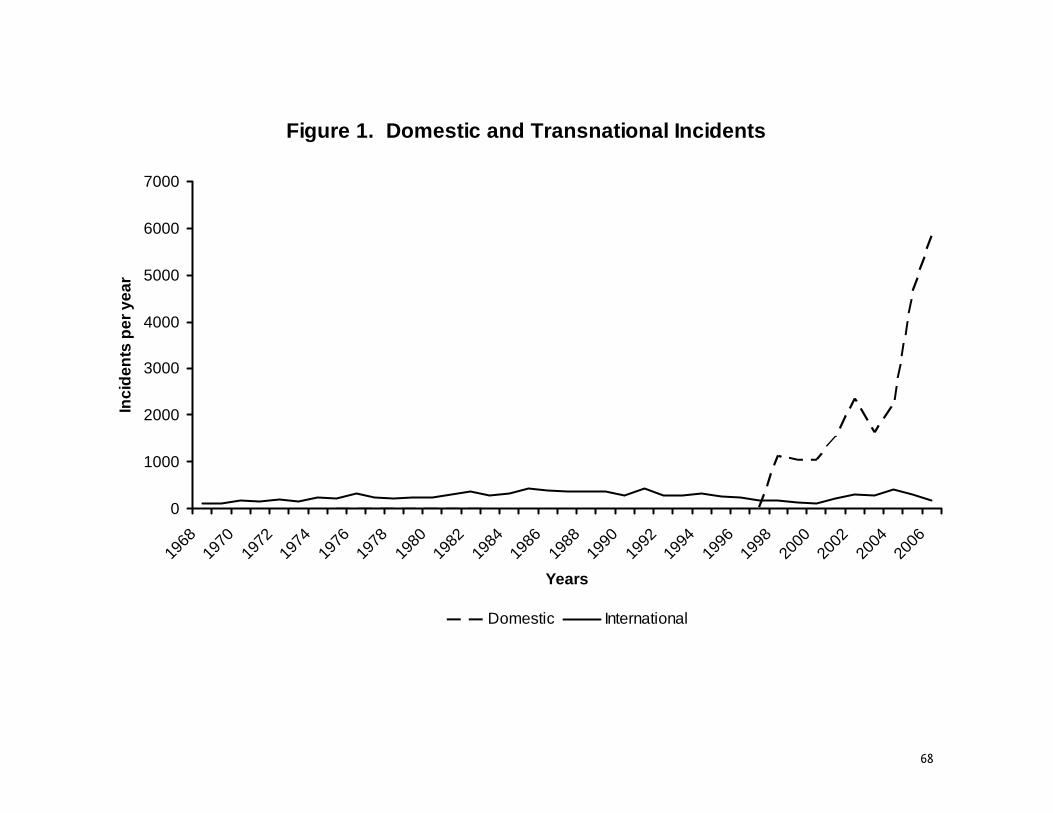
68
Figure 1. Domestic and Transnational Incidents
0
1000
2000
3000
4000
5000
6000
7000
1968
1970
1972
1974
1976
1978
1980
1982
1984
1986
1988
1990
1992
1994
1996
1998
2000
2002
2004
2006
Years
Inci
dent
s pe
r yea
r
Domestic International
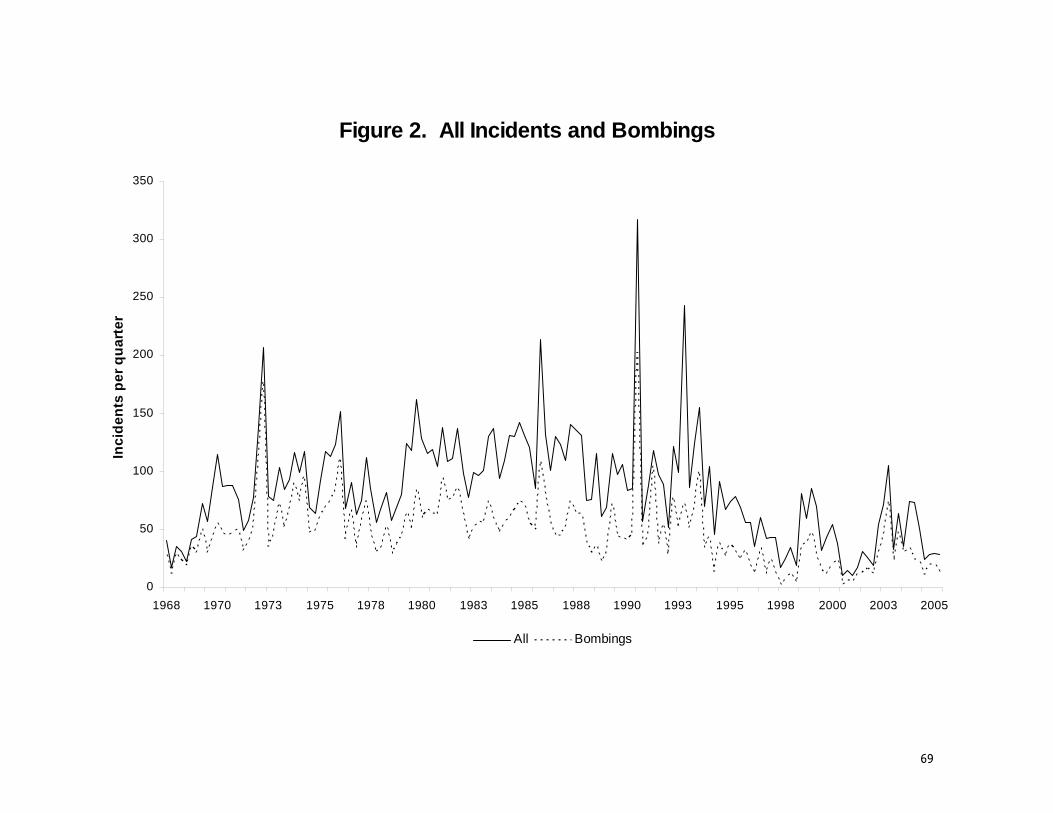
69
Figure 2. All Incidents and Bombings
0
50
100
150
200
250
300
350
1968 1970 1973 1975 1978 1980 1983 1985 1988 1990 1993 1995 1998 2000 2003 2005
Inci
dent
s pe
r qua
rter
All Bombings
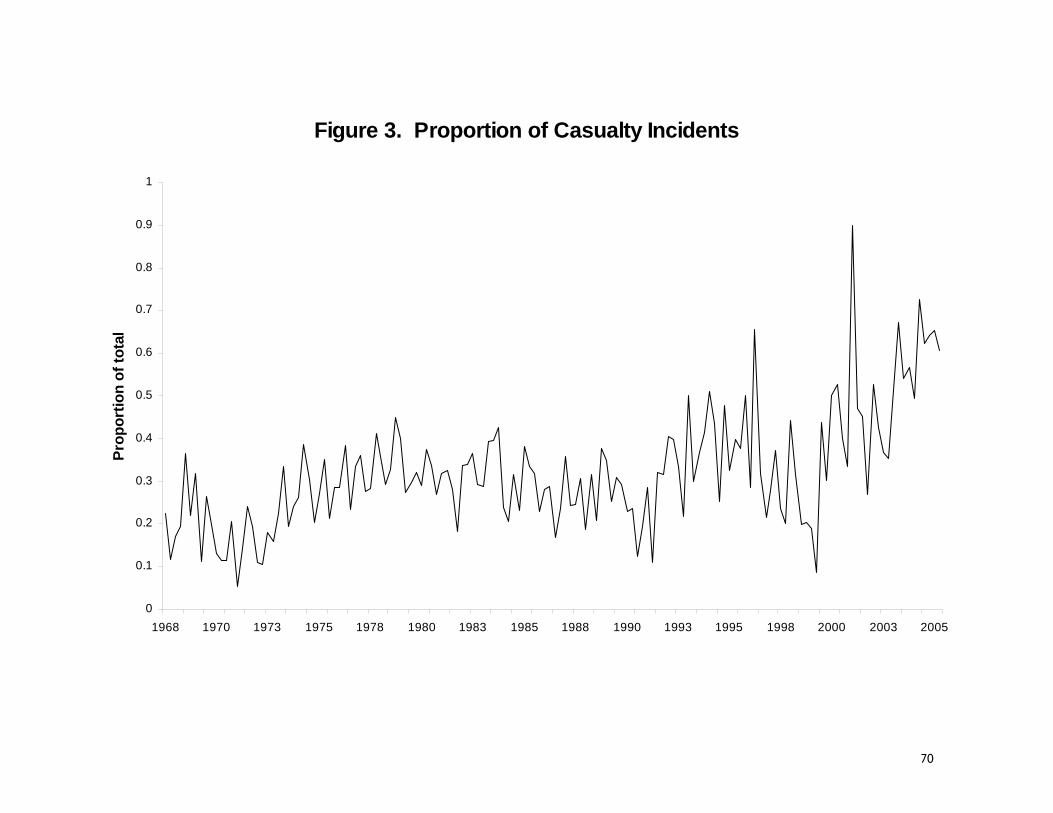
70
Figure 3. Proportion of Casualty Incidents
0
0.1
0.2
0.3
0.4
0.5
0.6
0.7
0.8
0.9
1
1968 1970 1973 1975 1978 1980 1983 1985 1988 1990 1993 1995 1998 2000 2003 2005
Prop
ortio
n of
tota
l
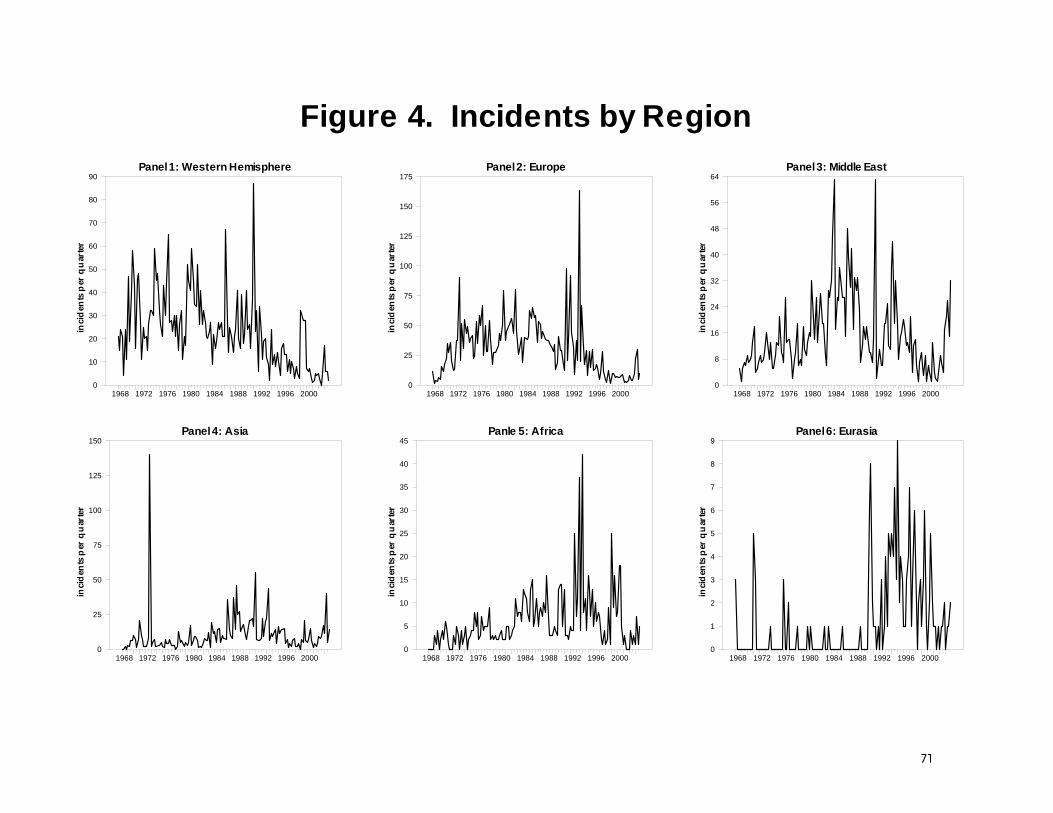
71
Figure 4. Incidents by RegionPanel 1: Western Hemisphere
inci
den
ts p
er q
uar
ter
1968 1972 1976 1980 1984 1988 1992 1996 20000
10
20
30
40
50
60
70
80
90
Panel 4: Asia
inci
den
ts p
er q
uar
ter
1968 1972 1976 1980 1984 1988 1992 1996 20000
25
50
75
100
125
150
Panel 2: Europe
inci
den
ts p
er q
uar
ter
1968 1972 1976 1980 1984 1988 1992 1996 20000
25
50
75
100
125
150
175
Panle 5: Africa
inci
den
ts p
er q
uar
ter
1968 1972 1976 1980 1984 1988 1992 1996 20000
5
10
15
20
25
30
35
40
45
Panel 3: Middle East
inci
den
ts p
er q
uar
ter
1968 1972 1976 1980 1984 1988 1992 1996 20000
8
16
24
32
40
48
56
64
Panel 6: Eurasia
inci
den
ts p
er q
uar
ter
1968 1972 1976 1980 1984 1988 1992 1996 20000
1
2
3
4
5
6
7
8
9
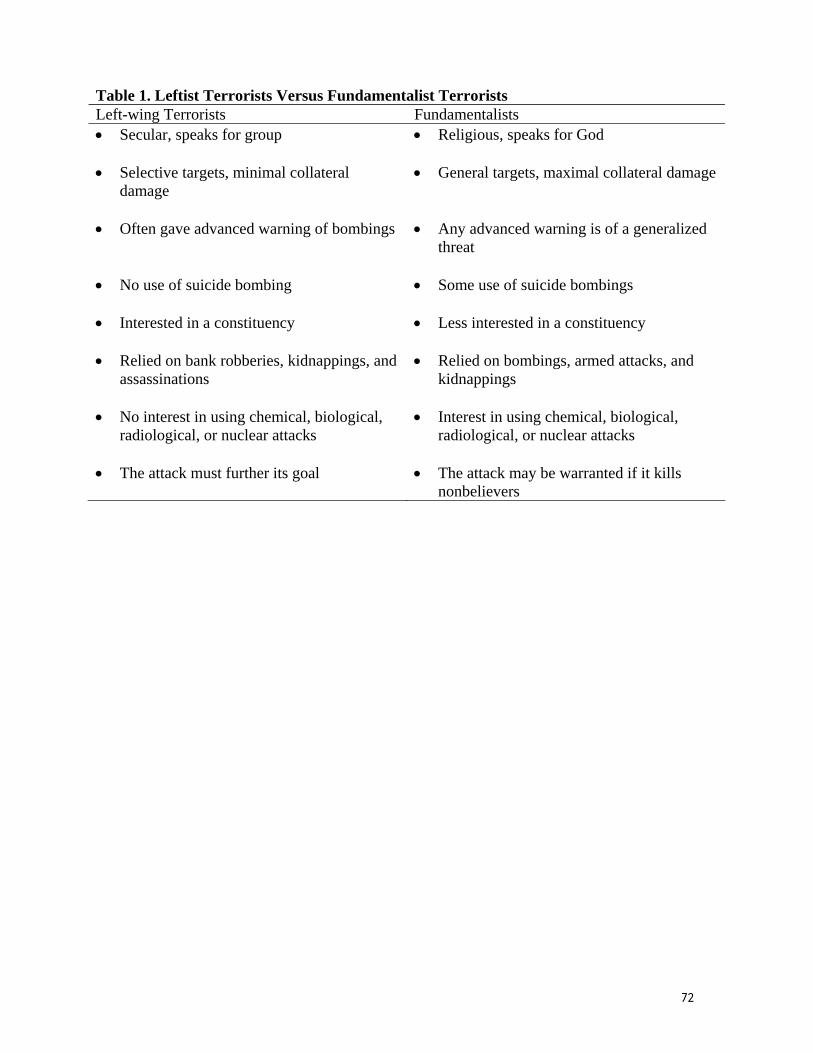
72
Table 1. Leftist Terrorists Versus Fundamentalist Terrorists Left-wing Terrorists Fundamentalists • Secular, speaks for group • Religious, speaks for God • Selective targets, minimal collateral
damage • General targets, maximal collateral damage
• Often gave advanced warning of bombings • Any advanced warning is of a generalized
threat • No use of suicide bombing • Some use of suicide bombings • Interested in a constituency • Less interested in a constituency • Relied on bank robberies, kidnappings, and
assassinations • Relied on bombings, armed attacks, and
kidnappings • No interest in using chemical, biological,
radiological, or nuclear attacks • Interest in using chemical, biological,
radiological, or nuclear attacks • The attack must further its goal • The attack may be warranted if it kills
nonbelievers
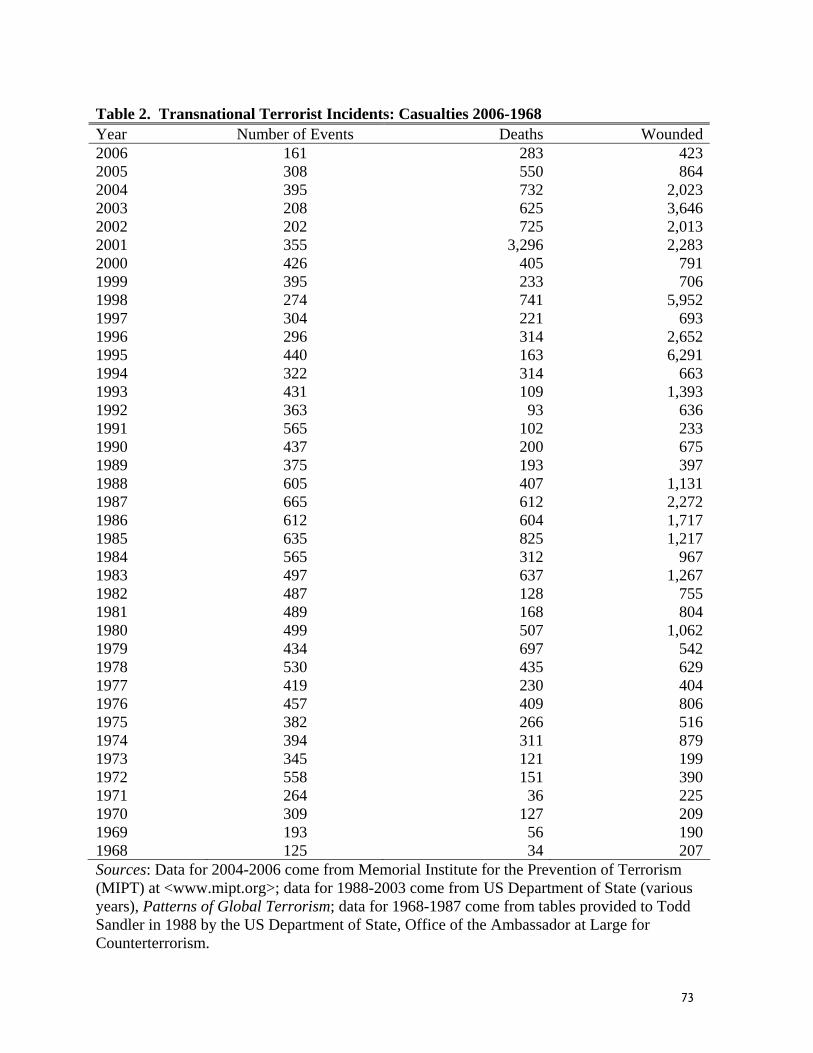
73
Table 2. Transnational Terrorist Incidents: Casualties 2006-1968 Year Number of Events Deaths Wounded2006 161 283 4232005 308 550 8642004 395 732 2,0232003 208 625 3,6462002 202 725 2,0132001 355 3,296 2,2832000 426 405 7911999 395 233 7061998 274 741 5,9521997 304 221 6931996 296 314 2,6521995 440 163 6,2911994 322 314 6631993 431 109 1,3931992 363 93 6361991 565 102 2331990 437 200 6751989 375 193 3971988 605 407 1,1311987 665 612 2,2721986 612 604 1,7171985 635 825 1,2171984 565 312 9671983 497 637 1,2671982 487 128 7551981 489 168 8041980 499 507 1,0621979 434 697 5421978 530 435 6291977 419 230 4041976 457 409 8061975 382 266 5161974 394 311 8791973 345 121 1991972 558 151 3901971 264 36 2251970 309 127 2091969 193 56 1901968 125 34 207Sources: Data for 2004-2006 come from Memorial Institute for the Prevention of Terrorism (MIPT) at <www.mipt.org>; data for 1988-2003 come from US Department of State (various years), Patterns of Global Terrorism; data for 1968-1987 come from tables provided to Todd Sandler in 1988 by the US Department of State, Office of the Ambassador at Large for Counterterrorism.
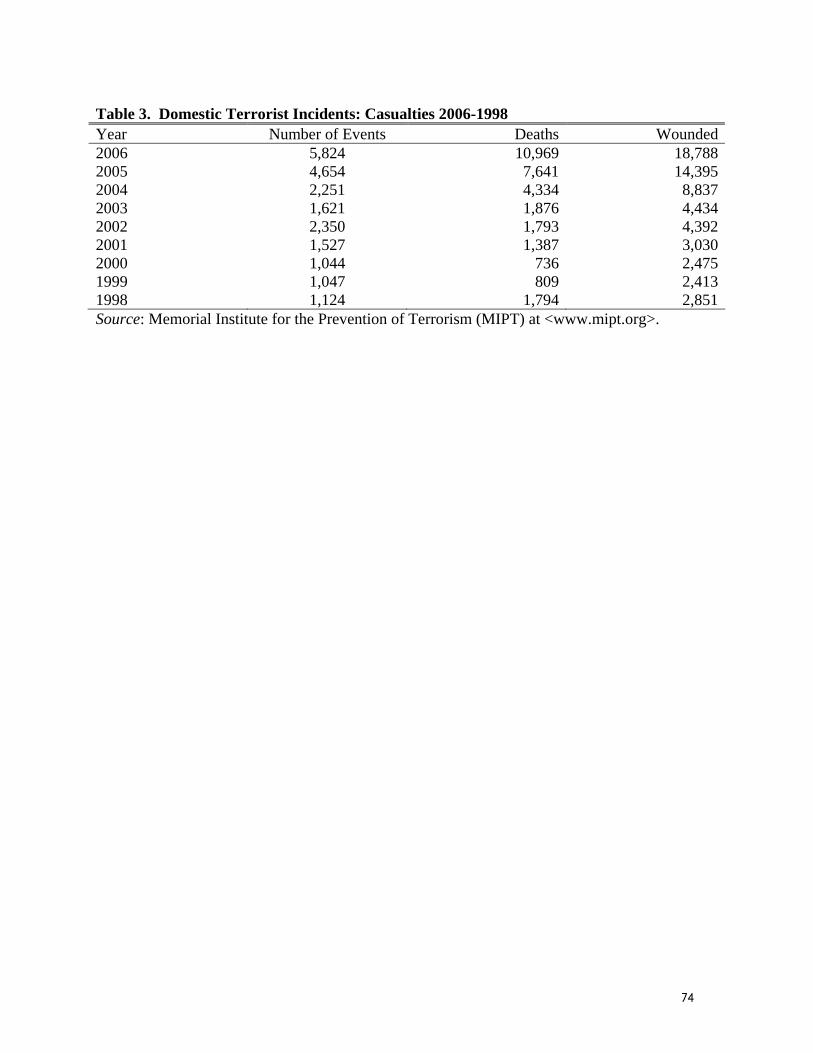
74
Table 3. Domestic Terrorist Incidents: Casualties 2006-1998 Year Number of Events Deaths Wounded2006 5,824 10,969 18,7882005 4,654 7,641 14,3952004 2,251 4,334 8,8372003 1,621 1,876 4,4342002 2,350 1,793 4,3922001 1,527 1,387 3,0302000 1,044 736 2,4751999 1,047 809 2,4131998 1,124 1,794 2,851Source: Memorial Institute for the Prevention of Terrorism (MIPT) at <www.mipt.org>.
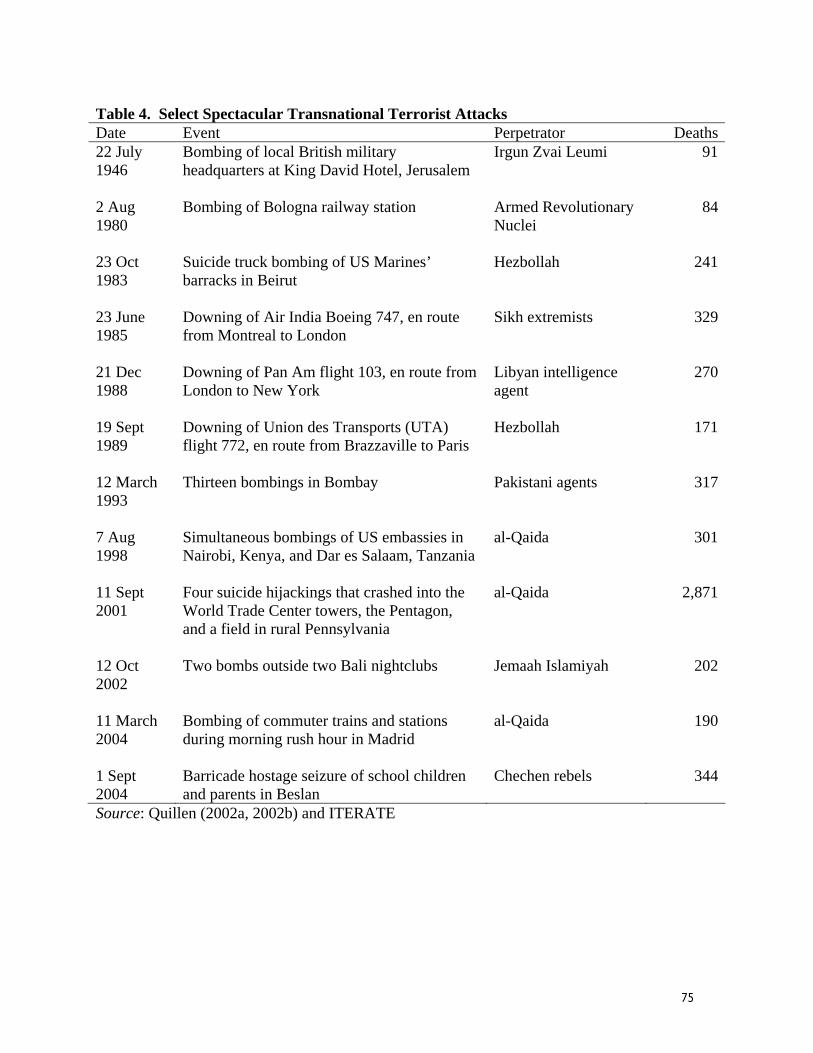
75
Table 4. Select Spectacular Transnational Terrorist Attacks Date Event Perpetrator Deaths22 July 1946
Bombing of local British military headquarters at King David Hotel, Jerusalem
Irgun Zvai Leumi 91
2 Aug 1980
Bombing of Bologna railway station Armed Revolutionary Nuclei
84
23 Oct 1983
Suicide truck bombing of US Marines’ barracks in Beirut
Hezbollah 241
23 June 1985
Downing of Air India Boeing 747, en route from Montreal to London
Sikh extremists 329
21 Dec 1988
Downing of Pan Am flight 103, en route from London to New York
Libyan intelligence agent
270
19 Sept 1989
Downing of Union des Transports (UTA) flight 772, en route from Brazzaville to Paris
Hezbollah 171
12 March 1993
Thirteen bombings in Bombay Pakistani agents 317
7 Aug 1998
Simultaneous bombings of US embassies in Nairobi, Kenya, and Dar es Salaam, Tanzania
al-Qaida 301
11 Sept 2001
Four suicide hijackings that crashed into the World Trade Center towers, the Pentagon, and a field in rural Pennsylvania
al-Qaida 2,871
12 Oct 2002
Two bombs outside two Bali nightclubs Jemaah Islamiyah 202
11 March 2004
Bombing of commuter trains and stations during morning rush hour in Madrid
al-Qaida 190
1 Sept 2004
Barricade hostage seizure of school children and parents in Beslan
Chechen rebels 344
Source: Quillen (2002a, 2002b) and ITERATE
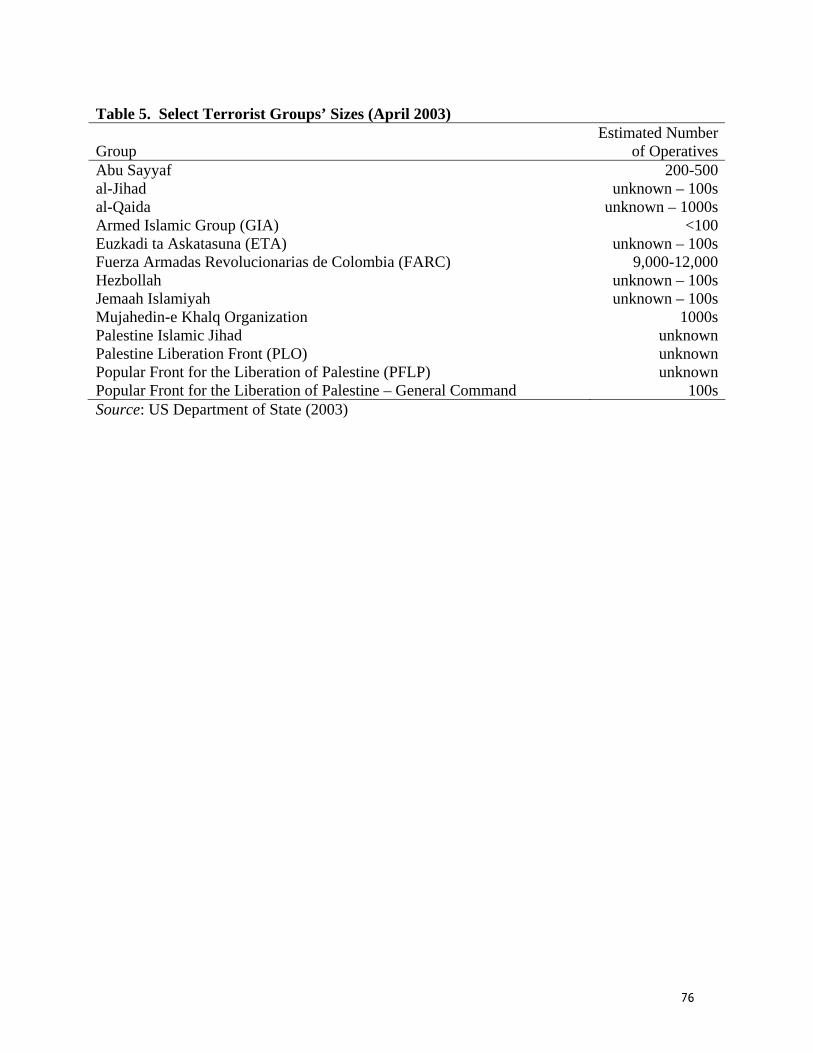
76
Table 5. Select Terrorist Groups’ Sizes (April 2003)
Group Estimated Number
of OperativesAbu Sayyaf 200-500al-Jihad unknown – 100sal-Qaida unknown – 1000sArmed Islamic Group (GIA) <100Euzkadi ta Askatasuna (ETA) unknown – 100sFuerza Armadas Revolucionarias de Colombia (FARC) 9,000-12,000Hezbollah unknown – 100sJemaah Islamiyah unknown – 100sMujahedin-e Khalq Organization 1000sPalestine Islamic Jihad unknown Palestine Liberation Front (PLO) unknownPopular Front for the Liberation of Palestine (PFLP) unknownPopular Front for the Liberation of Palestine – General Command 100sSource: US Department of State (2003)
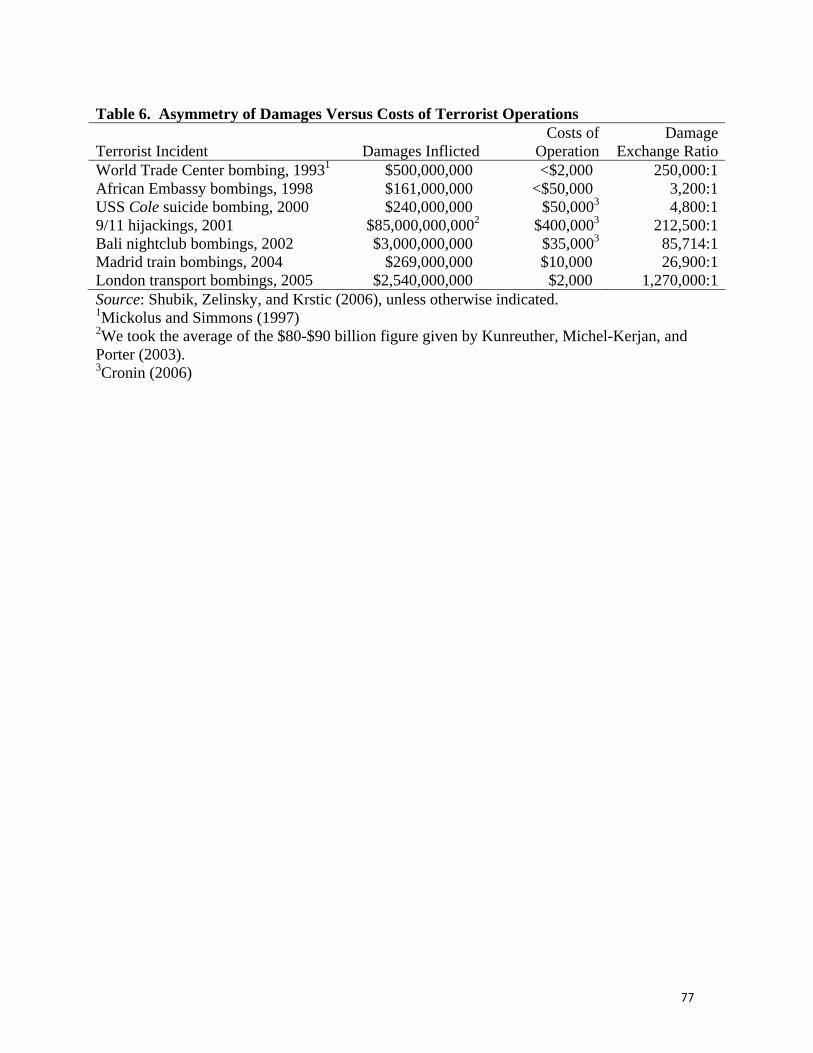
77
Table 6. Asymmetry of Damages Versus Costs of Terrorist Operations
Terrorist Incident Damages InflictedCosts of
Operation Damage
Exchange RatioWorld Trade Center bombing, 19931 $500,000,000 <$2,000 250,000:1African Embassy bombings, 1998 $161,000,000 <$50,000 3,200:1USS Cole suicide bombing, 2000 $240,000,000 $50,0003 4,800:19/11 hijackings, 2001 $85,000,000,0002 $400,0003 212,500:1Bali nightclub bombings, 2002 $3,000,000,000 $35,0003 85,714:1Madrid train bombings, 2004 $269,000,000 $10,000 26,900:1London transport bombings, 2005 $2,540,000,000 $2,000 1,270,000:1Source: Shubik, Zelinsky, and Krstic (2006), unless otherwise indicated. 1Mickolus and Simmons (1997) 2We took the average of the $80-$90 billion figure given by Kunreuther, Michel-Kerjan, and Porter (2003). 3Cronin (2006)
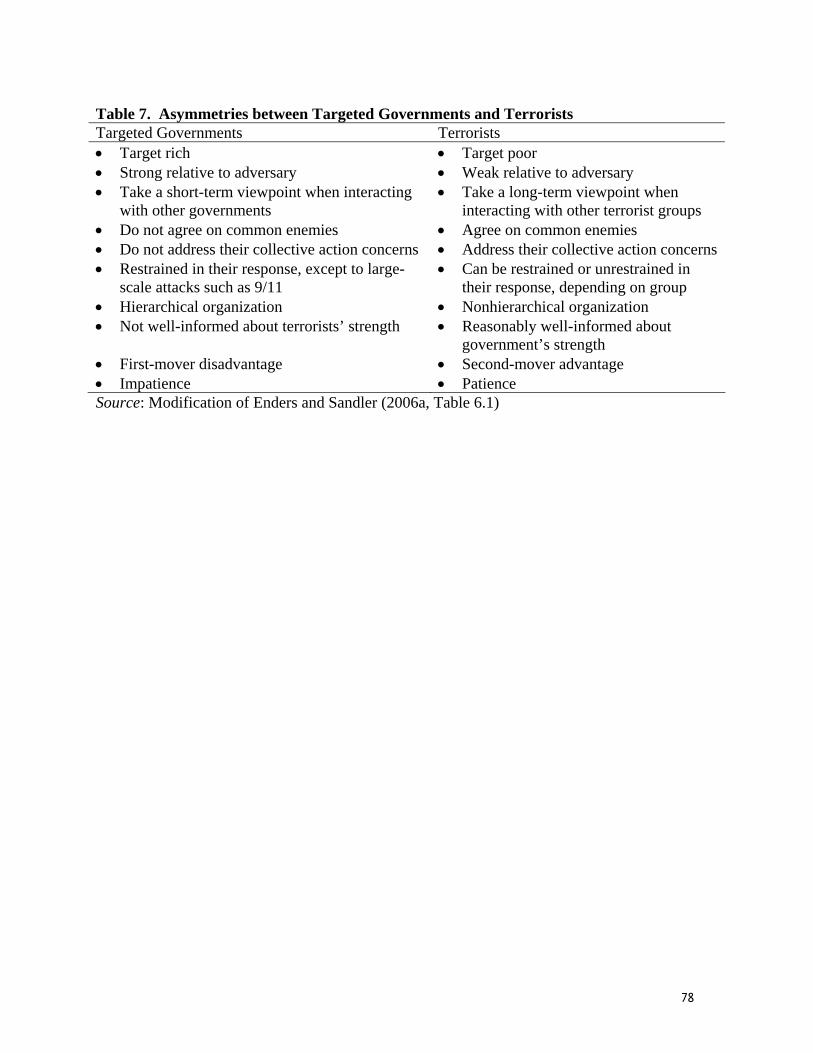
78
Table 7. Asymmetries between Targeted Governments and Terrorists Targeted Governments Terrorists • Target rich • Target poor • Strong relative to adversary • Weak relative to adversary • Take a short-term viewpoint when interacting
with other governments • Take a long-term viewpoint when
interacting with other terrorist groups • Do not agree on common enemies • Agree on common enemies • Do not address their collective action concerns • Address their collective action concerns • Restrained in their response, except to large-
scale attacks such as 9/11 • Can be restrained or unrestrained in
their response, depending on group • Hierarchical organization • Nonhierarchical organization • Not well-informed about terrorists’ strength • Reasonably well-informed about
government’s strength • First-mover disadvantage • Second-mover advantage • Impatience • Patience Source: Modification of Enders and Sandler (2006a, Table 6.1)
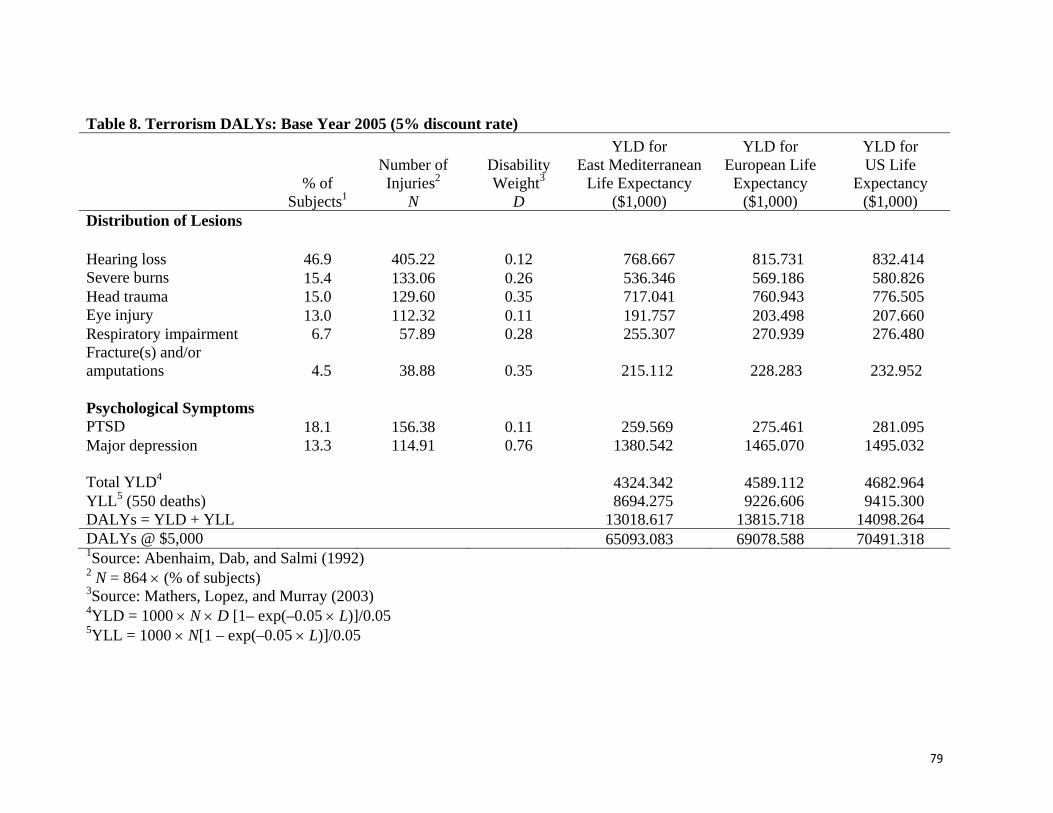
79
Table 8. Terrorism DALYs: Base Year 2005 (5% discount rate)
% of Subjects1
Number of Injuries2
N
Disability Weight3
D
YLD for East Mediterranean
Life Expectancy ($1,000)
YLD for European Life
Expectancy ($1,000)
YLD for US Life
Expectancy ($1,000)
Distribution of Lesions Hearing loss 46.9 405.22 0.12 768.667 815.731 832.414 Severe burns 15.4 133.06 0.26 536.346 569.186 580.826 Head trauma 15.0 129.60 0.35 717.041 760.943 776.505 Eye injury 13.0 112.32 0.11 191.757 203.498 207.660 Respiratory impairment 6.7 57.89 0.28 255.307 270.939 276.480 Fracture(s) and/or amputations 4.5 38.88 0.35 215.112 228.283 232.952 Psychological Symptoms PTSD 18.1 156.38 0.11 259.569 275.461 281.095 Major depression 13.3 114.91 0.76 1380.542 1465.070 1495.032 Total YLD4 4324.342 4589.112 4682.964 YLL5 (550 deaths) 8694.275 9226.606 9415.300 DALYs = YLD + YLL 13018.617 13815.718 14098.264 DALYs @ $5,000 65093.083 69078.588 70491.318 1Source: Abenhaim, Dab, and Salmi (1992) 2 N = 864 × (% of subjects) 3Source: Mathers, Lopez, and Murray (2003) 4YLD = 1000 × N × D [1– exp(–0.05 × L)]/0.05 5YLL = 1000 × N[1 – exp(–0.05 × L)]/0.05
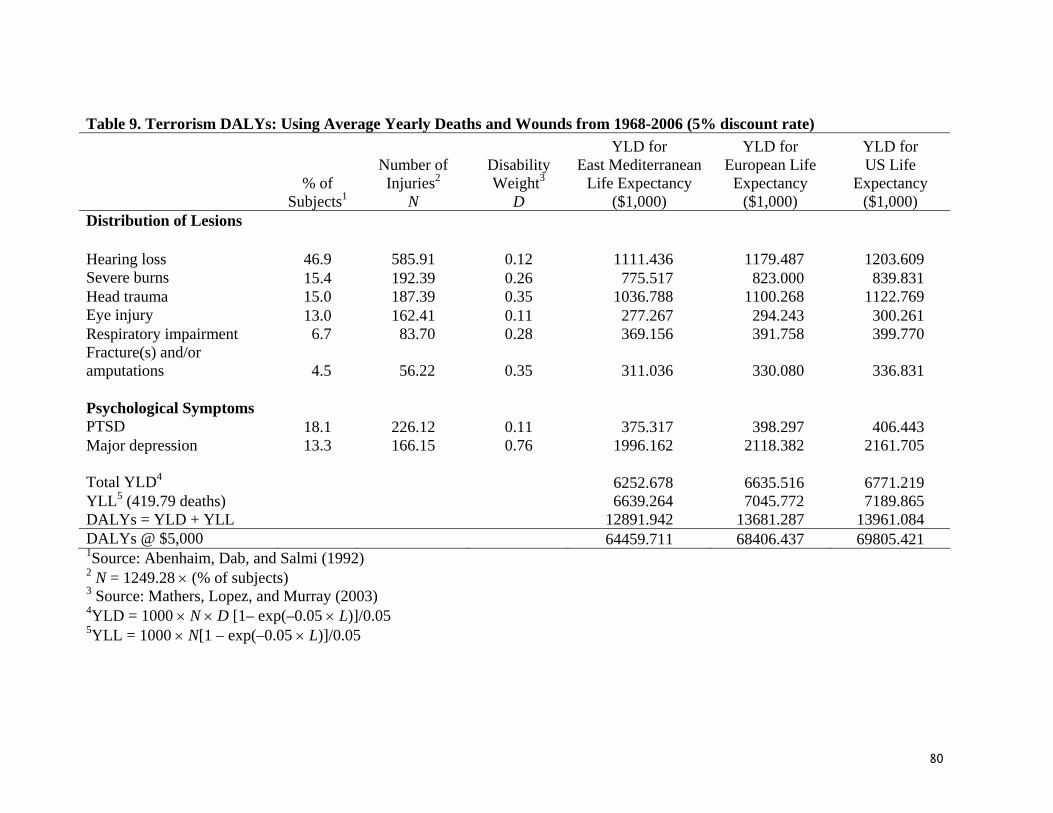
80
Table 9. Terrorism DALYs: Using Average Yearly Deaths and Wounds from 1968-2006 (5% discount rate)
% of Subjects1
Number of Injuries2
N
Disability Weight3
D
YLD for East Mediterranean
Life Expectancy ($1,000)
YLD for European Life
Expectancy ($1,000)
YLD for US Life
Expectancy ($1,000)
Distribution of Lesions Hearing loss 46.9 585.91 0.12 1111.436 1179.487 1203.609 Severe burns 15.4 192.39 0.26 775.517 823.000 839.831 Head trauma 15.0 187.39 0.35 1036.788 1100.268 1122.769 Eye injury 13.0 162.41 0.11 277.267 294.243 300.261 Respiratory impairment 6.7 83.70 0.28 369.156 391.758 399.770 Fracture(s) and/or amputations 4.5 56.22 0.35 311.036 330.080 336.831 Psychological Symptoms PTSD 18.1 226.12 0.11 375.317 398.297 406.443 Major depression 13.3 166.15 0.76 1996.162 2118.382 2161.705 Total YLD4 6252.678 6635.516 6771.219 YLL5 (419.79 deaths) 6639.264 7045.772 7189.865 DALYs = YLD + YLL 12891.942 13681.287 13961.084 DALYs @ $5,000 64459.711 68406.437 69805.421 1Source: Abenhaim, Dab, and Salmi (1992) 2 N = 1249.28 × (% of subjects) 3 Source: Mathers, Lopez, and Murray (2003) 4YLD = 1000 × N × D [1– exp(–0.05 × L)]/0.05 5YLL = 1000 × N[1 – exp(–0.05 × L)]/0.05
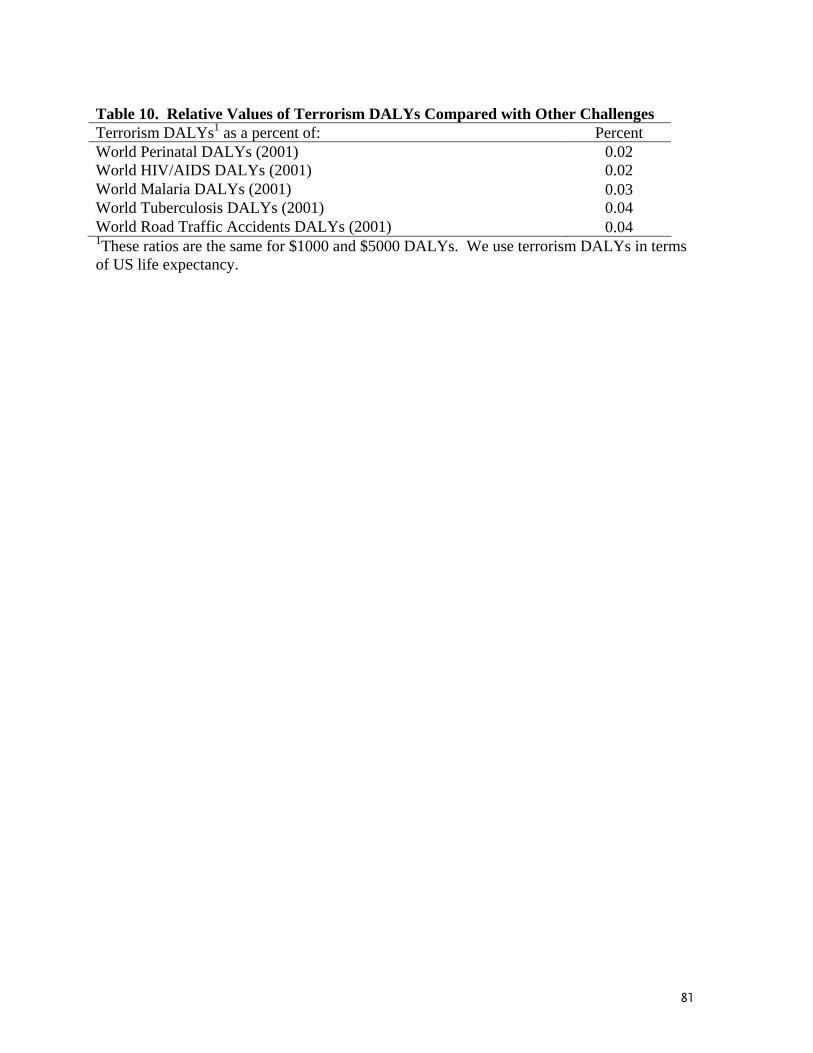
81
Table 10. Relative Values of Terrorism DALYs Compared with Other Challenges Terrorism DALYs1 as a percent of: Percent World Perinatal DALYs (2001) 0.02 World HIV/AIDS DALYs (2001) 0.02 World Malaria DALYs (2001) 0.03 World Tuberculosis DALYs (2001) 0.04 World Road Traffic Accidents DALYs (2001) 0.04 1These ratios are the same for $1000 and $5000 DALYs. We use terrorism DALYs in terms of US life expectancy.
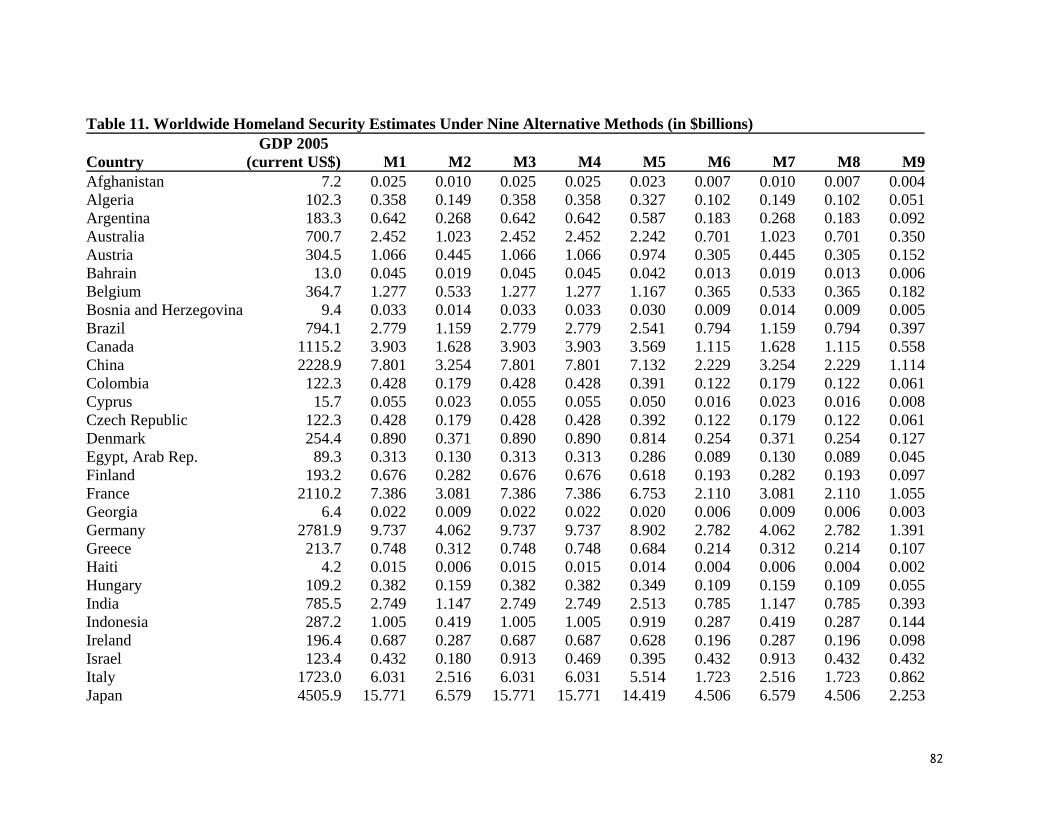
82
Table 11. Worldwide Homeland Security Estimates Under Nine Alternative Methods (in $billions)
Country GDP 2005
(current US$) M1 M2 M3 M4 M5 M6 M7 M8 M9Afghanistan 7.2 0.025 0.010 0.025 0.025 0.023 0.007 0.010 0.007 0.004Algeria 102.3 0.358 0.149 0.358 0.358 0.327 0.102 0.149 0.102 0.051Argentina 183.3 0.642 0.268 0.642 0.642 0.587 0.183 0.268 0.183 0.092Australia 700.7 2.452 1.023 2.452 2.452 2.242 0.701 1.023 0.701 0.350Austria 304.5 1.066 0.445 1.066 1.066 0.974 0.305 0.445 0.305 0.152Bahrain 13.0 0.045 0.019 0.045 0.045 0.042 0.013 0.019 0.013 0.006Belgium 364.7 1.277 0.533 1.277 1.277 1.167 0.365 0.533 0.365 0.182Bosnia and Herzegovina 9.4 0.033 0.014 0.033 0.033 0.030 0.009 0.014 0.009 0.005Brazil 794.1 2.779 1.159 2.779 2.779 2.541 0.794 1.159 0.794 0.397Canada 1115.2 3.903 1.628 3.903 3.903 3.569 1.115 1.628 1.115 0.558China 2228.9 7.801 3.254 7.801 7.801 7.132 2.229 3.254 2.229 1.114Colombia 122.3 0.428 0.179 0.428 0.428 0.391 0.122 0.179 0.122 0.061Cyprus 15.7 0.055 0.023 0.055 0.055 0.050 0.016 0.023 0.016 0.008Czech Republic 122.3 0.428 0.179 0.428 0.428 0.392 0.122 0.179 0.122 0.061Denmark 254.4 0.890 0.371 0.890 0.890 0.814 0.254 0.371 0.254 0.127Egypt, Arab Rep. 89.3 0.313 0.130 0.313 0.313 0.286 0.089 0.130 0.089 0.045Finland 193.2 0.676 0.282 0.676 0.676 0.618 0.193 0.282 0.193 0.097France 2110.2 7.386 3.081 7.386 7.386 6.753 2.110 3.081 2.110 1.055Georgia 6.4 0.022 0.009 0.022 0.022 0.020 0.006 0.009 0.006 0.003Germany 2781.9 9.737 4.062 9.737 9.737 8.902 2.782 4.062 2.782 1.391Greece 213.7 0.748 0.312 0.748 0.748 0.684 0.214 0.312 0.214 0.107Haiti 4.2 0.015 0.006 0.015 0.015 0.014 0.004 0.006 0.004 0.002Hungary 109.2 0.382 0.159 0.382 0.382 0.349 0.109 0.159 0.109 0.055India 785.5 2.749 1.147 2.749 2.749 2.513 0.785 1.147 0.785 0.393Indonesia 287.2 1.005 0.419 1.005 1.005 0.919 0.287 0.419 0.287 0.144Ireland 196.4 0.687 0.287 0.687 0.687 0.628 0.196 0.287 0.196 0.098Israel 123.4 0.432 0.180 0.913 0.469 0.395 0.432 0.913 0.432 0.432Italy 1723.0 6.031 2.516 6.031 6.031 5.514 1.723 2.516 1.723 0.862Japan 4505.9 15.771 6.579 15.771 15.771 14.419 4.506 6.579 4.506 2.253
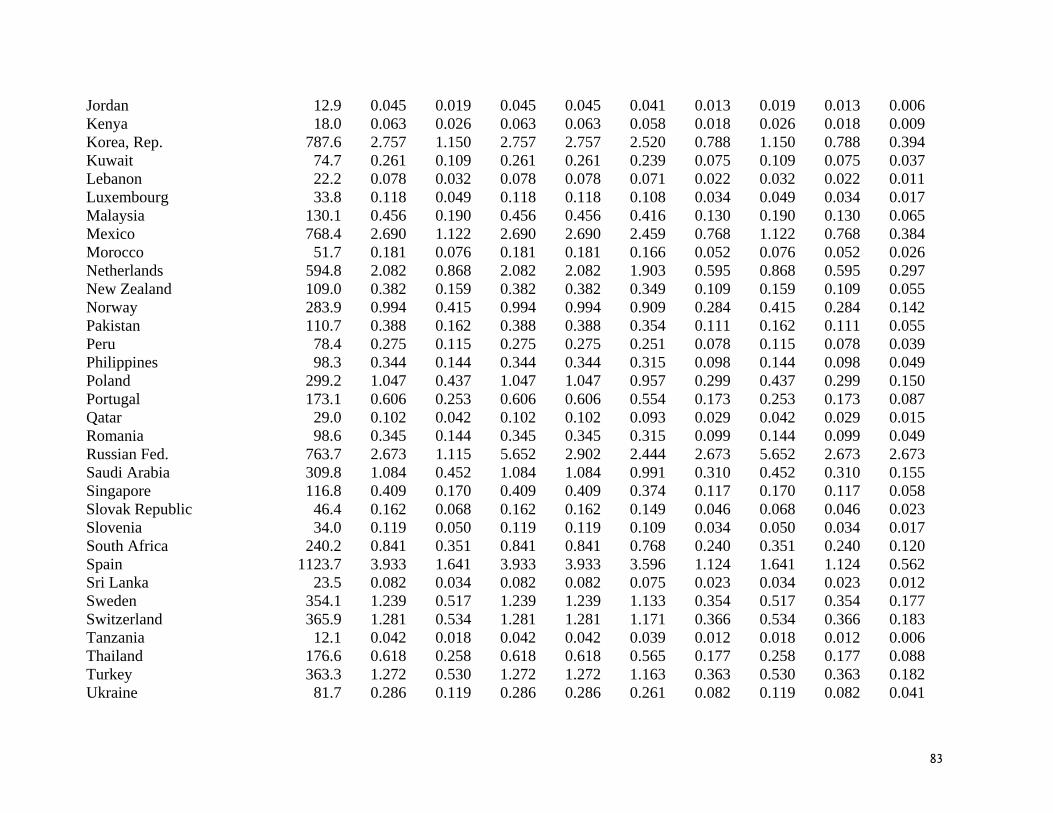
83
Jordan 12.9 0.045 0.019 0.045 0.045 0.041 0.013 0.019 0.013 0.006Kenya 18.0 0.063 0.026 0.063 0.063 0.058 0.018 0.026 0.018 0.009Korea, Rep. 787.6 2.757 1.150 2.757 2.757 2.520 0.788 1.150 0.788 0.394Kuwait 74.7 0.261 0.109 0.261 0.261 0.239 0.075 0.109 0.075 0.037Lebanon 22.2 0.078 0.032 0.078 0.078 0.071 0.022 0.032 0.022 0.011Luxembourg 33.8 0.118 0.049 0.118 0.118 0.108 0.034 0.049 0.034 0.017Malaysia 130.1 0.456 0.190 0.456 0.456 0.416 0.130 0.190 0.130 0.065Mexico 768.4 2.690 1.122 2.690 2.690 2.459 0.768 1.122 0.768 0.384Morocco 51.7 0.181 0.076 0.181 0.181 0.166 0.052 0.076 0.052 0.026Netherlands 594.8 2.082 0.868 2.082 2.082 1.903 0.595 0.868 0.595 0.297New Zealand 109.0 0.382 0.159 0.382 0.382 0.349 0.109 0.159 0.109 0.055Norway 283.9 0.994 0.415 0.994 0.994 0.909 0.284 0.415 0.284 0.142Pakistan 110.7 0.388 0.162 0.388 0.388 0.354 0.111 0.162 0.111 0.055Peru 78.4 0.275 0.115 0.275 0.275 0.251 0.078 0.115 0.078 0.039Philippines 98.3 0.344 0.144 0.344 0.344 0.315 0.098 0.144 0.098 0.049Poland 299.2 1.047 0.437 1.047 1.047 0.957 0.299 0.437 0.299 0.150Portugal 173.1 0.606 0.253 0.606 0.606 0.554 0.173 0.253 0.173 0.087Qatar 29.0 0.102 0.042 0.102 0.102 0.093 0.029 0.042 0.029 0.015Romania 98.6 0.345 0.144 0.345 0.345 0.315 0.099 0.144 0.099 0.049Russian Fed. 763.7 2.673 1.115 5.652 2.902 2.444 2.673 5.652 2.673 2.673Saudi Arabia 309.8 1.084 0.452 1.084 1.084 0.991 0.310 0.452 0.310 0.155Singapore 116.8 0.409 0.170 0.409 0.409 0.374 0.117 0.170 0.117 0.058Slovak Republic 46.4 0.162 0.068 0.162 0.162 0.149 0.046 0.068 0.046 0.023Slovenia 34.0 0.119 0.050 0.119 0.119 0.109 0.034 0.050 0.034 0.017South Africa 240.2 0.841 0.351 0.841 0.841 0.768 0.240 0.351 0.240 0.120Spain 1123.7 3.933 1.641 3.933 3.933 3.596 1.124 1.641 1.124 0.562Sri Lanka 23.5 0.082 0.034 0.082 0.082 0.075 0.023 0.034 0.023 0.012Sweden 354.1 1.239 0.517 1.239 1.239 1.133 0.354 0.517 0.354 0.177Switzerland 365.9 1.281 0.534 1.281 1.281 1.171 0.366 0.534 0.366 0.183Tanzania 12.1 0.042 0.018 0.042 0.042 0.039 0.012 0.018 0.012 0.006Thailand 176.6 0.618 0.258 0.618 0.618 0.565 0.177 0.258 0.177 0.088Turkey 363.3 1.272 0.530 1.272 1.272 1.163 0.363 0.530 0.363 0.182Ukraine 81.7 0.286 0.119 0.286 0.286 0.261 0.082 0.119 0.082 0.041
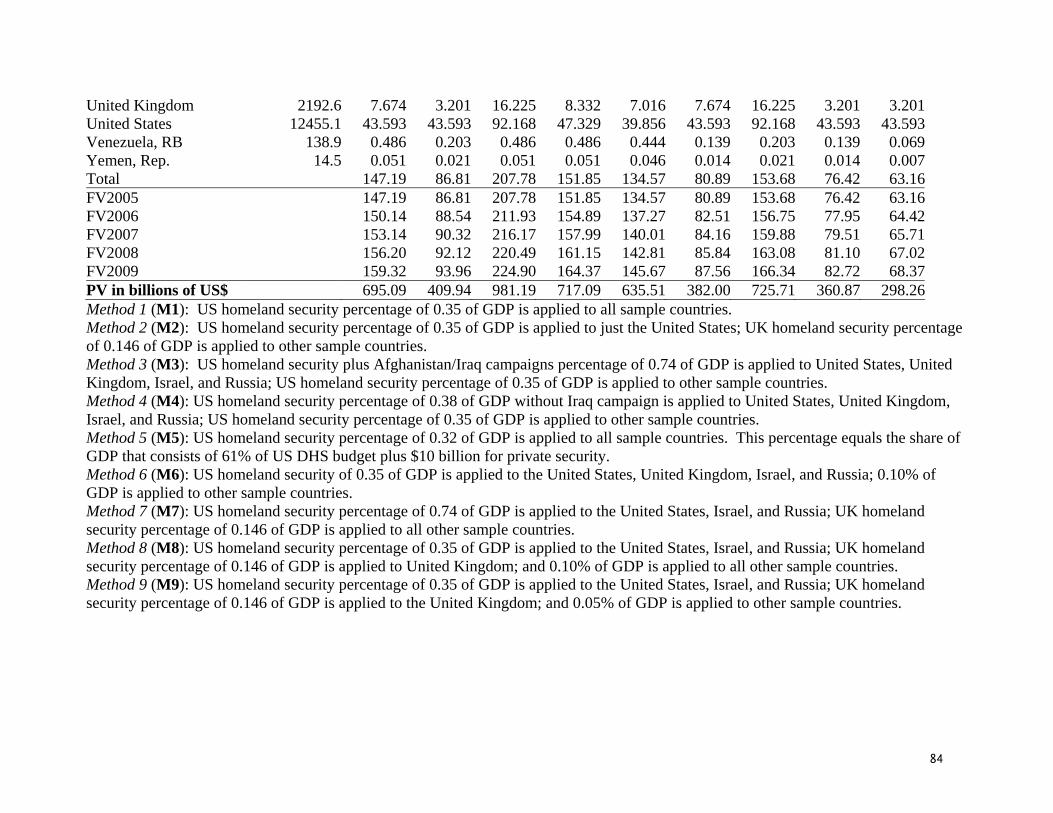
84
United Kingdom 2192.6 7.674 3.201 16.225 8.332 7.016 7.674 16.225 3.201 3.201United States 12455.1 43.593 43.593 92.168 47.329 39.856 43.593 92.168 43.593 43.593Venezuela, RB 138.9 0.486 0.203 0.486 0.486 0.444 0.139 0.203 0.139 0.069Yemen, Rep. 14.5 0.051 0.021 0.051 0.051 0.046 0.014 0.021 0.014 0.007Total 147.19 86.81 207.78 151.85 134.57 80.89 153.68 76.42 63.16FV2005 147.19 86.81 207.78 151.85 134.57 80.89 153.68 76.42 63.16FV2006 150.14 88.54 211.93 154.89 137.27 82.51 156.75 77.95 64.42FV2007 153.14 90.32 216.17 157.99 140.01 84.16 159.88 79.51 65.71FV2008 156.20 92.12 220.49 161.15 142.81 85.84 163.08 81.10 67.02FV2009 159.32 93.96 224.90 164.37 145.67 87.56 166.34 82.72 68.37PV in billions of US$ 695.09 409.94 981.19 717.09 635.51 382.00 725.71 360.87 298.26Method 1 (M1): US homeland security percentage of 0.35 of GDP is applied to all sample countries. Method 2 (M2): US homeland security percentage of 0.35 of GDP is applied to just the United States; UK homeland security percentage of 0.146 of GDP is applied to other sample countries. Method 3 (M3): US homeland security plus Afghanistan/Iraq campaigns percentage of 0.74 of GDP is applied to United States, United Kingdom, Israel, and Russia; US homeland security percentage of 0.35 of GDP is applied to other sample countries. Method 4 (M4): US homeland security percentage of 0.38 of GDP without Iraq campaign is applied to United States, United Kingdom, Israel, and Russia; US homeland security percentage of 0.35 of GDP is applied to other sample countries. Method 5 (M5): US homeland security percentage of 0.32 of GDP is applied to all sample countries. This percentage equals the share of GDP that consists of 61% of US DHS budget plus $10 billion for private security. Method 6 (M6): US homeland security of 0.35 of GDP is applied to the United States, United Kingdom, Israel, and Russia; 0.10% of GDP is applied to other sample countries. Method 7 (M7): US homeland security percentage of 0.74 of GDP is applied to the United States, Israel, and Russia; UK homeland security percentage of 0.146 of GDP is applied to all other sample countries. Method 8 (M8): US homeland security percentage of 0.35 of GDP is applied to the United States, Israel, and Russia; UK homeland security percentage of 0.146 of GDP is applied to United Kingdom; and 0.10% of GDP is applied to all other sample countries. Method 9 (M9): US homeland security percentage of 0.35 of GDP is applied to the United States, Israel, and Russia; UK homeland security percentage of 0.146 of GDP is applied to the United Kingdom; and 0.05% of GDP is applied to other sample countries.
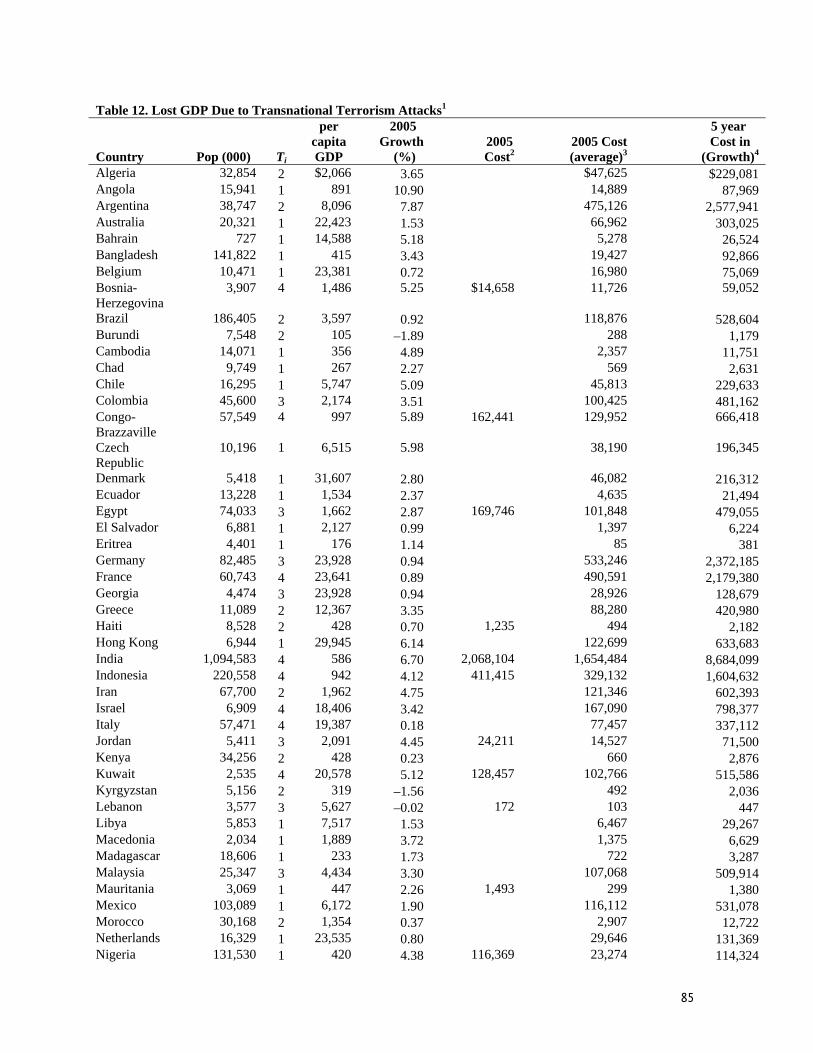
85
Table 12. Lost GDP Due to Transnational Terrorism Attacks1
Country Pop (000) Ti
per capita GDP
2005 Growth
(%) 2005
Cost2 2005 Cost (average)3
5 year Cost in
(Growth)4 Algeria 32,854 2 $2,066 3.65 $47,625 $229,081 Angola 15,941 1 891 10.90 14,889 87,969 Argentina 38,747 2 8,096 7.87 475,126 2,577,941 Australia 20,321 1 22,423 1.53 66,962 303,025 Bahrain 727 1 14,588 5.18 5,278 26,524 Bangladesh 141,822 1 415 3.43 19,427 92,866 Belgium 10,471 1 23,381 0.72 16,980 75,069 Bosnia-Herzegovina
3,907 4 1,486 5.25 $14,658 11,726 59,052
Brazil 186,405 2 3,597 0.92 118,876 528,604 Burundi 7,548 2 105 –1.89 288 1,179 Cambodia 14,071 1 356 4.89 2,357 11,751 Chad 9,749 1 267 2.27 569 2,631 Chile 16,295 1 5,747 5.09 45,813 229,633 Colombia 45,600 3 2,174 3.51 100,425 481,162 Congo-Brazzaville
57,549 4 997 5.89 162,441 129,952 666,418
Czech Republic
10,196 1 6,515 5.98 38,190 196,345
Denmark 5,418 1 31,607 2.80 46,082 216,312 Ecuador 13,228 1 1,534 2.37 4,635 21,494 Egypt 74,033 3 1,662 2.87 169,746 101,848 479,055 El Salvador 6,881 1 2,127 0.99 1,397 6,224 Eritrea 4,401 1 176 1.14 85 381 Germany 82,485 3 23,928 0.94 533,246 2,372,185 France 60,743 4 23,641 0.89 490,591 2,179,380 Georgia 4,474 3 23,928 0.94 28,926 128,679 Greece 11,089 2 12,367 3.35 88,280 420,980 Haiti 8,528 2 428 0.70 1,235 494 2,182 Hong Kong 6,944 1 29,945 6.14 122,699 633,683 India 1,094,583 4 586 6.70 2,068,104 1,654,484 8,684,099 Indonesia 220,558 4 942 4.12 411,415 329,132 1,604,632 Iran 67,700 2 1,962 4.75 121,346 602,393 Israel 6,909 4 18,406 3.42 167,090 798,377 Italy 57,471 4 19,387 0.18 77,457 337,112 Jordan 5,411 3 2,091 4.45 24,211 14,527 71,500 Kenya 34,256 2 428 0.23 660 2,876 Kuwait 2,535 4 20,578 5.12 128,457 102,766 515,586 Kyrgyzstan 5,156 2 319 –1.56 492 2,036 Lebanon 3,577 3 5,627 –0.02 172 103 447 Libya 5,853 1 7,517 1.53 6,467 29,267 Macedonia 2,034 1 1,889 3.72 1,375 6,629 Madagascar 18,606 1 233 1.73 722 3,287 Malaysia 25,347 3 4,434 3.30 107,068 509,914 Mauritania 3,069 1 447 2.26 1,493 299 1,380 Mexico 103,089 1 6,172 1.90 116,112 531,078 Morocco 30,168 2 1,354 0.37 2,907 12,722 Netherlands 16,329 1 23,535 0.80 29,646 131,369 Nigeria 131,530 1 420 4.38 116,369 23,274 114,324
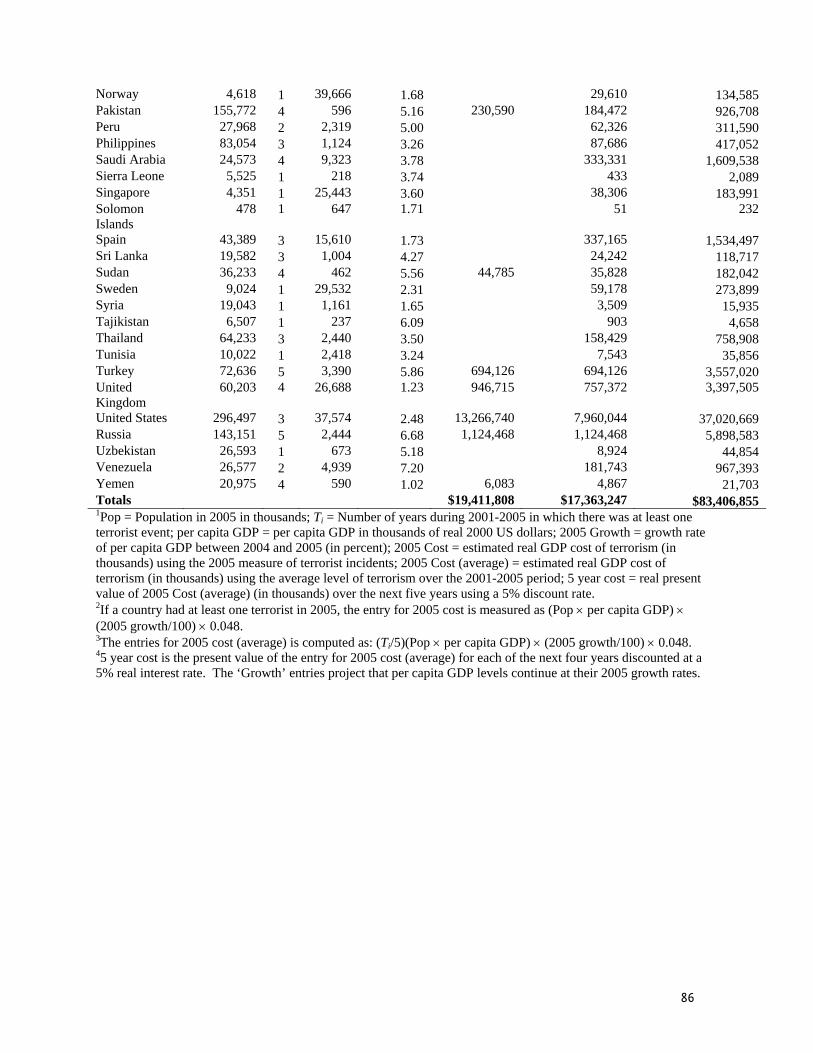
86
Norway 4,618 1 39,666 1.68 29,610 134,585 Pakistan 155,772 4 596 5.16 230,590 184,472 926,708 Peru 27,968 2 2,319 5.00 62,326 311,590 Philippines 83,054 3 1,124 3.26 87,686 417,052 Saudi Arabia 24,573 4 9,323 3.78 333,331 1,609,538 Sierra Leone 5,525 1 218 3.74 433 2,089 Singapore 4,351 1 25,443 3.60 38,306 183,991 Solomon Islands
478 1 647 1.71 51 232
Spain 43,389 3 15,610 1.73 337,165 1,534,497 Sri Lanka 19,582 3 1,004 4.27 24,242 118,717 Sudan 36,233 4 462 5.56 44,785 35,828 182,042 Sweden 9,024 1 29,532 2.31 59,178 273,899 Syria 19,043 1 1,161 1.65 3,509 15,935 Tajikistan 6,507 1 237 6.09 903 4,658 Thailand 64,233 3 2,440 3.50 158,429 758,908 Tunisia 10,022 1 2,418 3.24 7,543 35,856 Turkey 72,636 5 3,390 5.86 694,126 694,126 3,557,020 United Kingdom
60,203 4 26,688 1.23 946,715 757,372 3,397,505
United States 296,497 3 37,574 2.48 13,266,740 7,960,044 37,020,669 Russia 143,151 5 2,444 6.68 1,124,468 1,124,468 5,898,583 Uzbekistan 26,593 1 673 5.18 8,924 44,854 Venezuela 26,577 2 4,939 7.20 181,743 967,393 Yemen 20,975 4 590 1.02 6,083 4,867 21,703 Totals $19,411,808 $17,363,247 $83,406,855 1Pop = Population in 2005 in thousands; Ti = Number of years during 2001-2005 in which there was at least one terrorist event; per capita GDP = per capita GDP in thousands of real 2000 US dollars; 2005 Growth = growth rate of per capita GDP between 2004 and 2005 (in percent); 2005 Cost = estimated real GDP cost of terrorism (in thousands) using the 2005 measure of terrorist incidents; 2005 Cost (average) = estimated real GDP cost of terrorism (in thousands) using the average level of terrorism over the 2001-2005 period; 5 year cost = real present value of 2005 Cost (average) (in thousands) over the next five years using a 5% discount rate. 2If a country had at least one terrorist in 2005, the entry for 2005 cost is measured as (Pop × per capita GDP) × (2005 growth/100) × 0.048. 3The entries for 2005 cost (average) is computed as: (Ti/5)(Pop × per capita GDP) × (2005 growth/100) × 0.048. 45 year cost is the present value of the entry for 2005 cost (average) for each of the next four years discounted at a 5% real interest rate. The ‘Growth’ entries project that per capita GDP levels continue at their 2005 growth rates.
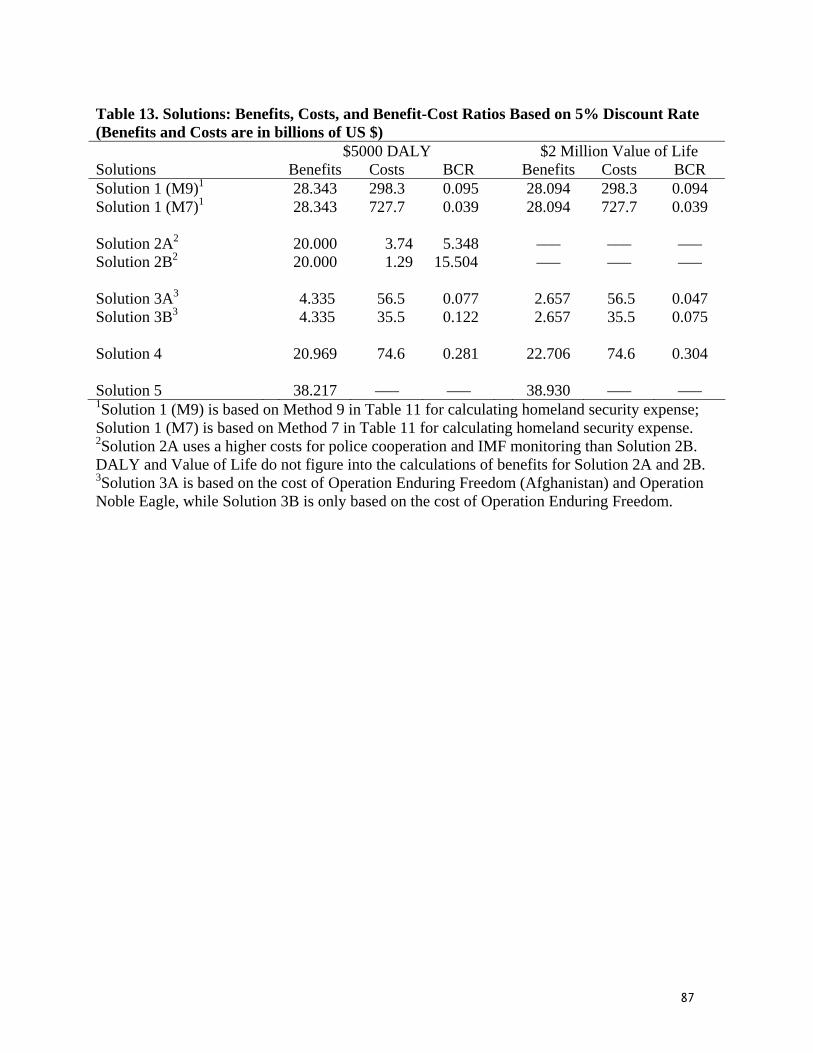
87
Table 13. Solutions: Benefits, Costs, and Benefit-Cost Ratios Based on 5% Discount Rate (Benefits and Costs are in billions of US $) $5000 DALY $2 Million Value of Life Solutions Benefits Costs BCR Benefits Costs BCR Solution 1 (M9)1 28.343 298.3 0.095 28.094 298.3 0.094 Solution 1 (M7)1 28.343 727.7 0.039 28.094 727.7 0.039 Solution 2A2 20.000 3.74 5.348 ––– ––– ––– Solution 2B2 20.000 1.29 15.504 ––– ––– ––– Solution 3A3 4.335 56.5 0.077 2.657 56.5 0.047 Solution 3B3 4.335 35.5 0.122 2.657 35.5 0.075 Solution 4 20.969 74.6 0.281 22.706 74.6 0.304 Solution 5 38.217 ––– ––– 38.930 ––– ––– 1Solution 1 (M9) is based on Method 9 in Table 11 for calculating homeland security expense; Solution 1 (M7) is based on Method 7 in Table 11 for calculating homeland security expense. 2Solution 2A uses a higher costs for police cooperation and IMF monitoring than Solution 2B. DALY and Value of Life do not figure into the calculations of benefits for Solution 2A and 2B. 3Solution 3A is based on the cost of Operation Enduring Freedom (Afghanistan) and Operation Noble Eagle, while Solution 3B is only based on the cost of Operation Enduring Freedom.
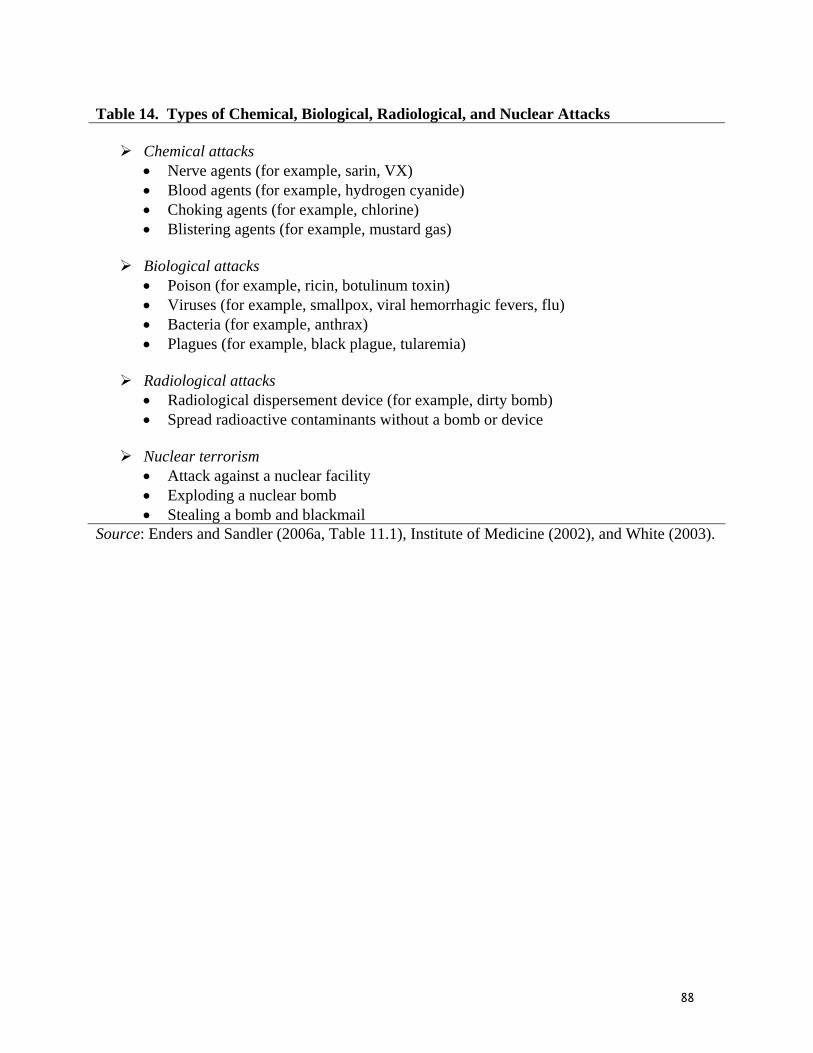
88
Table 14. Types of Chemical, Biological, Radiological, and Nuclear Attacks
Chemical attacks • Nerve agents (for example, sarin, VX) • Blood agents (for example, hydrogen cyanide) • Choking agents (for example, chlorine) • Blistering agents (for example, mustard gas)
Biological attacks • Poison (for example, ricin, botulinum toxin) • Viruses (for example, smallpox, viral hemorrhagic fevers, flu) • Bacteria (for example, anthrax) • Plagues (for example, black plague, tularemia)
Radiological attacks • Radiological dispersement device (for example, dirty bomb) • Spread radioactive contaminants without a bomb or device
Nuclear terrorism • Attack against a nuclear facility • Exploding a nuclear bomb • Stealing a bomb and blackmail
Source: Enders and Sandler (2006a, Table 11.1), Institute of Medicine (2002), and White (2003).

89
Appendix
The following tables relate to the use of a 3% discount rate when computing the cost of
homeland security (Table 11A) and lost GDP due to transnational terrorism (Table 12A). Table
13A replicates Table 13 but based on a 3% discount rate.
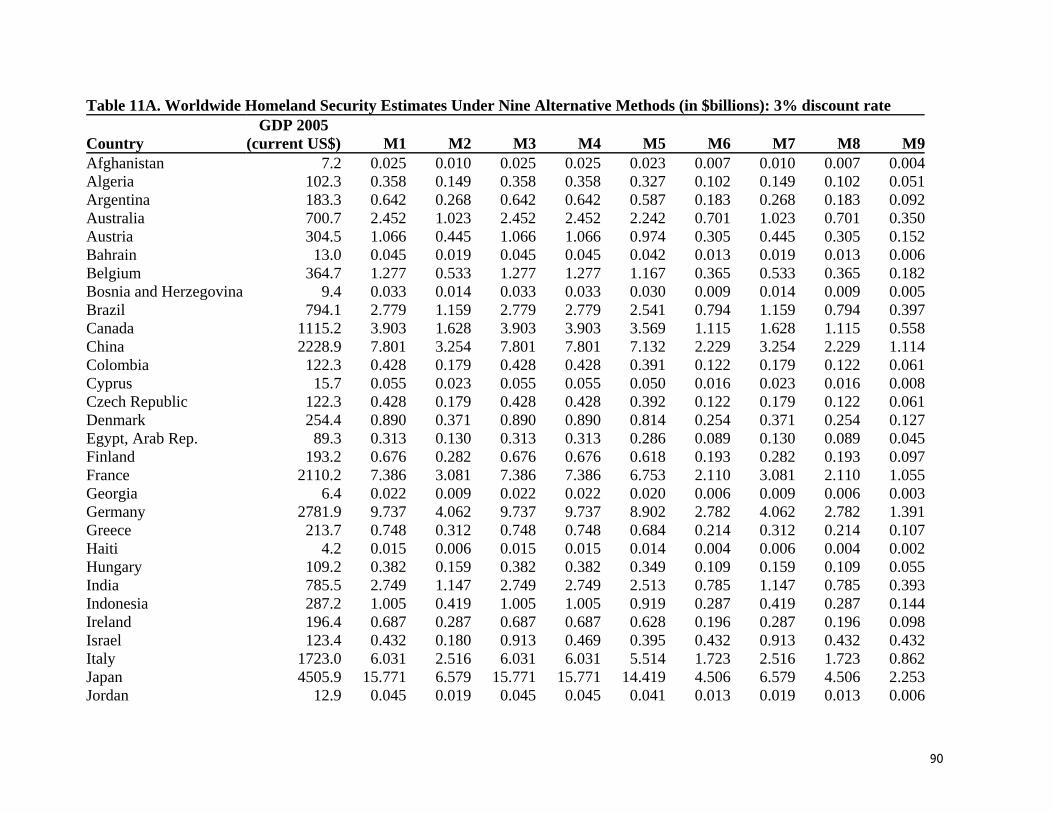
90
Table 11A. Worldwide Homeland Security Estimates Under Nine Alternative Methods (in $billions): 3% discount rate
Country GDP 2005
(current US$) M1 M2 M3 M4 M5 M6 M7 M8 M9Afghanistan 7.2 0.025 0.010 0.025 0.025 0.023 0.007 0.010 0.007 0.004Algeria 102.3 0.358 0.149 0.358 0.358 0.327 0.102 0.149 0.102 0.051Argentina 183.3 0.642 0.268 0.642 0.642 0.587 0.183 0.268 0.183 0.092Australia 700.7 2.452 1.023 2.452 2.452 2.242 0.701 1.023 0.701 0.350Austria 304.5 1.066 0.445 1.066 1.066 0.974 0.305 0.445 0.305 0.152Bahrain 13.0 0.045 0.019 0.045 0.045 0.042 0.013 0.019 0.013 0.006Belgium 364.7 1.277 0.533 1.277 1.277 1.167 0.365 0.533 0.365 0.182Bosnia and Herzegovina 9.4 0.033 0.014 0.033 0.033 0.030 0.009 0.014 0.009 0.005Brazil 794.1 2.779 1.159 2.779 2.779 2.541 0.794 1.159 0.794 0.397Canada 1115.2 3.903 1.628 3.903 3.903 3.569 1.115 1.628 1.115 0.558China 2228.9 7.801 3.254 7.801 7.801 7.132 2.229 3.254 2.229 1.114Colombia 122.3 0.428 0.179 0.428 0.428 0.391 0.122 0.179 0.122 0.061Cyprus 15.7 0.055 0.023 0.055 0.055 0.050 0.016 0.023 0.016 0.008Czech Republic 122.3 0.428 0.179 0.428 0.428 0.392 0.122 0.179 0.122 0.061Denmark 254.4 0.890 0.371 0.890 0.890 0.814 0.254 0.371 0.254 0.127Egypt, Arab Rep. 89.3 0.313 0.130 0.313 0.313 0.286 0.089 0.130 0.089 0.045Finland 193.2 0.676 0.282 0.676 0.676 0.618 0.193 0.282 0.193 0.097France 2110.2 7.386 3.081 7.386 7.386 6.753 2.110 3.081 2.110 1.055Georgia 6.4 0.022 0.009 0.022 0.022 0.020 0.006 0.009 0.006 0.003Germany 2781.9 9.737 4.062 9.737 9.737 8.902 2.782 4.062 2.782 1.391Greece 213.7 0.748 0.312 0.748 0.748 0.684 0.214 0.312 0.214 0.107Haiti 4.2 0.015 0.006 0.015 0.015 0.014 0.004 0.006 0.004 0.002Hungary 109.2 0.382 0.159 0.382 0.382 0.349 0.109 0.159 0.109 0.055India 785.5 2.749 1.147 2.749 2.749 2.513 0.785 1.147 0.785 0.393Indonesia 287.2 1.005 0.419 1.005 1.005 0.919 0.287 0.419 0.287 0.144Ireland 196.4 0.687 0.287 0.687 0.687 0.628 0.196 0.287 0.196 0.098Israel 123.4 0.432 0.180 0.913 0.469 0.395 0.432 0.913 0.432 0.432Italy 1723.0 6.031 2.516 6.031 6.031 5.514 1.723 2.516 1.723 0.862Japan 4505.9 15.771 6.579 15.771 15.771 14.419 4.506 6.579 4.506 2.253Jordan 12.9 0.045 0.019 0.045 0.045 0.041 0.013 0.019 0.013 0.006
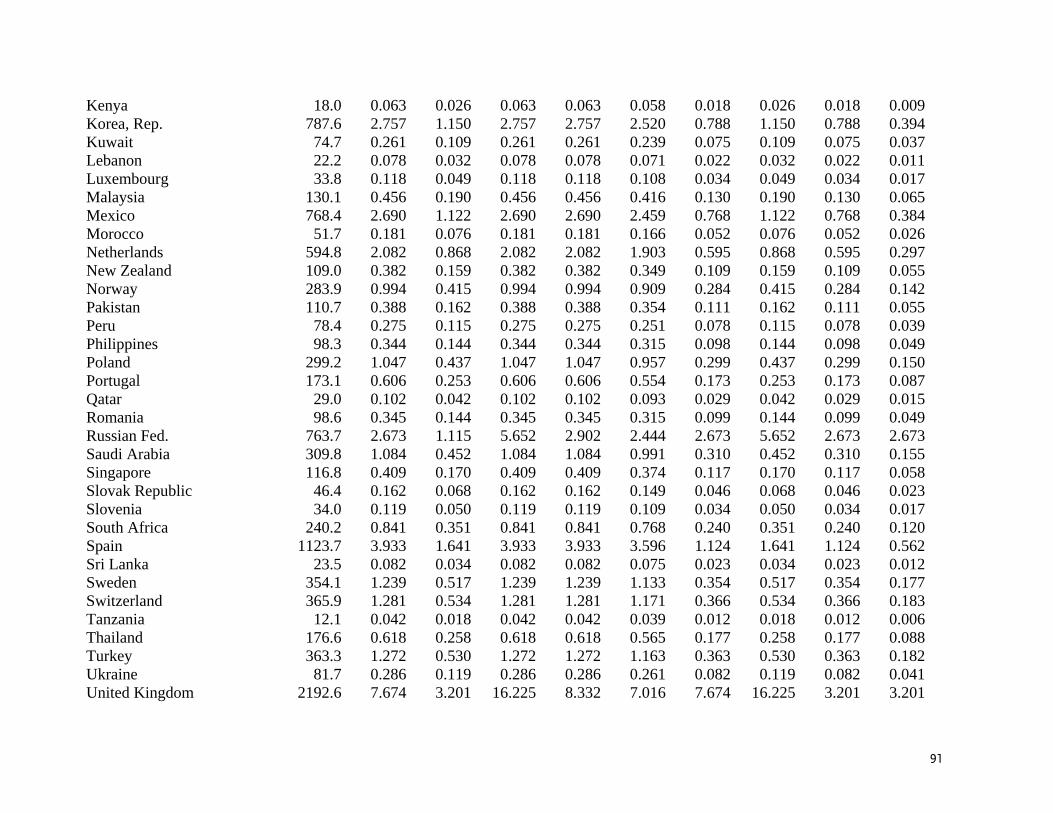
91
Kenya 18.0 0.063 0.026 0.063 0.063 0.058 0.018 0.026 0.018 0.009Korea, Rep. 787.6 2.757 1.150 2.757 2.757 2.520 0.788 1.150 0.788 0.394Kuwait 74.7 0.261 0.109 0.261 0.261 0.239 0.075 0.109 0.075 0.037Lebanon 22.2 0.078 0.032 0.078 0.078 0.071 0.022 0.032 0.022 0.011Luxembourg 33.8 0.118 0.049 0.118 0.118 0.108 0.034 0.049 0.034 0.017Malaysia 130.1 0.456 0.190 0.456 0.456 0.416 0.130 0.190 0.130 0.065Mexico 768.4 2.690 1.122 2.690 2.690 2.459 0.768 1.122 0.768 0.384Morocco 51.7 0.181 0.076 0.181 0.181 0.166 0.052 0.076 0.052 0.026Netherlands 594.8 2.082 0.868 2.082 2.082 1.903 0.595 0.868 0.595 0.297New Zealand 109.0 0.382 0.159 0.382 0.382 0.349 0.109 0.159 0.109 0.055Norway 283.9 0.994 0.415 0.994 0.994 0.909 0.284 0.415 0.284 0.142Pakistan 110.7 0.388 0.162 0.388 0.388 0.354 0.111 0.162 0.111 0.055Peru 78.4 0.275 0.115 0.275 0.275 0.251 0.078 0.115 0.078 0.039Philippines 98.3 0.344 0.144 0.344 0.344 0.315 0.098 0.144 0.098 0.049Poland 299.2 1.047 0.437 1.047 1.047 0.957 0.299 0.437 0.299 0.150Portugal 173.1 0.606 0.253 0.606 0.606 0.554 0.173 0.253 0.173 0.087Qatar 29.0 0.102 0.042 0.102 0.102 0.093 0.029 0.042 0.029 0.015Romania 98.6 0.345 0.144 0.345 0.345 0.315 0.099 0.144 0.099 0.049Russian Fed. 763.7 2.673 1.115 5.652 2.902 2.444 2.673 5.652 2.673 2.673Saudi Arabia 309.8 1.084 0.452 1.084 1.084 0.991 0.310 0.452 0.310 0.155Singapore 116.8 0.409 0.170 0.409 0.409 0.374 0.117 0.170 0.117 0.058Slovak Republic 46.4 0.162 0.068 0.162 0.162 0.149 0.046 0.068 0.046 0.023Slovenia 34.0 0.119 0.050 0.119 0.119 0.109 0.034 0.050 0.034 0.017South Africa 240.2 0.841 0.351 0.841 0.841 0.768 0.240 0.351 0.240 0.120Spain 1123.7 3.933 1.641 3.933 3.933 3.596 1.124 1.641 1.124 0.562Sri Lanka 23.5 0.082 0.034 0.082 0.082 0.075 0.023 0.034 0.023 0.012Sweden 354.1 1.239 0.517 1.239 1.239 1.133 0.354 0.517 0.354 0.177Switzerland 365.9 1.281 0.534 1.281 1.281 1.171 0.366 0.534 0.366 0.183Tanzania 12.1 0.042 0.018 0.042 0.042 0.039 0.012 0.018 0.012 0.006Thailand 176.6 0.618 0.258 0.618 0.618 0.565 0.177 0.258 0.177 0.088Turkey 363.3 1.272 0.530 1.272 1.272 1.163 0.363 0.530 0.363 0.182Ukraine 81.7 0.286 0.119 0.286 0.286 0.261 0.082 0.119 0.082 0.041United Kingdom 2192.6 7.674 3.201 16.225 8.332 7.016 7.674 16.225 3.201 3.201
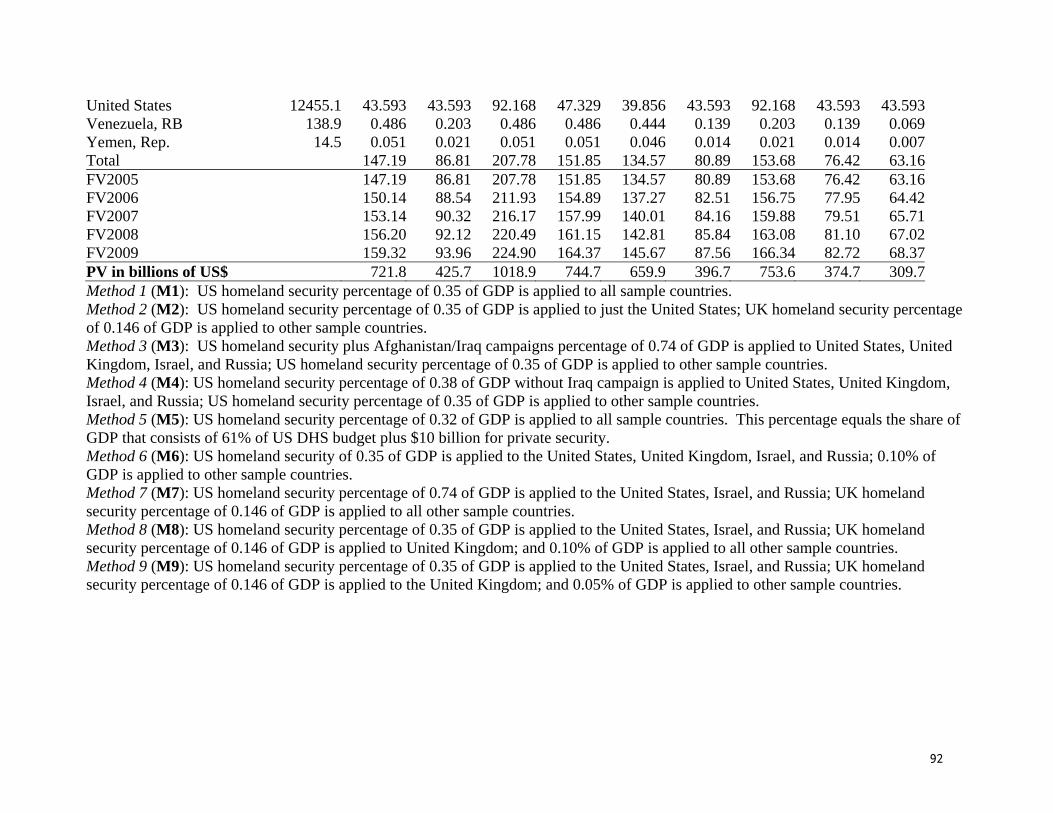
92
United States 12455.1 43.593 43.593 92.168 47.329 39.856 43.593 92.168 43.593 43.593Venezuela, RB 138.9 0.486 0.203 0.486 0.486 0.444 0.139 0.203 0.139 0.069Yemen, Rep. 14.5 0.051 0.021 0.051 0.051 0.046 0.014 0.021 0.014 0.007Total 147.19 86.81 207.78 151.85 134.57 80.89 153.68 76.42 63.16FV2005 147.19 86.81 207.78 151.85 134.57 80.89 153.68 76.42 63.16FV2006 150.14 88.54 211.93 154.89 137.27 82.51 156.75 77.95 64.42FV2007 153.14 90.32 216.17 157.99 140.01 84.16 159.88 79.51 65.71FV2008 156.20 92.12 220.49 161.15 142.81 85.84 163.08 81.10 67.02FV2009 159.32 93.96 224.90 164.37 145.67 87.56 166.34 82.72 68.37PV in billions of US$ 721.8 425.7 1018.9 744.7 659.9 396.7 753.6 374.7 309.7Method 1 (M1): US homeland security percentage of 0.35 of GDP is applied to all sample countries. Method 2 (M2): US homeland security percentage of 0.35 of GDP is applied to just the United States; UK homeland security percentage of 0.146 of GDP is applied to other sample countries. Method 3 (M3): US homeland security plus Afghanistan/Iraq campaigns percentage of 0.74 of GDP is applied to United States, United Kingdom, Israel, and Russia; US homeland security percentage of 0.35 of GDP is applied to other sample countries. Method 4 (M4): US homeland security percentage of 0.38 of GDP without Iraq campaign is applied to United States, United Kingdom, Israel, and Russia; US homeland security percentage of 0.35 of GDP is applied to other sample countries. Method 5 (M5): US homeland security percentage of 0.32 of GDP is applied to all sample countries. This percentage equals the share of GDP that consists of 61% of US DHS budget plus $10 billion for private security. Method 6 (M6): US homeland security of 0.35 of GDP is applied to the United States, United Kingdom, Israel, and Russia; 0.10% of GDP is applied to other sample countries. Method 7 (M7): US homeland security percentage of 0.74 of GDP is applied to the United States, Israel, and Russia; UK homeland security percentage of 0.146 of GDP is applied to all other sample countries. Method 8 (M8): US homeland security percentage of 0.35 of GDP is applied to the United States, Israel, and Russia; UK homeland security percentage of 0.146 of GDP is applied to United Kingdom; and 0.10% of GDP is applied to all other sample countries. Method 9 (M9): US homeland security percentage of 0.35 of GDP is applied to the United States, Israel, and Russia; UK homeland security percentage of 0.146 of GDP is applied to the United Kingdom; and 0.05% of GDP is applied to other sample countries.
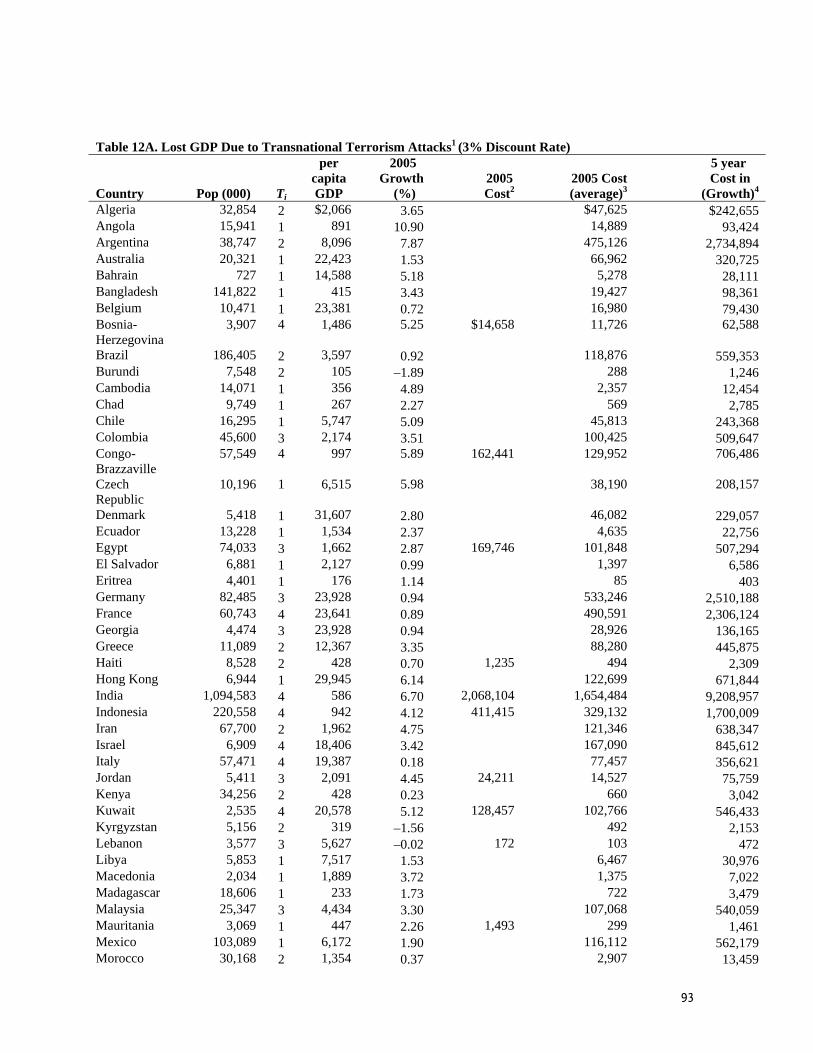
93
Table 12A. Lost GDP Due to Transnational Terrorism Attacks1 (3% Discount Rate)
Country Pop (000) Ti
per capita GDP
2005 Growth
(%) 2005
Cost2 2005 Cost (average)3
5 year Cost in
(Growth)4 Algeria 32,854 2 $2,066 3.65 $47,625 $242,655 Angola 15,941 1 891 10.90 14,889 93,424 Argentina 38,747 2 8,096 7.87 475,126 2,734,894 Australia 20,321 1 22,423 1.53 66,962 320,725 Bahrain 727 1 14,588 5.18 5,278 28,111 Bangladesh 141,822 1 415 3.43 19,427 98,361 Belgium 10,471 1 23,381 0.72 16,980 79,430 Bosnia-Herzegovina
3,907 4 1,486 5.25 $14,658 11,726 62,588
Brazil 186,405 2 3,597 0.92 118,876 559,353 Burundi 7,548 2 105 –1.89 288 1,246 Cambodia 14,071 1 356 4.89 2,357 12,454 Chad 9,749 1 267 2.27 569 2,785 Chile 16,295 1 5,747 5.09 45,813 243,368 Colombia 45,600 3 2,174 3.51 100,425 509,647 Congo-Brazzaville
57,549 4 997 5.89 162,441 129,952 706,486
Czech Republic
10,196 1 6,515 5.98 38,190 208,157
Denmark 5,418 1 31,607 2.80 46,082 229,057 Ecuador 13,228 1 1,534 2.37 4,635 22,756 Egypt 74,033 3 1,662 2.87 169,746 101,848 507,294 El Salvador 6,881 1 2,127 0.99 1,397 6,586 Eritrea 4,401 1 176 1.14 85 403 Germany 82,485 3 23,928 0.94 533,246 2,510,188 France 60,743 4 23,641 0.89 490,591 2,306,124 Georgia 4,474 3 23,928 0.94 28,926 136,165 Greece 11,089 2 12,367 3.35 88,280 445,875 Haiti 8,528 2 428 0.70 1,235 494 2,309 Hong Kong 6,944 1 29,945 6.14 122,699 671,844 India 1,094,583 4 586 6.70 2,068,104 1,654,484 9,208,957 Indonesia 220,558 4 942 4.12 411,415 329,132 1,700,009 Iran 67,700 2 1,962 4.75 121,346 638,347 Israel 6,909 4 18,406 3.42 167,090 845,612 Italy 57,471 4 19,387 0.18 77,457 356,621 Jordan 5,411 3 2,091 4.45 24,211 14,527 75,759 Kenya 34,256 2 428 0.23 660 3,042 Kuwait 2,535 4 20,578 5.12 128,457 102,766 546,433 Kyrgyzstan 5,156 2 319 –1.56 492 2,153 Lebanon 3,577 3 5,627 –0.02 172 103 472 Libya 5,853 1 7,517 1.53 6,467 30,976 Macedonia 2,034 1 1,889 3.72 1,375 7,022 Madagascar 18,606 1 233 1.73 722 3,479 Malaysia 25,347 3 4,434 3.30 107,068 540,059 Mauritania 3,069 1 447 2.26 1,493 299 1,461 Mexico 103,089 1 6,172 1.90 116,112 562,179 Morocco 30,168 2 1,354 0.37 2,907 13,459
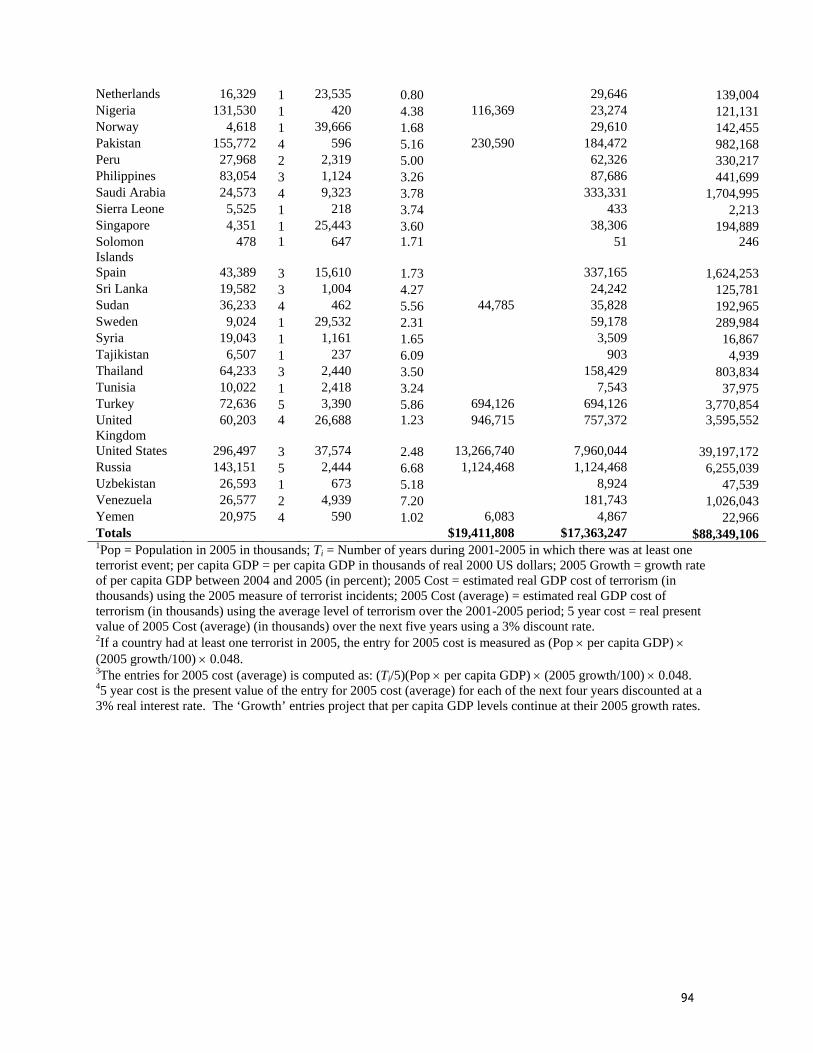
94
Netherlands 16,329 1 23,535 0.80 29,646 139,004 Nigeria 131,530 1 420 4.38 116,369 23,274 121,131 Norway 4,618 1 39,666 1.68 29,610 142,455 Pakistan 155,772 4 596 5.16 230,590 184,472 982,168 Peru 27,968 2 2,319 5.00 62,326 330,217 Philippines 83,054 3 1,124 3.26 87,686 441,699 Saudi Arabia 24,573 4 9,323 3.78 333,331 1,704,995 Sierra Leone 5,525 1 218 3.74 433 2,213 Singapore 4,351 1 25,443 3.60 38,306 194,889 Solomon Islands
478 1 647 1.71 51 246
Spain 43,389 3 15,610 1.73 337,165 1,624,253 Sri Lanka 19,582 3 1,004 4.27 24,242 125,781 Sudan 36,233 4 462 5.56 44,785 35,828 192,965 Sweden 9,024 1 29,532 2.31 59,178 289,984 Syria 19,043 1 1,161 1.65 3,509 16,867 Tajikistan 6,507 1 237 6.09 903 4,939 Thailand 64,233 3 2,440 3.50 158,429 803,834 Tunisia 10,022 1 2,418 3.24 7,543 37,975 Turkey 72,636 5 3,390 5.86 694,126 694,126 3,770,854 United Kingdom
60,203 4 26,688 1.23 946,715 757,372 3,595,552
United States 296,497 3 37,574 2.48 13,266,740 7,960,044 39,197,172 Russia 143,151 5 2,444 6.68 1,124,468 1,124,468 6,255,039 Uzbekistan 26,593 1 673 5.18 8,924 47,539 Venezuela 26,577 2 4,939 7.20 181,743 1,026,043 Yemen 20,975 4 590 1.02 6,083 4,867 22,966 Totals $19,411,808 $17,363,247 $88,349,106 1Pop = Population in 2005 in thousands; Ti = Number of years during 2001-2005 in which there was at least one terrorist event; per capita GDP = per capita GDP in thousands of real 2000 US dollars; 2005 Growth = growth rate of per capita GDP between 2004 and 2005 (in percent); 2005 Cost = estimated real GDP cost of terrorism (in thousands) using the 2005 measure of terrorist incidents; 2005 Cost (average) = estimated real GDP cost of terrorism (in thousands) using the average level of terrorism over the 2001-2005 period; 5 year cost = real present value of 2005 Cost (average) (in thousands) over the next five years using a 3% discount rate. 2If a country had at least one terrorist in 2005, the entry for 2005 cost is measured as (Pop × per capita GDP) × (2005 growth/100) × 0.048. 3The entries for 2005 cost (average) is computed as: (Ti/5)(Pop × per capita GDP) × (2005 growth/100) × 0.048. 45 year cost is the present value of the entry for 2005 cost (average) for each of the next four years discounted at a 3% real interest rate. The ‘Growth’ entries project that per capita GDP levels continue at their 2005 growth rates.

95
Table 13A. Solutions: Benefits, Costs, and Benefit-Cost Ratios Based on 3% Discount Rate (Benefits and Costs are in billions of US $) $5000 DALY $2 Million Value of Life Solutions Benefits Costs BCR Benefits Costs BCR Solution 1 (M9)1 30.032 309.7 0.097 30.326 309.7 0.098 Solution 1 (M7)1 30.032 753.6 0.040 30.326 753.6 0.040 Solution 2A2 33.333 6.23 5.348 ––– ––– ––– Solution 2B2 33.333 2.15 15.504 ––– ––– ––– Solution 3A3 4.373 56.5 0.077 2.678 56.5 0.047 Solution 3B3 4.373 35.5 0.123 2.678 35.5 0.075 Solution 4 22.185 77.425 0.287 24.928 77.425 0.321 Solution 5 40.843 ––– ––– 41.550 ––– ––– 1Solution 1 (M9) is based on Method 9 in Table 11 for calculating homeland security expense; Solution 1 (M7) is based on Method 7 in Table 11 for calculating homeland security expense. 2Solution 2A uses higher costs for police cooperation and IMF monitoring than Solution 2B. DALY and Value of Life do not figure into the calculations of benefits for Solution 2A and 2B. 3Solution 3A is based on the cost of Operation Enduring Freedom (Afghanistan) and Operation Noble Eagle, while Solution 3B is only based on the cost of Operation Enduring Freedom.