Embed Size (px)
Citation preview

1
Prepared by: California Breathing Environmental Health Investigations Branch California Department of Public Health
Accompanying Slides

2
INTRODUCTION
Asthma is one of the most common chronic diseases and has been recognized as a growing public health concern. California Breathing, an asthma program in the California Department of Public Health, developed a detailed data source book entitled, Asthma in California: A Surveillance Report, that presents a comprehensive picture of the burden of asthma in the state. It is a compilation of all available asthma data in a single source, and provides a framework for addressing asthma in the state. This PowerPoint presentation is a companion resource to Asthma in California. Within it are slides that summarize key findings from the report and provide graphs and charts in an easily usable format. This presentation is intended to allow users to easily cut and use particular slides, graphs, or tables of interest. Notes beneath each slide summarize the findings presented on that slide. Each slide also lists the corresponding page number in the full report. When using these slides, please include the following citation: Milet M, Lutzker L, Flattery J. Asthma in California: A Surveillance Report. Richmond, CA: California Department of Public Health, Environmental Health Investigations Branch, May 2013. To view the full report, including the Technical Notes, please visit the California Breathing website (www.californiabreathing.org). For additional technical assistance, contact Meredith Milet ([email protected]) at 510-620-3634.

3
Table of Contents
Section Slides
Asthma Disparities Summary 4-6
Asthma Prevalence 7-19
Asthma Morbidity and Management 20-29
Health Status of People with Asthma 30-38
Environmental Triggers for Asthma 39-47
Work-Related Asthma (WRA) 48-53
Asthma Emergency Department (ED) Visits 54-61
Asthma Hospitalizations 62-71
Asthma Among Medi-Cal Beneficiaries 72-77
Asthma Mortality 78-81
Healthy People 2010 82-88

4
Asthma Disparities Summary

5
Asthma Disparities – Key Findings
• Compared to Whites, asthma hospitalization and ED visit rates are about four times higher for Blacks and asthma death rates are two times higher for Blacks.
• Both Pacific Islanders and Filipinos have especially high lifetime asthma prevalence, asthma mortality rates, and Medi-Cal asthma hospitalization rates.
• American Indian/Alaska Native (AI/AN) adults have the highest asthma prevalence of any racial/ethnic groups.
• The burden of asthma is greater among people who live in areas with lower median incomes.
• Among adults, the burden of asthma is greater for females; among children, the burden of asthma is greater for males.
• Lesbian and bisexual females have significantly higher asthma prevalence than straight females.
• Certain industries and occupations have particularly high rates of work-related asthma.
Pages 17-19 of full report

6
Asthma Disparities – Summary of Asthma Measures by Race/Ethnicity
Measures (All Ages Unless Otherwise Specified) Black AI/AN White Hispanic A/PI
Lifetime Asthma Prevalence 20.8% 21.2% 14.9% 10.0% 12.1%*
Current Asthma Prevalence 13.0% 15.6% 9.0% 5.9% 6.5%*
Percent with Well-Controlled Asthma (adults with current asthma) 45.8% 52%† 54.7% 48.5% 58.1%*†
Asthma ED Visit Rate (per 10,000) 157.5 26.9 38.6 43.2 17.9
Medi-Cal Asthma ED Visit Rate (per 10,000) 317.0 227.7 164.9 115.1 60.8
Asthma Hospitalization Rate (per 10,000) 29.0 4.7 7.6 8.7 6.1
Percent with Repeat Hospitalizations 18.8% 4.3% 11.3% 8.9% 10.5%
Medi-Cal Asthma Hospitalization Rate (per 10,000) 63.0 31.1 25.3 19.5 17.4
Asthma Death Rate (per million) 32.7 6.8 11.5 9.0 15.2*
A/PI = Asian/Pacific Islander * Asian only (does not include Pacific Islanders) † Unstable estimate – please note the wide confidence interval
Page 20 of full report

7
Asthma Prevalence

8
Lifetime and Current Asthma Prevalence Among Adults, California and the U.S. 1995-2010
0
2
4
6
8
10
12
14
16
1995 1996 1997 1998 1999 2000 2001 2002 2003 2004 2005 2006 2007 2008 2009 2010
Prev
alen
ce (p
erce
nt)
Year
CA Lifetime Asthma
US Lifetime Asthma
CA Current Asthma
US Current Asthma
Data Source: BRFSS 1995-2010 and www.cdc.gov/brfss
Page 24 of full report

9
Lifetime and Current Asthma Prevalence Among Children, California and the U.S. 2005-2010
0
2
4
6
8
10
12
14
16
2005 2006 2007 2008 2009 2010
Prev
alen
ce (p
erce
nt)
Year
CA lifetime asthma
US lifetime asthma
CA current asthma
US current asthma
Data Source: BRFSS 2005-2010 and www.cdc.gov/asthma/nhis
Page 26 of full report

10
Estimated Annual Incidence Rate of Asthma (per 1,000 People), by Age, California 2006-2009
Age Rate (95% CI) Estimated Number of New Cases Per Year
Adults (18+ years) 4.3 (2.8-5.9) 93,150
Children (0-17 years) 10.7 (5.4-16.0) 96,550
Data Source: Adult ACBS 2006-2009, Child ACBS 2006-2008
Page 27 of full report

11
Percent of Adults with Lifetime Asthma Who Were First Diagnosed as an Adult vs. as a Child, by Sex, California 2009
Data Source: Adult ACBS 2009
0
10
20
30
40
50
60
70
80
90
Total Males Females
Perc
ent
(with
95%
CI)
Child OnsetAdult Onset
Page 28 of full report

12
Lifetime and Current Asthma Prevalence by Age, California 2009
Data Source: CHIS 2009
0
5
10
15
20
0-4 5-17 18-64 65+
Prev
alen
ce (p
erce
nt w
ith 9
5% C
I)
Lifetime asthmaCurrent asthma
Page 29 of full report

13
Lifetime and Current Asthma Prevalence by Sex and Age, California 2009
Data Source: CHIS 2009
0
2
4
6
8
10
12
14
16
18
Children (<18) Adults (18+) Children (<18) Adults (18+)
Prev
alen
ce (p
erce
nt w
ith 9
5% C
I)
Male Female
Lifetime Asthma Current Asthma
Page 30 of full report

14
Lifetime and Current Asthma Prevalence Among Adults, by Race/Ethnicity, California 2007 and 2009 Combined
Data Source: CHIS 2007 and 2009
0
5
10
15
20
25
30
AI/AN Asian Black Hispanic White Pacific Islander
Prev
alen
ce (p
erce
nt w
ith 9
5% C
I)
Lifetime asthmaCurrent asthma
Page 31 of full report

15
Lifetime and Current Asthma Prevalence Among Children, by Race/Ethnicity, California 2007 and 2009 Combined
Data Source: CHIS 2007 and 2009
0
5
10
15
20
25
30
AI/AN Asian Black Hispanic White
Prev
alen
ce (p
erce
nt w
ith 9
5% C
I)
Lifetime asthmaCurrent asthma
Page 31 of full report

16
Lifetime and Current Asthma Prevalence Among Hispanics, by Hispanic Subgroup, California 2007 and 2009 Combined
Data Source: CHIS 2007 and 2009
0
5
10
15
20
25
30
Eur
opea
nH
ispa
nic
Pue
rto R
ican
Sou
thA
mer
ican
Cen
tral
Am
eric
an
Mex
ican
Sal
vado
ran
Gua
tem
alan
Prev
alen
ce (p
erce
nt w
ith 9
5% C
I)
Lifetime asthma
Current asthma
Page 33 of full report

17
Lifetime and Current Asthma Prevalence Among Asians, by Asian Subgroup, California 2007 and 2009 Combined
Data Source: CHIS 2007 and 2009
0
5
10
15
20
25
Filip
ino
Japa
nese
Sou
th A
sian
Vie
tnam
ese
Kor
ean
Chi
nese
Prev
alen
ce (p
erce
nt w
ith 9
5% C
I)
Lifetime asthma
Current asthma
Page 34 of full report

18
Lifetime and Current Asthma Prevalence among Adults, by Race/Ethnicity and Country of Birth, California 2009
Data Source: CHIS 2009
0
5
10
15
20
25
30
White Hispanic Asian White Hispanic Asian
Prev
alen
ce (p
erce
nt w
ith 9
5% C
I)
Born in U.S.Born Outside U.S.
Lifetime Asthma Current Asthma
Page 35 of full report

19
Lifetime and Current Asthma Prevalence Among Adults, by Sexual Orientation and Sex, California 2007 and 2009 Combined
Data Source: CHIS 2007 and 2009
0
5
10
15
20
25
30
35
Stra
ight
Fem
ale
Lesb
ian
Fem
ale
Bis
exua
lFe
mal
e
Stra
ight
Mal
e
Gay
Mal
e
Bis
exua
l Mal
e
Prev
alen
ce (p
erce
nt w
ith 9
5% C
I)
Lifetime asthma
Current asthma
Page 39 of full report

20
Asthma Morbidity and Management

21
Asthma Morbidity
• The majority of adults and children with current asthma experienced symptoms in the past 30 days (65.9% and 53.7% respectively). About 14% of adults experienced asthma symptoms every day.
• Asthma symptoms made sleeping difficult for 42.8% of adults and 32.3% of children with current asthma in the past 30 days.
• In the past year, 649,000 adults with current asthma (36.4%) missed work or usual activities because of their asthma. The average number of days missed was 6.6, for an estimated total of 11.8 million days of work/usual activities missed due to asthma.
• In the past year, 129,000 children with current asthma (52.3%) missed school or day care because of their asthma. The average number of days missed was 5, for an estimated total of 1.2 million days of school/day care missed due to asthma.
• Over 63% of adults and children with current asthma report some degree of activity limitation due to asthma in the past year.
Data Source: Adult ACBS 2009, Child ACBS 2006-2008
Pages 45-47 of full report

22
Percent of Californians with Current Asthma Reporting Asthma Attacks or Episodes, by Age, 2006-2009
Adults (18+) Children (0-17)
Asthma Attacks or Episodes % 95% CI % 95% CI
Had an asthma attack in past 12 months 52.9 (49.0-56.9) 58.1 (49.0-67.2)
No asthma attacks in the past 3 months 55.7 (49.2-62.3) 52.3 (43.3-62.0)
1 asthma attack in the past 3 months 13.0 (9.0-16.9) 17.4 (11.0-23.8)
2-3 asthma attacks in the past 3 months 14.7 (10.0-19.5) 14.1 (8.1-20.2)
4+ asthma attacks in the past 3 months 16.6 (11.8-21.3) 15.8 (7.6-24.0)
Data Source: Adult ACBS 2009, Child ACBS 2006-2008
Page 46 of full report

23
Percent of Californians with Current Asthma Reporting ED Visits or Hospitalizations for Asthma in the Past Year, by Age, 2006-2009
Adults (18+) Children (0-17)
Hospitalizations or ED Visits % 95% CI % 95% CI
Any Hospitalizations 2.6 (1.5-3.7) -- --
Any ED Visits 12.3 (9.8-14.7) 21.6 (14.3-28.9)
No ED Visits 87.8 (85.3-90.2) 78.4 (71.1-85.7)
1 ED Visit 7.0 (5.0-8.9) 10.1 (4.5-15.6)
2+ ED Visits 5.3 (3.7-6.8) 11.5 (6.0-17.0)
Data Source: Adult ACBS 2006-2009, Child ACBS 2006-2008
Page 48 of full report

24
Level of Asthma Control Among Californians with Current Asthma, by Age, 2006-2009
Data Source: Adult ACBS 2006-2009, Child ACBS 2006-2008
0
10
20
30
40
50
60
70
80
Well Controlled Not Well Controlled Very Poorly Controlled
Perc
ent (
with
95%
CI)
Adults (18+)
Children (0-17)
Page 49 of full report

25
Percent with Well-Controlled Asthma Among Adults with Current Asthma, by Annual Household Income, California 2006-2009
Data Source: Adult ACBS 2006-2009
0
10
20
30
40
50
60
70
80
Perc
ent W
ell-C
ontr
olle
d (w
ith 9
5% C
I)
Annual Household Income
Page 53 of full report

26
Asthma Morbidity by Level of Asthma Control
Compared to adults with well controlled asthma, those whose asthma is considered not well or very poorly controlled:
• are 2.5 times more likely to be unable to work or carry out usual activities due to asthma;
• are 2.5-4 times more likely to have an ED visit for asthma;
• and are 6 times more likely to have been hospitalized for asthma in the past year.
Compared to children with well controlled asthma, those whose asthma is considered not well or very poorly controlled:
• are 70% more likely to miss school or day care due to asthma;
• and are 2.7 times more likely to have an ED visit for asthma.
Data Source: Adult ACBS 2006-2009, Child ACBS 2006-2008
Pages 55-58 of full report

27
Number of Routine Asthma Checkups in the Past 12 Months Among Californians with Current Asthma, by Age, 2006-2009
Adults (18+) Children (0-17)
Number of Asthma Checkups % 95% CI % 95% CI
0 54.0 (47.1-60.9) 24.0 (16.1-31.9)
1-2 29.8 (23.2-36.3) 46.8 (36.9-56.7)
3 16.2 (11.7-20.7) 29.2 (19.6-38.7)
Data Source: Adult ACBS 2009, Child ACBS 2006-2008
Page 61 of full report

28
Percent Reporting Proper Use of Inhaled Prescription Asthma Medications in the Past 3 Months Among Californians with Current Asthma who Use Inhaled Prescription Asthma Medications, by Age, 2006-2009
Adults (18+) Children (0-17)
Proper Use of Medications % 95% CI % 95% CI
Proper use of controller medications* 39.8 (29.3-50.4) 36.0† (20.5-51.5)
Proper use of rescue medications** 67.6 (59.2-75.9) 69.6 (57.6-81.5)
Data Source: Adult ACBS 2009, Child ACBS 2006-2008
* Inhaled control medications must be used on a schedule every day, not used for attacks, and for certain medications not used before exercise. ** Inhaled rescue medications must be used for attacks, not used on a schedule every day, and for certain medications not used before exercise. † Unstable estimate – please note the wide confidence interval.
Page 63 of full report

29
Asthma Self-Management Education Among Californians with Current Asthma, by Age, 2006-2009
Adults (18+) Children (0-17)
Self-Management Education % 95% CI % 95% CI
Ever been taught to recognize early signs of an asthma attack 69.3 (63.9-74.8) 86.1 (80.6-91.7)
Ever been taught what to do during an asthma attack 84.0 (801.-87.9) 88.4 (83.3-93.6)
Ever been taught how to use a peak flow meter to adjust daily medications 52.8 (46.1-59.4) 42.1 (32.8-51.4)
Ever been given an asthma action plan 37.7 (31.0-44.4) 44.6 (35.8-53.4)
Ever taken a class on how to manage asthma 11.2 (7.9-14.5) 18.9 (10.9-26.9)
Ever been shown how to use their prescription inhaler 97.3 (96.0-98.7) 91.3 (84.8-97.8)
Ever been advised to change things in their home, work or school environment to
improve their asthma 29.9 (24.1-35.6) 44.4 (34.6-54.3)
Data Source: Adult ACBS 2009, Child ACBS 2006-2008
Page 64 of full report

30
Health Status of People With Asthma

31
Percent of People Reporting Fair or Poor General Health, by Asthma Status and Age, California 2009
Data Source: CHIS 2009
0
5
10
15
20
25
30
35
Current Asthma Former Asthma Never Diagnosed withAsthma
Perc
ent F
air/P
oor H
ealth
(w
ith 9
5% C
I)
Adults (18+)
Children (0-17)
Page 69 of full report

32
Percent of Adults Ever Diagnosed with COPD, by Asthma Status and Age, California 2009
Data Source: BRFSS 2009
0.0
10.0
20.0
30.0
40.0
50.0
60.0
Current Asthma Former Asthma Never Diagnosed withAsthma
Perc
ent w
ith C
OPD
(w
ith 9
5% C
I)
18-4445-6465+
Age
Page 70 of full report

33
Percent of Adults and Teens Who Are Obese, by Asthma Status, California 2009
Data Source: CHIS 2009
0
10
20
30
40
Current Asthma Former Asthma Never Diagnosed withAsthma
Perc
ent
Obe
se (
with
95%
CI)
Adults (18+)
Teens (12-17)
Page 71 of full report

34
Percent of Adults with a Disability, by Asthma Status, California 2009
Data Source: CHIS 2009
0
10
20
30
40
50
Current Asthma Former Asthma Never Diagnosed withAsthma
Perc
ent D
isab
led
(with
95%
CI)
Page 73 of full report

35
Percent of Adults and Teens With Psychological Distress in the Past Month, by Asthma Status, California 2009
Data Source: CHIS 2009
0
2
4
6
8
Current Asthma Former Asthma Never Diagnosed withAsthma
Perc
ent w
ith P
sych
olog
ical
Dis
tres
s (w
ith 9
5% C
I)
Page 74 of full report

36
Percent of Adults and Teens Who Are Current Smokers, by Asthma Status, California 2009
Percent Current Smokers (Adults and Teens)
Asthma Status % 95% CI
Current Asthma 11.9 (10.0-13.8)
Former Asthma 13.3 (10.0-16.5)
Never Diagnosed with Asthma 12.5 (11.8-13.3)
Data Source: CHIS 2009
Page 75 of full report

37
Percent of People Who Had a Flu Vaccine in the Last Year, by Asthma Status and Age, California 2009
Percent with Flu Vaccine in Last Year
Adults (18+) Children (0-17)
Asthma Status % 95% CI % 95% CI
Current Asthma 45.6 (41.0-50.1) 61.8 (49.3-74.3)
Former Asthma 31.1 (26.5-35.7) 41.5 (26.7-56.3)
Never Diagnosed with Asthma 31.5 (30.3-32.7) 34.9 (31.1-38.8)
Data Source: BRFSS 2009
Page 76 of full report

38
Percent of People Who Were Uninsured All or Part of the Last Year and Percent of People with No Usual Source of Health Care, by Asthma Status and Age, California 2009
Percent Uninsured All or Part of the Last Year
Adults (18+) Children (0-17)
Asthma Status % 95% CI % 95% CI
Current Asthma 19.4 (15.7-23.0) 4.7 (2.4-7.1)
Former Asthma 18.7 (15.3-22.1) 6.4 (3.6-9.1)
Never Diagnosed with Asthma 23.6 (22.7-24.5) 8.9 (7.8-10.0)
Data Source: CHIS 2009
Percent With No Usual Source of Health Care
Adults (18+) Children (0-17)
Asthma Status % 95% CI % 95% CI
Current Asthma 11.2 (7.9-14.6) 9.1 (5.1-13.1)
Former Asthma 15.7 (11.9-19.5) 10.5 (5.3-15.7)
Never Diagnosed with Asthma 17.1 (16.1-18.0) 7.5 (6.6-8.4)
Page 77-78 of full report

39
Environmental Triggers for Asthma

40
Percent of People Exposed to Secondhand Smoke in the Home, by Asthma Status and Age, California 2009
Data Source: CHIS 2009
0
10
20
Current Asthma Former Asthma Never Diagnosed withAsthma
Perc
ent
Expo
sed
to S
mok
e in
Hom
e (w
ith 9
5% C
I)
Adults (18+)
Children (0-17)
Page 81 of full report

41
Percent of People with Current Asthma Who Report Home Environmental Exposures, by Age, California 2006-2009
Adults (18+) Children (0-17)
Environmental Exposures % 95% CI % 95% CI
Mold (past 30 days) 10.6 (6.4-14.8) 8.4* (2.5-14.5)
Cockroaches, mice or rats (past 30 days) 10.9 (6.3-15.6) 6.0* (1.2-10.8)
Pets inside home 60.1 (53.7-66.5) 59.7 (50.0-69.4)
Carpeting or rugs in bedroom 70.9 (64.8-77.0) 71.7 (63.0-80.4)
Wood burning fireplace/stove 22.3 (17.1-27.5) 29.3 (20.4-38.1)
Gas used for cooking 70.8 (65.3-76.4) 65.9 (56.2-75.6)
Unvented gas fireplace/unvented gas stove 9.8 (5.6-13.9) --
Smoking inside home (past week) 9.4 (5.4-13.4) 8.4* (0.3-16.4)
Adult is current smoker 13.1 (8.9-17.2) NA
Child lives in a home with a current smoker NA 12.8* (4.5-21.1)
Data Source: Adult ACBS 2009, Child ACBS 2006-2008
* Unstable estimate – please note the wide confidence interval
Page 82 of full report

42
Percent of People with Current Asthma Who Report Actions Taken to Reduce Home Environmental Exposures, by Age, California 2006-2009
Adults (18+) Children (0-17)
Actions taken to reduce environmental exposures % 95% CI % 95% CI
Mattress cover used 37.2 (30.4-44.1) 37.1 (27.5-46.7)
Pillow cover used 32.4 (25.8-39.1) 38.8 (29.5-48.2)
Sheets/pillowcases washed in hot water 45.5 (38.8-52.1) 47.4 (37.6-57.2)
Pets not allowed in bedroom (if have pets) 19.7 (13.3-26.2) 33.3 (21.6-45.0)
Kitchen exhaust fan regularly used 64.7 (58.4-71.0) 76.3 (68.9-83.8)
Bathroom exhaust fan regularly used 58.7 (52.2-65.1) 55.5 (45.8-65.1)
Air cleaner/purifier regularly used* 29.4 (22.9-35.8) 32.8 (23.3-42.2)
Dehumidifier regularly used 7.5 (3.7-11.4) 12.7 (6.4-19.0)
Data Source: Adult ACBS 2009, Child ACBS 2006-2008
* Information on the type of air cleaner was not collected. Please note that some air cleaners emit ozone and may make asthma worse.
Page 83 of full report

43
Estimated Number of Days per Year Above the U.S. 24-hour PM2.5 Standard, by Air Basin, California 2008-2010
Data Source: California Air Resources Board Aerometric Data Analysis and Measurement System, 2008-2010
Page 87 of full report

44
Estimated Number of Days per Year Above the California 24-hour PM10 Standard, by Air Basin, California 2008-2010
Data Source: California Air Resources Board Aerometric Data Analysis and Measurement System, 2008-2010
Page 88 of full report

45
Estimated Number of Days per Year Above the U.S. 24-hour PM10 Standard, by Air Basin, California 2008-2010
Data Source: California Air Resources Board Aerometric Data Analysis and Measurement System, 2008-2010
Page 89 of full report

46
Number of Days per Year Above the California 8-hour Ozone Standard, by Air Basin, California 2008-2010
Data Source: California Air Resources Board Aerometric Data Analysis and Measurement System, 2008-2010
Page 90 of full report

47
Number of Days per Year Above the U.S. 8-hour Ozone Standard, by Air Basin, California 2008-2010
Data Source: California Air Resources Board Aerometric Data Analysis and Measurement System, 2008-2010
Page 91 of full report

48
Work-Related Asthma (WRA)

49
Prevalence of Work-Related Asthma (WRA) Among Adults with Current Asthma, California 2006-2009
% 95% CI
WRA caused or aggravated by any job 40.3 (36.4-44.2)
WRA caused by any job 24.6 (21.0-28.2)
WRA aggravated by any job 35.0 (31.5-38.6)
Changed or quit a job due to asthma 7.6 (5.7-9.5)
Discussed WRA with doctor 12.2 (10.0-14.3)
Data Source: Adults ACBS 2006-2009
Page 96 of full report

50
Asthma Impact/Impairment Among Adults with Current Asthma, by WRA Status, California 2006-2009
Data Source: Adult ACBS 2006-2009
0
10
20
30
40
50
60
70
80
90
Any AsthmaSymptoms inPast Month
Any NighttimeAsthma
Symptoms inPast Month
Any AsthmaAttacks in Past
Year
Any AsthmaMedications
Used in Past 3Months
Asthma Checkupin Past Year
ED or UrgentCare Visit for
Asthma in PastYear
Any LimitedUsual Activities in
Past Year
Perc
ent (
with
95%
CI)
WRA Non-WRA
Page 97 of full report

51
Asthma Impact/Impairment Among Interviewed WRA Cases, by WRA Classification, California 1993-2008
New-Onset Asthma
Work-Aggravated
Asthma All WRA Cases
ED visit since WRA began 62% 60% 61%
Hospitalized since WRA began 16% 12% 14%
Breathing problems in past 2 weeks 56% 55% 56%
Know coworkers with breathing problems 70% 62% 66%
Still work at same employer 59% 67% 62%
Still exposed at work 31% 23% 26%
Unable to perform usual work 55% 52% 56%
Fired or left work due to exposure 37% 19% 29%
Applied for Worker’s Compensation 60% 54% 57%
If applied, compensation granted 66% 70% 68%
Data Source: California WRAPP Surveillance Data, 1993-2008 (N=2,145)
Pages 101-102 of full report

52
WRA Rates by Industry Subsector (6 Highest), California 1993-2008
Data Source: California WRAPP Surveillance Data, 1993-2008 (N=4,677)
6.4
6.6
7.3
8.1
12.1
16.0
0 2 4 6 8 10 12 14 16 18
Wood Product Manufacturing
Social Assistance
Utilities
Parks, Zoos, Museums
Hospitals
Transit and Ground PassengerTransportation
Rate per 100,000 Workers
Page 105 of full report

53
WRA Rates by Occupation (6 Highest), California 1993-2008
Data Source: California WRAPP Surveillance Data, 1993-2008 (N=4,677)
9.9
10.2
11.4
11.4
15.0
22.9
0 5 10 15 20 25
Respiratory Therapists
Chemical Technicians
Telephone Operators
Medical Assistants and Healthcare Support
Misc. Science Technicians
Firefighting Occupations
Rate per 100,000 Workers
Page 107 of full report

54
Asthma Emergency Department (ED) Visits

55
Age-Adjusted Asthma ED Visits per 10,000 Residents, California and the U.S., 2005-2010
Data Source: OSHPD
0
10
20
30
40
50
60
70
80
2005 2006 2007 2008 2009 2010
Rat
e
Year
U.S.CA
Page 111 of full report

56
Age-Adjusted Asthma ED Visits per 10,000 California Residents by Age, 2010
Data Source: OSHPD
0
20
40
60
80
100
120
0-4 5-17 18-64 65+
Rat
e
Age (years)
Page 113 of full report

57
Age-Adjusted Asthma ED Visits per 10,000 California Residents by Race/Ethnicity, 2005-2010
Data Source: OSHPD
0
30
60
90
120
150
180
2005 2006 2007 2008 2009 2010
Rat
e
Year
Black
Hispanic
White
A/PI
AI/AN
Page 114 of full report

58
Age-Adjusted Asthma ED Visits per 10,000 California Residents by Sex and Age, 2010
Data Source: OSHPD
0
20
40
60
80
100
120
140
160
0-4 5-17 18-64 65+
Rat
e
Age (years)
MalesFemales
Page 117 of full report

59
Age-Adjusted Asthma ED Visits per 10,000 California Residents by Median Household Income in Zip Code, 2009
Data Source: OSHPD
0
20
40
60
80
100
120
Rat
e
Median Household Income of Zip Code)
Page 118 of full report

60
Asthma ED Visits by Month and Age, California 2006-2010
Data Source: OSHPD
Page 119 of full report

61
Expected Source of Payment for Asthma ED Visits, California 2010
Data Source: OSHPD
Page 120 of full report

62
Asthma Hospitalizations

63
Age-Adjusted Asthma Hospitalizations per 10,000 Residents, California and the U.S., 1995-2010
Data Source: OSHPD
0
5
10
15
20
25R
ate
Year
U.S.CA
Page 124 of full report

64
Asthma Hospitalizations per 10,000 California Residents by Age, 1995-2010
Data Source: OSHPD
0
10
20
30
40R
ate
Year
<55-6465+
Page 125 of full report

65
Age-Adjusted Asthma Hospitalizations per 10,000 California Residents by Race/Ethnicity, 2000-2010
Data Source: OSHPD
0
5
10
15
20
25
30
35
2000 2001 2002 2003 2004 2005 2006 2007 2008 2009 2010
Rat
e
Year
Black
Hispanic
White
A/PI
AI/AN
Page 128 of full report

66
Age-Adjusted Asthma Hospitalizations per 10,000 California Residents by Sex and Age, 2010
Data Source: OSHPD
0
5
10
15
20
25
30
35
0-4 5-17 18-64 65+
Rat
e
Age (years)
MalesFemales
Page 133 of full report

67
Age-Adjusted Asthma Hospitalizations per 10,000 California Residents by Median Household Income in Zip Code, 2009
Data Source: OSHPD
0
5
10
15
20
Rat
e
Median Household Income of Zip Code
Page 134 of full report

68
Asthma Hospitalizations by Month of Admission and Age, California 2006-2010
Data Source: OSHPD
Page 135 of full report

69
Average Charge per Asthma Hospitalization, California 1995-2010
Data Source: OSHPD
$0
$5,000
$10,000
$15,000
$20,000
$25,000
$30,000
$35,000
$40,000
Aver
age
Cha
rges
, Inf
latio
n Ad
just
ed
Year
Page 137 of full report

70
Expected Source of Payment for Asthma Hospitalizations, California 2010
Data Source: OSHPD
Page 138 of full report
71
Repeat Hospitalizations for Asthma, California 2008-2010
A repeat asthma hospitalization is when someone has more than one asthma hospitalization within a certain period. • In 2010, 13.3% of asthma hospitalizations were repeats (n=4,612)
• These accounted for 15.3% of charges for asthma hospitalizations, or $155.6 million
• $53.4 million were charges covered by Medi-Cal and $65.3 million were charges covered
by Medicare
• Blacks had the highest percentage with repeat hospitalizations of any race/ethnicity
• Adults had a higher percentage with repeat hospitalizations than children
• Individuals with more repeat asthma hospitalizations were more likely to be from areas with lower median household income
Data Source: OSHPD
Pages 139-141 of full report

72
Asthma Among Medi-Cal Beneficiaries

73
Percent of Medi-Cal Managed Care Beneficiaries (Ages 5-56) with Persistent Asthma who were Prescribed Appropriate Medications, 2006-2009
Year Medi-Cal Managed Care Average (%)
National Medicaid Average (%)
National Commercial Average (%)
2006 84.5 85.7 89.9
2007 86.8 87.1 91.6
2008 88.8 86.9 92.3
2009 88.6 88.6 92.7
Data Source: California Department of Health Care Services (DHCS), Medi-Cal Managed Care Division HEDIS Reports
Page 145 of full report

74
Medi-Cal Asthma ED Visits per 10,000 Continuously Enrolled Beneficiaries by Race/Ethnicity, 2010
Data Source: DHCS Medi-Cal Management Information and Decision Support System database
0
50
100
150
200
250
300
350
Black Hispanic White A/PI AI/AN
Rat
e
Race/Ethnicity
Page 147 of full report

75
Age-Adjusted Medi-Cal Asthma ED Visits per 10,000 Continuously Enrolled Beneficiaries by Asian/Pacific Islander Subgroups, 2010
Data Source: DHCS Medi-Cal Management Information and Decision Support System database
0
50
100
150
200
250
300
350
Rat
e
Page 149 of full report

76
Medi-Cal Asthma Hospitalizations per 10,000 Continuously Enrolled Beneficiaries by Race/Ethnicity, 2010
Data Source: DHCS Medi-Cal Management Information and Decision Support System database
0
10
20
30
40
50
60
70
Black Hispanic White A/PI AI/AN
Rat
e
Race/Ethnicity
Page 151 of full report

77
Age-Adjusted Medi-Cal Asthma Hospitalizations per 10,000 Continuously Enrolled Beneficiaries by Asian/Pacific Islander Subgroups, 2010
Data Source: DHCS Medi-Cal Management Information and Decision Support System database
0
20
40
60
80
100
120
Rat
e
Page 153 of full report

78
Asthma Mortality

79
Age-Adjusted Asthma Deaths per 1,000,000 Residents, California and the U.S., 2000-2009
Data Source: CDPH Office of Health Information Research
0
5
10
15
20
2000 2001 2002 2003 2004 2005 2006 2007 2008 2009
Rat
e
Year
U.S.CA
Page 157 of full report

80
Age-Adjusted Asthma Deaths per 1,000,000 California Residents by Race/Ethnicity, 2003-2009 Aggregated
Data Source: CDPH Office of Health Information Research
0
5
10
15
20
25
30
35
Black PacificIslander
Asian White Hispanic AI/AN
Rat
e
Race/Ethnicity
Page 161 of full report

81
Age-Adjusted Asthma Deaths per 1,000,000 California Residents by Sex and Age, 2005-2009 Aggregated
Data Source: CDPH Office of Health Information Research
0
10
20
30
40
50
60
70
0-4 5-17 18-64 65+
Rat
e
Age (years)
MalesFemales
Page 163 of full report

82
Healthy People 2010/2020

83
Reduce Asthma Deaths (HP2010 Objective 24-1, HP2020 Objective RD-1)
Age California, 2009 (per million)
HP2010 Target (per million)
HP2020 Target (per million)
0-14 1.8 0.9 NA
15-34 4.8 1.9 NA
35-64 9.0 8.0 6.0
65+ 48.8 47.0 22.9
Data Source: Office of Health Information and Research, 2009
Page 166 of full report
84
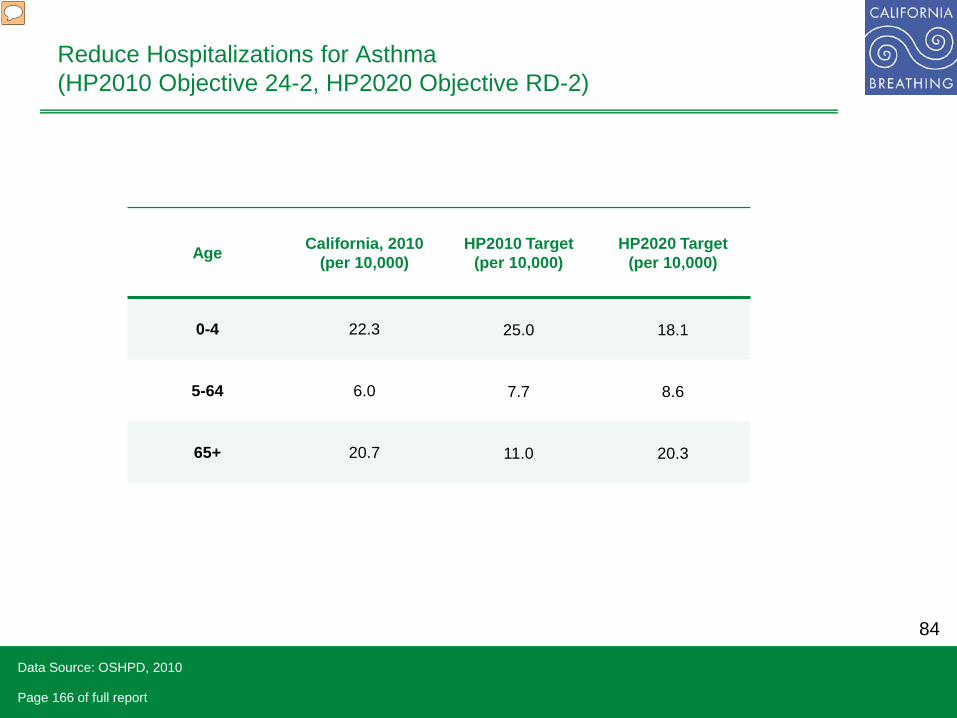
Reduce Hospitalizations for Asthma (HP2010 Objective 24-2, HP2020 Objective RD-2)
Age California, 2010 (per 10,000)
HP2010 Target (per 10,000)
HP2020 Target (per 10,000)
0-4 22.3 25.0 18.1
5-64 6.0 7.7 8.6
65+ 20.7 11.0 20.3
Data Source: OSHPD, 2010
Page 166 of full report

85
Reduce Hospital Emergency Department Visits for Asthma (HP2010 Objective 24-3, HP2020 Objective RD-3)
Age California, 2010 (per 10,000)
HP2010 Target (per 10,000)
HP2020 Target (per 10,000)
0-4 109.5 80.0 95.5
5-64 41.7 50.0 49.1
65+ 37.5 15.0 13.2
Data Source: OSHPD, 2010
Page 167 of full report

86
Reduce the Proportion of Persons with Asthma Who Miss School or Work Days (HP2020 Objectives RD-5.1 and RD-5.2)
Among people reporting an asthma episode or attack in the pas year
California, 2009 % (95% CI)
HP2010 Target
%
HP2020 Target
%
Missed any school days due to asthma in past year, Ages 5-17 48.4 (40.2-56.5) NA 48.7
Missed any work days due to asthma in past year, Ages 18-64 20.0 (15.1-25.0) NA 26.8
Data Source: CHIS, 2009
Page 167 of full report

87
Increase the Proportion of Persons with Current Asthma Who Receive Formal Patient Education (HP2010 Objective 24-6, HP2020 Objectives RD-6)
Among people with current asthma California, 2006-2008 % (95% CI)
HP2010 Target
%
HP2020 Target
%
Have ever taken a formal course or class on how to manage asthma 16.1 (12.2-19.9) 38.0 14.1
Data Source: ACBS, 2006-2008
Page 167 of full report

88
Increase the Proportion of Persons with Current Asthma Who Receive Appropriate Asthma Care According to NAEPP Guidelines (HP2010 Objective 24-7, HP2020 Objective RD-7)
Among people with current asthma California, 2006-2008 % (95% CI)
HP2010 Target
%
HP2020 Target
%
Have ever received a written asthma management plan from their health care provider 31.9 (27.4-36.4) 40.0 39.8
Use a prescription asthma inhaler and have received instruction on how to use it properly 95.4 (93.4-97.4) 98.8 NA
Have received education on how to respond to an asthma episode, and either how to recognize early signs and symptoms or how to monitor peak flow
results
71.4 (67.4-75.3) 68.0 68.5
Have been advised by a health professional to change their home, school, or work environment to reduce
exposure to irritants or allergens 39.5 (35.2-43.8) 50.0 54.5
Data Source: ACBS, 2006-2008
Page 168 of full report