Embed Size (px)
Citation preview
Cancer Therapy: Preclinical
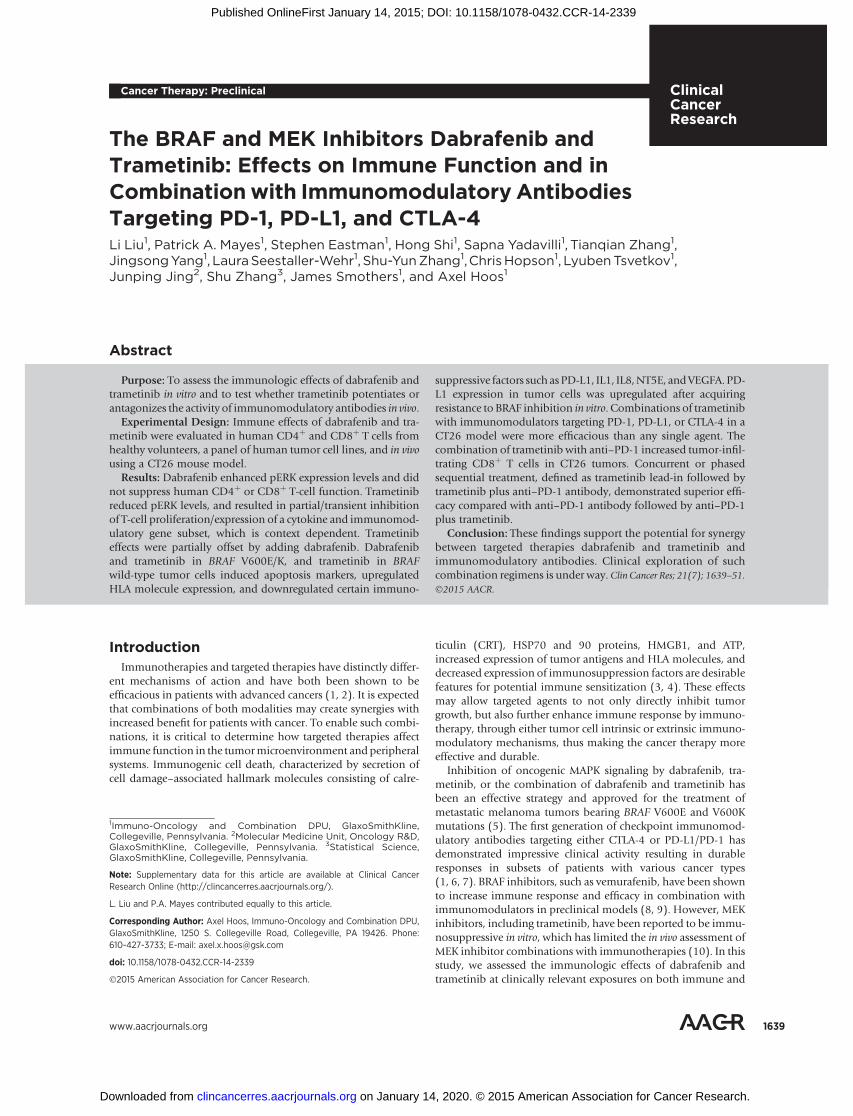
The BRAF and MEK Inhibitors Dabrafenib andTrametinib: Effects on Immune Function and inCombination with Immunomodulatory AntibodiesTargeting PD-1, PD-L1, and CTLA-4Li Liu1, Patrick A. Mayes1, Stephen Eastman1, Hong Shi1, Sapna Yadavilli1, Tianqian Zhang1,JingsongYang1, LauraSeestaller-Wehr1, Shu-YunZhang1,ChrisHopson1, LyubenTsvetkov1,Junping Jing2, Shu Zhang3, James Smothers1, and Axel Hoos1
Abstract
Purpose: To assess the immunologic effects of dabrafenib andtrametinib in vitro and to test whether trametinib potentiates orantagonizes the activity of immunomodulatory antibodies in vivo.
Experimental Design: Immune effects of dabrafenib and tra-metinib were evaluated in human CD4þ and CD8þ T cells fromhealthy volunteers, a panel of human tumor cell lines, and in vivousing a CT26 mouse model.
Results: Dabrafenib enhanced pERK expression levels and didnot suppress human CD4þ or CD8þ T-cell function. Trametinibreduced pERK levels, and resulted in partial/transient inhibitionof T-cell proliferation/expression of a cytokine and immunomod-ulatory gene subset, which is context dependent. Trametinibeffects were partially offset by adding dabrafenib. Dabrafeniband trametinib in BRAF V600E/K, and trametinib in BRAFwild-type tumor cells induced apoptosis markers, upregulatedHLA molecule expression, and downregulated certain immuno-
suppressive factors such as PD-L1, IL1, IL8,NT5E, andVEGFA. PD-L1 expression in tumor cells was upregulated after acquiringresistance to BRAF inhibition in vitro. Combinations of trametinibwith immunomodulators targeting PD-1, PD-L1, or CTLA-4 in aCT26 model were more efficacious than any single agent. Thecombination of trametinib with anti–PD-1 increased tumor-infil-trating CD8þ T cells in CT26 tumors. Concurrent or phasedsequential treatment, defined as trametinib lead-in followed bytrametinib plus anti–PD-1 antibody, demonstrated superior effi-cacy compared with anti–PD-1 antibody followed by anti–PD-1plus trametinib.
Conclusion: These findings support the potential for synergybetween targeted therapies dabrafenib and trametinib andimmunomodulatory antibodies. Clinical exploration of suchcombination regimens is under way. Clin Cancer Res; 21(7); 1639–51.�2015 AACR.
IntroductionImmunotherapies and targeted therapies have distinctly differ-
ent mechanisms of action and have both been shown to beefficacious in patients with advanced cancers (1, 2). It is expectedthat combinations of both modalities may create synergies withincreased benefit for patients with cancer. To enable such combi-nations, it is critical to determine how targeted therapies affectimmune function in the tumormicroenvironment andperipheralsystems. Immunogenic cell death, characterized by secretion ofcell damage–associated hallmark molecules consisting of calre-
ticulin (CRT), HSP70 and 90 proteins, HMGB1, and ATP,increased expression of tumor antigens and HLA molecules, anddecreased expression of immunosuppression factors are desirablefeatures for potential immune sensitization (3, 4). These effectsmay allow targeted agents to not only directly inhibit tumorgrowth, but also further enhance immune response by immuno-therapy, through either tumor cell intrinsic or extrinsic immuno-modulatory mechanisms, thus making the cancer therapy moreeffective and durable.
Inhibition of oncogenic MAPK signaling by dabrafenib, tra-metinib, or the combination of dabrafenib and trametinib hasbeen an effective strategy and approved for the treatment ofmetastatic melanoma tumors bearing BRAF V600E and V600Kmutations (5). The first generation of checkpoint immunomod-ulatory antibodies targeting either CTLA-4 or PD-L1/PD-1 hasdemonstrated impressive clinical activity resulting in durableresponses in subsets of patients with various cancer types(1, 6, 7). BRAF inhibitors, such as vemurafenib, have been shownto increase immune response and efficacy in combination withimmunomodulators in preclinical models (8, 9). However, MEKinhibitors, including trametinib, have been reported to be immu-nosuppressive in vitro, which has limited the in vivo assessment ofMEK inhibitor combinations with immunotherapies (10). In thisstudy, we assessed the immunologic effects of dabrafenib andtrametinib at clinically relevant exposures on both immune and
1Immuno-Oncology and Combination DPU, GlaxoSmithKline,Collegeville, Pennsylvania. 2Molecular Medicine Unit, Oncology R&D,GlaxoSmithKline, Collegeville, Pennsylvania. 3Statistical Science,GlaxoSmithKline, Collegeville, Pennsylvania.
Note: Supplementary data for this article are available at Clinical CancerResearch Online (http://clincancerres.aacrjournals.org/).
L. Liu and P.A. Mayes contributed equally to this article.
Corresponding Author: Axel Hoos, Immuno-Oncology and Combination DPU,GlaxoSmithKline, 1250 S. Collegeville Road, Collegeville, PA 19426. Phone:610-427-3733; E-mail: [email protected]
doi: 10.1158/1078-0432.CCR-14-2339
�2015 American Association for Cancer Research.
ClinicalCancerResearch
www.aacrjournals.org 1639
on January 14, 2020. © 2015 American Association for Cancer Research. clincancerres.aacrjournals.org Downloaded from
Published OnlineFirst January 14, 2015; DOI: 10.1158/1078-0432.CCR-14-2339
tumor cells in vitro. The effect on immune cells by dabrafenib wasconsistent with the literature reports for BRAF inhibitors (10, 11).However, we found that the effect of trametinib on immune cellswas both complex and context dependent. The antiproliferativeeffect of trametinib on T cells was partial and transient in vitro.Furthermore, we tested trametinib alone and in combinationwithseveral immunomodulatory antibodies in an immunocompetentsyngeneic mouse model. Our in vivo data demonstrate that tra-metinib had minimal inhibitory effects on circulating immunecells, and enhanced efficacy and/or tumor infiltration of CD8þ
effective cells. These findings support clinical exploration of bothtrametinib and dabrafenib in combination with specific immu-nomodulatory antibodies.
Materials and MethodsCell lines and reagents
Human melanoma cell line, A375PF11, was derived from aclonal isolate of the A375 cell line obtained from the AmericanType Culture Collection (ATCC). Humanmelanoma line YUSIT1was obtained from Yale Dermatology Cell Culture Facility (12).Human melanoma lines: SK-MEL-24, CHL-1, HMVII, and SK-MEL-2; human non–small cell lung cancer (NSCLC) lines: Calu6,A549, and H358; and mouse colon carcinoma line, CT26, wereobtained from the ATCC and cultured in RPMI with 10% fetalbovine serum (FBS) media. All cell lines were characterized bygenotypic andRNAexpression analyses using theAffymetrix 500KSNP chip andHG-U133Plus2 chip, respectively (Affymetrix, Inc.)for human lines, and using Exome Seq and RNA-Seq (Illumina)for CT26, and kept in culture for <3 months. 12R5-1, 12R5-3,16R6-3, 16R5-5, and 16R6-4 were dabrafenib-resistant clonesderived from A375PF11 (referred to henceforth as A375; ref. 13).
Human CD4þ and CD8þ T cells were isolated from wholeblood using STEMCELL Technologies RosetteSep Human T CellEnrichment Cocktails (STEMCELL Technologies) and Lympho-Prep density gradient medium according to the manufacturer's
protocol. Human whole blood was obtained fromGlaxoSmithK-line's blood donation unit (Upper Providence site, PA) under theInstitutional Review Board (IRB) approval.
In vitro T-cell assaysHuman CD4þ and CD8þ cells were activated with anti-CD3/
anti-CD28 antibodies either in bead- or plate-bound forms.Trametinib and dabrafenib were added at same time or sequen-tially with activation. T-cell proliferation, cytokine secretion, andapoptosis induction, cell signaling, surface markers, and geneexpression levels were measured. Protocols are described in theSupplementary Methods.
Human and mouse tumor cell assaysThe expression levels of immunomodulators, HLA molecules,
and tumor-associated antigens from tumor cells were determinedby NanoString, RT-PCR, flow cytometry, and/or Western blotanalyses. Procedures, antibodies, and reagents are described inthe Supplementary Methods.
In vivo evaluation in CT26 murine carcinoma syngeneic mousemodel
Female BALB/C mice (Charles River) received food and waterad libitum and were housed in GlaxoSmithKline in compliancewith the recommendations of the Guide for Care and Use ofLaboratory Animals. Tumors were established by subcutaneouslyimplanting 5 � 104 CT26 cells in suspension into the rightflank of mice. Tumor weights were calculated using the equation(l�w2)/2,where l andw refer to the larger and smaller dimensionscollected at each measurement. Treatments began at day 11 or12 with tumor size 40 to 100 mm3. Tumors were monitored andmice were euthanized when an endpoint was reached, defined astumor volumegreater than2,000mm3, tumorulceration, or studyend (21 or 68 days after initial dosing), whichever came first.Tumor regressions, median tumor volume, and treatment toler-ability were also considered.
Percentage tumor growth inhibition (%TGI)was defined as thedifference between the mean tumor volume (MTV) of the desig-nated control group and the MTV of the drug-treated group,expressed as a percentage of the MTV of the designated controlgroup:% TGI ¼ [1 � (MTVdrug-treated/MTVcontrol)] � 100. TheKaplan–Meier method was carried out to estimate the survivalprobability of different treatment groups at a given time. Themedian time to endpoint (TTE) and its corresponding 95%confidence interval (CI) were calculated.
For pharmacodynamic analysis, fresh tumors, lymph nodes,spleen, serum, and whole blood were collected 4 and 24 hoursafter last dose on days 7 or 8. Flow cytometric analysis oflymphocytes from mouse blood, tumor tissues, lymph nodes,and spleens, cytokine analysis from serum, and gene expressionand immunohistochemistry (IHC) analyses from tumor tissuesare described in the Supplementary Methods.
Statistical analysis of the results was performed by contrastanalysis following one-way ANOVA, and described in the Sup-plementary Methods.
ResultsTrametinib, but not dabrafenib, partially and transientlyinhibits T-cell proliferation and cytokine production in vitro
We used CD4þ and CD8þ cells isolated from healthy volun-teers to assess whether dabrafenib and trametinib could affect
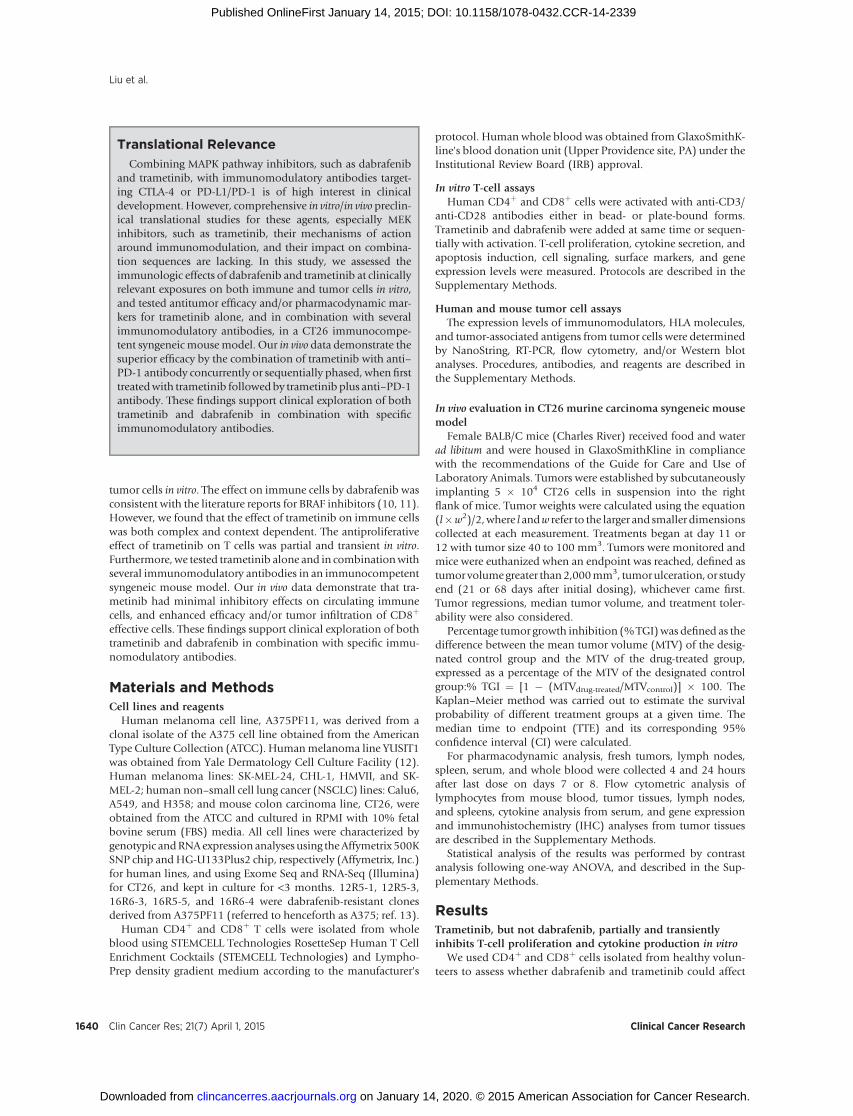
Translational Relevance
Combining MAPK pathway inhibitors, such as dabrafeniband trametinib, with immunomodulatory antibodies target-ing CTLA-4 or PD-L1/PD-1 is of high interest in clinicaldevelopment. However, comprehensive in vitro/in vivo preclin-ical translational studies for these agents, especially MEKinhibitors, such as trametinib, their mechanisms of actionaround immunomodulation, and their impact on combina-tion sequences are lacking. In this study, we assessed theimmunologic effects of dabrafenib and trametinib at clinicallyrelevant exposures on both immune and tumor cells in vitro,and tested antitumor efficacy and/or pharmacodynamic mar-kers for trametinib alone, and in combination with severalimmunomodulatory antibodies, in a CT26 immunocompe-tent syngeneic mousemodel. Our in vivo data demonstrate thesuperior efficacy by the combination of trametinib with anti–PD-1 antibody concurrently or sequentially phased, when firsttreatedwith trametinib followedby trametinib plus anti–PD-1antibody. These findings support clinical exploration of bothtrametinib and dabrafenib in combination with specificimmunomodulatory antibodies.
Liu et al.
Clin Cancer Res; 21(7) April 1, 2015 Clinical Cancer Research1640
on January 14, 2020. © 2015 American Association for Cancer Research. clincancerres.aacrjournals.org Downloaded from
Published OnlineFirst January 14, 2015; DOI: 10.1158/1078-0432.CCR-14-2339
T-cell proliferation and function in vitro. T cells were activatedwith anti-CD3/anti-CD28 antibodies coated either on beads orplates. Trametinib and dabrafenib were added either simulta-neously or sequentially with activation. At clinically relevantexposures, both dabrafenib and trametinib had little to noeffect on na€�ve T cells (data not shown). At clinically relevantconcentrations, dabrafenib alone did not significantly inhibit
proliferation, apoptosis, or cytokine production of activatedCD4þ and CD8þ T cells (Fig. 1). Unlike dabrafenib, trametinibalone resulted in partial inhibition of CD4þ T-cell proliferationafter 3 days, but not after 7 days of treatment if CD4þ T cellswere dosed with compound 24 hours before activation (Fig. 1A,Drug>Act., top). At 7 days, partial growth inhibition wasapparent only at trametinib concentrations greater than 100
2.5
2.0
1.5
1.0
0.5
0.0
2.5
2.0
1.5
1.0
0.5
0.0
A
Ave
rag
e ce
ll d
ivis
ion
Co
nce
ntr
atio
n (
pg
/mL
)
D+T (mmol/L)
Cas
pas
e-3/
7 G
LO
(RL
U)
Drug>Act.
TD+TDAct.
Act.>Drug
Time = 168 hours
Dru
g>A
ct.
Act
.>D
rug
B
CTime = 72 hours
4
3
2
1
0
4
150,000
100,000
50,000
Drug>Act.
IFNγAct.>Drug
0
3
Un.
2
1
0
300,000
200,000
100,000
0
Act. D T D+T
CONTROLS
0.00
2/0.
0002
0.01
4/0.
001
0.12
3/0.
012
1.11
1/0.
111
10.0
00/1
.000
CONTROLS
0.00
2/0.
0002
0.01
4/0.
001
0.12
3/0.
012
1.11
1/0.
111
10.0
00/1
.000
CONTROLS
0.00
2/0.
0002
0.01
4/0.
001
0.12
3/0.
012
1.11
1/0.
111
10.0
00/1
.000
CONTROLS
0.00
2/0.
0002
0.01
4/0.
001
0.12
3/0.
012
1.11
1/0.
111
10.0
00/1
.000
TD+TDAct.
10,000
8,000
2,000
4,000
6,000
0
25,000
20,000
15,000
10,000
5,000
Drug>Act.
IL2Act.>Drug
0
800
600
200
400
Drug>Act.
IL5Act.>Drug
0
6,000
0
1,000
2,000
3,000
0
500
1,000
1,500
4,000
2,000
Drug>Act.
IL13Act.>Drug
Drug>Act.
IL4Act.>Drug Drug>Act.
IL10Act.>Drug
0
2,000
6,000
4,000
8,000
0
5,000
10,000
15,000
Drug>Act.
TFNαAct.>Drug Drug>Act.
IL8Act.>Drug
0
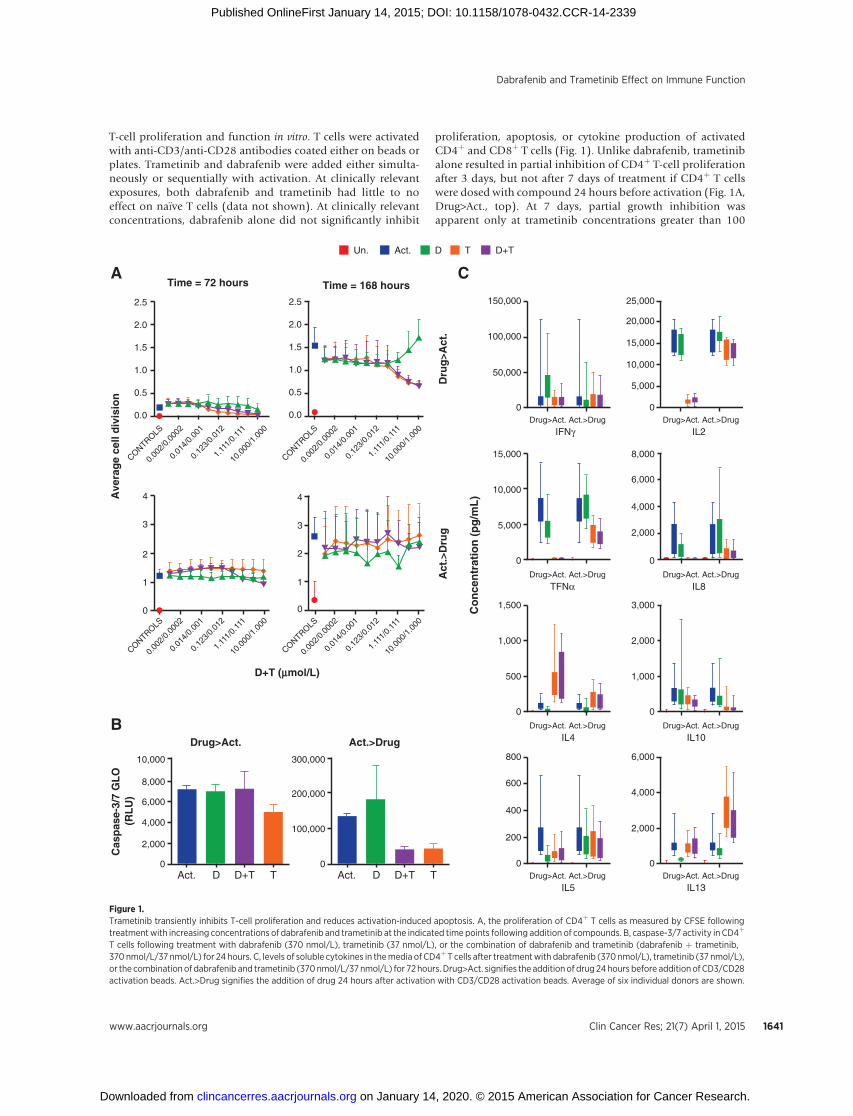
Figure 1.Trametinib transiently inhibits T-cell proliferation and reduces activation-induced apoptosis. A, the proliferation of CD4þ T cells as measured by CFSE followingtreatmentwith increasing concentrations of dabrafenib and trametinib at the indicated time points following addition of compounds. B, caspase-3/7 activity in CD4þ
T cells following treatment with dabrafenib (370 nmol/L), trametinib (37 nmol/L), or the combination of dabrafenib and trametinib (dabrafenib þ trametinib,370 nmol/L/37 nmol/L) for 24 hours. C, levels of soluble cytokines in themedia of CD4þ T cells after treatmentwith dabrafenib (370 nmol/L), trametinib (37 nmol/L),or the combination of dabrafenib and trametinib (370nmol/L/37nmol/L) for 72hours. Drug>Act. signifies the addition of drug 24hours before addition ofCD3/CD28activation beads. Act.>Drug signifies the addition of drug 24 hours after activation with CD3/CD28 activation beads. Average of six individual donors are shown.
Dabrafenib and Trametinib Effect on Immune Function
www.aacrjournals.org Clin Cancer Res; 21(7) April 1, 2015 1641
on January 14, 2020. © 2015 American Association for Cancer Research. clincancerres.aacrjournals.org Downloaded from
Published OnlineFirst January 14, 2015; DOI: 10.1158/1078-0432.CCR-14-2339

nmol/L, which is above clinical exposure levels. The partialinhibitory effect was not observed if CD4þ T cells were activatedbefore adding trametinib (Fig. 1A, Act.>Drug, bottom). Inaddition, treatment with trametinib alone (Drug>Act. andAct.>Drug) and in combination with dabrafenib (Act.>Drug)for 24 hours resulted in decreased activation-induced apoptosis(AID) measured by caspase-3/7 activity following T-cell acti-vation (Fig. 1B). This was despite similar levels of proliferationin T- and dabrafenib/trametinib–treated cells at the time andconcentration tested. The effects of trametinib on cytokineproduction were variable depending on the cytokine analyzed,resulting in little to no change (IFNg , IL5, and IL10), or partialinhibition of some cytokines (IL2, TNFa, and IL8), whileinducing expression of others (IL4) when it was added before(Fig. 1B, Drug>Act.) or simultaneously (data not shown) withT-cell activators. Observed cell growth inhibition and cytokinechanges by trametinib were transient and minimized if CD4þ Tcells were activated first (Fig. 1, Act.>Drug). In the setting oftrametinib and dabrafenib combination, the effects of trame-tinib appeared to dominate but were partially offset by dab-rafenib in some instances. Similar results were also observed inCD8þ cells (data not shown).
Dabrafenib and trametinib differentially affect the expressionlevels of pERK and a subset of genes/proteins in humanactivated T cells in vitro
Cell signaling critical to MAPK–PI3K–mTOR pathways wasmeasured in CD4þ and CD8þ cells and representative data areshown in Fig. 2A. Dabrafenib alone enhanced pERK expressionlevels, an observation consistent with previously reported para-doxical effects of BRAF inhibitors in BRAF wild-type (WT) cells(14); with no observed changes in pAKT and pS6 protein levels(Fig. 2A and data not shown). In contrast, trametinib alonereduced pERK levels, but not pAKT and pS6 expression levels, ascompared with controls (Fig. 2A and data not shown).
Furthermore, immune gene expression profiling using theNanoString nCounter gene expression system demonstratedunique gene signatures associated with both CD4þ and CD8þ
T-cell activation by anti-CD3/CD28 antibodies (Fig. 2B). Weidentified genes with expression levels changed equal to or greaterthan 3-fold upon activation. Of the 525 genes in the panel, inCD4þ T cells, 88 genes (17%) were upregulated and 55 genes(10%) were downregulated; however, in CD8þ T cells, 39 genes(7%) were upregulated and 88 genes (17%) were downregulated.Interestingly, more genes were downregulated in CD8 cells uponactivation, whereas more genes were upregulated in CD4 cells.Ontology enrichment indicated activation modulated sets ofgenes with specific functions related to the activity of the T-cellreceptors, accompanied by genes encoding cytokines, chemo-kines, as well as genes involved in cell proliferation, transcription,and growth (Supplementary Tables S2A, S2B, and S2C). Whentrametinib was added simultaneously with T-cell activators, itpartially offset the upregulation of 10 genes, CCL3, CCL4, GZMB,IL2, IL3, IL9, IL10, IL17A, IL17F, and IL23R, mostly cytokines andchemokines. It also enhanced the expression of three upregulatedcytokines, IL4, IL5, and IL13, while it attenuated the downregula-tion of FCER1A, MX1, and RARRES3 genes in CD4þ cells. Sim-ilarly, trametinib showed anoffset of 11 upregulated genes,CCL3,CCL4, GZMB, IFNG, IL2, IL3, LTA, CD82, IL1R1, TNF, and XCL1,and three downregulated genes CD244, CXCR4, and SIGIRR inCD8þ cells in response to T-cell activation. Dabrafenib alone had
little to no effect on activated CD4þ and CD8þ T cells. Noapoptosis genes, including CASP1, CASP8, BCL2, and TNFSF10(TRAIL),weremodulated by trametinib anddabrafenib alone andin combination. Other immunomodulatory genes associatedwith activated T cells [FOXP3, CD274 (PD-L1), TNFRSF4 (OX40),ICOS, CTLA4, TNFRSF9 (4-1BB), CD25, and IFNG] were notaffected substantially by dabrafenib and trametinib (< 2-fold) inCD4þ cells. However, OX40, ICOS, CTLA-4, 4-1BB, and IFNgwere partially reduced by trametinib alone and in combinationwith dabrafenib (�2-fold) in CD8þ cells. Both dabrafenib andtrametinib had little-to-no effect on na€�ve CD4þ and CD8þ T cells(data not shown).
Multicolor flow cytometry confirmed cell-surface expressionchanges of CD69, CD25, PD-1, OX40, and CTLA-4 in CD4þ andCD8þ cells (Fig. 2C and data not shown). Dabrafenib effectswere similar to vehicle control–treated samples. Treatment withtrametinib decreased the expression of CD25, CD69, OX40,and PD-1 in CD4þ and CD8þ T cells, and CTLA-4 in CD4þ
T cells only. However, the expression levels of CD69 and OX40in trametinib-treated cells were still well above nonactivatedT cells. Combining dabrafenib with trametinib partially offsetthe inhibitory effects seen with trametinib alone (Fig. 2C andSupplementary Tables S3A and S3B).
Dabrafenib and trametinib alone and in combination reducethe expression of tumor suppression factors and increase theexpression of HLA-class I molecules and tumor antigens inBRAF V600–mutant melanoma cell lines
To determine howMAPKpathway inhibition affects the expres-sion levels of immunoregulatory genes/proteins in BRAF V600Eor V600K–mutant melanoma cells, we first treated A375 mela-noma cells with dabrafenib and trametinib either alone or incombination with the absence and presence of IFNg . As shownin Fig. 3A, INFg was able to induce both PD-L1 and HLA-Aexpression in A375 cells. Dabrafenib and trametinib (either aloneor in combination) decreased PD-L1 and increasedHLA-A regard-less of IFNg exposure. Interestingly, the inhibition of PD-L1 bydabrafenib, trametinib, and dabrafenib þ trametinib was tran-sient in vitro, and did not track with the activation status ofthe pathway over time. In A375 cells treated with dabrafenib,trametinib, or dabrafenibþ trametinib over a 30-day time course,PD-L1mRNA levels increased steadily out to day 30 after an initialreduction through day 8 (Supplementary Fig. S3A). In contrast,DUSP6 mRNA levels, a reliable surrogate of MAPK activation,remained low throughout the 30-day time course (Supplemen-tary Fig. S3B), indicating an uncoupling of PD-L1 expression andMAPK activation status in cancer cells chronically exposed todabrafenib, trametinib, or dabrafenib þ trametinib. In addition,we observed that a number of BRAF inhibitor resistant clones(12R5-1, 12R5-3, 16R6-3, 16R5-5, and 16R6-4; ref. 13), whichdeveloped from the parental line A375, expressed high levels ofPD-L1 as determined by Western blot analysis, flow cytometry,and RT-PCR (Fig. 3A–B and C and data not shown). In A375dabrafenib-resistant clones, increased PD-L1 protein expressiontended to correlate with increased pSTAT levels (Fig. 3C), aresult which was consistent with a previous report (15). IFNgexpression was below the level of detection in all cell samplestested and adding IFNg did not further increase PD-L1 expres-sion in 12R5-1–resistant line (data not shown). In the 12R5-1cell line, PD-L1 expression was still partially responsive toMAPK pathway inhibition as PD-L1 mRNA levels were reduced
Liu et al.
Clin Cancer Res; 21(7) April 1, 2015 Clinical Cancer Research1642
on January 14, 2020. © 2015 American Association for Cancer Research. clincancerres.aacrjournals.org Downloaded from
Published OnlineFirst January 14, 2015; DOI: 10.1158/1078-0432.CCR-14-2339

by 39%, 34%, and 77%, respectively, in response to trametinib,dabrafenib, and dabrafenib þ trametinib treatment. We alsoused a NanoString custom-built codeset (302 genes) to mea-
sure the expression of genes including tumor antigens,HLA molecules as well as markers associated with immuno-modulation, apoptosis, and MAPK signaling in both A375 and
Baseli
ne0 h 6 h 24
h48
h
Baseli
ne0 h 6 h 24
h48
h
Baseli
ne0 h 6 h 24
h48
h
Baseli
ne0 h 6 h 24
h48
h
Baseli
ne0 h 6 h 24
h48
h
Baseli
ne0 h 6 h 24
h48
h
Baseli
ne0 h 6 h 24
h48
h
Baseli
ne0 h 6 h 24
h48
h
BA
C
Un.
10
8Unact.2 h24 h
pE
RK
/tE
RK
(% n
orm
aliz
ed)
pS
6/tS
6(%
no
rmal
ized
)
V D TD
+T V D TD
+T V D TD
+T
V D TD
+T V D TD
+T V D TD
+T
6
4
2
0
D+TTDAct.Un.D+TTDAct.
+3.0
-3.0
CD8CD4
80
60
Unact.2 h24 h
40
20
0
Act. D T D+T
0
10
20
30
40
50
60
70
80
90
0
20
40
60
80
100
120
0
5
10
15
20
25
30
35
40
45 PD-1CD69CD25
0
5
10
15
20
25
30
35 CTLA-4
Drug>Act.
Act.>Drug
CD
4+ C
D25
+ (%
)
0
20
40
60
80
100
120
0
10
20
30
40
50
60
70
80
90
0
10
20
30
40
50
60
70
80
0102030405060708090
100
CD
4+ C
D25
+ (%
)
Figure 2.Dabrafenib and trametinib differentially changed pERK and expression levels of a subset of genes/proteins, however, showed no/minimal impact on pS6 in humanactivated T cells in vitro. A, p-ERK and p-S6 levels were measured by MSD in CD4þ T cells treated with dabrafenib (300 nmol/L), trametinib (10 nmol/L), or thecombination of dabrafenib and trametinib (dabrafenib þ trametinib, dabrafenib/trametinib ¼ 300 nmol/L/10 nmol/L) in the absence (Unact.) and presenceof anti-CD3/CD28 activation bead for 2 and 24 hours. B, heatmap from representative genes. NanoString nCounter GX Human Immunology v2 Kit was used.Dabrafenib (300 nmol/L), trametinib (10 nmol/L), or dabrafenibþ trametinib (300 nmol/L/10 nmol/L) were added concurrently with CD3/CD28 activation beads toCD4þ and CD8þ T cells for 24 hours. C, time course of T-cell surfacemarker expression in CD4þ T cells following treatment with dabrafenib (100 nmol/L), trametinib(10 nmol/L), or dabrafenib þ trametinib (100 nmol/L/10 nmol/L). Drug>Act. signifies the addition of drug 16 hours before activation; Act.>Drug signifies theaddition of drug 16 hours after activation. Un, nonactivated T cells; Act, activated T cells.
Dabrafenib and Trametinib Effect on Immune Function
www.aacrjournals.org Clin Cancer Res; 21(7) April 1, 2015 1643
on January 14, 2020. © 2015 American Association for Cancer Research. clincancerres.aacrjournals.org Downloaded from
Published OnlineFirst January 14, 2015; DOI: 10.1158/1078-0432.CCR-14-2339
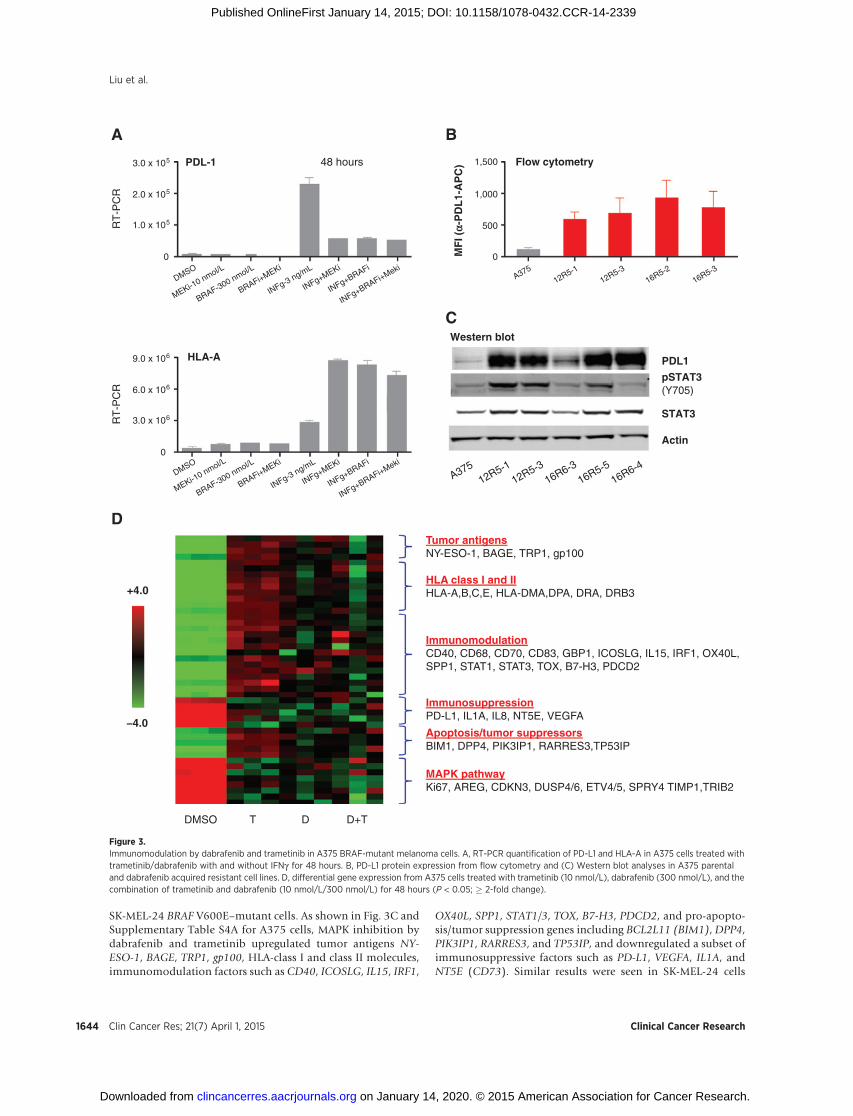
SK-MEL-24 BRAF V600E–mutant cells. As shown in Fig. 3C andSupplementary Table S4A for A375 cells, MAPK inhibition bydabrafenib and trametinib upregulated tumor antigens NY-ESO-1, BAGE, TRP1, gp100, HLA-class I and class II molecules,immunomodulation factors such as CD40, ICOSLG, IL15, IRF1,
OX40L, SPP1, STAT1/3, TOX, B7-H3, PDCD2, and pro-apopto-sis/tumor suppression genes including BCL2L11 (BIM1), DPP4,PIK3IP1, RARRES3, and TP53IP, and downregulated a subset ofimmunosuppressive factors such as PD-L1, VEGFA, IL1A, andNT5E (CD73). Similar results were seen in SK-MEL-24 cells
A
D
B
C
3.0 x 10⁵
2.0 x 10⁵
RT
-PC
R
PDL-1 Flow cytometry
Western blot
PDL1
pSTAT3 (Y705)
STAT3
Actin
MF
I (a-
PD
L1-
AP
C)
HLA-A
DMSO
MEKi-10 nmol/L
BRAF-300 nmol/L
BRAFi+MEKi
INFg-3 ng/mL
INFg+MEKi
INFg+BRAFi
INFg+BRAFi+Meki
12R5-112R5-3
16R6-316R5-5
16R6-4A375
DMSO
MEKi-10 nmol/L
BRAF-300 nmol/L
BRAFi+MEKi
INFg-3 ng/mL
INFg+MEKi
INFg+BRAFi
INFg+BRAFi+MekiA375
12R5-112R5-3
16R5-216R5-3
48 hours
0
1.0 x 10⁵
1,500
1,000
500
0
+4.0
-4.0
9.0 x 10⁶
6.0 x 10⁶
RT
-PC
R
0
3.0 x 10⁶
DMSO
MAPK pathwayKi67, AREG, CDKN3, DUSP4/6, ETV4/5, SPRY4 TIMP1,TRIB2
Apoptosis/tumor suppressorsBIM1, DPP4, PIK3IP1, RARRES3,TP53IP
ImmunosuppressionPD-L1, IL1A, IL8, NT5E, VEGFA
ImmunomodulationCD40, CD68, CD70, CD83, GBP1, ICOSLG, IL15, IRF1, OX40L, SPP1, STAT1, STAT3, TOX, B7-H3, PDCD2
HLA class I and IIHLA-A,B,C,E, HLA-DMA,DPA, DRA, DRB3
Tumor antigensNY-ESO-1, BAGE, TRP1, gp100
D+TDT
Figure 3.Immunomodulation by dabrafenib and trametinib in A375 BRAF-mutant melanoma cells. A, RT-PCR quantification of PD-L1 and HLA-A in A375 cells treated withtrametinib/dabrafenib with and without IFNg for 48 hours. B, PD-L1 protein expression from flow cytometry and (C) Western blot analyses in A375 parentaland dabrafenib acquired resistant cell lines. D, differential gene expression from A375 cells treated with trametinib (10 nmol/L), dabrafenib (300 nmol/L), and thecombination of trametinib and dabrafenib (10 nmol/L/300 nmol/L) for 48 hours (P < 0.05; � 2-fold change).
Liu et al.
Clin Cancer Res; 21(7) April 1, 2015 Clinical Cancer Research1644
on January 14, 2020. © 2015 American Association for Cancer Research. clincancerres.aacrjournals.org Downloaded from
Published OnlineFirst January 14, 2015; DOI: 10.1158/1078-0432.CCR-14-2339
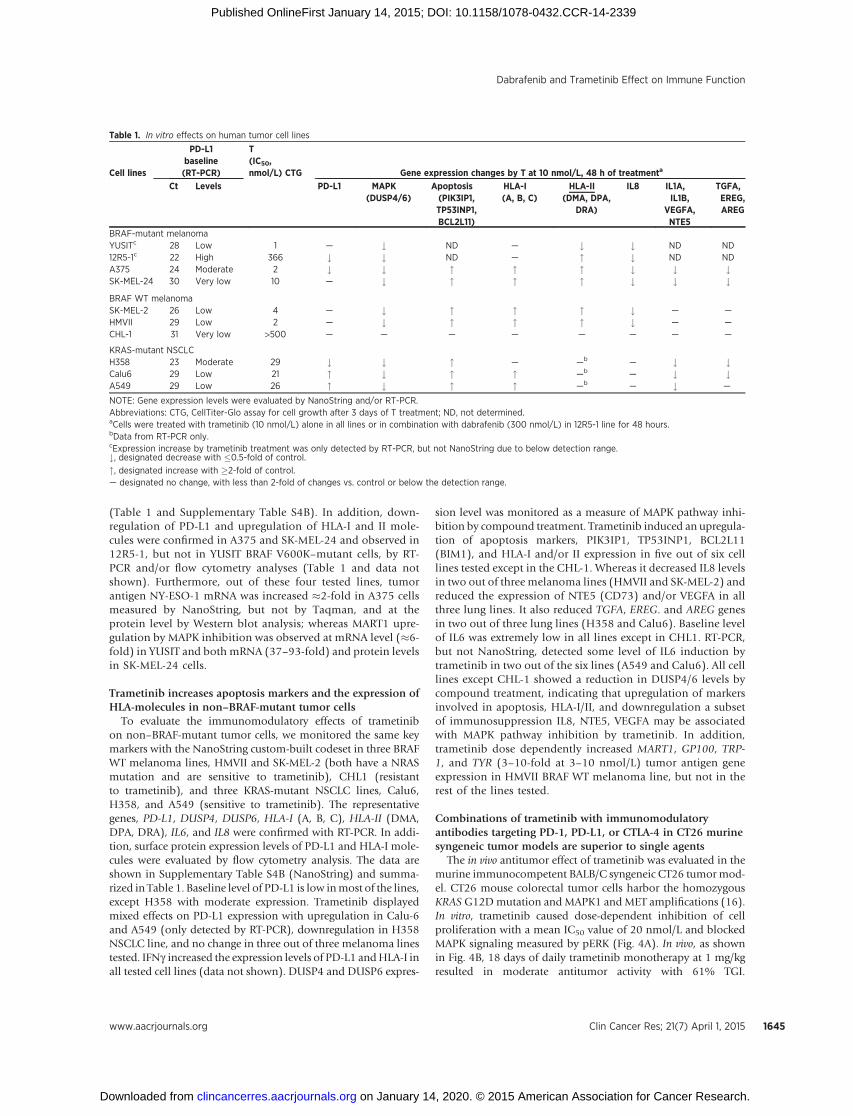
(Table 1 and Supplementary Table S4B). In addition, down-regulation of PD-L1 and upregulation of HLA-I and II mole-cules were confirmed in A375 and SK-MEL-24 and observed in12R5-1, but not in YUSIT BRAF V600K–mutant cells, by RT-PCR and/or flow cytometry analyses (Table 1 and data notshown). Furthermore, out of these four tested lines, tumorantigen NY-ESO-1 mRNA was increased �2-fold in A375 cellsmeasured by NanoString, but not by Taqman, and at theprotein level by Western blot analysis; whereas MART1 upre-gulation by MAPK inhibition was observed at mRNA level (�6-fold) in YUSIT and both mRNA (37–93-fold) and protein levelsin SK-MEL-24 cells.
Trametinib increases apoptosis markers and the expression ofHLA-molecules in non–BRAF-mutant tumor cells
To evaluate the immunomodulatory effects of trametinibon non–BRAF-mutant tumor cells, we monitored the same keymarkers with the NanoString custom-built codeset in three BRAFWT melanoma lines, HMVII and SK-MEL-2 (both have a NRASmutation and are sensitive to trametinib), CHL1 (resistantto trametinib), and three KRAS-mutant NSCLC lines, Calu6,H358, and A549 (sensitive to trametinib). The representativegenes, PD-L1, DUSP4, DUSP6, HLA-I (A, B, C), HLA-II (DMA,DPA, DRA), IL6, and IL8 were confirmed with RT-PCR. In addi-tion, surface protein expression levels of PD-L1 and HLA-I mole-cules were evaluated by flow cytometry analysis. The data areshown in Supplementary Table S4B (NanoString) and summa-rized in Table 1. Baseline level of PD-L1 is low inmost of the lines,except H358 with moderate expression. Trametinib displayedmixed effects on PD-L1 expression with upregulation in Calu-6and A549 (only detected by RT-PCR), downregulation in H358NSCLC line, and no change in three out of three melanoma linestested. IFNg increased the expression levels of PD-L1 andHLA-I inall tested cell lines (data not shown). DUSP4 and DUSP6 expres-
sion level was monitored as a measure of MAPK pathway inhi-bition by compound treatment. Trametinib induced an upregula-tion of apoptosis markers, PIK3IP1, TP53INP1, BCL2L11(BIM1), and HLA-I and/or II expression in five out of six celllines tested except in the CHL-1. Whereas it decreased IL8 levelsin two out of three melanoma lines (HMVII and SK-MEL-2) andreduced the expression of NTE5 (CD73) and/or VEGFA in allthree lung lines. It also reduced TGFA, EREG. and AREG genesin two out of three lung lines (H358 and Calu6). Baseline levelof IL6 was extremely low in all lines except in CHL1. RT-PCR,but not NanoString, detected some level of IL6 induction bytrametinib in two out of the six lines (A549 and Calu6). All celllines except CHL-1 showed a reduction in DUSP4/6 levels bycompound treatment, indicating that upregulation of markersinvolved in apoptosis, HLA-I/II, and downregulation a subsetof immunosuppression IL8, NTE5, VEGFA may be associatedwith MAPK pathway inhibition by trametinib. In addition,trametinib dose dependently increased MART1, GP100, TRP-1, and TYR (3–10-fold at 3–10 nmol/L) tumor antigen geneexpression in HMVII BRAF WT melanoma line, but not in therest of the lines tested.
Combinations of trametinib with immunomodulatoryantibodies targeting PD-1, PD-L1, or CTLA-4 in CT26 murinesyngeneic tumor models are superior to single agents
The in vivo antitumor effect of trametinib was evaluated in themurine immunocompetent BALB/C syngeneic CT26 tumor mod-el. CT26 mouse colorectal tumor cells harbor the homozygousKRASG12Dmutation and MAPK1 and MET amplifications (16).In vitro, trametinib caused dose-dependent inhibition of cellproliferation with a mean IC50 value of 20 nmol/L and blockedMAPK signaling measured by pERK (Fig. 4A). In vivo, as shownin Fig. 4B, 18 days of daily trametinib monotherapy at 1 mg/kgresulted in moderate antitumor activity with 61% TGI.
Table 1. In vitro effects on human tumor cell lines
Cell lines
PD-L1baseline(RT-PCR)
T(IC50,nmol/L) CTG Gene expression changes by T at 10 nmol/L, 48 h of treatmenta
Ct Levels PD-L1 MAPK(DUSP4/6)
Apoptosis(PIK3IP1,TP53INP1,BCL2L11)
HLA-I(A, B, C)
HLA-II(DMA, DPA,
DRA)
IL8 IL1A,IL1B,
VEGFA,NTE5
TGFA,EREG,AREG
BRAF-mutant melanomaYUSITc 28 Low 1 — # ND — # # ND ND12R5-1c 22 High 366 # # ND — " # ND NDA375 24 Moderate 2 # # " " " # # #SK-MEL-24 30 Very low 10 — # " " " # # #BRAF WT melanomaSK-MEL-2 26 Low 4 — # " " " # — —
HMVII 29 Low 2 — # " " " # — —
CHL-1 31 Very low >500 — — — — — — — —
KRAS-mutant NSCLCH358 23 Moderate 29 # # " — —b — # #Calu6 29 Low 21 " # " " —b — # #A549 29 Low 26 " # " " —b — # —
NOTE: Gene expression levels were evaluated by NanoString and/or RT-PCR.Abbreviations: CTG, CellTiter-Glo assay for cell growth after 3 days of T treatment; ND, not determined.aCells were treated with trametinib (10 nmol/L) alone in all lines or in combination with dabrafenib (300 nmol/L) in 12R5-1 line for 48 hours.bData from RT-PCR only.cExpression increase by trametinib treatment was only detected by RT-PCR, but not NanoString due to below detection range.#, designated decrease with �0.5-fold of control.
", designated increase with �2-fold of control.— designated no change, with less than 2-fold of changes vs. control or below the detection range.
Dabrafenib and Trametinib Effect on Immune Function
www.aacrjournals.org Clin Cancer Res; 21(7) April 1, 2015 1645
on January 14, 2020. © 2015 American Association for Cancer Research. clincancerres.aacrjournals.org Downloaded from
Published OnlineFirst January 14, 2015; DOI: 10.1158/1078-0432.CCR-14-2339

Anti-mouse PD-1, PD-L1, and CTLA-4 antibodies dosed aloneshowed minimal to low efficacy with 2%, 18%, and 32% TGIrespectively. However, concurrent combinations beginning withthe first dose of trametinib with anti-mouse PD-1, PD-L1, or
CTLA4 antibodies demonstrated much more profound activitywith 80%, 81%, and 84% TGI, respectively. No overt toxicity, asdefined by weight loss, unkempt appearance, mortality andbehavior, was observed in any of the groups during the course
D
Days of treatment
Su
rviv
al (
%)
14
)syad( 868111-End of study
UntreatedVeh+IgG2aPD-1-1st
PD-1-2ndMEKi-1st
MEKi-1stPD-1-1st
CT26 cellimplant
PD-1-2ndMEKi-2nd
MEKi-2nd
PD-1-1st+MEKi-2ndMEKi-1st+PD-1-1stMEKi-1st+PD-1-2nd
100
80
60
40
20
028 42
* P
< 0
.05
* P
< 0
.05
*
56 700
C
Days of treatment
Tu
mo
r vo
lum
e (m
m3)
7
2,000
1,500
1,000
500
014 210
UntreatedVeh+IgG2aPD-1-1st
PD-1-2ndMEKi-1stMEKi-2nd
PD-1-1st+MEKi-2ndMEKi-1st+PD-1-1stMEKi-1st+PD-1-2nd
68 Days of treatment
61 Days of treatment
B
Days of treatment
Tu
mo
r vo
lum
e (m
m3 )
7
2,500 Rat-I gG2bα-PD-1α-PD-L1α-CTLA4TT+α-PD-1T+α-PD-L1T+α-CTLA4
1,500
2,000
1,000
500
014 210
A
Trametinib (nmol/L)
Cel
l pro
lifer
atio
n(%
veh
icle
co
ntr
ol)
0.1
100
75
50nmol/L1030
IC50 = 20 ± 16 nmol/L
25
01001010
pErk
Erk
Figure 4.Antitumor activity by trametinib alone and/or in combination with immunomodulators targeting PD-1, PD-L1, or CTLA4 in the CT26 murine syngeneic model. A,in vitro cell growth and pERK inhibition by trametinib in CT26 cells. B, in vivo antitumor growth efficacy. Treatments began at day 12 after cell implant.Mice (n ¼ 10 per group) were treated with vehicle (0.5% HPMC, 0.2% Tween-80, pH 7.0) or trametinib at 1 mg/kg orally once daily for 21 days,or with antibodies rat-IgG2a, a-mouse PD-1 (RMP1-14 clone, rat IgG2a), a-mouse PD-L1 (10F.9G2 clone, rat IgG2b), or a-mouse CTLA-4 (9D9 clone, mouseIgG2b) at 10 mg/kg, i.p. twice weekly for 3 weeks. C, tumor growth inhibition by treatment after initial 3 weeks of treatment. D, Kaplan–Meier survival curves ofdifferent treatment groups. Treatments began on day 11 after tumor cell implantation, indicated as day 1 of drug treatment for trametinib (MEK-1st) anda-PD-1 (PD-1-1st), or on day 18 after tumor cell implantation, indicated as day 8 of drug treatment for trametinib (MEK-2nd) and a-PD-1 (PD-1-2nd).Mice (n¼ 10 per group) were treated with trametinib at 1 mg/kg orally one daily, or with antibodies rat-IgG2a or a-mouse PD-1 (RMP1-14 clone) at 10 mg/kg i.p.twice weekly until tumors reached the endpoint of 2,000 mm3 or by study end.
Liu et al.
Clin Cancer Res; 21(7) April 1, 2015 Clinical Cancer Research1646
on January 14, 2020. © 2015 American Association for Cancer Research. clincancerres.aacrjournals.org Downloaded from
Published OnlineFirst January 14, 2015; DOI: 10.1158/1078-0432.CCR-14-2339
A
B
D
C
Untreated
17.7%
40.4%
35.9%
20.6%
33.2%
30.5%
25.5%
18.7%
24%
21.7%
58.2%
Lymphocytes % in tumor
Untreated
IgG2a
α-PD-1
MEK
α-PD-1+MEK
Untreated IgG2a
pERK
tERK
α-PD-1 MEKα-PD-1+MEK
CD
4 F
ITC
-A
CD8 APC-Cv7-A
IgG2a MEK a-PD-1
102 103 104 105
102
103
104
105
102 103 104 105
102
103
104
105
102 103 104 10510
210
310
410
5102 103 104 105
102
103
104
105
102 103 104 105
102
103
104
105
CD
25 A
PC
-A
To
tal c
ell f
rom
tu
mo
r (%
)
Foxp3 PE-A102 103 104 105
102
103
104
105
102 103 104 105
102
103
104
105
102 103 104 105
102
103
104
105
102 103 104 105
102
103
104
105
102 103 104 105
102
103
104
105
0
4
8
12
16
UntreatedIgG2aTα-PD-1T+α-PD-1
CD8+CD4+CD3+Lymphocytes
* *
*
Csf
1r *
Pdg
frb
**Ic
osl *
Cx3
cr1
II11r
a1 *
*T
gfb3
**
Fcg
rt *
*Il1
2a *
*C
d79b
**
Cd2
2 **
C1s
**
C1r
a **
Bat
f3 *
H2E
aps
*C
d74
*H
2-E
b1 *
Cd4
*II1
2b *
*C
xcr3
*C
cl22
*C
cr7
*C
d7 *
Gzm
bC
fdC
d36
Cxc
l9C
xcl1
1C
d274
Cxc
l10
C3
Cxc
l12
Il2ra
Ccl
5C
cl8
Cd2
09g
Il33
**T
nfai
p6C
cl11
Cd1
63 *
*T
gfbi
**
Mif
*Il1
rl1 *
*C
cl2
**M
apk1
1 **
Cxc
r2 *
*C
cl3
Il1rn
*T
nfrs
f9 *
Nfil
3 **
Il1b
**S
100a
9 **
S10
0a8
**Il1
r2 *
Tnf
**
Sel
l **
Ccl
4 **
Cle
c4e
**Lt
b4r1
**
Cxc
l3Tr
em1
Ccl
6 **
Ccl
9 **
Msr
1 **
Ccl
7 **
Pla
u **
Cxc
l1C
eaca
m1
*Il1
8rap
**
Cd1
4 **
Ptg
s2 *
*C
dkn1
a **
Ptp
n22
*C
cl12
**
Sel
e **
Itga6
**
Pla
ur *
*C
d44
**
2.50-2.50||||||
%6.63%1.14%1.43%7.14
MEK/a-PD-1
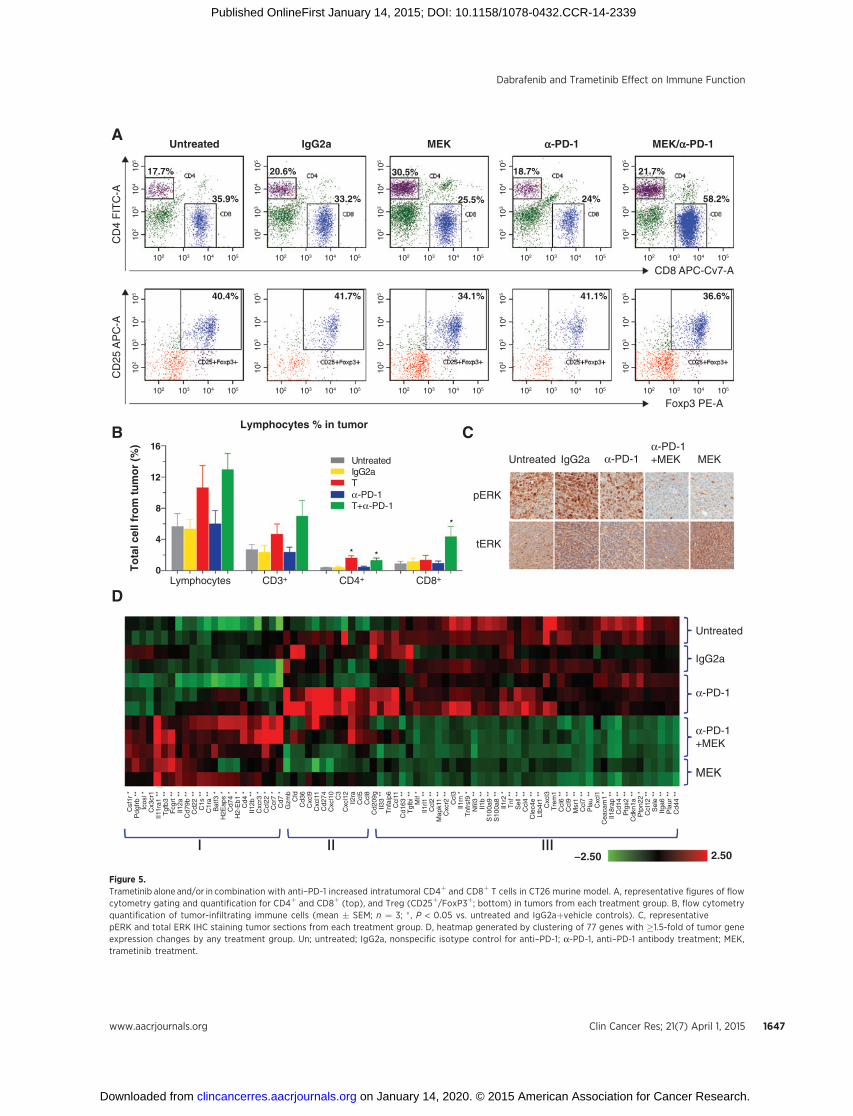
Figure 5.Trametinib alone and/or in combination with anti–PD-1 increased intratumoral CD4þ and CD8þ T cells in CT26 murine model. A, representative figures of flowcytometry gating and quantification for CD4þ and CD8þ (top), and Treg (CD25þ/FoxP3þ; bottom) in tumors from each treatment group. B, flow cytometryquantification of tumor-infiltrating immune cells (mean � SEM; n ¼ 3; � , P < 0.05 vs. untreated and IgG2aþvehicle controls). C, representativepERK and total ERK IHC staining tumor sections from each treatment group. D, heatmap generated by clustering of 77 genes with �1.5-fold of tumor geneexpression changes by any treatment group. Un; untreated; IgG2a, nonspecific isotype control for anti–PD-1; a-PD-1, anti–PD-1 antibody treatment; MEK,trametinib treatment.
Dabrafenib and Trametinib Effect on Immune Function
www.aacrjournals.org Clin Cancer Res; 21(7) April 1, 2015 1647
on January 14, 2020. © 2015 American Association for Cancer Research. clincancerres.aacrjournals.org Downloaded from
Published OnlineFirst January 14, 2015; DOI: 10.1158/1078-0432.CCR-14-2339

of treatment. The above data indicate that concurrent combina-tionsof trametinibwith immunomodulatory antibodies targetingPD-1, PD-L1, and CTLA-4 potentiate antitumor activity as com-pared with the single agents at their tolerated doses.
Next, we explored whether the combination of trametinibwith the anti–PD-1 antibody in different lead-in sequenceswould affect in vivo efficacy. As shown in Fig. 4C and D andSupplementary Fig. S1 (tumor growth curves from individualmice), three combination regimens were evaluated: trametiniband anti–PD-1 antibody given concurrently starting in the firstweek (MEK-1stþPD-1-1st); trametinib given in the first week assingle agent followedby adding anti–PD-1 antibody in the secondweek with continued trametinib dosing (MEK-1stþPD-1-2nd);and anti–PD-1 antibody given in the first week as single agentfollowed by adding trametinib in the secondweekwith continuedanti–PD-1 dosing (PD-1-1stþMEK-2nd). All three combinationregimens showed inhibition of tumor growth more effectivelythan their single-agent controls during the initial 2 to 3 weeks oftreatment (Fig. 4C). However, only two of three combinationtreatment groups, concurrent MEK-1stþPD-1-1st and trametiniblead-in followed by trametinib þ PD-1 (MEK-1stþPD-1-2nd)produced profound delay in median tumor growth with TTE of39 and 49 days, two out of 10 and four out of 10 68-day survivors,respectively, at the endof the study, anddiffered significantly fromuntreated and vehicle/isotype controls by log-rank survival anal-ysis (P < 0.05; Fig. 4D). Conversely, all PD-1-1stþMEK-2ndshowedminimal benefit in long-term survival. Finally, it is worthnoting that both PD-1-1stmonotherapy and PD-1-1stþMEK-2ndtreated groups had one out of 10 68-day survivors althoughmajority of the groups showed no response. All treatments werewell tolerated.
Trametinib alone or in combination with anti–PD-1 antibodyin vivo reduced immunosuppression factors, increasedHLA-class II genes and lead to increased intratumoralCD4þ andCD8þ T cells
Given that trametinib can potentiate the efficacy of immuno-modulators in vivo, we investigated potential immunomodulato-ry mechanisms of trametinib in combination with an anti–PD-1blocking antibody in lymphocyte tissues andCT26 tumors in vivo.We collected whole blood, tumors, spleens, and lymph nodesafter 7 days of treatment with trametinib and anti–PD-1 antibodyalone, or in concurrent combination. In tumors, trametinib aloneand in combination with anti–PD-1 antibody, but not anti–PD-1antibody alone, significantly increased CD4þ T cells by 4.3- and3.4-fold, respectively, compared with untreated and nonspecificIgG2a controls (P < 0.05) measured by flow cytometry (Fig. 5Aand B and Supplementary Table S5). Only the combinationof trametinib and anti–PD-1 antibody significantly increasedCD8þ T cells by 4.7-fold vs. untreated (P < 0.05) and 3.6-foldvs. non-specific IgG2a control (P ¼ 0.05; Fig. 5B). CD69þ cellsfrom CD4þ population were reduced by 53% from trametinibtreatment (P < 0.05 vs. untreated). CD69þ cells from CD8þ
population were reduced by 57% from the combination oftrametinib with anti–PD-1 antibody (P < 0.05 vs. untreated).Other immune cell subtypes, such as Treg, measured by Foxp3þ
/CD25þ from CD4þ population, PD-1þ, PD-L1þ, OX40þ, andICOSþ frombothCD4þ andCD8þ cells were changed less than 2-fold or not statistically significant (P > 0.05) by any treatment(Supplementary Table S5). Therewere no significant alterations inthe numbers and expression levels of CD3þ, CD4þ, CD25þ,
CD69þ, and PD-1þ cells from spleens and lymph nodes (datanot shown). Of note, these immune surface markers and circu-lating cytokines from peripheral blood samples were variablefrom mouse to mouse, and marginally (< 2-fold) or not signif-icantly affected by any treatment in the study (data not shown).IHC analysis revealed that treatment with trametinib alone and incombination with anti–PD-1 antibody led to 70% to 75% inhi-bition of pERK in the tumor (Fig. 5C and Supplementary TablesS5A and S5B), demonstrating effectiveMAPK signaling inhibitionby trametinib in the CT26 tumor model in immunocompetentmice.
In addition, tumor gene expression was profiled using a Nano-String-based immunology panel and follow-up with quantitativeRT-PCR (qRT-PCR). Among the 561 mouse genes profiled, 77showed a �1.5-fold change by trametinib, anti–PD-1, or thecombination of the two in comparison with untreated andnon-specific IgG2a controls (Supplementary Table S6). A heat-map was generated by gene clustering of these 77 genes (Fig. 5D).The group I genes are those upregulated by trametinib alone and/or trametinib in combinationwith anti–PD-1but not by anti–PD-1 alone. Interestingly, three MHC class II genes, H2-Ea-ps, CD74,and H2-Eb1, along with CD4 and IL12b were upregulated mostsignificantly by the combination treatment. Group II includes 12genes mainly associated with T-cell IFNg inducible cytotoxicfactor (GZMB), immunoregulators (CD274-PD-L1 and IL2RA-CD25), chemokines (CXCL9, CXCL11, CXCL10, CXCL12,CCL5-RENTES, and CCL8-MCP-1), and other immune factors(CFD, CD36, and C3). Although not statistically significant,tumors from 2 out of 3 mice treated with anti–PD-1 antibodyalone showed unique and noticeable upregulation of all of thesegenes, implying a gene signature of anti–PD-1 effect on tumors.Group III has 42 genes that were downregulated by trametinibalone and in combination with anti–PD-1. These genes includesinflammation factors (e.g., SELE-E-selectin, PTGS2-COX-2, MIF,TNF, and PLAUR), chemokines (CCL2,CCL3,CCL4,CCL6,CCL7,CCL9, CCL11, CCL12, CXCL1, CXCL3, and CXCR2), pro-inflam-matory IL1 family cytokines mostly associated with immunosup-pression (IL33, IL1Rl1, IL1RN, IL1B, IL1R2, and IL18RAP), tumormetastasis factors (S100A8 and S100a9, PLAU, and ITGA6),markers associated with immunosuppression (TGFB1), and mar-kers for monocytes (CD163 and CD14), macrophage and den-dritic cells (MSR1 and CD209G) and myeloid cells (TREM1). Afew selected genes were further evaluated using qRT-PCR that hasmore sensitive detection and showed consistent results withNanoString. As illustrated in Supplementary Fig. S2, anti–PD-1antibody increased IFNG and GZMB by itself, and PD-L1, ICOS,and CTLA-4 with and without trametinib. Only the combinationof trametinib and anti–PD-1 increased CD4, OX40, and PD-1.trametinib alone and in combination with anti–PD-1 showedreduction of CCL2 (consistent with NanoString data), DUSP6(correlated with pERK IHC) and IL6 (only detected by RT-PCR;Supplementary Fig. S2).
All data generated demonstrated that trametinib in concurrentcombination with anti–PD-1 downregulated immunosuppres-sion factors, upregulated HLA molecules, and increased immuneresponse in tumors with little or no immune phenotypical/func-tional changes from circulating cell populations and immuneorgans in vivo. All of these effects contribute to and support therationale that trametinib in combination with immunomodula-tory antibodies targeting PD-1, PD-L1, and CTLA-4 is a moreeffective antitumor therapeutic approach.
Liu et al.
Clin Cancer Res; 21(7) April 1, 2015 Clinical Cancer Research1648
on January 14, 2020. © 2015 American Association for Cancer Research. clincancerres.aacrjournals.org Downloaded from
Published OnlineFirst January 14, 2015; DOI: 10.1158/1078-0432.CCR-14-2339
DiscussionAlthough the mechanisms of action for BRAF and MEK inhi-
bitors, such as dabrafenib and trametinib, regarding tumor-growth inhibition are well studied, their impact on immune cellsand the tumor microenvironment is less understood. Preclinicaland limited clinical findings have suggested that immunomod-ulatory effects in the tumormicroenvironment and on circulatingimmune cells by a BRAF inhibitor alone and the combination ofa BRAF inhibitor with a MEK inhibitor is context-dependent(8, 17–20). On the other hand, concerns have been raised regard-ing the potential immunosuppressive activity of MEK inhibitorsdue to their immunosuppressive activity in vitro (10). However,the studies havebeen limited in scope and lack in vivo validation inmouse models. Here, we present data showing that the immu-nomodulatory effects of trametinib on activated T cells weremultifaceted and context dependent. Changes that could beconsidered immunosuppressive were only observed in vitro, weretransient, and did not translate in vivo using an immunocompe-tent mouse tumor model. The differences between data from thisstudy and those of prior reports may be explained by a number offactors, including: (i) the in vitro experiments done by others had ashort period of time exposure to MEK inhibitors without mon-itoring longer-term effects, therefore only the transient suppres-sive activity byMAPK inhibitionwas captured; (ii)MEK inhibitorstransiently block the MAPK signaling during the initial T-cellactivation, thus delay the kinetics of T-cell activation and cytokinesecretion in vitro; (iii) the circulating T cells collected in vivo aremostly in a na€�ve state, reflected in this study by the lownumber ofactivated T cells fromblood and immuneorganswith andwithoutanti–PD-1 antibody treatment inmice andmuch less active than Tcells activated by anti-CD3/CD28 in vitro.Our preclinical data arecomplementary to the recent report showing that both dabrafeniband trametinib alone or the combination increased tumor infil-tration of lymphocytes, and enhanced the antitumor effect withadoptive T-cell immunotherapy in the syngeneic murine modelof BRAF V600E–mutant melanoma (21). Our studies indicatethat trametinib alone increases tumor infiltrating CD4þ lympho-cytes (TIL), does not negatively affect the prevalence of CD8þ TILswhile significantly increasing CD8þ TILs when combined withanti–PD-1 antibody. Most importantly, combining trametinibwith anti–PD-1 either concurrently or in phased sequence, withtrametinib administered first followed by trametinib plus anti–PD-1, resulted in much more effective and durable antitumoractivity than both single agents in the KRAS-mutant CT26 colo-rectal tumor syngeneic mouse model. Interestingly, phasedsequence of anti–PD-1 antibody dosed first, followed by anti–PD-1 antibody plus trametinib showed minimal benefit in long-term survival compared with single-agent treatment. The obser-vation suggests that blockage of oncogenic MAPK signaling bytrametinib is critical and effective to prime and synergize tumorsin response to immunotherapy through the induction of apo-ptosis markers, upregulation of HLA molecules, and reductionof immunosuppression factors from tumors. Our data supportthe rationale to evaluate the sequencing of these agents, includ-ing giving the targeted therapy as a lead-in to an immunomod-ulatory antibody or concurrently in clinical trial design tomaximize antitumor efficacy and with the hope of minimizingside effects.
Our data show that PD-L1 was not only induced by IFN-g in allcell lines tested, but was also upregulated in cell lines withacquired resistance to dabrafenib. Conversely, dabrafenib, trame-
tinib, and the combination partially downregulated PD-L1expression in a subset, but not all cell lines tested, an observationsimilar todata from recent publications (15, 22, 23). Interestingly,we also observed that trametinib could induce PD-L1 expressionin two of the NSCLC lines with low baseline level of PD-L1expression. Our data in A375 cells chronically exposed to dabra-fenib, trametinib, or dabrafenibþ trametinib, suggests that PD-L1expression may be regulated via a compensatory pathway inresponse to sustained inhibition of MAPK signaling. Althoughthe mechanisms of PD-L1 regulation appear to be multifactorial,MAPK signaling and feedback regulation by MAPK inhibitionlikely contribute, in part, to the expression levels of PD-L1 intumors. However, PD-L1 expression level could be affected bymultiple pathways including the MAPK pathway, and the changeof PD-L1 expression is accompaniedbymultiple other genetic andmorphologic changes that collectively contribute to tumor growthandmetastasis (24). As a result, PD-L1may serve as a marker, butmay not be the driver determining patient response to BRAFinhibitor treatment. Future studies should further investigate thecompensatory pathways responsible for PD-L1 regulation in thecontext of MAPK inhibition. As reported, during the initial treat-ment with either BRAF inhibitor alone or BRAF þMEK inhibitorin patients BRAF-mutantmelanoma, both PD-L1 andCD8þ T-cellinfiltrates were increased in treated tumors (18). However, CD8þ
T-cell infiltrates declined when these patients progressed from thetreatment. It was also noted that PD-L1 expression increasedwhen patients became refractory to BRAF or BRAF þ MEK inhib-itor treatment. The evidence of PD-L1 modulation data fromboth preclinical and clinical studies indicates that upregulationof PD-L1may be amarker of acquired resistance to BRAF,MEK, orBRAFþMEK inhibition, and may provide rationale for PD-L1inhibitor use in BRAF-resistant patients.
In this study, we also demonstrated that inhibition of MAPKby trametinib, dabrafenib, or the combination of trametiniband dabrafenib in BRAF-mutant melanoma and trametinib inBRAF WT melanoma and NSCLC lines increased the expressionof apoptosis markers and HLA-class I and/or II molecules anddecreased a subset of immunosuppression factors in vitro. Theincrease of apoptosis markers PIK3IP1, TP53INP1, andBCL2L11 (BIM1) may sensitize tumor cell killing by cytotoxicT cells. Tumor cells secrete IL1, IL8, and VEGFA soluble factorsto induce immunosuppression (25, 26). NTE5 (CD73) gene ishighly expressed in many human solid tumors. It encodes anectoenzyme generating extracellular adenosine that inducespotent immunosuppressive effects and impaired anti-tumorT-cell responses (27, 28). EGFR ligands, such as TGFA, EREG,and AREG, can activate EGFR, promote tumor metastasis, andenhance regulatory T cell-suppressive function via the EGFR(29). HLA-class I molecules are often downregulated or lost intumor cells and play a key role in immune escape (30–32). Astudy by Carreteto and colleagues (33) showed that higher HLAclass I gene expression was observed in regressing but not inprogressing metastases from microdissected tumor regions,supporting the idea that the nature of HLA class I alterationsin tumor cells may contribute to antitumor effects of thera-peutic interventions. Our observation of MAPK inhibitioninduced apoptosis, increase of MHC class I and/or II alongwith the decrease of immunosuppression factors in most of thehuman tumor cell lines, and in CT26 tumors when combinedwith anti–PD-1 antibody in vivo is intriguing. These effects maypotentially increase immune response when MAPK pathway
Dabrafenib and Trametinib Effect on Immune Function
www.aacrjournals.org Clin Cancer Res; 21(7) April 1, 2015 1649
on January 14, 2020. © 2015 American Association for Cancer Research. clincancerres.aacrjournals.org Downloaded from
Published OnlineFirst January 14, 2015; DOI: 10.1158/1078-0432.CCR-14-2339
inhibitors combine with immunotherapy and may lead totherapeutic synergy.
These data taken together further expand the understanding ofBRAF and MEK inhibitor effects on the immune system andprovide scientific evidence to support the investigation of thecombination of trametinib, with or without dabrafenib, withimmunomodulators in the clinic. Clinical studies are under wayto test the combination of these important agents in patients withmetastatic melanoma.
Disclosure of Potential Conflicts of InterestA. Hoos and J. Jing have ownership interests (including patents) in
GlaxoSmithKline. No potential conflicts of interest were disclosed by theother authors.
Authors' ContributionsConception and design: L. Liu, P.A. Mayes, S. Eastman, H. Shi, J. Yang,J. Smothers, A. HoosDevelopment of methodology: L. Liu, P.A. Mayes, S. Eastman, H. Shi,S. Yadavilli, T. Zhang, L. Seestaller-WehrAcquisition of data (provided animals, acquired and managed patients,provided facilities, etc.): L. Liu, S. Eastman, H. Shi, S. Yadavilli, L. Seestaller-Wehr, S.-Y. Zhang, L. Tsvetkov, A. Hoos
Analysis and interpretation of data (e.g., statistical analysis, biostatistics,computational analysis): L. Liu, P.A. Mayes, S. Eastman, H. Shi, S. Yadavilli,T. Zhang, J. Yang, S.-Y. Zhang, C. Hopson, L. Tsvetkov, J. Jing, S. Zhang, A. HoosWriting, review, and/or revision of the manuscript: L. Liu, P.A. Mayes,S. Eastman, H. Shi, T. Zhang, J. Yang, L. Seestaller-Wehr, S.-Y. Zhang, C. Hopson,J. Jing, J. Smothers, A. HoosAdministrative, technical, or material support (i.e., reporting or organizingdata, constructing databases): L. LiuStudy supervision: L. Liu, P.A. Mayes, J. Yang, A. Hoos
AcknowledgmentsThe authors thank Amber Anderson, Vivian Zhang, Bao Hoang, Yaobin Liu,
Meixia Bi, David Kilian (GlaxoSmithKline), Xiaoyu Pan, DrewMPardoll (JohnsHopkins University, Baltimore, MD), and Lisa Dauffenbach (Mosaic Labora-tories) for their technical and consultation assistance.
Grant SupportThis study was financially supported by GlaxoSmithKline.The costs of publication of this articlewere defrayed inpart by the payment of
page charges. This article must therefore be hereby marked advertisement inaccordance with 18 U.S.C. Section 1734 solely to indicate this fact.
Received September 19, 2014; revisedDecember 4, 2014; acceptedDecember23, 2014; published OnlineFirst January 15, 2015.
References1. Mackiewicz-Wysocka M, Zolnierek J, Wysocki PJ. New therapeutic options
in systemic treatment of advanced cutaneous melanoma. Expert OpinInvestig Drugs 2013;22:181–90.
2. Pardoll DM. The blockade of immune checkpoints in cancer immuno-therapy. Nat Rev Cancer 2012;12:252–64.
3. Dudek AM, Garg AD, Krysko DV, De Ruysscher D, Agostinis P. Inducers ofimmunogenic cancer cell death. Cytokine Growth Factor Rev 2013;24:319–33.
4. Yaguchi T, Sumimoto H, Kudo-Saito C, Tsukamoto N, Ueda R, Iwata-Kajihara T, et al. The mechanisms of cancer immunoescape and develop-ment of overcoming strategies. Int J Hematol 2011;93:294–300.
5. Menzies AM, Long GV. Dabrafenib and trametinib, alone and in combi-nation for BRAF-mutant metastatic melanoma. Clin Cancer Res 2014;20:2035–43.
6. Forde PM, Reiss KA, Zeidan AM, Brahmer JR. What lies within: novelstrategies in immunotherapy for non-small cell lung cancer. Oncologist2013;18:1203–13.
7. Merelli B, Massi D, Cattaneo L, Mandal�a M. Targeting the PD1/PD-L1 axisin melanoma: biological rationale, clinical challenges and opportunities.Crit Rev Oncol 2014;89:140–65.
8. Hong DS, Vence L, Falchook G, Radvanyi LG, Liu C, Goodman V, et al.BRAF(V600) inhibitor GSK2118436 targeted inhibition ofmutant BRAF incancer patients does not impair overall immune competency. Clin CancerRes 2012;18:2326–35.
9. Koya RC, Mok S, Otte N, Blacketor KJ, Comin-Anduix B, Tumeh PC, et al.BRAF inhibitor vemurafenib improves the antitumor activity of adoptivecell immunotherapy. Cancer Res 2012;72:3928–37.
10. Vella LJ, Pasam A, Dimopoulos N, Andrews M, Knights A, Puaux AL, et al.MEK inhibition, alone or in combination with BRAF inhibition, affectsmultiple functions of isolated normal human lymphocytes and dendriticcells. Cancer Immunol Res 2014;2:351–60.
11. Boni A, Cogdill AP, Dang P, Udayakumar D, Njauw CN, Sloss CM, et al.Selective BRAFV600E inhibition enhances T-cell recognition of mela-noma without affecting lymphocyte function. Cancer Res 2010;70:5213–9.
12. Halaban R, Zhang W, Bacchiocchi A, Cheng E, Parisi F, Ariyan S, et al.PLX4032, a selective BRAFV600E kinase inhibitor, activates the ERKpathway and enhances cell migration and proliferation of BRAFWT mel-anoma cells. Pigment Cell Melanoma Res 2010;23:190–200.
13. Greger JG, Eastman SD, Zhang V, Bleam MR, Hughes AM, SmithemanKN, et al. Combinations of BRAF, MEK, and PI3K/mTOR inhibitorsovercome acquired resistance to the BRAF inhibitor GSK2118436 dab-
rafenib, mediated by NRAS or MEK mutations. Mol Cancer Ther2012;11:909–20.
14. Callahan MK, Masters G, Pratilas CA, Ariyan C, Katz J, Kitano S, et al.Paradoxical activation of T cells via augmented ERK signaling mediated bya RAF inhibitor. Cancer Immunol Res 2014;2:70–9.
15. Jiang X, Zhou J, Giobbie-Hurder A, Wargo J, Hodi FS. The activation ofMAPK in melanoma cells resistant to BRAF inhibition promotes PD-L1expression that is reversible by MEK and PI3K inhibition. Clin Cancer Res2013;19:598–609.
16. Castle JC, Loewer M, Boegel S, de Graaf J, Bender C, Tadmor AD, et al.Immunomic, genomic and transcriptomic characterization of CT26 colo-rectal carcinoma. BMC Genomics 2014;15:190.
17. Cooper ZA, FrederickDT, Juneja VR, Sullivan RJ, LawrenceDP, Piris A, et al.BRAF inhibition is associated with increased clonality in tumor-infiltratinglymphocytes. Oncoimmunology 2013;2:e26615.
18. Frederick DT, Piris A, Cogdill AP, Cooper ZA, Lezcano C, Ferrone CR, et al.BRAF inhibition is associated with enhanced melanoma antigen expres-sion and a more favorable tumor microenvironment in patients withmetastatic melanoma. Clin Cancer Res 2013;19:1225–31.
19. Knight DA, Ngiow SF, Li M, Parmenter T, Mok S, Cass A, et al. Hostimmunity contributes to the anti-melanoma activity of BRAF inhibitors.J Clin Invest 2013;123:1371–81.
20. Wilmott JS, LongGV,Howle JR, Haydu LE, Sharma RN, Thompson JF, et al.Selective BRAF inhibitors induce marked T-cell infiltration into humanmetastatic melanoma. Clin Cancer Res 2012;18:1386–94.
21. Hu-Lieskovan S, Mok S, Faja LR, Goedert L, Comin-Anduix B, Koya RC,et al. Combinatorial effect of dabrafenib, trametinib, and adoptive celltransfer (ACT) in an immune-competent murine model of BRAFV600E
mutant melanoma. J Clin Oncol 2014;32:2512.22. AtefiM, Avramis E, Lassen A, Wong DJ, Robert L, Foulad D, et al. Effects of
MAPK and PI3K pathways on PD-L1 expression inmelanoma. Clin CancerRes 2014;20:3446–57.
23. Iwai Y, IshidaM, Tanaka Y, Okazaki T, Honjo T, Minato N. Involvement ofPD-L1 on tumor cells in the escape from host immune system and tumorimmunotherapy by PD-L1 blockade. Proc Natl Acad Sci U S A 2002;99:12293–7.
24. Massi D, Brusa D,Merelli B, CianoM, Audrito V, Serra S, et al. PD-L1marksa subset of melanomas with a shorter overall survival and distinct geneticand morphological characteristics. Ann Oncol 2014;25:2433–42.
25. Liu C, Peng W, Xu C, Lou Y, Zhang M, Wargo JA, et al. BRAF inhibitionincreases tumor infiltration by T cells and enhances the antitumor activityof adoptive immunotherapy in mice. Clin Cancer Res 2013;19:393–403.
Clin Cancer Res; 21(7) April 1, 2015 Clinical Cancer Research1650
Liu et al.
on January 14, 2020. © 2015 American Association for Cancer Research. clincancerres.aacrjournals.org Downloaded from
Published OnlineFirst January 14, 2015; DOI: 10.1158/1078-0432.CCR-14-2339
26. Khalili JS, Liu S, Rodriguez-Cruz TG,WhittingtonM,Wardell S, Liu C, et al.Oncogenic BRAF(V600E) promotes stromal cell-mediated immunosup-pression via induction of interleukin-1 in melanoma. Clin Cancer Res2012;18:5329–40.
27. Jin D, Fan J, Wang L, Thompson LF, Liu A, Daniel BJ, et al. CD73on tumor cells impairs antitumor T-cell responses: a novel mech-anism of tumor-induced immune suppression. Cancer Res 2010;70:2245–55.
28. Muller-Haegele S, Muller L, Whiteside TL. Immunoregulatory activity ofadenosine and its role in human cancer progression. Expert Rev ClinImmunol 2014:10:1–18.
29. Zaiss DM, van Loosdregt J, Gorlani A, Bekker CP, Gr€one A, Sibilia M, et al.Amphiregulin enhances regulatory T cell-suppressive function via theepidermal growth factor receptor. Immunity 2013;38:275–84.
30. Garrido C, Paco L, Romero I, Berruguilla E, Stefansky J, Collado A, et al.MHC class I molecules act as tumor suppressor genes regulating the cellcycle gene expression, invasion and intrinsic tumorigenicity of melanomacells. Carcinogenesis 2012;33:687–93.
31. Garcia-Lora A, Algarra I, Garrido F. MHC class I antigens, immune sur-veillance, and tumor immune escape. J Cell Physiol 2003;195:346–55.
32. Carretero R, Romero JM, Ruiz-Cabello F, Maleno I, Rodriguez F, CamachoFM, et al. Analysis of HLA class I expression in progressing and regressingmetastatic melanoma lesions after immunotherapy. Immunogenetics2008;60:439–47.
33. Wilmott JS, Haydu LE, Menzies AM, Lum T, Hyman J, Thompson JF, et al.Dynamics of chemokine, cytokine, and growth factor serum levels in BRAF-mutant melanoma patients during BRAF inhibitor treatment. J Immunol2014;192:2505–13.
www.aacrjournals.org Clin Cancer Res; 21(7) April 1, 2015 1651
Dabrafenib and Trametinib Effect on Immune Function
on January 14, 2020. © 2015 American Association for Cancer Research. clincancerres.aacrjournals.org Downloaded from
Published OnlineFirst January 14, 2015; DOI: 10.1158/1078-0432.CCR-14-2339
2015;21:1639-1651. Published OnlineFirst January 14, 2015.Clin Cancer Res Li Liu, Patrick A. Mayes, Stephen Eastman, et al. Antibodies Targeting PD-1, PD-L1, and CTLA-4on Immune Function and in Combination with Immunomodulatory The BRAF and MEK Inhibitors Dabrafenib and Trametinib: Effects
Updated version
10.1158/1078-0432.CCR-14-2339doi:
Access the most recent version of this article at:
Material
Supplementary
http://clincancerres.aacrjournals.org/content/suppl/2015/01/15/1078-0432.CCR-14-2339.DC1
Access the most recent supplemental material at:
Cited articles
http://clincancerres.aacrjournals.org/content/21/7/1639.full#ref-list-1
This article cites 33 articles, 17 of which you can access for free at:
Citing articles
http://clincancerres.aacrjournals.org/content/21/7/1639.full#related-urls
This article has been cited by 28 HighWire-hosted articles. Access the articles at:
E-mail alerts related to this article or journal.Sign up to receive free email-alerts
Subscriptions
Reprints and
To order reprints of this article or to subscribe to the journal, contact the AACR Publications Department at
Permissions
Rightslink site. Click on "Request Permissions" which will take you to the Copyright Clearance Center's (CCC)
.http://clincancerres.aacrjournals.org/content/21/7/1639To request permission to re-use all or part of this article, use this link
on January 14, 2020. © 2015 American Association for Cancer Research. clincancerres.aacrjournals.org Downloaded from
Published OnlineFirst January 14, 2015; DOI: 10.1158/1078-0432.CCR-14-2339