Embed Size (px)
Citation preview
Energy Policy Research Foundation, Inc. 1031 31st Street, NW Washington, DC 20007 · 202.944.3339 · eprinc.org 1
The Blowout and the Deepwater Moratorium
...putting the spill in perspective
The Third Report in a Series of EPRINC Assessments of the BP
Macondo Oil Spill
July 2, 2010
Energy Policy Research Foundation, Inc.
Washington, DC
Energy Policy Research Foundation, Inc. 1031 31st Street, NW Washington, DC 20007 · 202.944.3339 · eprinc.org 2
This is the third EPRINC assessment of the blowout.1
EPRINC’s Key Findings
This report addresses the environmental,
economic, and revenue consequences to the federal government from the recently imposed ban on
deepwater drilling in the U.S. Gulf of Mexico and all offshore drilling in the federal waters of arctic
Alaska. The assessment concludes that the recently imposed measures to curtail domestic exploration
in the deepwater will not substantially reduce the risk of an oil spill, but will impose severe and
potentially long-term economic costs, job losses, setbacks to U.S. energy security, and lost fiscal
revenue.
• The environmental benefits of the moratorium are unclear. Offshore spills caused by blowouts
are extremely rare. From 1979 to 2009, blowouts were responsible for the spillage of only 1,800
barrels in the OCS (Outer Continental Shelf). Reducing E&P (Exploration and Production) activity
in the OCS, as the moratorium intends, will not necessarily reduce the risk of spillage. Because
the U.S. will have to offset lost production with imports, tanker traffic will likely increase.
Tanker accidents have historically released significantly more oil into U.S. waters than offshore
E&P activity.
• The U.S. currently imports 9-10 million barrels of oil each day (MM bbl/d). A reduction in
domestic production will need to be compensated by additional imports. The EIA (Energy
Information Administration) and other agencies are already forecasting lost production due to
the six month moratorium.
• The moratorium on deepwater activity puts thousands of existing jobs at risk in the Gulf and will
reduce the potential for future job growth in the offshore oil and gas industry, currently
supporting an estimated 435,000 jobs. Exploration rigs are contemplating abandoning the Gulf
as a result of the uncertainty created by the moratorium. This has long-term negative
implications for Gulf employment as well as oil and gas production.
• OCS oil and gas production generates financial benefits for the federal government and the
broader economy. The federal government collects billions of dollars per year in royalties,
bonuses, rents, and income taxes from OCS production.
1 EPRINC has issued two previous reports on the blowout, entitled “Oil Spill in the Gulf: Who’s in Charge?” and “A Proposed Agenda for the Presidential Commission,” available at http://www.eprinc.org/publications

Energy Policy Research Foundation, Inc. 1031 31st Street, NW Washington, DC 20007 · 202.944.3339 · eprinc.org 3
• Per the government’s own estimates, the unexplored portions of the OCS contain vast,
untapped hydrocarbon resources. EPRINC’s calculations show that these resources could
generate hundreds of billions of dollars in federal revenues over the next few decades if access
is not constrained by a moratorium.

Energy Policy Research Foundation, Inc. 1031 31st Street, NW Washington, DC 20007 · 202.944.3339 · eprinc.org 4
I. Introduction
On April 20, 2010, the Deepwater Horizon experienced a fire and explosion while conducting drilling
operations on the Macondo well in the Gulf of Mexico.2
A precise estimate of the spill volume remains difficult to calculate and is a matter of continuing
controversy. Nevertheless, the spill has imposed severe costs on the tourism and fishing industries in
Gulf Coast communities and has caused damage to wildlife and the wider coastal environment. Crews
have been working to protect hundreds of miles of beaches, wetlands, and estuaries along the Gulf
Coast, using skimmer ships, floating containment booms, anchored barriers, and sand-filled barricades
along shorelines. The U.S. Government has named BP as the responsible party in the incident, and
officials have said the company will be held accountable for all cleanup costs resulting from the oil spill.
Several different attempts, each using a different engineering approach, have been made to stop the
flow of oil from the well into the marine environment, including most recently a system of containment
domes connected to ships on the surface. BP is also in the process of drilling two relief wells, either of
which offers the best prospect for a permanent end to the spill. These relief wells are unlikely to be
effective until August 2010.
Control of the well was lost, backup safety
measures such as the blowout preventer (BOP) failed, and a large surge of methane reached the
operating facilities of the rig from the well bore, causing an explosion and large fire. After fire boats
failed to put out the fire, the Deepwater Horizon sank. Eleven platform workers were killed and 17
others were injured from the accident. Oil and gas began to spill into the Gulf of Mexico (GOM) from
the well bore.
In response to the spill, the Obama administration has undertaken a full regulatory review of all federal
offshore operations, made substantial changes to the regulatory structure of the former Mineral
Management Service (MMS), created a new Bureau of Ocean Energy, imposed a six month ban on
deepwater and offshore arctic drilling operations (i.e., drilling taking place in water depths greater than
500 feet or offshore Alaska at any depth), and established the bipartisan National Commission on the
2 Macondo is oil and gas producing prospect in the Gulf of Mexico located approximately 40 miles southeast of the Louisiana coast on Mississippi Canyon Block 252 in the Gulf of Mexico. At the time of the blowout, BP had completed an exploratory well to a depth of approximately 18,000 feet below the seabed. The Deepwater Horizon was operating in about 5000 feet above the seabed. BP serves as the operator, holding a 65% interest in the prospect; Anadarko holds 25%; and Mitsui holds the remaining 10%. For a discussion of the prospect see SubseaIQ at http://www.subseaiq.com/data/Project.aspx?project_id=562

Energy Policy Research Foundation, Inc. 1031 31st Street, NW Washington, DC 20007 · 202.944.3339 · eprinc.org 5
BP Deepwater Horizon Oil Spill and Offshore Drilling.3
In addition to the decision by the Obama administration to proceed with the investigative Commission
and to implement a six month ban on deepwater and offshore arctic drilling, various interest groups and
members of Congress have called for a more rapid transition to alternative fuels, immediate
implementation of climate control legislation, and severe constraints on the development of domestic
offshore oil and gas resources as effective strategies to reduce the risk of oil spills in the coastal regions
of the United States. Several initiatives are also underway to increase the current liability cap ($75
million) of damages resulting from a spill.
The Commission is tasked with providing
recommendations on how the government can prevent and mitigate the impact of any future spills that
result from offshore drilling.
4
3 A recent decision by the Louisiana Federal District Court overturned the ban, but the Administration has announced its plans to appeal the decision. Platts Oilgram News. June 23, 2010. 4 The Oil Pollution Act of 1990 outlines the regulatory authority for identifying responsible parties and the government’s role in responding to an oil spill. See EPRINC briefing memorandum Oil Spill in the Gulf- Who is in Charge? The report is available at http://www.eprinc.org/pdf/OPA-Briefing.pdf

Energy Policy Research Foundation, Inc. 1031 31st Street, NW Washington, DC 20007 · 202.944.3339 · eprinc.org 6
II. Oil Spills
The History of Offshore Drilling in the Gulf of Mexico
In 2001 U.S. deepwater oil production surpassed shallow water production.5 The federal waters of the
Gulf of Mexico’s Outer Continental Shelf (OCS) currently have over 7,000 active oil and gas leases with
over 4,000 Exploration and Production (E&P) platforms in operation. These facilities produce roughly
1.7 million barrels per day (MM bbl/d), accounting for over 90 percent of all offshore U.S. oil production
(federal and state waters combined) and one third of all U.S. crude oil production. Eighty percent of U.S.
offshore oil production comes from wells operating at water depths of 1000 feet or more.6
Since 1947 over 50,000 wells have been drilled in the Gulf’s federal waters. Over 4,000 of these wells
have been drilled in water depths of greater than 1,000 feet. Approximately 700 wells have been drilled
in water depths of 5,000 feet or greater.
Approximately 2.5 trillion cubic feet (tcf) of natural gas are produced annually in the Gulf’s OCS,
accounting for 10% of U.S. natural gas production. An additional 125 MM bbls (barrels) per year of
natural gas liquids are produced in the Gulf’s OCS.
7
Spills from E&P activities are rare in the Gulf of Mexico and in all American waters. The Macondo spill is
the first offshore domestic E&P spill to release more than 100,000 bbls. The scale of the Macondo spill
is unprecedented in the history of the Gulf’s 50,000 wells – blowout induced spills in particular have
been exceedingly rare in the Gulf. Reports from the Department of Interior (DOI) show that from 1979
to 2009, “a total of approximately 1,800 barrels was spilled on the Federal OCS as a result of blowout
events.”
8
From 1980 to 2009 there were 125 spills in the OCS over 50 bbls. The spills averaged 216 bbls
each, totaling 27,000 bbls over a 30 year time period. Table 1 below provides a summary of spills in the
OCS since 1960.
5 MMS defines deepwater as 1000 feet and shallow water as 500 feet 6 Department of Interior. “Increased Safety Measures for Energy Development on the Outer Continental Shelf.” May 27, 2010. http://www.doi.gov/deepwaterhorizon/loader.cfm?csModule=security/getfile&PageID=33598 7 Ibid 8 Ibid

Energy Policy Research Foundation, Inc. 1031 31st Street, NW Washington, DC 20007 · 202.944.3339 · eprinc.org 7
Table 1. OCS Production and Spills
Time
Period
OCS Oil
Production
(Thousand
Barrels)
Number
of Spills
Barrels
Spilled
(Thousand
Barrels)
Thousand
Barrels
Produced per
Barrel Spilled
1960-1969 1,460,000 13 99 15
1970-1979 3,455,000 32 106 33
1980-1989 3,387,000 38 7 473
1990-1999 4,051,000 15 2 1,592
2000-2009 5,450,000 72 18 296
Source: Department of Interior Data
As Table 1 above illustrates, OCS oil spills have diminished since the 1960s and 1970s even as production
has continued to grow.
Following the Exxon Valdez spill in 1989, tanker spillage in U.S. waters declined significantly even as
volumes of crude oil imported into the U.S. via tankers increased -- in part due to legislation requiring
double hulls.
A Brief History of the World’s Worst Oil Spills
Oil spills have been prevalent throughout the history of the petroleum era; however, spills caused by
loss of well control are extremely rare, particularly in U.S. waters. The most common large
anthropogenic spills usually come in the form of tanker accidents. Historically, tankers have been
responsible for four times the amount of oil in U.S. waters than E&P activity. Figure 1 below shows the
world’s 10 largest oil spills in the modern petroleum era. (Also see EPRINC’s map on page 12 of the 10
largest spills.) Tanker accidents represent the most frequent source of oil spills in Figure 1 and are
comparable in total volume.
Energy Policy Research Foundation, Inc. 1031 31st Street, NW Washington, DC 20007 · 202.944.3339 · eprinc.org 8
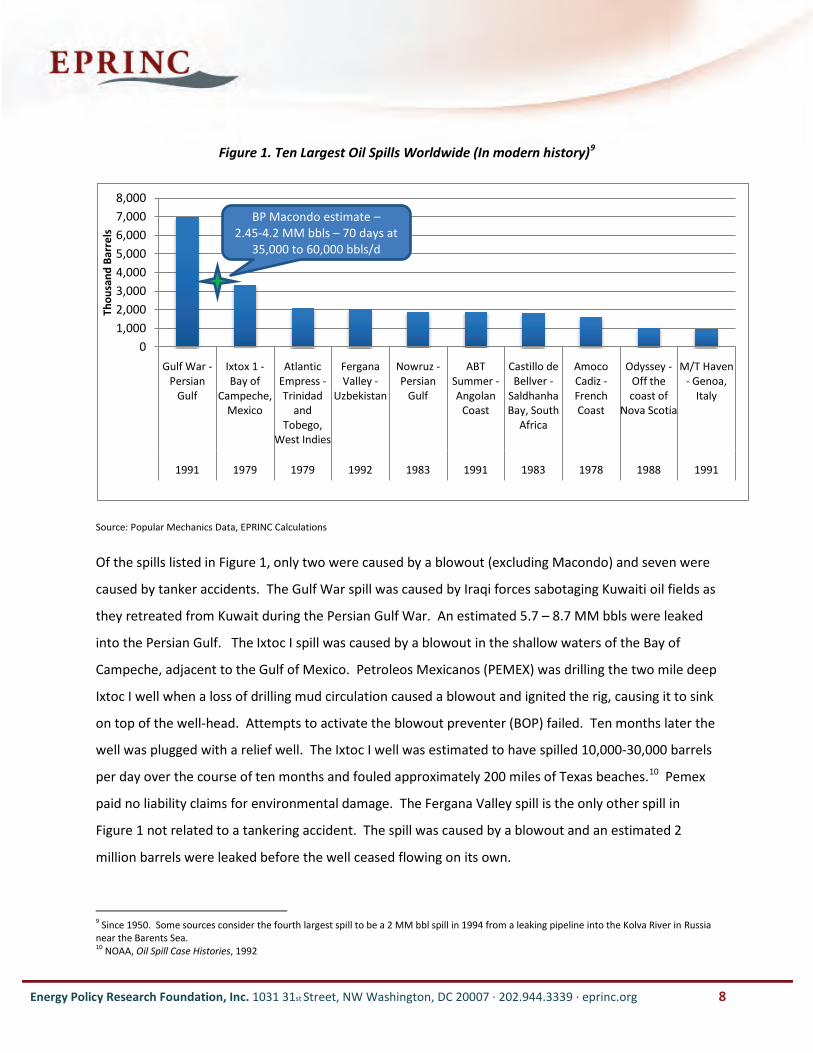
Figure 1. Ten Largest Oil Spills Worldwide (In modern history)9
Source: Popular Mechanics Data, EPRINC Calculations
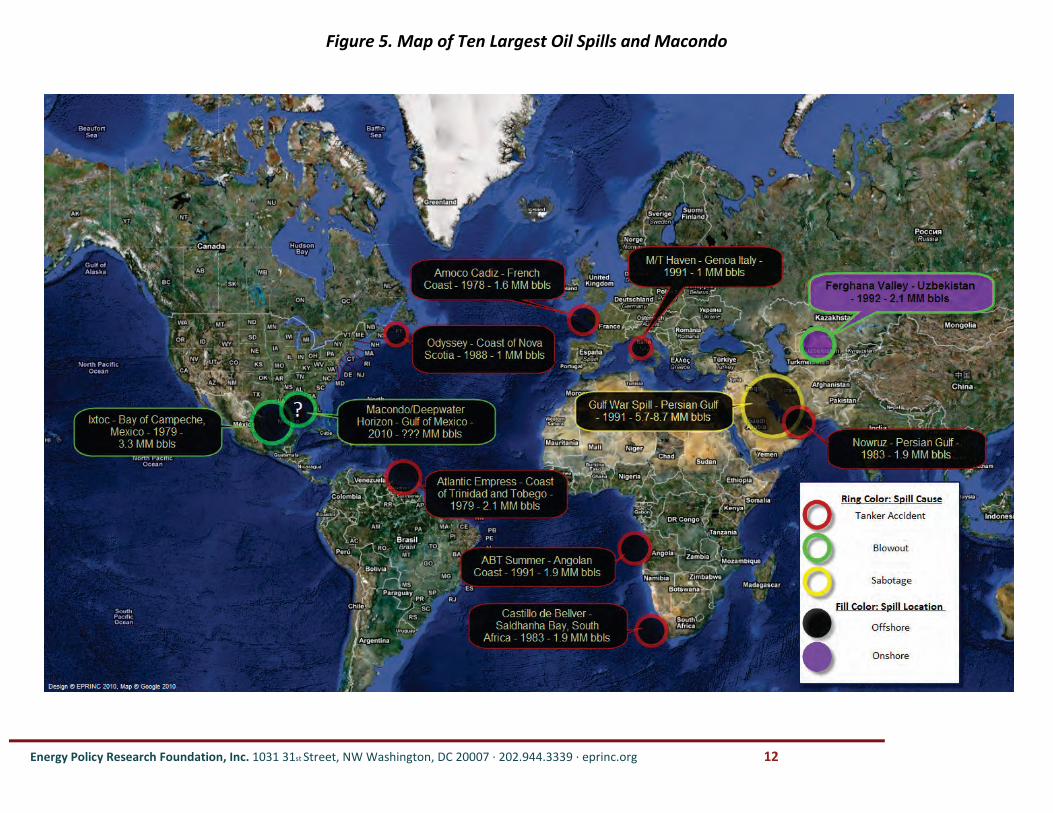
Of the spills listed in Figure 1, only two were caused by a blowout (excluding Macondo) and seven were
caused by tanker accidents. The Gulf War spill was caused by Iraqi forces sabotaging Kuwaiti oil fields as
they retreated from Kuwait during the Persian Gulf War. An estimated 5.7 – 8.7 MM bbls were leaked
into the Persian Gulf. The Ixtoc I spill was caused by a blowout in the shallow waters of the Bay of
Campeche, adjacent to the Gulf of Mexico. Petroleos Mexicanos (PEMEX) was drilling the two mile deep
Ixtoc I well when a loss of drilling mud circulation caused a blowout and ignited the rig, causing it to sink
on top of the well-head. Attempts to activate the blowout preventer (BOP) failed. Ten months later the
well was plugged with a relief well. The Ixtoc I well was estimated to have spilled 10,000-30,000 barrels
per day over the course of ten months and fouled approximately 200 miles of Texas beaches.10
9 Since 1950. Some sources consider the fourth largest spill to be a 2 MM bbl spill in 1994 from a leaking pipeline into the Kolva River in Russia near the Barents Sea.
Pemex
paid no liability claims for environmental damage. The Fergana Valley spill is the only other spill in
Figure 1 not related to a tankering accident. The spill was caused by a blowout and an estimated 2
million barrels were leaked before the well ceased flowing on its own.
10 NOAA, Oil Spill Case Histories, 1992
01,0002,0003,0004,0005,0006,0007,0008,000
Gulf War -Persian
Gulf
Ixtox 1 -Bay of
Campeche, Mexico
Atlantic Empress -Trinidad
and Tobego,
West Indies
Fergana Valley -
Uzbekistan
Nowruz -Persian
Gulf
ABT Summer -Angolan
Coast
Castillo de Bellver -
Saldhanha Bay, South
Africa
Amoco Cadiz -French Coast
Odyssey -Off the coast of
Nova Scotia
M/T Haven - Genoa,
Italy
1991 1979 1979 1992 1983 1991 1983 1978 1988 1991
Thou
sand
Bar
rels
BP Macondo estimate –2.45-4.2 MM bbls – 70 days at
35,000 to 60,000 bbls/d

Energy Policy Research Foundation, Inc. 1031 31st Street, NW Washington, DC 20007 · 202.944.3339 · eprinc.org 9
Figures 2 and 3 below show the ten largest tanker spills in and near U.S. waters and the largest marine
spills in U.S. waters caused by blowouts. Prior to the Macondo spill, the ten largest U.S. marine
blowouts combined were smaller than any one of the ten largest tanker spills in U.S. waters.
Figure 2. Largest Tanker Spills in and near U.S. Waters
Source: API Data
Figure 3. Largest U.S. Marine Oil Well Blowouts
Source: API Data
050
100150200250300350
Mandoil II - Pacific
Ocean, OR
Exxon Valdez -Prince
William Sound, AK
Burmah Agate -Gulf of
Mexico, TX
Pegasus (Pegasos) -Northwest
Atlantic Ocean, US east coast
Texaco Oklahoma
-Northwest
Atlantic Ocean, US east coast
Keo -Northwest
Atlantic Ocean, MA
Argo Merchant
-Nantucket
Shoals, MA
Spartan Lady -
Northwest Atlantic
Ocean, US east coast
Gulfstag -Gulf of Mexico
Mega Borg - Gulf of
Mexico, TX
1968 1989 1979 1968 1971 1969 1976 1975 1966 1990
Thou
sand
Bar
rels
020406080
100120
Alpha Well 21
Platform A - Coast of
Santa Barbara,
CA
Main Pass Block 41 -
Gulf of Mexico
South Timbalier -
Gulf of Mexico
Ship Shoal 149/199 -
Gulf of Mexico
Greenhill Timbalier Bay - Gulf of Mexico
Herbert Bravo -Gulf of Mexico
Ship Shoal 29 - Gulf
of Mexico
BLDSU 6 -Gulf of Mexico
Block 60 SP0060 -Gulf of Mexico
Fred Stovall Well 9 -Gulf of Mexico
1969 1970 1970 1964 1992 1979 1965 1995 1992 1994
Thou
sand
Bar
rels

Energy Policy Research Foundation, Inc. 1031 31st Street, NW Washington, DC 20007 · 202.944.3339 · eprinc.org 10
Other Environmental Considerations
Petroleum enters the marine environment through a range of sources. The National Academy of
Sciences released a study in 2003 examining the primary sources of petroleum in American waters.11
Figure 4.Petroleum in American Waters
“Drilling and Extraction” is the smallest source, accounting for less than 1% of all petroleum in American
waters. The movement of petroleum by tanker accounts for approximately 4% of total petroleum in
American waters. Natural seeps account for nearly two-thirds (63%) of oil in America waters. “Cars,
boats and other sources” represent nearly a third of petroleum in American waters.
Tanker accidents have historically released significantly more oil into U.S. waters than offshore E&P
activity. Thus, a reduction in drilling activity will shift the risk of spillage from local production to
tankering because the U.S. will likely have to import additional volumes of oil to offset lost domestic
11 Oil in the Sea III: Inputs, Fates, and Effects. 2003. The National Academies Press

Energy Policy Research Foundation, Inc. 1031 31st Street, NW Washington, DC 20007 · 202.944.3339 · eprinc.org 11
offshore production. It will also shift environmental and safety risks to other parts of the world where
environmental and social standards for oil production might not be as stringent as they are in the U.S.
Energy Policy Research Foundation, Inc. 1031 31st Street, NW Washington, DC 20007 · 202.944.3339 · eprinc.org 12
Figure 5. Map of Ten Largest Oil Spills and Macondo
Energy Policy Research Foundation, Inc. 1031 31st Street, NW Washington, DC 20007 · 202.944.3339 · eprinc.org 13
III. Economic Costs
Since the Macondo blowout and spill, over 35,000 Gulf Coast business owners and workers have filed
claims for lost income.12
All of the major industries in the Gulf: fishing, shipping, tourism, and oil and
gas, have been severely impacted by this incident.
Thousands of square miles of the Gulf Coast are closed to fishing, a $2.8 billion dollar industry in
Louisiana alone.13 Many fishermen have already been put out of business in the past months and are
likely to feel the negative effects of this spill long after the well is sealed. And while fishing is a relatively
small contributor to the Gulf economy compared to tourism and oil, it plays an important role in terms
of job creation as well as driving tourism.14 Tourism, the second largest industry in the Gulf, has already
begun to feel the impacts of the spill, although many beaches actually remain clean and open. Florida
has reported cancellations up to three months in advance and Mississippi has seen cancelation rates as
high as 50 percent.15
12 Robbie Brown and Michael Cooper. "BP Pays Out Claims, but Satisfaction Is Not Included." June 6, 2010. http://www.nytimes.com/2010/06/07/us/07claims.html 13 The Louisiana seafood industry generates $1.8 billion in retail sales annually. Recreational fishing generates approximately $1 billion. See BusinessWeek: http://www.businessweek.com/news/2010-04-29/oil-spill-imperils-gulf-coast-fishing-industry-update1-.html. In comparison, oil sales from Gulf OCS production would generate about $40 billion annually at $70/bbl. 14 The Gulf coast provides 0.3% of U.S. seafood. The U.S. imports 83% of its seafood and 90% of its shrimp. See Wall Street Journal, “Impact on Seafood Prices is Limited,” June 21, 2010. http://online.wsj.com/article/SB10001424052748703438604575314563269981870.html 15 Steve Hargreaves, “Oil Spill Damages Spread Through Gulf Economies”, June 1, 2010, http://money.cnn.com/2010/05/30/news/economy/gulf_economy/index.htm

Energy Policy Research Foundation, Inc. 1031 31st Street, NW Washington, DC 20007 · 202.944.3339 · eprinc.org 14
Figure 6 below shows the productive value of the top four U.S. Gulf Coast industries.16
Figure 6. Productive Value of the Largest U.S. Gulf Coast Industries
Source: Gulf of Mexico Origin, Waters, and Biota Volume 2, Ocean and Coastal Economy
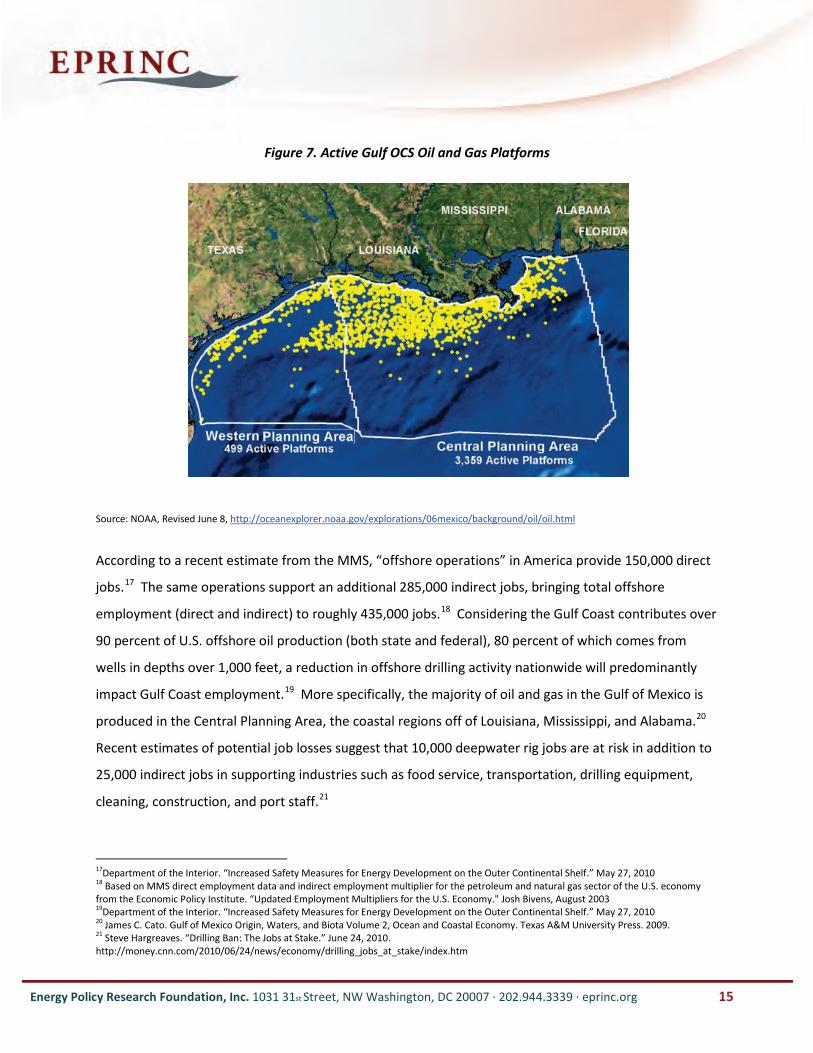
The Gulf Coast petroleum industry, the region’s largest industry, has suffered a severe setback from the
Macondo blowout and subsequent moratorium on offshore drilling at depths beyond 500 feet. There
are 4,000 active oil and gas platforms in the Gulf of Mexico. Existing Gulf production is dependent on
new drilling to help stem decline rates – notoriously steep in the Gulf’s deepwater oil wells. Figure 7
below, provided by the National Oceanic and Atmospheric Administration (NOAA), shows the active Gulf
OCS production platforms as of June 2008.
16 James C. Cato. Gulf of Mexico Origin, Waters, and Biota Volume 2, Ocean and Coastal Economy. Texas A&M University Press. 2009. Values in Figure 7 can vary widely depending on commodity prices (e.g., Figure 7 assumes and oil price of $28.50/bbl) and therefore should be considered a conservative estimate of the relative values of the included industries.
0
5
10
15
20
25
30
35
40
45
Oil and Gas Tourism Fisheries Port/Shipping
$ bi
llion
Energy Policy Research Foundation, Inc. 1031 31st Street, NW Washington, DC 20007 · 202.944.3339 · eprinc.org 15
Figure 7. Active Gulf OCS Oil and Gas Platforms
Source: NOAA, Revised June 8, http://oceanexplorer.noaa.gov/explorations/06mexico/background/oil/oil.html
According to a recent estimate from the MMS, “offshore operations” in America provide 150,000 direct
jobs.17 The same operations support an additional 285,000 indirect jobs, bringing total offshore
employment (direct and indirect) to roughly 435,000 jobs.18 Considering the Gulf Coast contributes over
90 percent of U.S. offshore oil production (both state and federal), 80 percent of which comes from
wells in depths over 1,000 feet, a reduction in offshore drilling activity nationwide will predominantly
impact Gulf Coast employment.19 More specifically, the majority of oil and gas in the Gulf of Mexico is
produced in the Central Planning Area, the coastal regions off of Louisiana, Mississippi, and Alabama.20
Recent estimates of potential job losses suggest that 10,000 deepwater rig jobs are at risk in addition to
25,000 indirect jobs in supporting industries such as food service, transportation, drilling equipment,
cleaning, construction, and port staff.21
17Department of the Interior. “Increased Safety Measures for Energy Development on the Outer Continental Shelf.” May 27, 2010
18 Based on MMS direct employment data and indirect employment multiplier for the petroleum and natural gas sector of the U.S. economy from the Economic Policy Institute. “Updated Employment Multipliers for the U.S. Economy." Josh Bivens, August 2003 19Department of the Interior. “Increased Safety Measures for Energy Development on the Outer Continental Shelf.” May 27, 2010 20 James C. Cato. Gulf of Mexico Origin, Waters, and Biota Volume 2, Ocean and Coastal Economy. Texas A&M University Press. 2009. 21 Steve Hargreaves. “Drilling Ban: The Jobs at Stake.” June 24, 2010. http://money.cnn.com/2010/06/24/news/economy/drilling_jobs_at_stake/index.htm

Energy Policy Research Foundation, Inc. 1031 31st Street, NW Washington, DC 20007 · 202.944.3339 · eprinc.org 16
Thirty-three active deepwater drilling rigs were idled by the moratorium. The total economic impact to
the Gulf region alone from shutting down these 33 rigs for a year could cost the region’s economy over
$10 billion.22 Other estimates suggest each idled rig could risk as many as 1,400 jobs. Lost wages per rig
per month could be as high as $10 million or $330 million (all 33 rigs).23
There is strong worldwide demand for these deepwater rigs. And many of the more modern rigs
command daily rates between $500,000 and $650,000. The likelihood that these rigs will soon go
abroad is increasing given the uncertainty of their work in US Federal waters.
24
Lost Production Expected
As Figure 8 below demonstrates, federal Gulf of Mexico crude oil production represents a significant
portion of the nation’s petroleum supply. The Gulf is currently responsible for 30 percent of domestic
oil production and as of January 2010 was producing at its highest rate ever, 1.7 MM bbl/d.
Figure 8. U.S. (Blue) and Federal OCS (Gulf Coast in Red, California in Green) Crude Production
Source: EIA Data
22 Industry analyst data and EPRINC calculation 23National Ocean Industries Association, June 2, 2010, “Thousands of Jobs and Billions of Dollars in Government Revenue at Risk From Six-month Gulf Drilling Halt Says National Ocean Industries Association Chairman”, http://www.noia.org/website/article.asp?id=38561 24 Rhonda Brammer, “Safe Harbor in Deep Water,” March 30, 2009, http://online.barrons.com/article/SB123820180286962525.html#articleTabs_panel_article%3D1
0100020003000400050006000700080009000
10000
1981
1983
1985
1987
1989
1991
1993
1995
1997
1999
2001
2003
2005
2007
2009
Thou
sand
Bar
rels
per
Day U.S. Field Production of Crude Oil
(Thousand Barrels per Day)
Federal Offshore--Gulf of Mexico Field Production of Crude Oil (Thousand Barrels per Day)
Federal Offshore California Field Production of Crude Oil (Thousand Barrels per Day)
Energy Policy Research Foundation, Inc. 1031 31st Street, NW Washington, DC 20007 · 202.944.3339 · eprinc.org 17
The six month moratorium on deepwater E&P activity will have an appreciable impact on production in
both the short and long-term. The Energy Information Administration (EIA) projects that the
moratorium will reduce production by 26,000 bbl/d in the fourth quarter of 2010 and 76,000 bbl/d in
2011.25 A sampling of assessments by investment banks forecast lost production from the moratorium
ranging from 100,000 bbl/d to 400,000 bbl/d should the ban remain in place for 6-12 months. The
International Energy Agency (IEA) estimated possible lost production at 100,000-300,000 bbl/d by 2015
as a result of “tighter legislation” from the spill. Should other oil producing countries adopt similar
restrictions, the world could lose 800,000-900,000 bbl/d of production, according to IEA’s forecast. IEA
said the spill could be a “supply-side game changer” for deepwater oil production--the source of half of
all global upcoming developments--should other producers also tighten deepwater access.26
Lost Production…..More Imports
Oak Ridge National Laboratory (ORNL) released a study in 2006 that estimated the cost to the U.S.
economy of every barrel of imported oil.27 ORNL found that the cost of imported oil to the U.S.
economy is $13.58/bbl (in 2004 US dollars) in addition to the market price. This cost includes both a
monopsony component (the estimated effect the U.S has on world oil prices as the world’s largest
consumer of crude oil) and a cost for macroeconomic disruptions to the U.S. economy. ORNL’s
calculations do not include environmental or foreign policy costs. ORNL’s study has been used by
National Highway Transportation Safety Administration (NHTSA) to provide justification for increasing
corporate average fuel economy (CAFE) standards28 and by the Environmental Protection Agency (EPA)
to promote the National Renewable Fuel Standards Program (RFS2).29
In 2009 dollars, the incremental benefit to the U.S. of reducing oil imports by 1 barrel is estimated to be
$14.70.
30
25 EIA June 2010 Short-term Energy Outlook
With petroleum imports for 2010 likely to average approximately 9 MM bbl/d, imports will
cost the U.S. economy an additional $48 billion (in addition to the cost of the oil itself). Lost Gulf
26 Platts Oilgram News. “IEA: 1 million b/d at risk from Gulf spill.” June 21, 2010 27Oak Ridge National Laboratory. Estimating the Energy Security Benefits of Reduced U.S. Oil Imports.http://www.epa.gov/OMS/renewablefuels/ornl-tm-2007-028.pdf 28National Highway Transportation Safety Administration. http://www.nhtsa.dot.gov/portal/nhtsa_static_file_downloader.jsp?file=/staticfiles/DOT/NHTSA/Rulemaking/Rules/Associated%20Files/CAFE_Final_Rule_MY2011_FRIA.pdf 29 For a discussion of EPA’s calculations on the contribution and justification for subsidies for renewable fuels see www.epa.gov/otaq/renewablefuels/420f09023.htm 30 According to the Federal Reserve’s Price Adjusted Broad Dollar Index for July 2004 and July 2009

Energy Policy Research Foundation, Inc. 1031 31st Street, NW Washington, DC 20007 · 202.944.3339 · eprinc.org 18
production, which will be supplanted by imports, will cost the US economy $1.3 billion per year if
250,000 bbl/d of production are lost. Figure 9 below shows annual lost gross revenues from oil sales
and the ORNL’s economic penalty for oil imports over a range of lost production amounts and an oil
price of $75/bbl.
Figure 9. Annual Lost Revenues and Economic Costs of Lost Domestic Production
Source: EPRINC Calculations, ORNL Data
Some legislators and policy makers are recommending the U.S. scale back the offshore leasing program
and replace the lost production with alternative fuels and conservation. However, such a strategy
represents a false choice. As shown in Figure 10 below the U.S. imports approximately 9 MM bbl/d of
crude oil. Imports represent the “marginal barrel” to the U.S. economy and until these imports fall to
zero, any lost domestic production will be replaced by imports.
02468
1012141618
100,000 bbl/d
200,000 bbl/d
300,000 bbl/d
400,000 bbl/d
500,000 bbl/d
$ bi
llion
ann
ually
ORNL Economic Penalty -$14/bbl
Revenues at $75/bbl

Energy Policy Research Foundation, Inc. 1031 31st Street, NW Washington, DC 20007 · 202.944.3339 · eprinc.org 19
Figure 10. Historical U.S. Crude Oil Production, Imports, and Consumption
Source: EIA Data
Alternative fuels can help to reduce net imports of crude oil and petroleum products, but these
alternatives (biofuels, electric vehicles, natural gas vehicles) offer only limited opportunity to
substantially lower oil imports in the near to medium term. Over the next 10-20 years the likelihood of
transitioning into an environment of significantly less oil imports is low. Even under the most optimistic
scenario for using alternative fuels and technologies, the U.S. will import large volumes of petroleum.
In its 2009 Annual Energy Outlook, the EIA projected U.S. liquid fuels consumption at 20.2 MM bbl/d in
2020 and 21.7 MM bbl/d in 2030. If the Energy Independence and Security Act of 2007 (EISA 2007) is
met in 2022, it will contribute just 2.35 MM bbl/d of renewable transportation fuels. The remainder of
projected U.S. liquid fuels consumption will presumably be supplied by domestic crude oil production
(currently 5 MM bbl/d) and crude oil imports.
0
5
10
15
20
2519
81
1983
1985
1987
1989
1991
1993
1995
1997
1999
2001
2003
2005
2007
2009
mbd
U.S. Net Imports of Crude Oil and Petroleum Products
U.S. Field Production of Crude Oil
U.S. Product Supplied of Crude Oil and Petroleum Products, Minus NGLs and Liquid Refinery Gases (Thousand Barrels per Day)
Imports
Production

Energy Policy Research Foundation, Inc. 1031 31st Street, NW Washington, DC 20007 · 202.944.3339 · eprinc.org 20
Figure 11 below shows the projected net import share of U.S. liquid fuels consumption from EIA’s 2009
Annual Energy Outlook.
Figure 11. Net Import Share of U.S. Liquid Fuels Consumption in Three Cases (1990-2030)
Source: EIA 2009 Annual Energy Outlook
In the high oil price scenario, the U.S. will be importing about one third of its liquid fuel needs from 2020
through 2030, equivalent to about 7 MM bbl/d. In the reference case, imports will account for 40-45%
of liquid fuels consumption. In the low price scenario, imports will be relied upon to cover over half of
the country’s liquid fuels consumption.
0
10
20
30
40
50
60
70
1990 1995 2000 2005 2010 2015 2020 2025 2030
%
Reference
Low price
High price

Energy Policy Research Foundation, Inc. 1031 31st Street, NW Washington, DC 20007 · 202.944.3339 · eprinc.org 21
Potential Resources and Federal Revenues
Should the federal government restrict further OCS exploration it will leave billions of barrels of oil and
trillions of cubic feet of gas in the ground. Leaving these resources in the ground will not prevent
equivalent quantities of oil and gas from being consumed; instead, unrealized production of oil and gas
will largely be replaced by imports. It will also leave behind vast sums of potential revenues. The
following figure shows MMS’ estimates for undiscovered, economically and technically recoverable oil,
gas, and NGL (natural gas liquid) reserves across the four segments of the OCS.
Figure 12. MMS Mean Estimate of OCS Resource Potential
Source: MMS, Assessment of Undiscovered Technically Recoverable Oil and Gas Resources of the Nation’s Outer Continental
Shelf, 2006, http://www.mms.gov/revaldiv/PDFs/2006NationalAssessmentBrochure.pdf
It should be noted that MMS’ estimates of undiscovered technically recoverable resources (UTRR) in the
OCS for oil and gas have nearly doubled since 1996. MMS attributes the bulk of these gains to the
0
50
100
150
200
250
Alaska Gulf of Mexico Atlantic PacificOil (Bbls) 26.61 44.92 3.82 10.53Gas (Tcf) 132.06 232.54 36.99 18.29BOE (Bbls) 50.11 86.3 10.4 13.79
Energy Policy Research Foundation, Inc. 1031 31st Street, NW Washington, DC 20007 · 202.944.3339 · eprinc.org 22
inclusion of deepwater resources, which have become increasingly accessible over the past decade due
to technological advancements.31
The above figure contains MMS’ mean estimates for potential reserves throughout the entire OCS
(reserves are potentially higher or lower within a range of 124.68 billion BOE to 215.82 billion BOE).
32
By the government’s own estimates, the OCS contains an additional 160.5 billion BOE of economically
and technologically recoverable resources, 55% of which are believed to be oil. There remains much
upside to this estimate when one factors in the relatively high price of oil and the exclusion of
unconventional “low permeability” resources which have seen rapid onshore growth since 2006 (e.g.,
shale gas). To put Figure 12 in perspective, the estimated oil reserves, if proven, would quintuple U.S.
proven crude oil reserves, making the United States the world’s fifth largest holder of proven reserves.
The estimated oil reserves would enable the U.S. to produce an additional 4.4 MM bbl/d for 50 years –
an 88% increase to current production.
MMS’ estimates do not include several potential sources of oil and gas, namely resources requiring
enhanced oil recovery techniques and unconventional resources such as “low permeability ‘tight’
reservoirs”.
What are Undiscovered OCS Resources Worth to the Federal Government?
Hydrocarbon production generates billions of dollars per year for the federal government.33
EPRINC has attempted to quantify the value of the revenue stream to the federal government
(production royalties and federal corporate income taxes) which would be generated by the production
of the resources in Figure 12, assuming production is spread evenly over 50 years. Such an estimate
The MMS
(which is now being separated into three distinct agencies) has historically been responsible for
collecting revenues from federal offshore production. These revenues typically come from three
sources: royalty payments from energy production on federal OCS leases, bonus payments from lease
auctions, and annual lease rental payments. The federal Government also collects revenues from oil
and gas production in the form of corporate income taxes.
31 See appendix figure 2. 32 BOE includes oil and natural gas with natural gas converted to a BTU equivalency with oil. It should be noted that any reserve estimate is inherently uncertain until a resource is discovered through the E&P process. 33See Appendix on past federal revenues.
Energy Policy Research Foundation, Inc. 1031 31st Street, NW Washington, DC 20007 · 202.944.3339 · eprinc.org 23
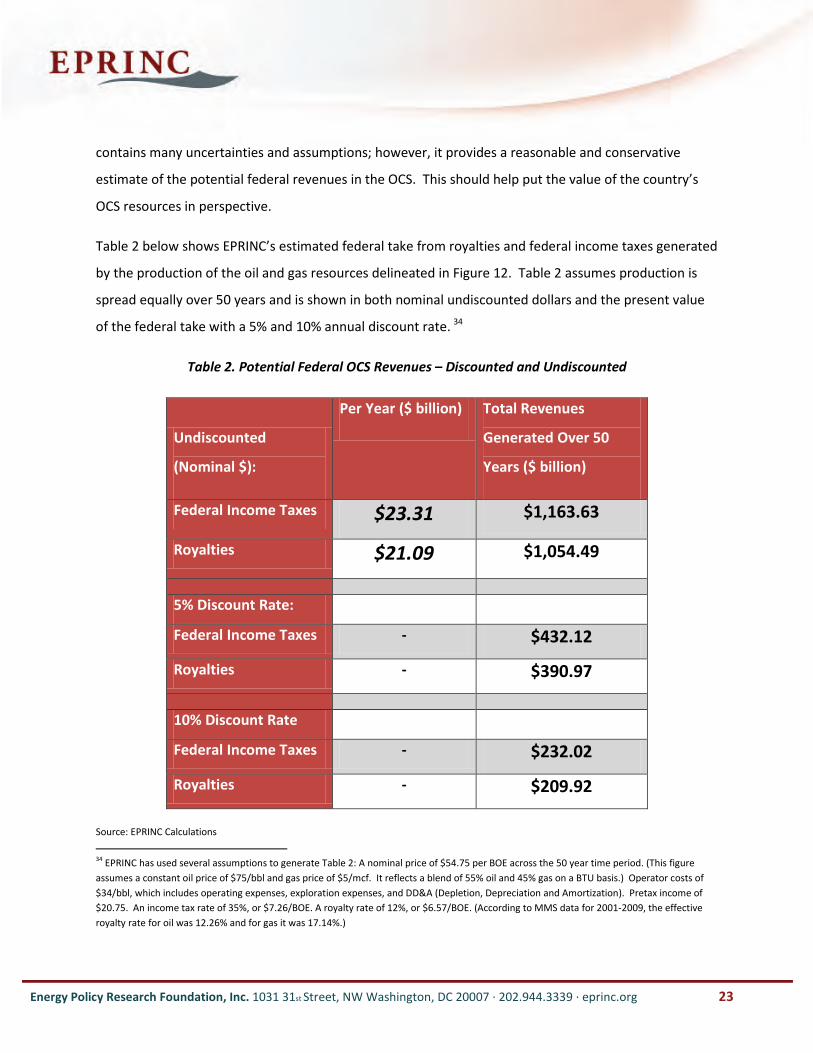
contains many uncertainties and assumptions; however, it provides a reasonable and conservative
estimate of the potential federal revenues in the OCS. This should help put the value of the country’s
OCS resources in perspective.
Table 2 below shows EPRINC’s estimated federal take from royalties and federal income taxes generated
by the production of the oil and gas resources delineated in Figure 12. Table 2 assumes production is
spread equally over 50 years and is shown in both nominal undiscounted dollars and the present value
of the federal take with a 5% and 10% annual discount rate. 34
Table 2. Potential Federal OCS Revenues – Discounted and Undiscounted
Undiscounted
(Nominal $):
Per Year ($ billion) Total Revenues
Generated Over 50
Years ($ billion)
Federal Income Taxes $23.31 $1,163.63
Royalties $21.09 $1,054.49
5% Discount Rate: Federal Income Taxes - $432.12
Royalties - $390.97
10% Discount Rate Federal Income Taxes - $232.02
Royalties - $209.92
Source: EPRINC Calculations
34 EPRINC has used several assumptions to generate Table 2: A nominal price of $54.75 per BOE across the 50 year time period. (This figure assumes a constant oil price of $75/bbl and gas price of $5/mcf. It reflects a blend of 55% oil and 45% gas on a BTU basis.) Operator costs of $34/bbl, which includes operating expenses, exploration expenses, and DD&A (Depletion, Depreciation and Amortization). Pretax income of $20.75. An income tax rate of 35%, or $7.26/BOE. A royalty rate of 12%, or $6.57/BOE. (According to MMS data for 2001-2009, the effective royalty rate for oil was 12.26% and for gas it was 17.14%.)
Energy Policy Research Foundation, Inc. 1031 31st Street, NW Washington, DC 20007 · 202.944.3339 · eprinc.org 24
The above table and previous figure illustrate the potential value of the OCS to the federal government
(although such estimates come with a great deal of uncertainty). The unexplored portions of the OCS
could increase federal revenues by hundreds of billions of dollars over the coming decades. Bonus bids
and rental payments would generate tens of billions of dollars in additional revenues.

Energy Policy Research Foundation, Inc. 1031 31st Street, NW Washington, DC 20007 · 202.944.3339 · eprinc.org 25
IV. Conclusion
In response to the BP spill, the Obama administration has placed a moratorium on deepwater drilling in
the Gulf of Mexico and in all waters offshore Alaska. Although a recent court decision has struck down
the moratorium, the administration likely can pursue alternative strategies to keep the moratorium in
place through new regulatory programs. In addition, considerable evidence exists to suggest the
moratorium is not likely to reduce net risk from offshore drilling and is likely increasing risk as losses in
domestic production will be compensated through imports which will increase tanker activity. The
reduction in exploration opportunities will also lead to the loss of well trained personnel and modern
deepwater rigs as capital and labor begin to leave the Gulf to find work elsewhere. With regard to
deepwater prospects, the world petroleum industry has more opportunities than can be addressed with
existing crews and advanced drilling rigs. Opportunities denied in the Gulf of Mexico will see both
capital and expertise move to other petroleum provinces.
Critics of efforts to continue U.S. deepwater production argue that the U.S. resource base is too small to
make much difference in energy security. A recent analysis by Resources for the Future forecasts only
modest increases in world oil prices as a result of delays in the development for deepwater oil and gas
resources in U.S. waters.35
The explicit or implicit conclusion from the critics of deepwater oil and gas development is that the risks
are unacceptable given the rewards. These assessments miss the point. It is neither the size of the U.S.
resource base, nor its modest consequences on world prices that is relevant, but rather the net value of
the resource to the national economy. The critical issue for U.S. policy makers is how to preserve and
capture the high value of the domestic oil and gas resource base for the American public and to do so at
an acceptable risk.
Some environmental groups have argued that the BP spill demonstrates the
need for a rapid transition to alternative fuels, despite the reality that any loss in U.S. domestic
petroleum output will result in higher oil imports -- even under the most optimistic scenario of policy
strategies that substitute alternative fuels for petroleum based liquid fuels.
36
35 See Stephen P.A. Brown, “Some Implications of Tightening Regulation of U.S. Deepwater Drilling,” Resources for the Future, Backgrounder, June 2010. http://www.rff.org/Publications/Pages/PublicationDetails.aspx?PublicationID=21196
As the administration moves forward to address the pace of deepwater
development and regulatory programs which will regulate that development, careful attention must be
36 An upcoming paper by EPRINC will address alternative regulatory approaches for managing the risks of offshore drilling operations.

Energy Policy Research Foundation, Inc. 1031 31st Street, NW Washington, DC 20007 · 202.944.3339 · eprinc.org 26
given to not only those strategies that will minimize risk, but to approaches that will capture the high
value of the resource for the American public.

Energy Policy Research Foundation, Inc. 1031 31st Street, NW Washington, DC 20007 · 202.944.3339 · eprinc.org 27
V. Appendix
Appendix Figure 1. Net Present Value of Potential Federal OCS Revenues from Undiscovered Oil and
Gas Reserves with a 5% Discount Rate.
Source: EPRINC Calculations and MMS Data. Assumes production is spread equally over 50 years.
0
100
200
300
400
500
600
700
800
900
0 2 4 6 8 10 12 14 16 18 20 22 24 26 28 30 32 34 36 38 40 42 44 46 48 50
$ bi
llion
Year
Royalties
Taxes

Energy Policy Research Foundation, Inc. 1031 31st Street, NW Washington, DC 20007 · 202.944.3339 · eprinc.org 28
Appendix Figure 2. MMS Estimates of OCS UTRR since 1996.
Source: MMS, http://www.mms.gov/revaldiv/PDFs/2006NationalAssessmentBrochure.pdf
Receipts and Distribution of Revenues from Offshore Oil and Gas Production
Revenues collected from offshore operations are distributed by MMS to various sectors of the Federal
government, states, and several other groups and programs as directed by law. Fiscal Year (FY) 2008
disbursements set an MMS record at $23.5 billion, with the lion’s share generated by oil and gas
royalties and bonuses. Revenue distributions for 2009 was lower than 2008, but still substantial at over
$10 billion. Table 1 below shows the disbursements for FY 2009 revenues.

Energy Policy Research Foundation, Inc. 1031 31st Street, NW Washington, DC 20007 · 202.944.3339 · eprinc.org 29
Appendix Table 1. 2009 MMS Disbursements
Billion $
States, Counties and Parishes $1.99
U.S. Treasury $5.74
34 American Indian Tribes and Mineral Owners $0.45
Reclamation Fund for Water Projects $1.45
Land and Water Conservation Fund $0.90
Historic Preservation Fund $0.15
Total: $10.68
Source: MMS: Oil, gas, and NGL royalties accounted for 71% of total FY 2009
disbursements.http://www.mrm.mms.gov/Intro/PDFDocs/20091116.pdf
Figure 3 below shows total revenues related to offshore oil and gas production. With the exception of
2008, (a year in which highly sought after leases in the Gulf of Mexico were auctioned, raising nearly $10
billion in bonuses alone) royalties, bonuses, and rents combined have generated revenues in a range of
$4 to $8 billion annually since 2001.

Energy Policy Research Foundation, Inc. 1031 31st Street, NW Washington, DC 20007 · 202.944.3339 · eprinc.org 30
Appendix Figure 3. OCS Oil and Gas Revenues
Source: MMS Data
Figure 4 below shows annual OCS production of oil, gas, and NGLs (natural gas liquids). Gas has been
converted to barrels of oil equivalent (boe) basis – 5.6 mm BTU (million British Thermal Units) of gas per
barrel of oil.
Appendix Figure 4. Federal OCS Oil, Gas, and NGL Sales Volumes
Source: MMS Data, EPRINC Calculations
02000400060008000
100001200014000160001800020000
2001 2002 2003 2004 2005 2006 2007 2008 2009
Total Bonuses
Total Rents
NGL Royalty/Revenue (million $)
Gas Royalty/Revenue (million $)
Oil Royalty/Revenue (million $)
0
100
200
300
400
500
600
700
800
900
2001 2002 2003 2004 2005 2006 2007 2008 2009
mill
ion
barr
els p
er y
ear
Oil Sales Volume - mm bbl per year
Gas Sales Volume - mm boe (5,600,000 BTU)
NGL Sales Volume - mm bbl per year