Embed Size (px)
Citation preview
THE BEHAVIOR OF BEAMS SUBJECTED TO CONCENTRATED LOADS
by
Paul B. Summers
Joseph A. Yura
Sponsored by
American Iron and Steel Institute
Phil M. Ferguson Structural Engineering Laboratory
Department of Civil Engineering
University of Texas at Austin
PMFSEL Report No. 82-5
August 1982
A C K N 0 W L E D G M E N T S
The report herein, which is the M.S. thesis of Paul Summers,
was sponsored by the American Iron and Steel Institute. Their finan
cial support is greatly appreciated. The facilities of both the Phil
M. Ferguson Structural Engineering Laboratory and the Department of
Civil Engineering at The University of Texas at Austin were used.
computer analysis was done using the University computer system.
The
The authors also acknowledge the guidance of Dr. C. Phillip
Johnson, who was the other member of Paul Summers'supervisory commit
tee, Dr. Karl H. Frank and Dr. Richard E. Klingner. Special thanks
are extended to graduate students John M. Joehnk and to David R.
Wright who helped in this research.
The help of Hank Franklin and James Stewart in the prepara
tion of the model beams, and the assistance of Dave Whitney and Bob
Gedies in the photography is sincerely appreciated. Also acknowledged
is the continual assistance of Laurie Golding and Maxine DeButts, and
the friendly cooperation of both Tina Robinson who typed the complete
manuscript and Deanna Thomas who so excellently drafted all of the
figures.
ii
A B S T R A C T
Tests on composite steel and concrete beams, continuous steel
beams and simply supported plexiglass model beams, subjected to a
concentrated load at midspan have demonstrated a buckling phenomenon
where the bottom flange, which is primarily in tension, moves
laterally. A complete parametric study was undertaken using a
linear elastic finite element buckling analysis program to gain
insight into this behavior.
Results are presented for beams under a single midspan
concentrated load with varying end restraint in-plane. The phenom
enon was found to be a combination of local web buckling and lateral
torsional buckling, the former effect being dominant in simply
supported beams and the latter in fixed ended beams. For beams with
end restraint in between these cases (including most continuous
beams), an interaction of the two effects occurs.
It was found that bending stresses significantly influence
the load at which there is a local web buckle between the top and
bottom flange braces at the load point. Also observed was the fact
that when the bottom flange was unbraced, the addition of a brace
there did little to increase the buckling load if the beam was
simply supported, but dramatically increased it when the beam was
fixed ended.
Design recommendations for beams subjected to concentrated
loads are provided along with a design example.
iii
Chapter
1
2
3
4
T A B L E 0 F C 0 N T E N T S
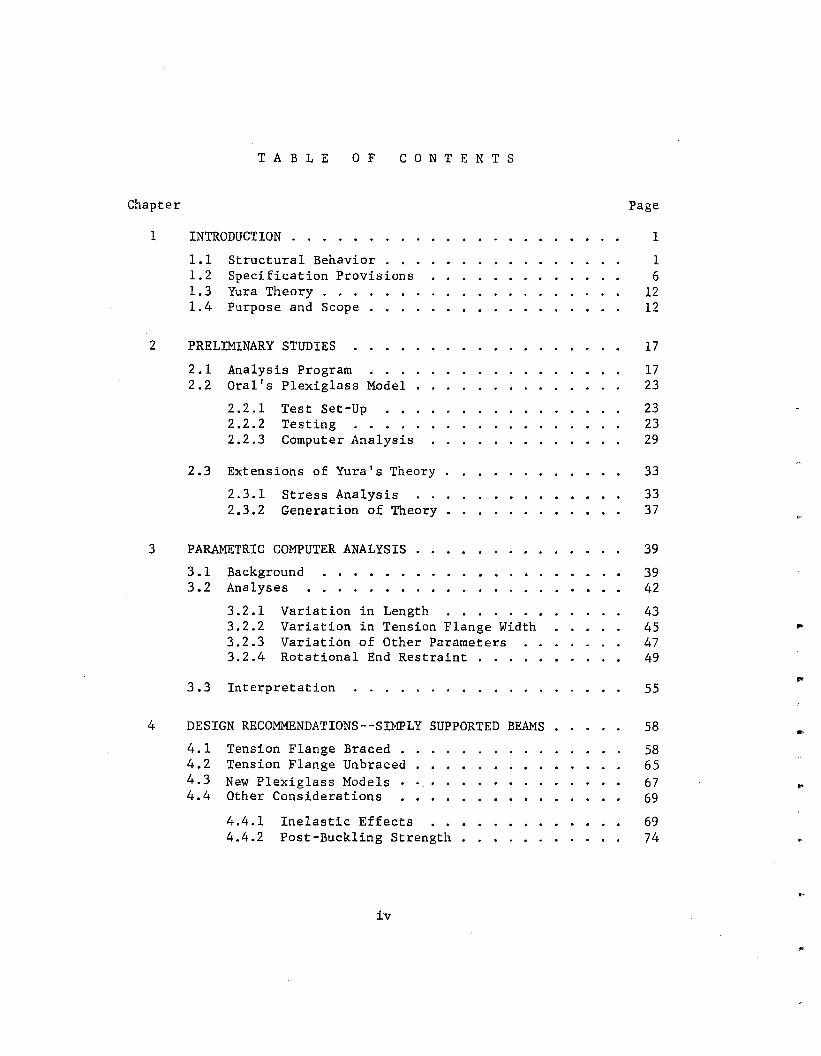
INTRODUCTION . . • . . .
1.1 1.2 1.3 1.4
Structural Behavior Specification Provisions Yura Theory Purpose and Scope
PRELIMINARY STUDIES
2.1 Analysis Program •. 2.2 Oral's Plexiglass Model
2.2.1 2.2.2 2.2.3
Test Set-Up Testing Computer Analysis
2.3 Extensions of Yura's Theory
2.3.1 2.3.2
Stress Analysis Generation of Theory
PARAMETRIC COMPUTER ANALYSIS
3.1 3.2
Background Analyses
3.2.1 3.2.2 3.2.3 3.2.4
Variation in Length Variation in Tension Flange Width Variation of Other Parameters Rotational End Restraint
3.3 Interpretation
DESIGN RECOMMENDATIONS--SIMPLY SUPPORTED BEAMS
4.1 Tension Flange Braced . 4.2 Tension Flange Unbraced 4.3 New Plexiglass Models • 4.4 Other Considerations
4.4.1 Inelastic Effects 4.4.2 Post-Buckling Strength •
iv
Page
1
1 6
12 12
17
17 23
23 23 29
33
33 37
39
39 42
43 45 47 49
55
58
58 65 67 69
69 74
..
..
Chapter
5
6
7
DESIGN RECOMMENDATIONS--FIXED ENDED BEAMS
5.1 5.2
Bottom Flange Braced Bottom Flange Unbraced
5.2.1 5.2.2 5.2.3
Bottom Flange Models Single Spring Model Limitations . . ..
DESIGN RECOMMENDATIONS--BEAMS WITH VARYING END MOMENTS
6.1 Bottom Flange Braced 6.2 Bottom Flange Unbraced 6.3 Continuous Beams 6.4 Design Example
SUMMARY AND CONCLUSIONS
APPENDIX 1 Basler Theory •
APPENDIX 2 Yura Theory • .
APPENDIX 3 Lateral-Torsional Buckling Examples
APPENDIX 4 Results of Parametric Study
BIBLIOGRAPHY
v
Page
76
76 77
78 83 87
89
89 89 91 95
98
101
104
107
112
116
a
b
b s
c· b
c w
d we
E
G
h
I
NOTATION
Area of flange
.}Ec /GJ w
Width of flange
Effective length of web used in calculation of spring stiffness
Width of stiffener
Distance from neutral axis of beam cross section to midthickness plane of bottom flange
Torsional ~arping constant
Coefficient for lateral-torsional buckling of a beam
Distance between flange centerlines
Distance from web-compression flange junction to neutral axis
Modulus of elasticity
Elastic shear modulus
Joint bending stiffness ratio (subscripts apply to respective ends of the column)
Clear distance between flanges
Moment of inertia of cross section
If Moment of inertia of flange for out-of-plane bending
I Moment of inertia of unit width of web w
I Moment of inertia of cross section about y-axis y
J Torsion constant
Jtf Torsion constant of top flange
vi
"'
k
L
M cr
M M sm' la
m
p cr
Out-of-plane geometric stiffness
In-plane structural stiffness
Out-of-plane structural stiffness
Stiffness of bottom flange lateral spring
Minimum spring stiffness required to force buckling into second mode of an axially compressed flange = 4P*/L
Length of beam
Length between inflection points of beam
Length of beam between brace points
Elastic buckling moment of beam
Negative end moment
Smaller and larger end moments of a section of beam between braces. Ratio M /M1 is moment coefficient for lateral-
. 1 b kl.sm a tors1ona uc 1ng.
Uniformly distributed moment
Applied concentrated load; in X,Y directions, respectively.
Buckling load given by Basler Theory
Buckling load for fixed ended beams with unbraced bottom flange
Buckling load for beams of end restraint defined by a with unbraced bottom flange
Elastic buckling load of beam
Reference Euler buckling load of pinned-pinned web column = ~Et 3fl2h
w
Load to cause local web buckling
Buckling load of simply supported beam with unbraced tension flange
vii
p*
T
t
t s
t w
X,Y,Z
u,v,w
A
e
v
Buckling load of beam when only vertical stresses are present
Reference load at which an axially compressed flange would buckle in the second mode = 4~Eif/L2
Stiffnesses of rotational springs applied at ends of web column
Nodal forces due to in-plane loading
Nodal displacements due to in-plane loading
Out-of-plane displacements (buckled shape)
Stiffness of lateral spring applied at end of web column
Nondimensional spring stiffness = Th/PE
Thickness of flange
Thickness of stiffener
Thickness of web
Coordinate axes
Displacements in X, Y, and Z directions, respectively
Coefficient representing negative end restraint = ~/(PL/8)
Lateral deflection of bottom flange in buckled state
Components of A due to translation of top flange, rotation of top flange, and bending distortion of web, respectively
Lateral deflection of tension flange under unit midspan lateral load = L3/48Eif
Rotation of the top flange at buckling
Rotations about X,Y axes, respectively
Constant used in computing lateral buckling load
Poisson's ratio
viii
TI 3.1416
Stress
Bending stress at web-flange junction under critical load to cause local web buckling
Critical stress for web buckling in bending
Critical buckling stress in the bottom flange
Vertical compressive stress under load in web
Maximum vertical compressive stress under load in web
Reference stress = P*/Af
ix

C H A P T E R 1
INTRODUCTION
1.1 Structural Behavior
A beam subjected to gravity loads along a laterally supported
top flange would be checked for yielding in bending and shear, local
buckling of the compression flange and web behavior under any
concentrated loads. The web would be checked for both buckling and
yielding under each concentrated load. If the beam is simply
supported, the above mentioned failure modes assume that the bottom
(tension) flange does not move laterally. However, it has been
observed experimentally that under certain circumstances, beams both
simply supported and those with any degree of end fixity or continuity,
can reach a state of instability in a mode that previously has been
rarely acknowledged.
Tests at both Lehigh University and at The University of
Texas at Austin have shown beams buckling with lateral movement of
the bottom flange. In a continuous beam this flange is primarily
in tension (with some compression near the supports), but in a
simply supported beam it is purely i~ tension. These beams had
sufficient late'ral bracing of the "compression" flange to ensure that
conventional lateral-torsional buckling had not yet occurred at the
loads under which they failed.
Daniels and Fisherll conducted tests on simply supported
composite beams with a span of 25 ft. between bearings. The beams
consisted of a reinforced concrete slab 60 in. wide and 6 in. thick
connected to a W2lx62 steel beam by pairs of stud shear connectors.
The beams were supported at their ends by steel rollers that were
free to move as the lower flange extended during loading. Figure 1.1
shows the beam cut at midspan after the test. At the failure load
1
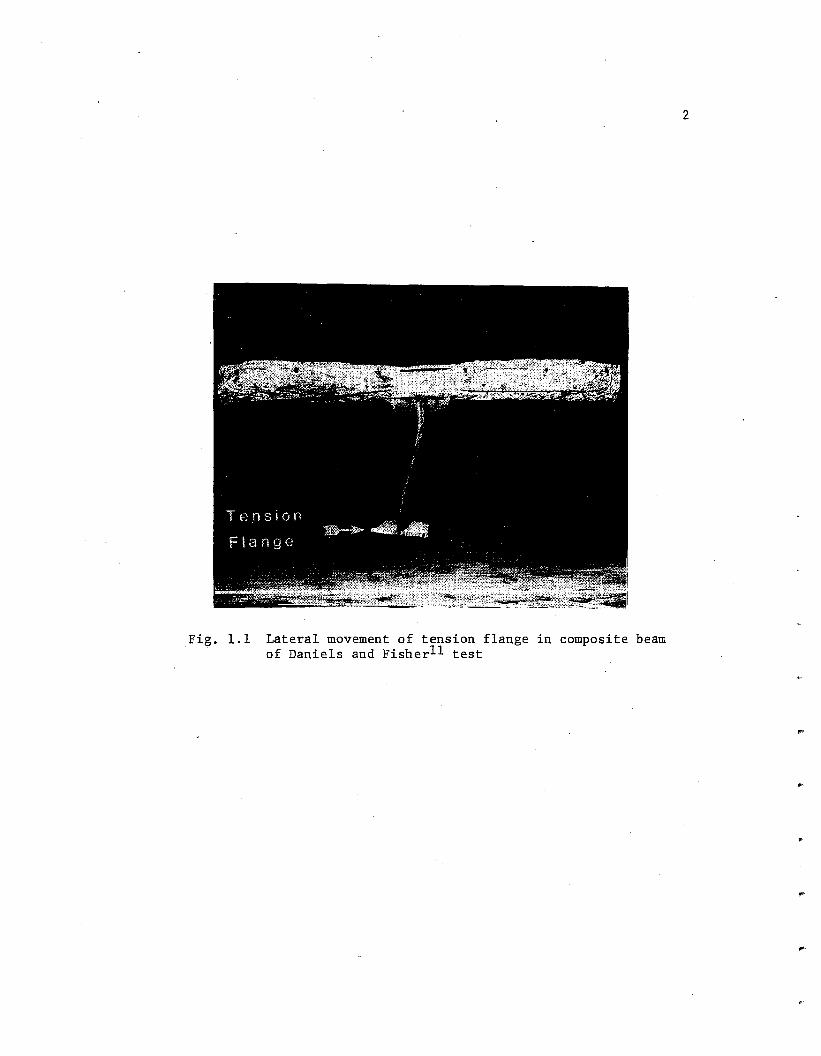
Fig. 1.1 Lateral movement of tension flange in composite beam of Daniels and Fisherll test
2
crushing of the concrete had progressed to full depth of the slab
and considerable yielding of the steel beam had occurred, but
astonishingly, the tension flange had deflected laterally.
Bansal4 and Yural8 have reported the results of a research
program of over forty tests on three-span continuous steel beams.
The loading and support conditions for the test beams were so
arranged as to simulate a real beam in a rigid building frame. The
loads on the beams were applied to the bottom flange and upwards
rather than in the gravity load orientation for ease of testing,
3
and were only applied in the ~entral span (20ft.). The side spans
(4 ft.-6 in.) provided continuity to the beam at the interior support
points where vertical stiffeners were welded to the web. Lateral
bracing was provided at supports and load points.
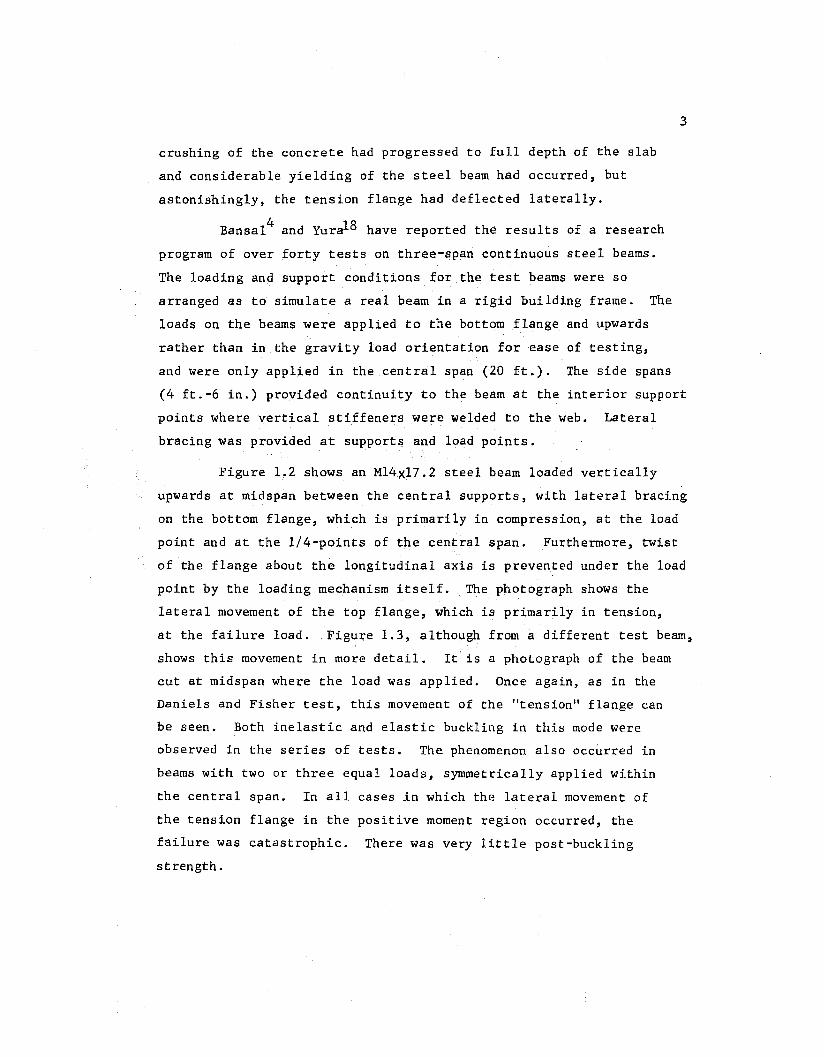
Figure L 2 shows an Ml4xl7. 2 steel beam loaded vertically
upwards at midspan between the central supports, with lateral bracing
on the bottom flange, which is primarily in compression, at the load
point and at the 1/4-points of the central span. Furthermore, twist
of the flange about the longitudinal axis is prevented under the load
point by the loading mechanism itself. The photograph shows the
lateral movement of the top flange, which is primarily in tension,
at the failure load .. Figure 1.3, although from a different test beam,
shows this movement in more detail. It is a photograph of the beam
cut at midspan where the load was applied. Once again, as in the
Daniels and Fisher test, this movement of the "tension" flange can
be seen. Both inelastic and elastic buckling in this mode were
observed in the series of tests. The. phenomenon also occurred in
beams with two or three equal loads, symmetrically applied within
the central span. In all cases in which the lateral movement of
the tension flange in the positive moment region occurred, the
failure was catastrophic. There was very little post-buckling
strength.

Fig. 1.2 Lateral movement of 11 tension 11 flange in three-span continuous beaml8
:; '.
4
...
...
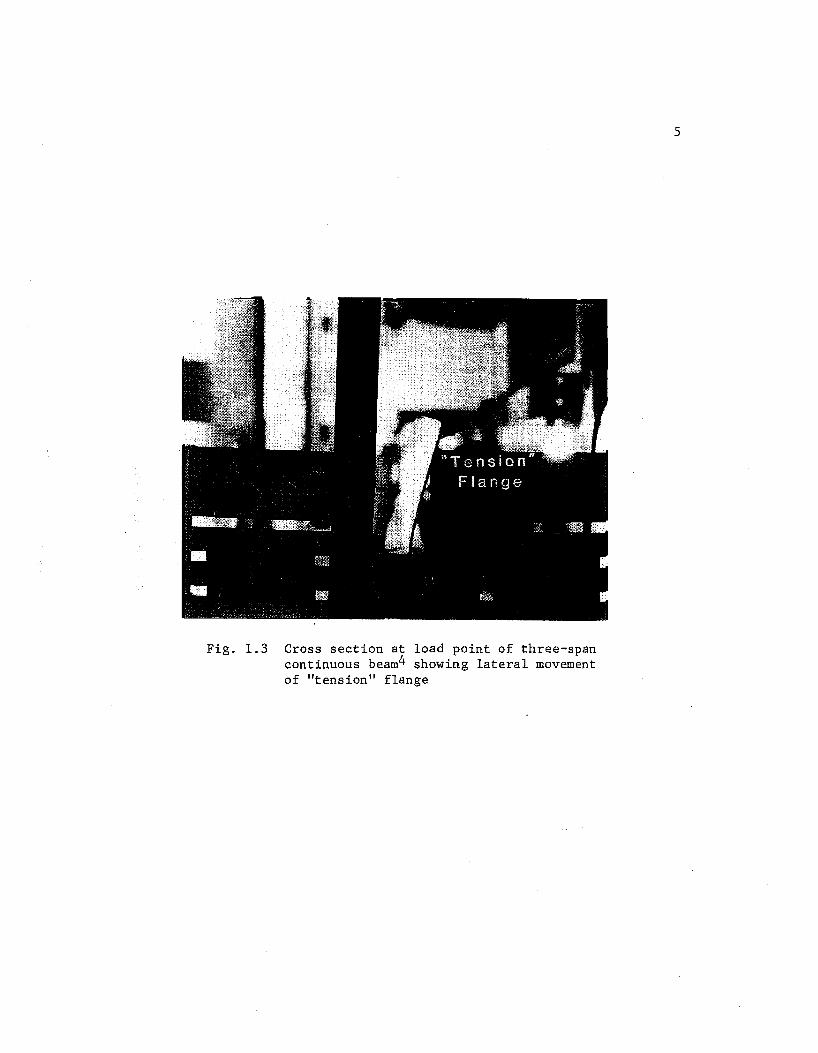
Fig. 1. 3 Cross section at load point of three-span continuous beam4 showing lateral movement of "tension" flange
5
A third observation of the phenomenon was an acrylic
(plexiglass) model beam of wide-flange shape developed by Oral,
a graduate student of The University of Texas at Austin. The
beam was simply supported over a 24 in. span and was 1-l/2 in. deep.
The bracing and loading arrangements were the same as those for the
continuous beam of Fig. 1.2.
Figure 1.4 shows once again that the phenomenon of a failure
mode, in which the flange primarily in 11 tension 11 deflects laterally,
6
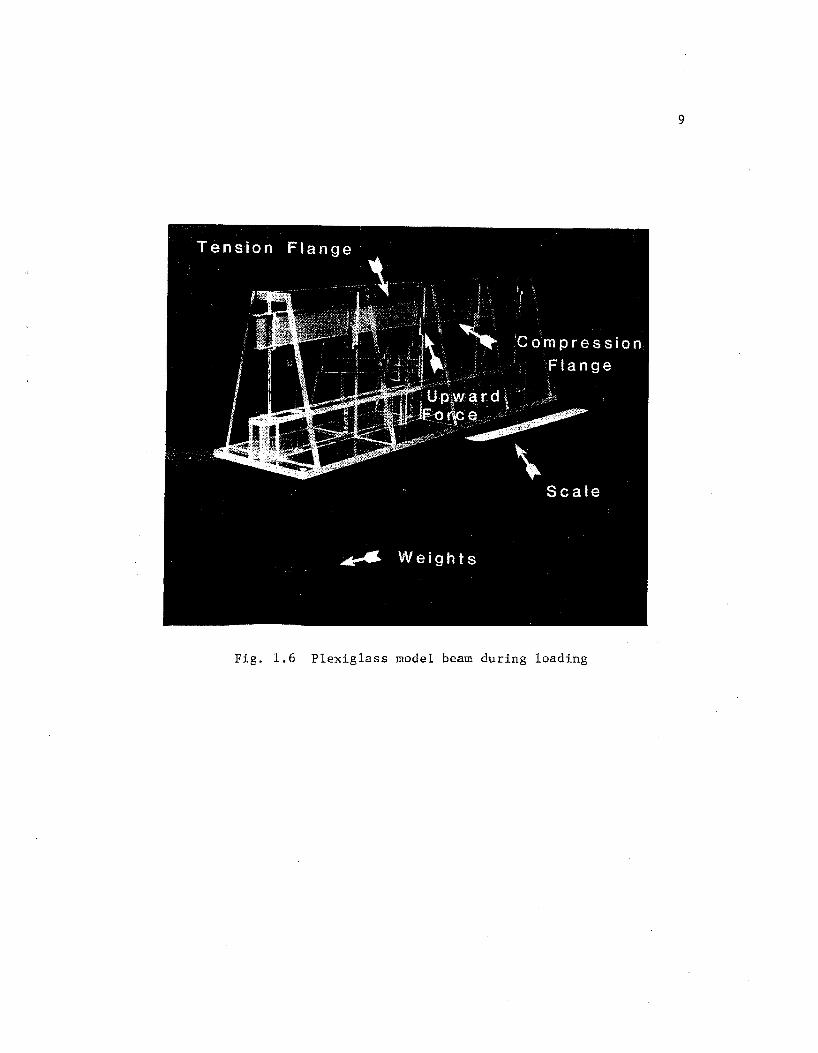
clearly exists. A plan view of the buckled beam is seen in Fig. 1. 5,
and a side view of it during loading is shown in Fig. 1.6.
1.2 Specification Provisions
Both the 1978 AISC Specification3 and the Structural Stability
Research Council (SSRC)l7 Guide contain provisions enabling the
designer to approximate the elastic buckling moment for !-beams, wide
flange sections or doubly symmetric plate girders when such members
are loaded by end couples in the plane of the web, or by transverse
loads applied in the plane of the web. The load to cause lateral
torsional buckling of the beam can be obtained from the following
equation:
where
( 1.1)
M = elastic buckling moment cr
E
G
buckling coefficient dependent on loading and support conditions obtained from information reported by Clark and Hill9 and Salvadoril6
unbraced length of beam
; modulus of elasticity
= shear modulus
; weak-axis moment of inertia
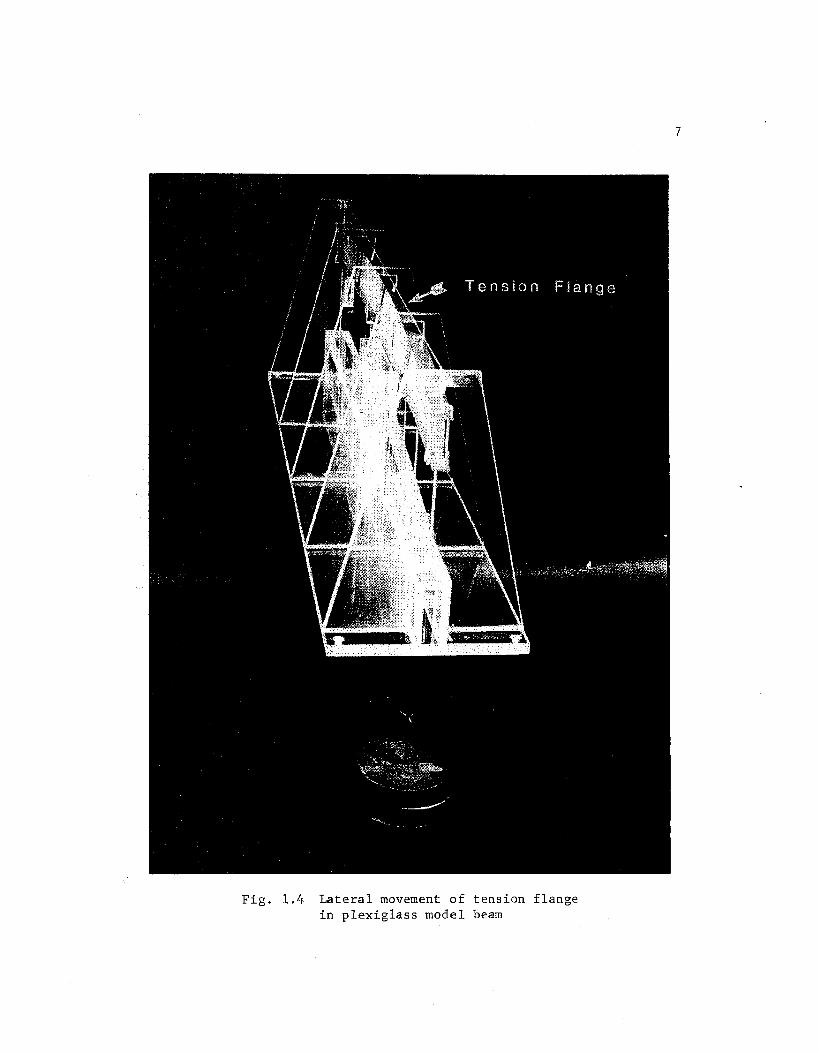
Fig. 1.4 Lateral movement of tension flange in plexiglass model beam
7
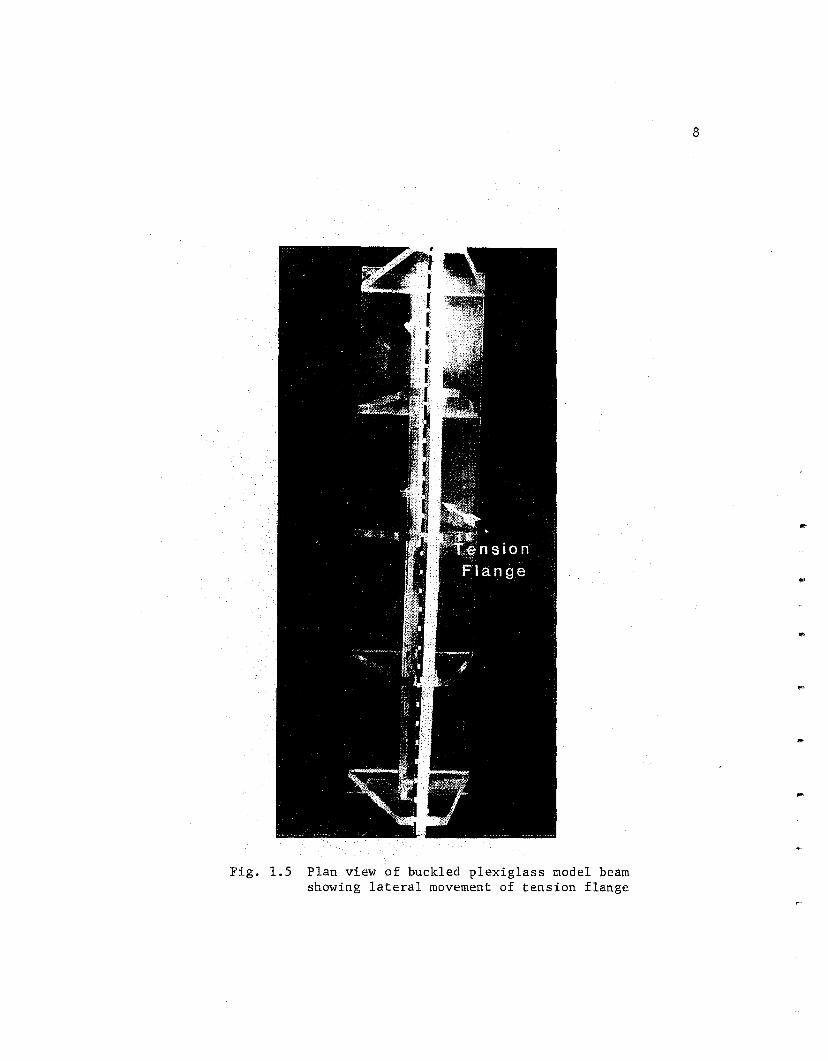
Fig. 1.5 Plan view of buckled plexiglass model beam showing lateral movement of tension flange
8
9
Fig. 1.6 Plexiglass model beam during loading
a2 = EC /GJ w
C warping constant w
J = torsional constant
lO
Use of Eq. (1.1) in this form requires that both flanges are free to
warp at the supports (i.e., pinned laterally).
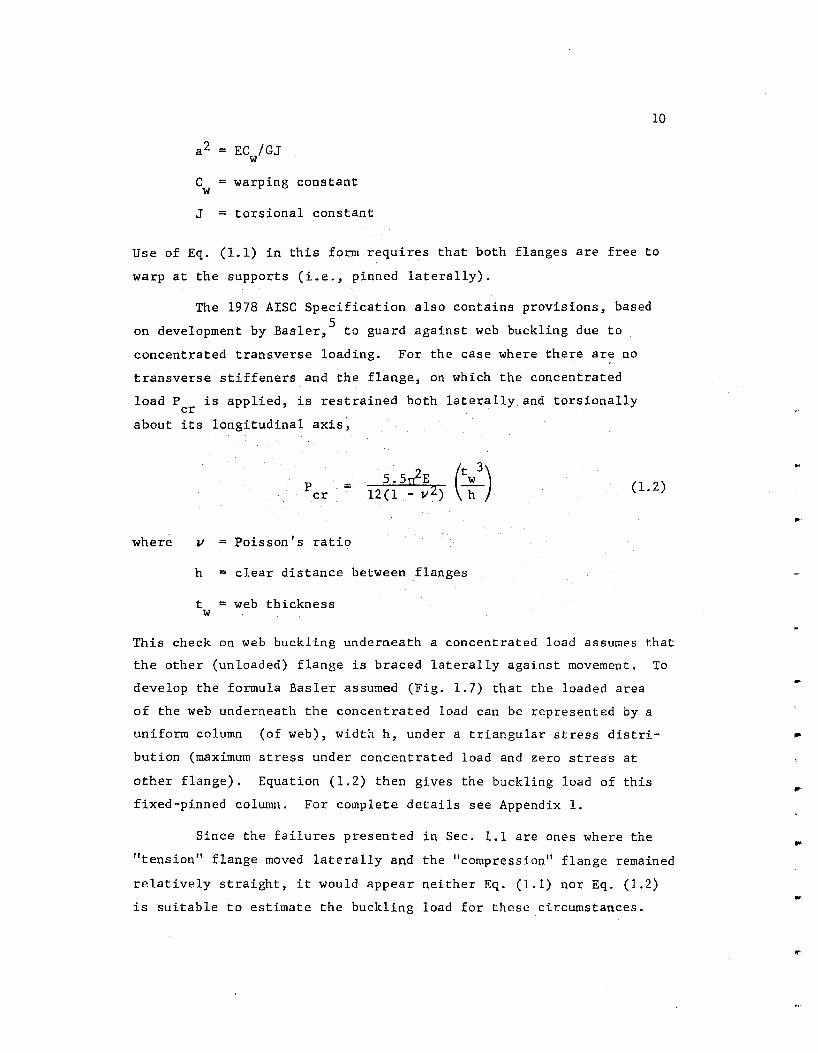
The 1978 AISC Specification also contains provisions, based 5 on development by Basler, to guard against web buckling due to
concentrated transverse loading. For the case where there are no
transverse stiffeners and the flange, on which the concentrated
load P is applied, is restrained both laterally and torsionally cr
about its longitudinal axis~
where
p = cr
11 =Poisson's ratio
5. SrCE (twh3
) 12 (1 - vZ)
h clear distance between flanges
t = web thickness w
( l. 2)
This check on web buckling underneath a concentrated load assumes that
the other (unloaded) flange is braced laterally against movement. To
develop the formula Basler assumed (Fig. 1.7) that the loaded area
of the web underneath the concentrated load can be represented by a
uniform column (of web), width h, under a triangular stress distri
bution (maximum stress under concentrated load and zero stress at
other flange). Equation (1.2) then gives the buckling load of this
fixed-pinned column. For complete details see Appendix 1.
Since the failures presented in Sec. 1.1 are ones where the
"tension" flange moved laterally and the "compression" flange remained
relatively straight, it would appear neither Eq. (1.1) nor Eq. (1.2)
is suitable to estimate the buckling load for these circumstances.
.,,
..
...
...
LOADED AREA OF WEB
~p
~
~
p ~
h ~
~
~
MODEL
I I
\ \
p
,--- ...... ,. '
" .... -
fw
\
I I
I
h ~I
GEOMETRY
Fig. l .7 Basler's Model5
h
11
STRESS DISTRIBUTION
Furthermore, use of these equations can result in a considerable
overestimate of the buckling load.
1.3 Yura Theory
12
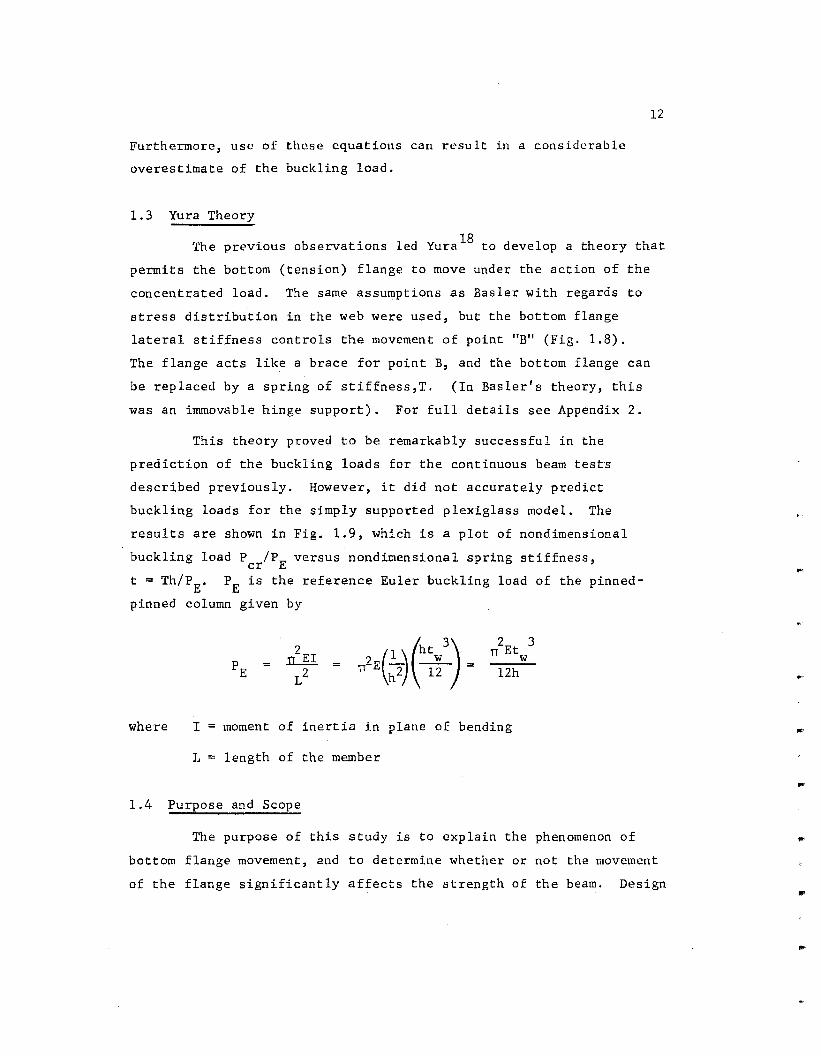
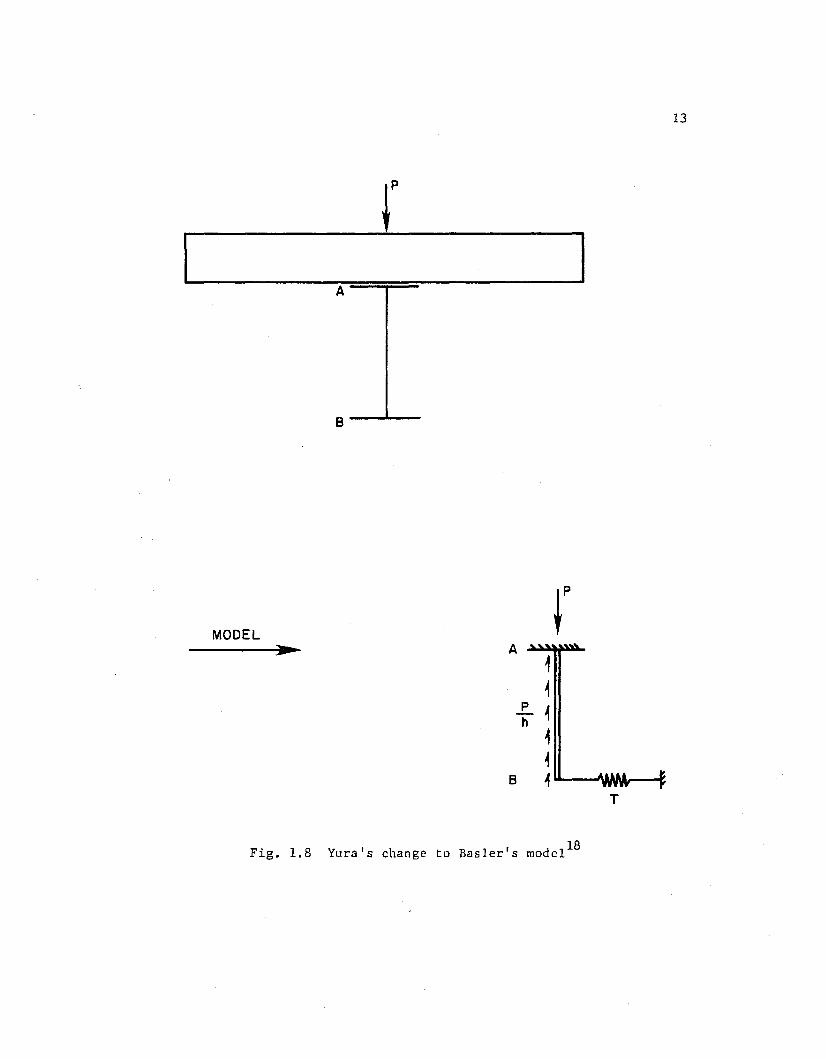
The previous observations led Yura 18 to develop a theory that
permits the bottom (tension) flange to move under the action of the
concentrated load. The same assumptions as Basler with regards to
stress distribution in the web were used, but the bottom flange
lateral stiffness controls the movement of point "B" (Fig. 1.8).
The flange acts like a brace for point B, and the bottom flange can
be replaced by a spring of stiffness,T. (In Basler's theory, this
was an immovable hinge support). For full details see Appendix 2.
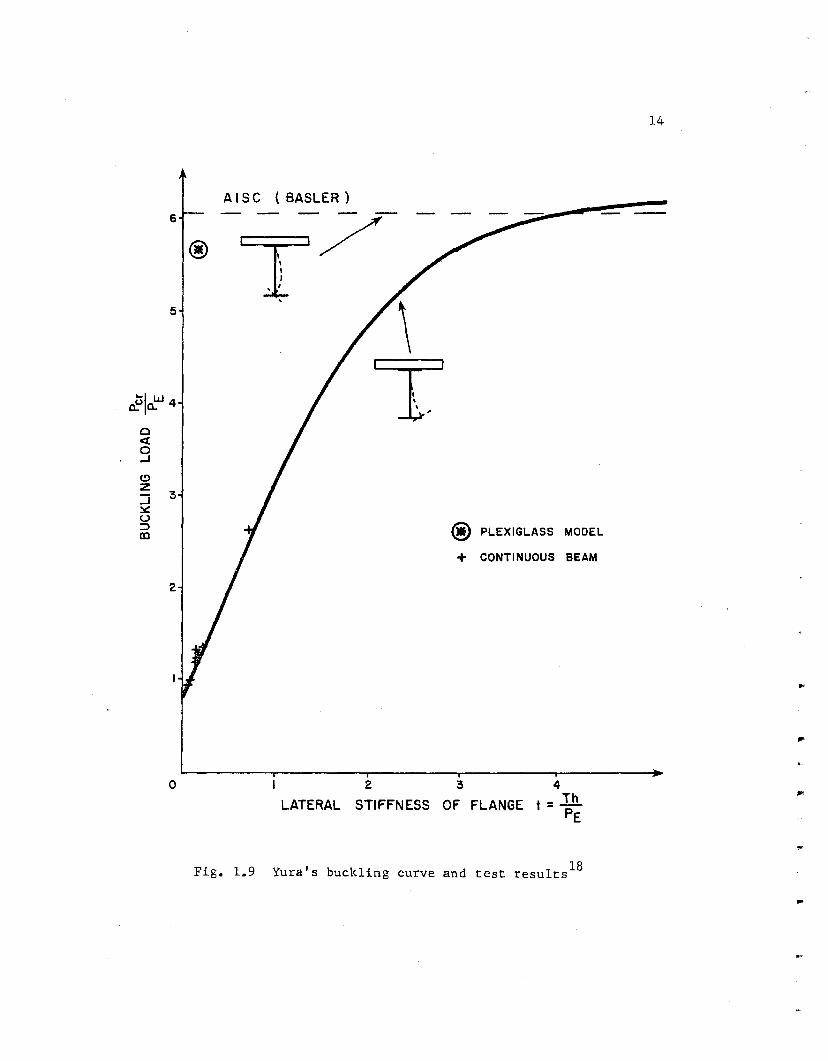
This theory proved to be remarkably successful in the
prediction of the buckling loads for the continuous beam test·s
described previously. However, it did not accurately predict
buckling loads for the simply supported plexiglass model. The
results are shown in Fig. 1.9, which is a plot of nondimensional
buckling load P /PE versus nondimensional spring stiffness, cr t = Th/PE. PE is the reference Euler buckling load of the pinned-
pinned column given by
2 3 TT Et w
12h
where I moment of inertia in plane of bending
L length of the member
1.4 Purpose and Scope
The purpose of this study is to explain the phenomenon of
bottom flange movement, and to determine whether or not the movement
of the flange significantly affects the strength of the beam. Design
...
...
..
r A
8 _ __., __
MODEL r .. A i ~
p ~ h ~
~ 8 ~
18 Fig. 1.8 Yura's change to Basler's model
13
T
6
5
~, w ~0.. 4
0 <t 0 ...I
C!> z :J ~ u => III
2
0
®
A IS C ( BASLER )
\ T
® PLEXIGLASS MODEL
+ CONTINUOUS BEAM
I 2 3 4
LATERAL STIFFNESS OF FLANGE t = Th PE
Fig. 1.9 Yura's buckling curve and test results 18
14
..
15
recommendations for control of this behavior in both simply supported
and restrained beams will be provided.
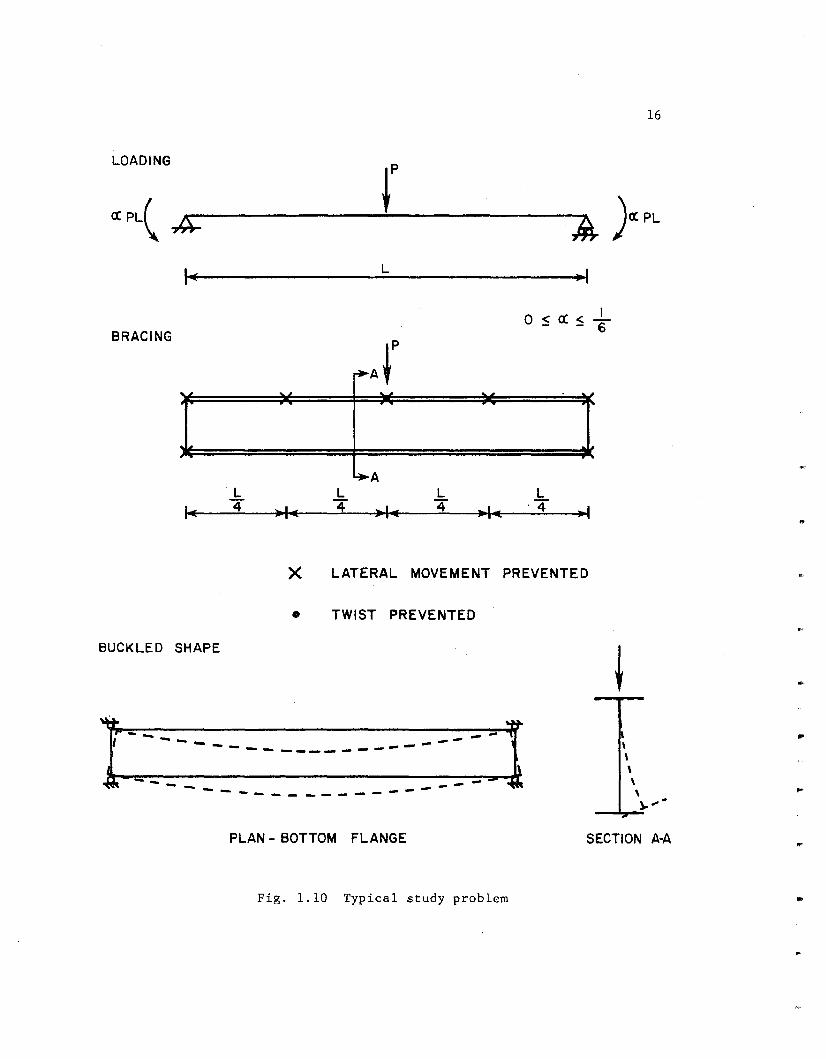
Only beams symmetric in both loading and boundary conditions
are considered. They may be simply supported or have any degree of
end fixity (to simulate restrained or continuous beams). As shown
in Fig. 1.10, the beams are loaded at midspan qy a single concentrated
load applied on the top. flange, which is braced at this point bot~
laterally and torsionally about its longitudinal axis. In order to
provide an explanation of the phenomenon in question, braces were
often provided at various other points along the length, L. The
beams are restrained at each end on the top flange laterally, and,
on the bottom flange also against twist. The cross section is always
free to warp (rotate about the vertical axis) of both ends.
Chapter 2 presents some details of the finite element
elastic buckling analysis program used in this study, a description
of the initial plexiglass beam experiment, and some comparisons of
the results with Yura's theory. A detailed parametric computer
study was undertaken in Chapter 3 to develop a fundamental under
standing of the phenomenon. Chapters 4, 5 and 6 present design
recommendations for simply supported beams, fixed ended beams, and
beams with a varying amount of end moment respectively, for both
laterally braced or unbraced bottom flanges under the load point.
A complete sample design problem is included.
16
LOADING r a: PL( .,¢;.. >% )a:PL L
0 :S C( :S I 6
BRACING
~Ar .. ..
. ~A
L L L L
I• 4 •I~
4 ,..1~ 4 •I~
·4 •I
X LATERAL MOVEMENT PREVENTED
• TWIST PREVENTED
BUCKLED SHAPE
1.~~~ ~~~~-~
!I ~--------------------
~-- ~~~ ........ _ ------------PLAN- BOTTOM FLANGE
Fig. 1.10 Typical study problem
l ' \ \ \ \ ).. ..... _....,... ....
SECTION A-A
"'
..
C H A P T E R 2
PRELIMINARY STUDIES
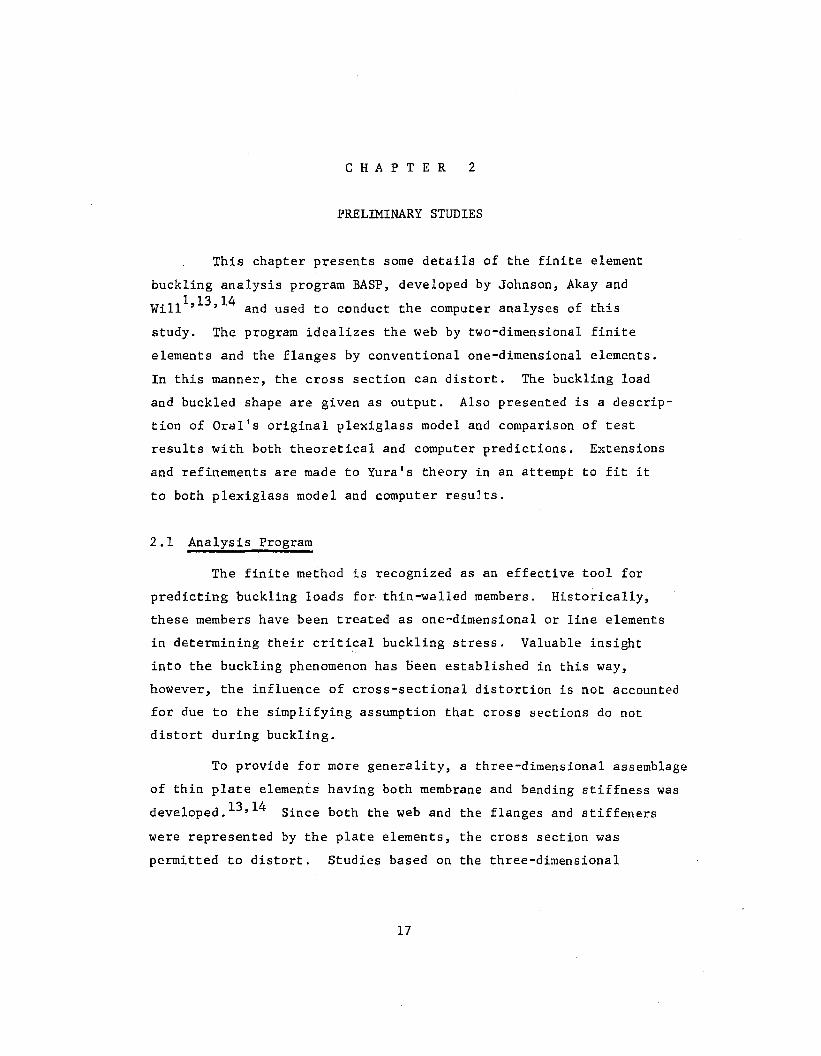
This chapter presents some details of the finite element
buckling analysis program BASP, developed by Johnson, Akay and
Will1
•13 • 14 and used to conduct the computer analyses of this
study. The program idealizes the web by two-dimensional finite
elements and the flanges by conventional one-dimensional elements.
In this manner, the cross section can distort. The buckling load
and buckled shape are given as output. Also presented is a descrip
tion of Oral's original plexiglass model and comparison of test
results with both theoretical and computer predictions. Extensions
and refinements are made to Yura's theory in an attempt to fit it
to both plexiglass model and computer results.
2.1 Analysis Program
The finite method is recognized as an effective tool for
predicting buckling loads for thin-walled members. Historically,
these members have been treated as one-dimensional or line elements
in determining their critical buckling stress. Valuable insight
into the buckling phenomenon has oeen established in this way,
however, the influence of cross-sectional distortion is not accounted
for due to the simplifying assumption that cross sections do not
distort during buckling.
To provide for more generality, a three-dimensional assemblage
of thin plate elements having both membrane and bending stiffness was
developed. 13 • 14 Since both the web and the flanges and stiffeners
were represented by the plate elements, the cross section was
permitted to distort. Studies based on the three-dimensional
17
18
assemblage indicated that deep sections with top or bottom restraints
did in fact exhibit significant cross-sectional distortion. The
critical load was in turn substantially affected. This procedure
has the advantage of simulating complex structures, however, the
ensuing computational times are significant.
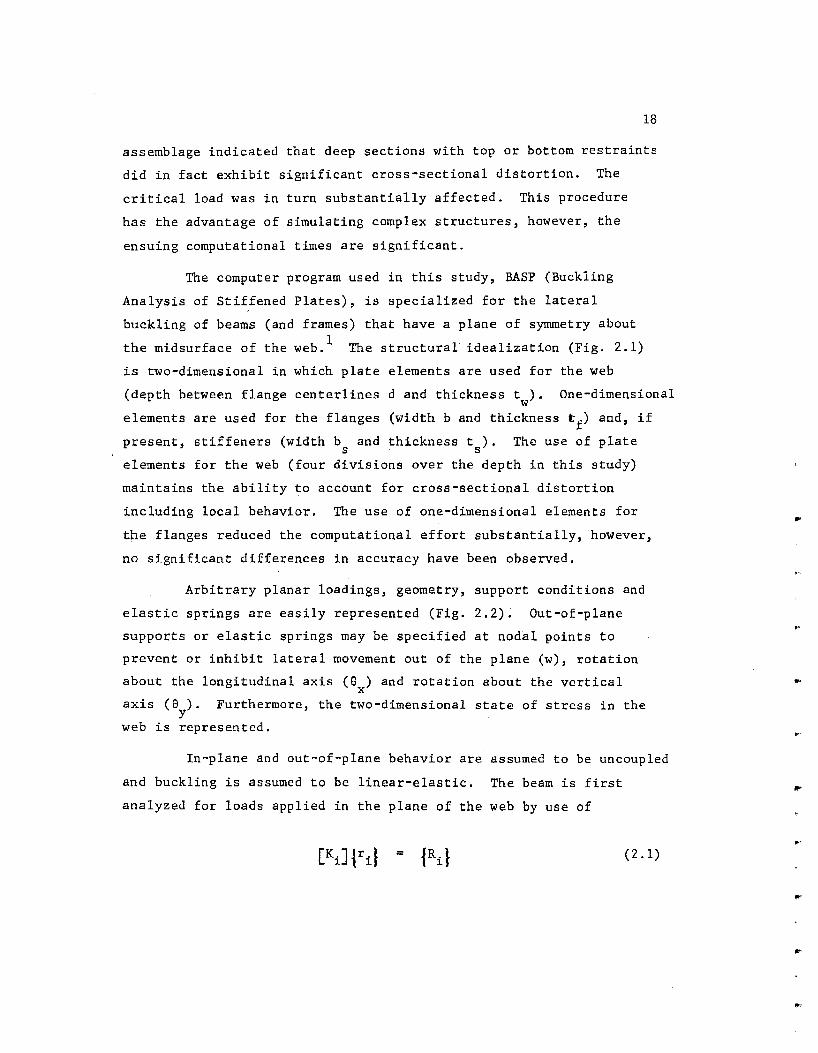
The computer program used in this study, BASP (Buckling
Analysis of Stiffened Plates), is specialized for the lateral
buckling of beams (and frames) that have a plane of symmetry about
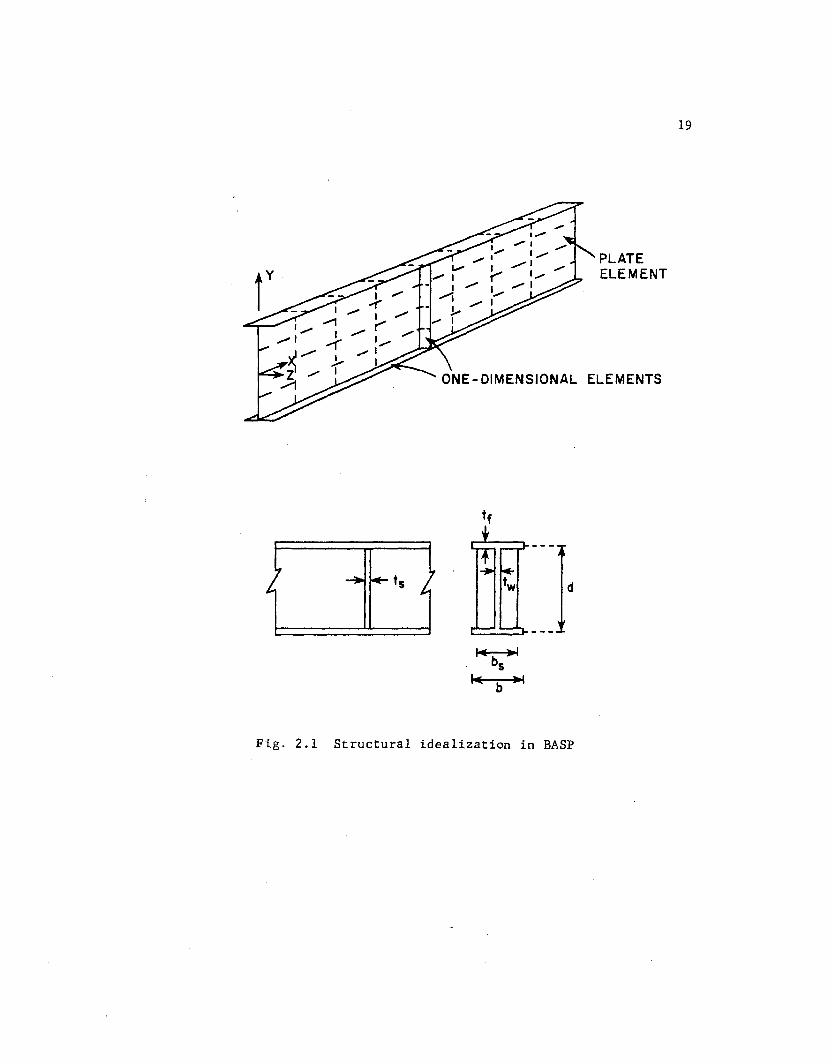
the midsurface of the web. 1 The structural idealization (Fig. 2.1)
is two-dimensional in which plate elements are used for the web
(depth between flange centerlines d and thickness t ). One-dimensional w elements are used for the flanges (width b and thickness tf) and, if
present, stiffeners (width b and thickness t ). The use of plate s s
elements for the web (four divisions over the depth in this study)
maintains the ability to account for cross-sectional distortion
including local behavior. The use of one-dimensional elements for
tpe flanges reduced the computational effort substantially, however,
no significant differences in accuracy have been observed.
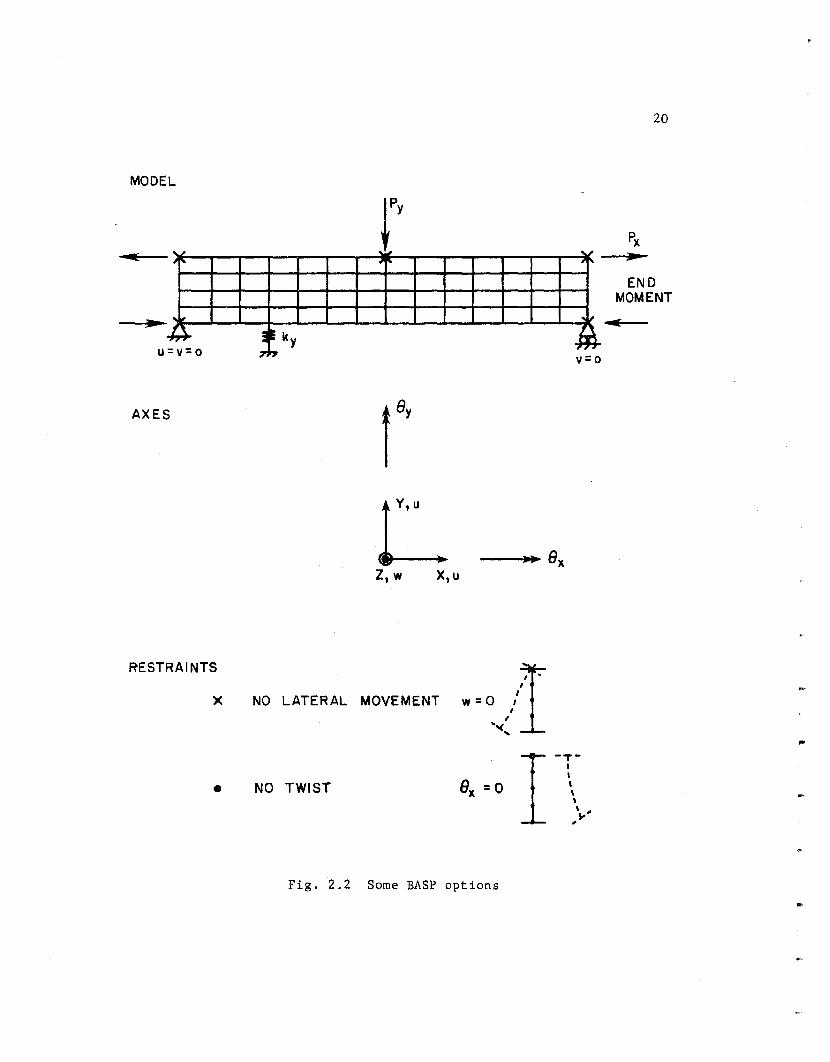
Arbitrary planar loadings, geometry, support conditions and
elastic springs are easily represented (Fig. 2.2). Out-of-plane
supports or elastic springs may be specified at nodal points to
prevent or inhibit lateral movement out of the plane (w), rotation
about the longitudinal axis (9 ) and rotation about the vertical X
axis (9 ). Furthermore, the two-dimensional state of stress in the y web is represented.
In-plane and out-of-plane behavior are assumed to be uncoupled
and buckling is assumed to be linear-elastic. The beam is first
analyzed for loads applied in the plane of the web by use of
= (2.1)
d
,. b .,
Fig. 2.1 Structural idealization in BASP
PLATE ELEMENT
19
MODEL
~
~ u =v=o
AXES
RESTRAINTS
X
•
'\J
"
=~ ky .:r.l7
r L ..,.., Bx z,w X,u
NO LATERAL MOVEMENT w = 0 ,/r· "-<
'
NO TWIST
Fig. 2.2 Some BASP options
., ~
= v 0
20
END MOMENT
...
21
in which K. represents the in-plane structural stiffness while R. 1 1
contains nodal forces due to in-plane loading, Equation (2.1) is
used to calculate in-plane displacements, r., which are subsequently 1
used to calculate in-plane stresses. These stresses give rise to
an out-of-plane geometric stiffness, K , which is used to calculate g
the buckling load from the following equation:
(2.2)
in which K is the out-of-plane structural stiffness while r 0 0
represents the out-of-plane buckled shape. The buckling load is
A times the applied loading. In Eqs. (2.1) and (2.2), K. and K are 1 0
uncoupled. This formulation is equivalent to the classical linearized
buckling theory in which displacements are assumed to be small, there
fore the buckled mode shape may be determined while the actual magni
tude of the buckled shape remains undefined. Inverse iteration is
used to solve the resulting eigenvalue problem, Eq. (2.2). This
yields the smallest load causing buckling normal to the plane of the
web. Buckling in the plane of the web is ignored.
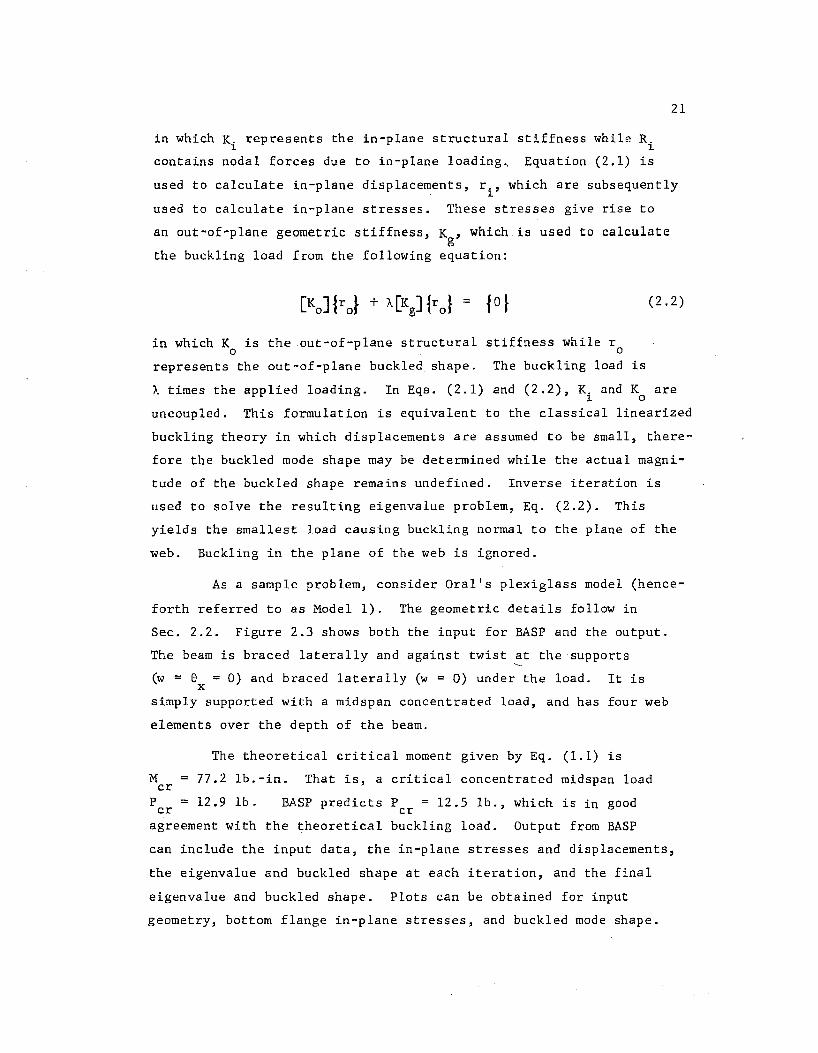
As a sample problem, consider Oral's plexiglass model (hence
forth referred to as Model 1). The geometric details follow in
Sec. 2.2. Figure 2.3 shows both the input for BASP and the output.
The beam is braced laterally and against twist -~t the supports
(w = 8 = 0) and braced laterally (w = 0) under the load. It is X
simply supported with a midspan concentrated load, and has four web
elements over the depth of the beam.
The theoretical critical moment given by Eq. (1.1) is
M = 77.2 lb.-in. That is, a critical concentrated midspan load cr
P = 12.9 lb. BASP predicts P = 12.5 lb., which is in good cr cr agreement with the theoretical buckling load. Output from BASP
can include the input data, the in-plane stresses and displacements,
the eigenvalue and buckled shape at each iteration, and the final
eigenvalue and buckled shape. Plots can be obtained for input
geometry, bottom flange in-plane stresses, and buckled mode shape.
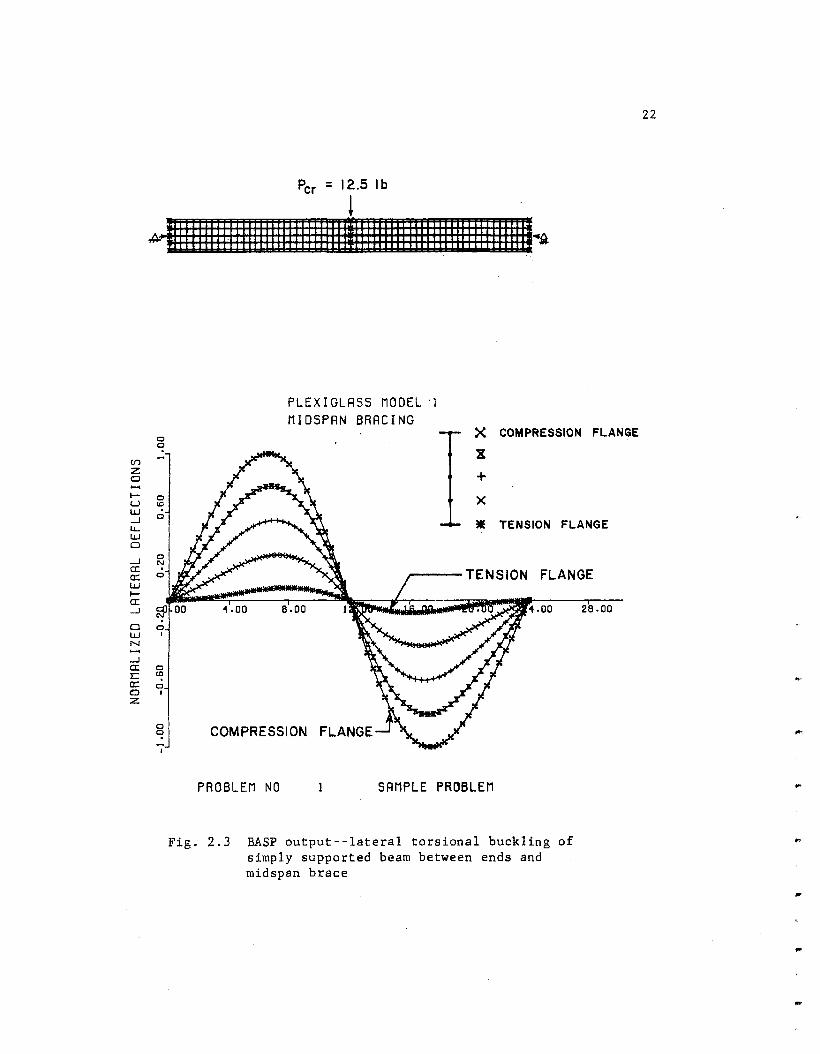
Per = 12.5 lb
l ~illlllllllllllllllllllllllllllillllllllllllllllllllllllllllli~
(/")
z 0
1-u w _J
lL w CJ
_J
a: 0: w 1-a: _J
0 0
0 to
0
0 t\1
0
Cl 0 l1.J I
N
_J
a: 0 I:: to 0: 0 0 I z
0 0
'\.oo
PLEXIGLASS MODEL ·1 MIDSPAN BRACING
X COMPRESSION FLANGE
X
+ X
31 TENSION FLANGE
----TENSION FLANGE
a.oo ... oo 28.00
COMPRESSION FLANGE
PROBLEM NO SAMPLE PROBLEM
Fig. 2.3 BASP output--lateral torsional buckling of simply supported beam between ends and midspan brace
22
..
...
...
23
The buckled-shape plot for Model 1 is shown on Fig. 2.3. The five
lines plotted correspond to the five nodes across any beam section
(for the four web divisions). Each data point represents a node
along the beam length. The lateral deflection, w, is normalized and
plotted at each of the five node levels. For the beam described
above, the plot indicates a lateral-torsional buckle between brace
points, with lateral movement primarily of the compression flange.
2.2 Oral's Plexiglass Model
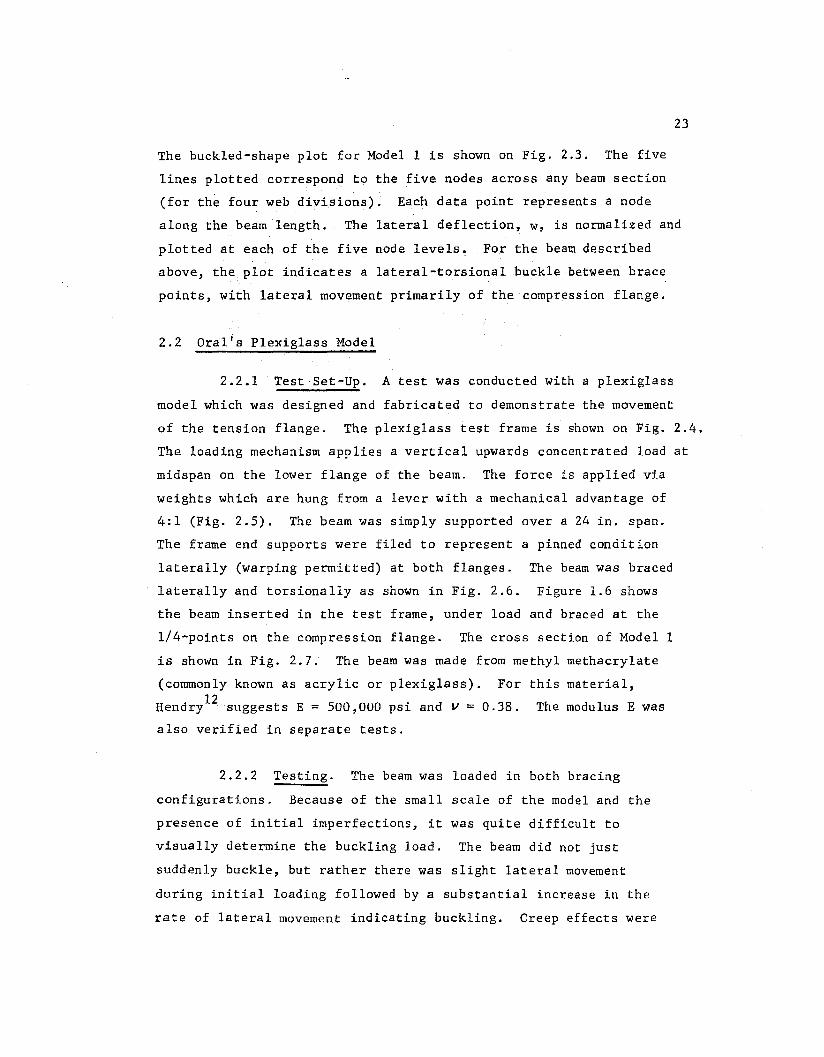
2.2.1 Test Set-Up. A test was conducted with a plexiglass
model which was designed and fabricated to demonstrate the movement
of the tension flange. The plexiglass test frame is shown on Fig. 2.4.
The loading mechanism applies a vertical upwards concentrated load at
midspan on the lower flange of the beam. The force is applied via
weights which are hung from a lever with a mechanical advantage of
4:1 (Fig. 2.5). The beam was simply supported over a 24 in. span.
The frame end supports were filed to represent a pinned condition
laterally (warping permitted) at both flanges. The beam was braced
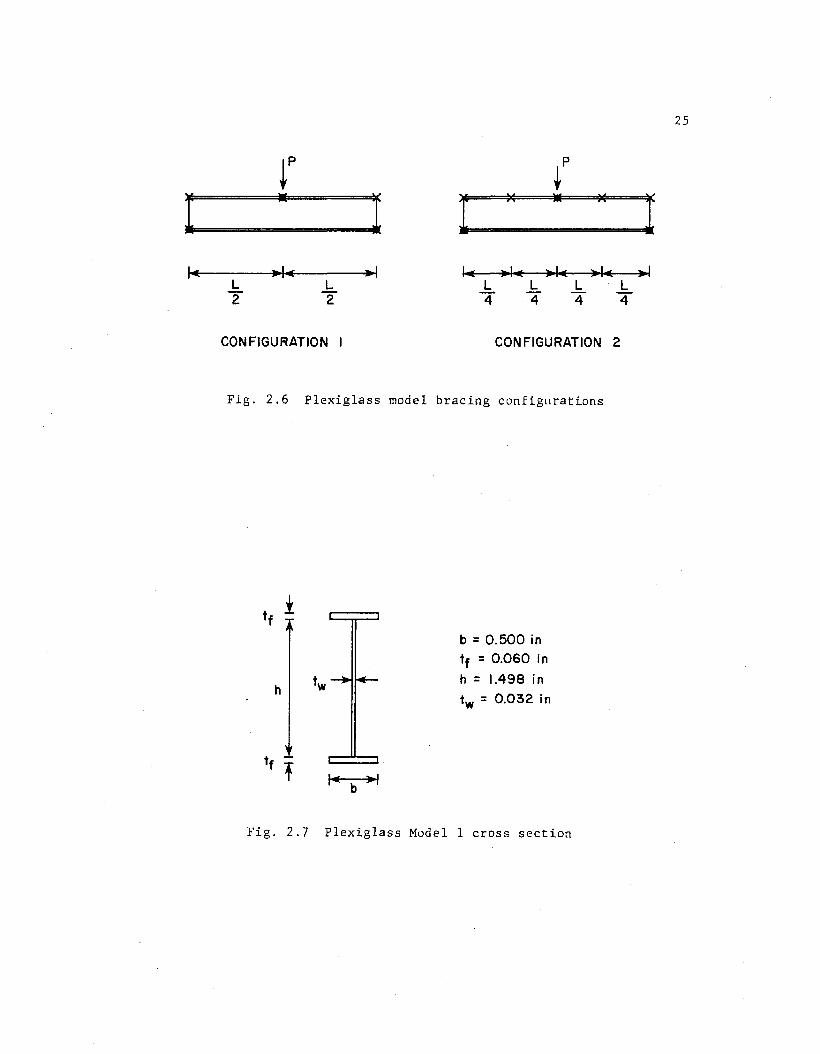
laterally and torsionally as shown in Fig. 2.6. Figure 1.6 shows
the beam inserted in the test frame, under load and braced at the
1/4-points on the compression flange. The cross section of Model 1
is shown in Fig. 2.7. The beam was made from methyl methacrylate
(commonly known as acrylic or plexiglass). For this material, 12 Hendry suggests E ~ 500,000 psi and v = 0.38. The modulus E was
also verified in separate tests.
2.2.2 Testing. The beam was loaded in both bracing
configurations. Because of the small scale of the model and the
presence of initial imperfections, it was quite difficult to
visually determine the buckling load. The beam did not just
suddenly buckle, but rather there was slight lateral movement
during initial loading followed by a substantial increase in the
rate of lateral movement indicating buckling. Creep effects were
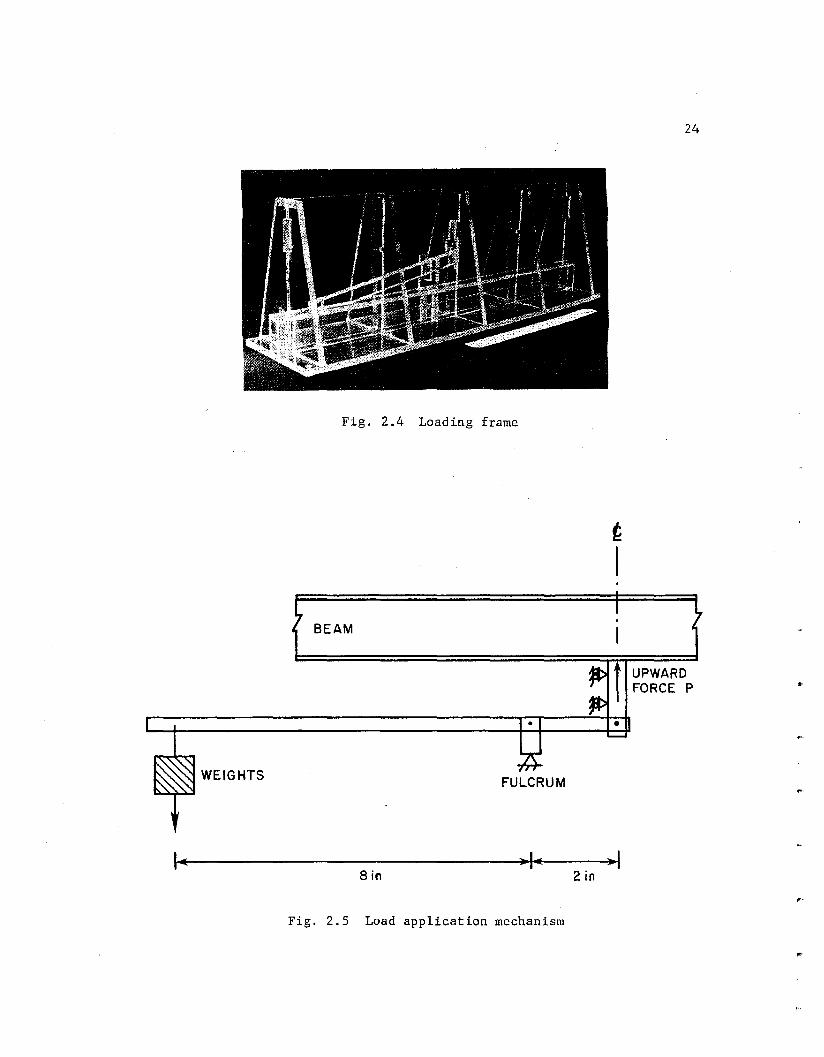
Fig. 2.4 Loading frame
BEAM
WEIGHTS FULCRUM
Sin 2in
Fig. 2.5 Load application mechanism
t I
24
UPWARD FORCE P ..
''"
I I•
~p .p • I I
~~ • H
•I• •I ,..., ,..,. ~I..: •I• L L L L L 2 2 4 4 4
CONFIGURATION I CON FIGURATION
Fig. 2.6 Plexiglass model bracing configurations
t .t f
h
Fig. 2.7
,. b ... ,
b = 0.500 in
tf = 0.060 in
h = 1.498 in
tw = 0.032 in
Plexiglass Model 1 cross section
L 4
2
25
I J~ol
26
present and so load application and observations had to be made
quickly.
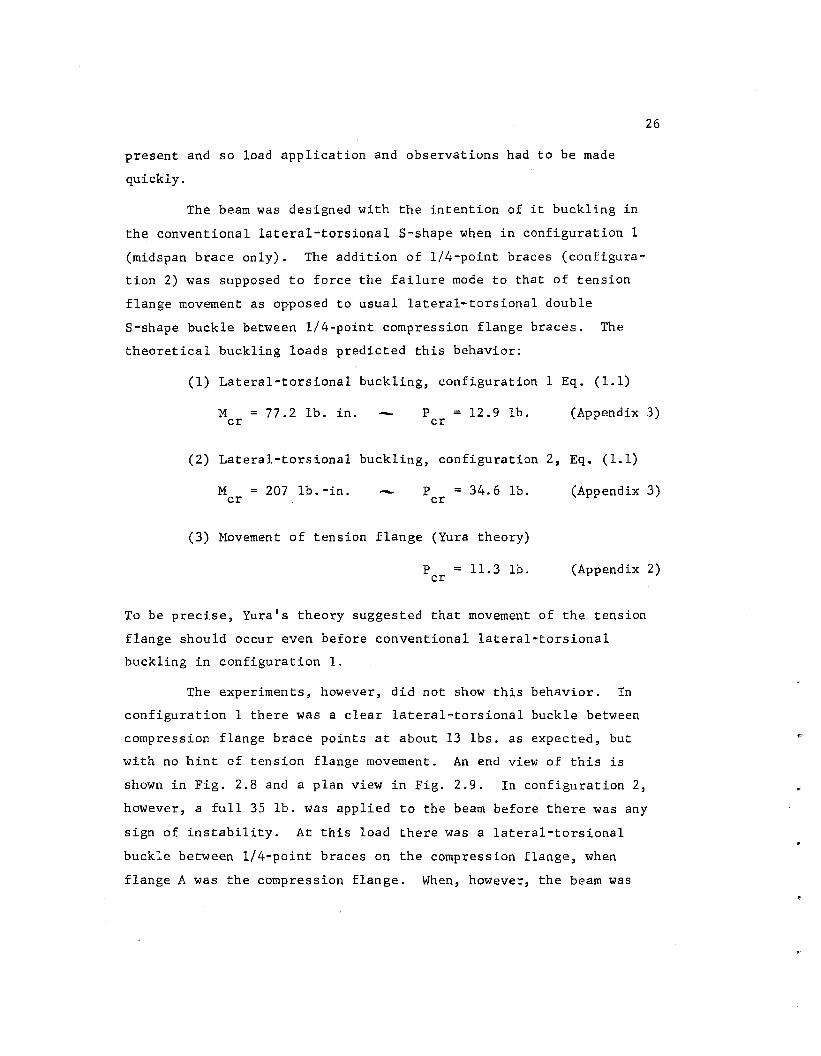
The beam was designed with the intention of it buckling in
the conventional lateral-torsional S-shape when in configuration 1
(midspan brace only). The addition of 1/4-point braces (configura
tion 2) was supposed to force the failure mode to that of tension
flange movement as opposed to usual lateral-torsional double
S-shape buckle between 1/4-point compression flange braces. The
theoretical buckling loads predicted this behavior:
(l) Lateral-torsional buckling, configuration 1 Eq. (1.1)
M = 77.2 lb. in. cr p = 12.9 lb. cr
(Appendix 3)
(2) Lateral-torsional buckling, configuration 2, Eq. (1.1)
M = 207 lb.-in. cr
p = 34.6 lb. cr
(3) Movement of tension flange (Yura theory)
p = 11.3 lb. cr
(Appendix 3)
(Appendix 2)
To be precise, Yura's theory suggested that movement of the tension
flange should occur even before conventional lateral-torsional
buckling in configuration 1.
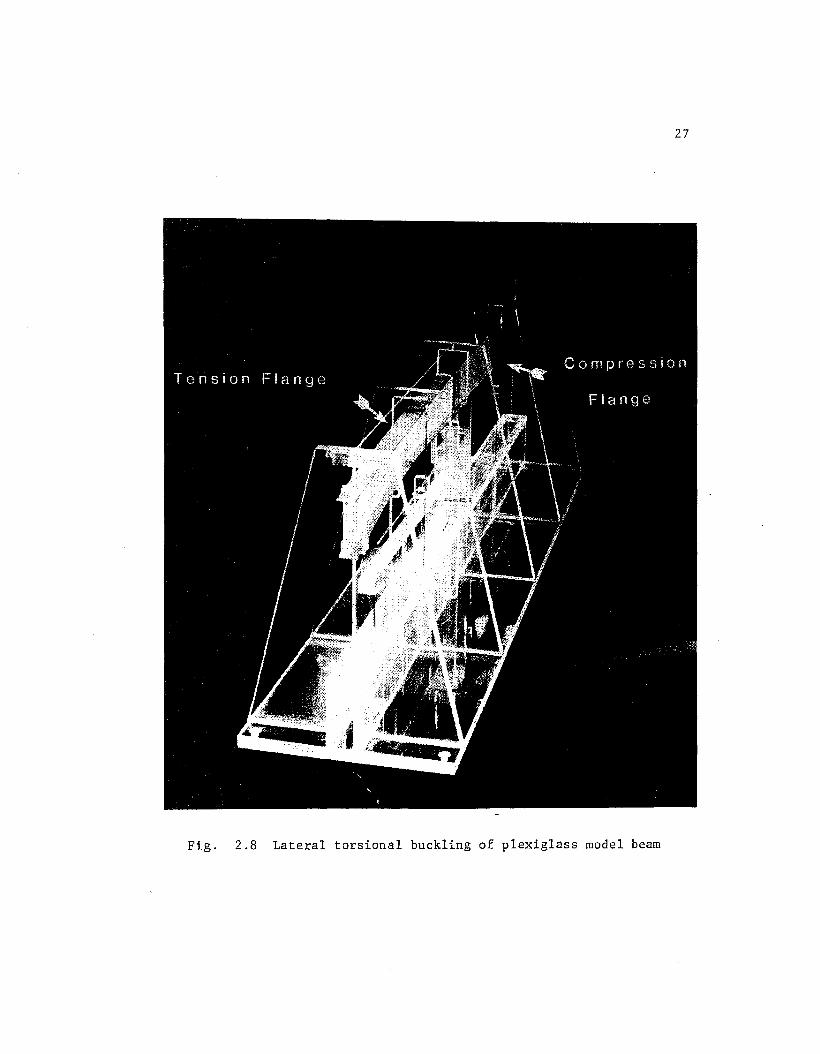
The experiments, however, did not show this behavior. In
configuration 1 there was a clear lateral-torsional buckle between
compression flange brace points at about 13 lbs. as expected, but
with no hint of tension flange movement. An end view of this is
shown in Fig. 2.8 and a plan view in Fig. 2.9. In configuration 2,
however, a full 35 lb. was applied to the beam before there was any
sign of instability. At this load there was a lateral-torsional
buckle between 1/4-point braces on the compression flange, when
flange A was the compression flange. When, however, the beam was
27
Fig. 2.8 Lateral torsional buckling of plexiglass model beam
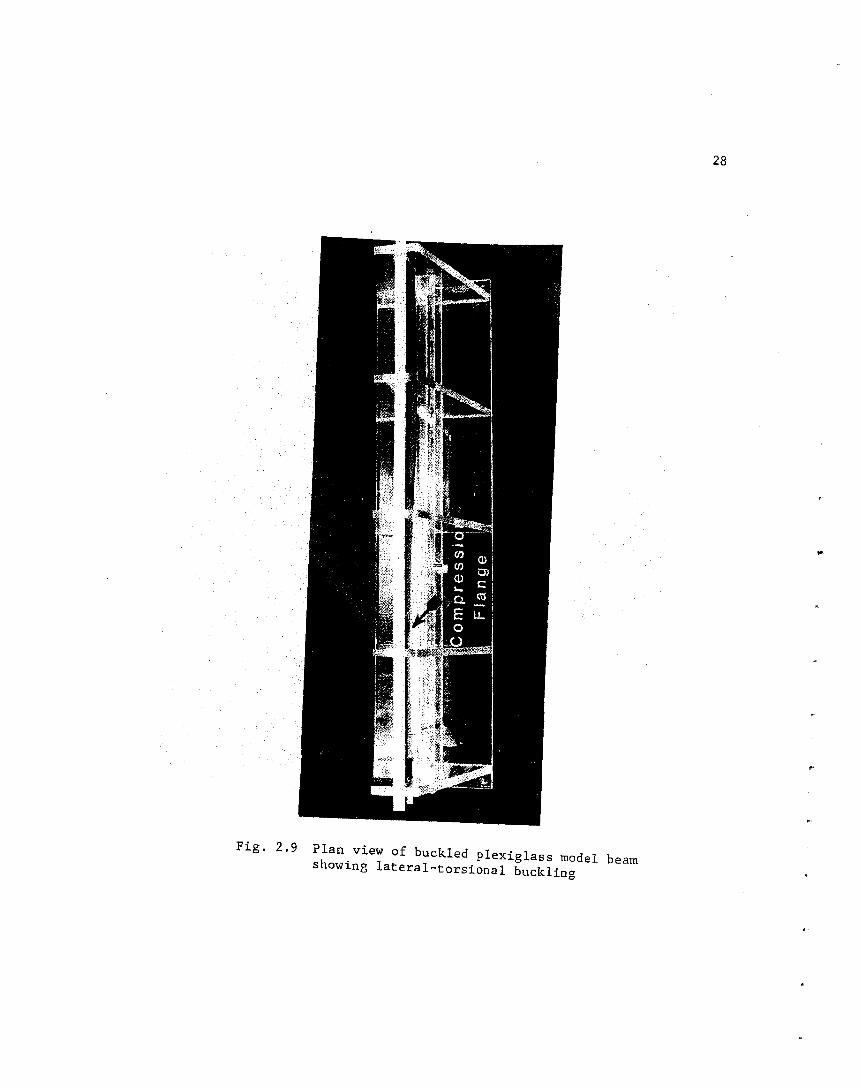
Fig. 2.9 Plan view of buckled plexiglass model beam showing lateral-torsional buckling
28
r
29
reversed in the loading frame, flange A in tension, the tension
flange movement was visible, as in Fig. 1.4 at approximately the same
load of 35 lb.
The experimental results indicate that the load to cause
tension-flange movement was significantly higher than that suggested 18 by Yura's theory (Fig. 1.9). Furthermore, this load could even
be significantly higher than the load to cause lateral-torsional
buckling in configuration 2, and may be visible only after the onset
of this lateral-torsional buckling. Also, initial lateral deflec
tion (sweep) may result in premature movement of the tension flange,
especially if it is this flange that is considerably out of alignment.
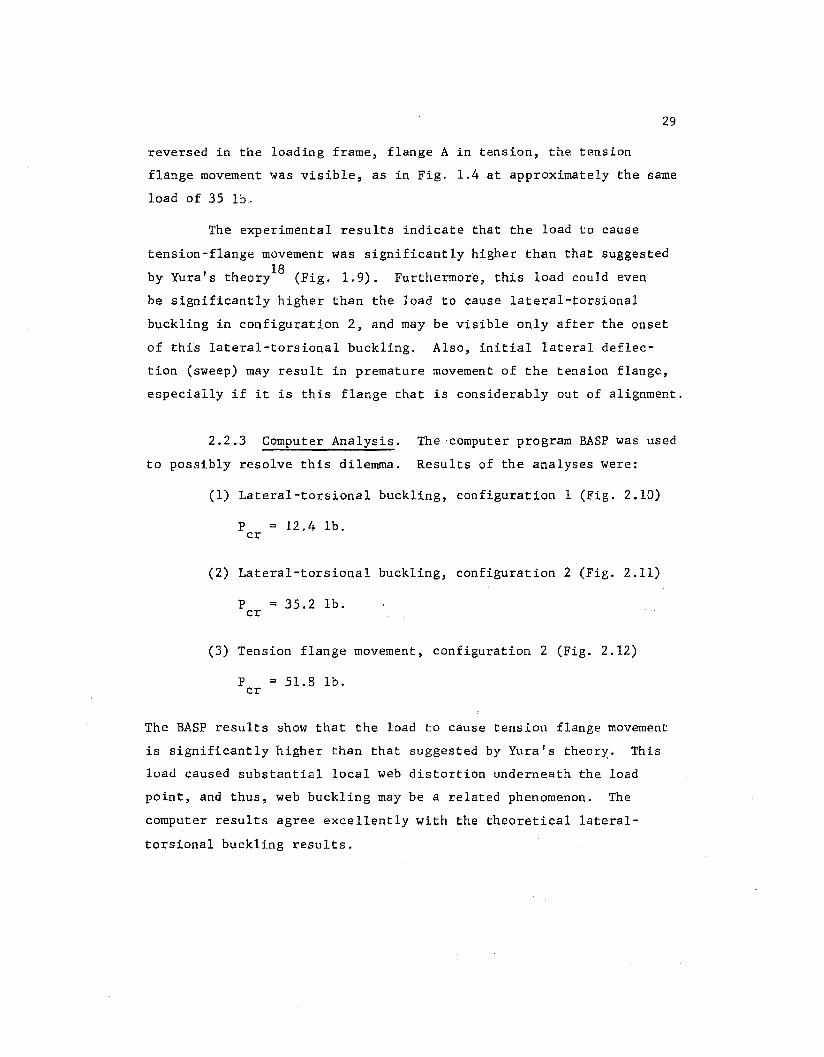
2.2.3 Computer Analysis. The computer program BASP was used
to possibly resolve this dilemma. Results of the analyses were:
(1) Lateral-torsional buckling, configuration 1 (Fig. 2.10)
p = 12.4 lb. cr
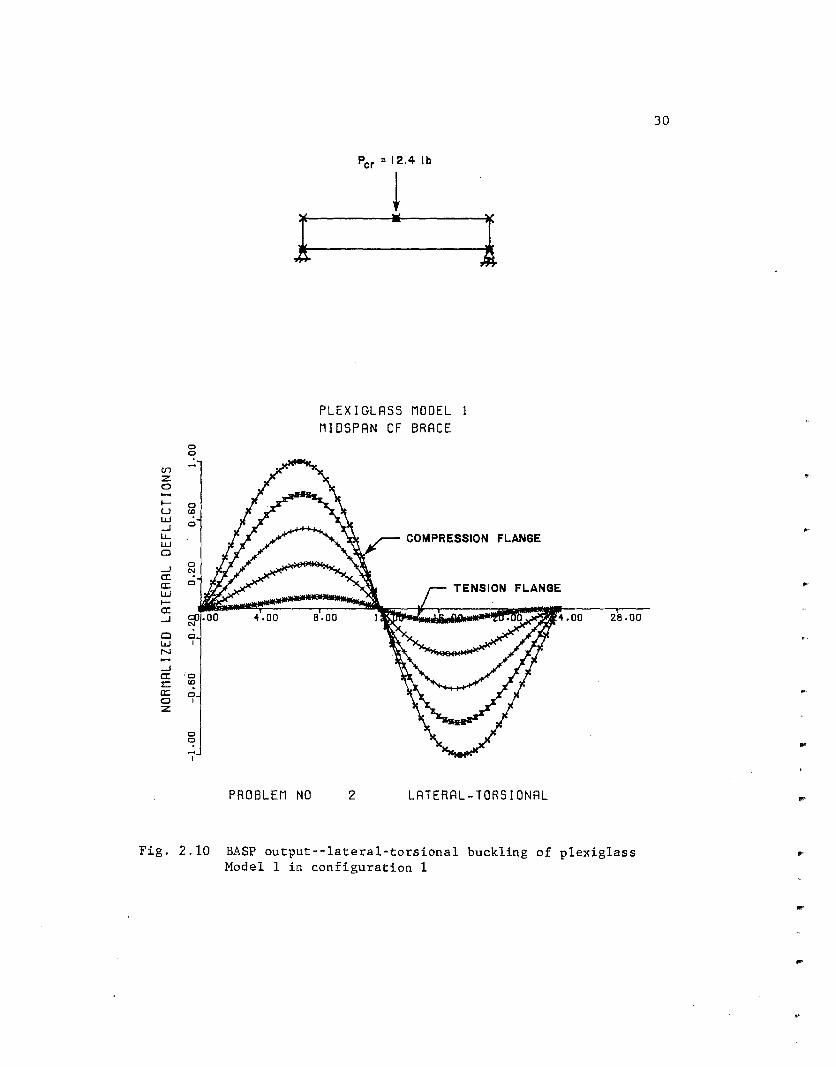
(2) Lateral-torsional buckling, configuration 2 (Fig. 2.11)
p ; 35.2 lb. cr
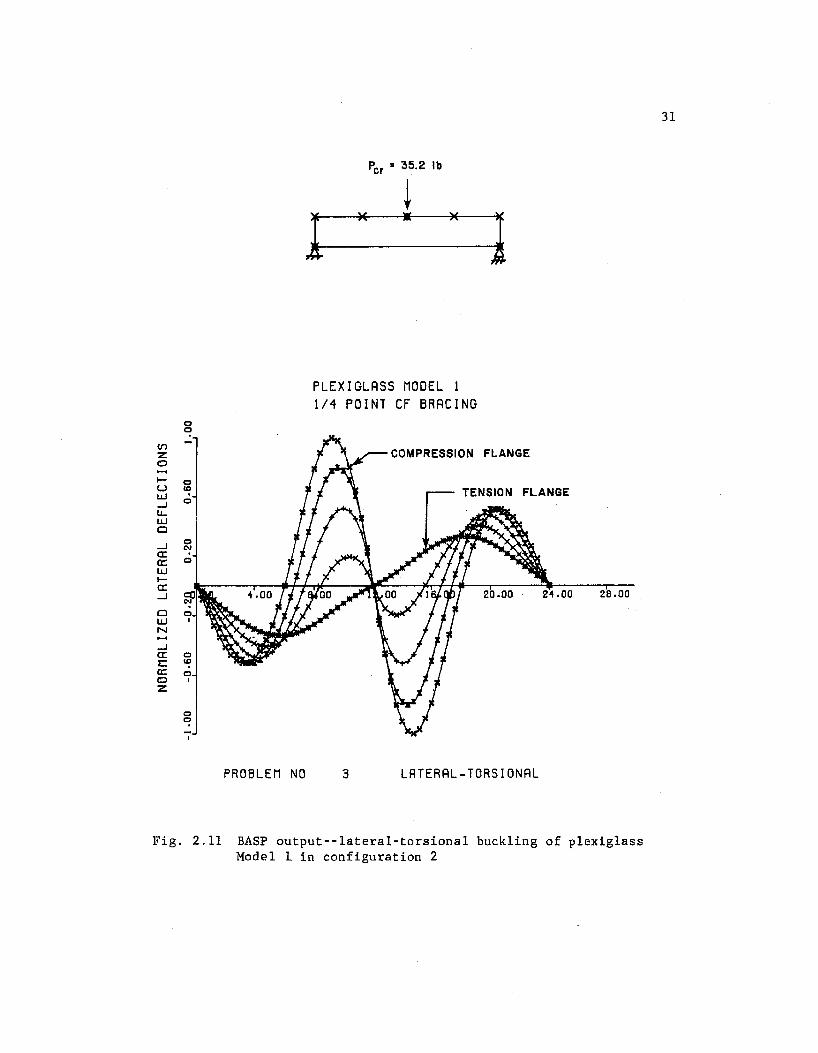
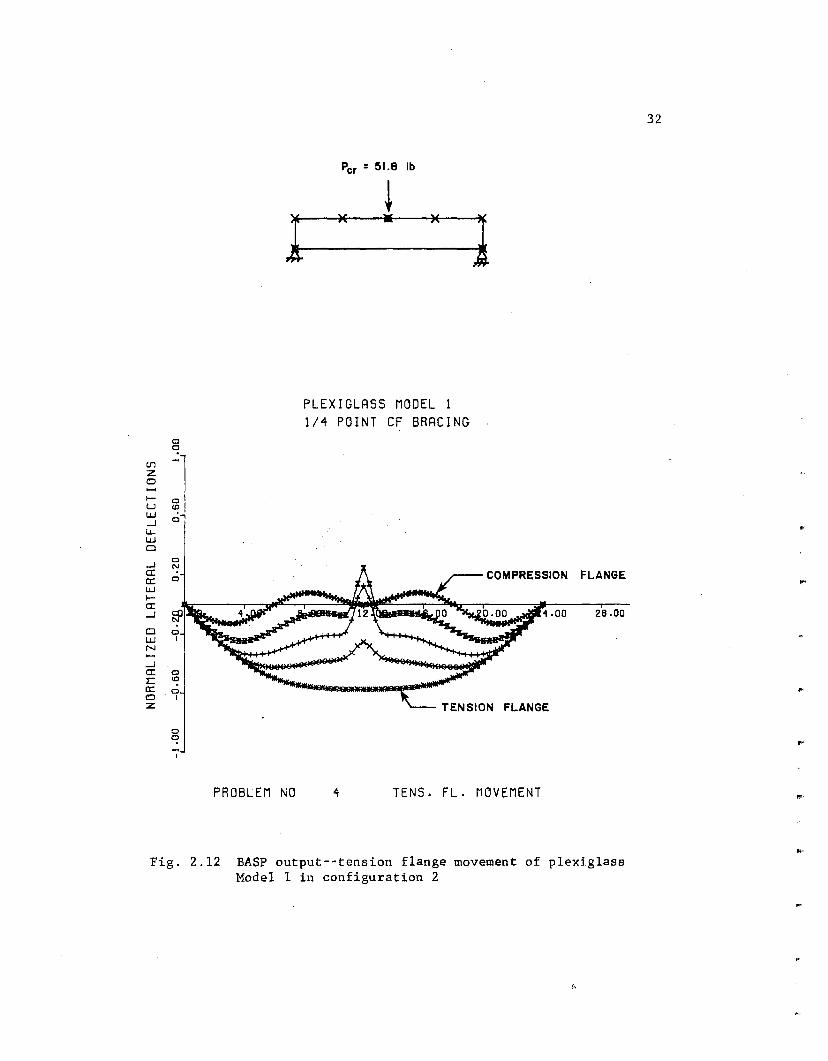
(3) Tension flange movement, configuration 2 (Fig. 2.12)
p = 51.8 lb. cr
The BASP results show that the load to cause tension flange movement
is significantly higher than that suggested by Yura's theory. This
load caused substantial local web distortion underneath the load
point, and thus, web buckling may be a related phenomenon. The
computer results agree excellently with the theoretical lateral
torsional buckling results.
Per= 12.4 lb
~
1 • l
PLEXIGLASS MODEL MIDSPAN CF BRACE
0
C? ([)
z 0
1- 0 w '-'? w ...J 0
1.1.. COMPRESSION FLANGE w Cl
0 ...J
<='-! a: a: 0
TENSION FLANGE w 1-a: ...J '\.00 e.oo '\.00 26.00
Cl 0 w I
N
_J
a: ·o I:: '-'? a: 0 0 I
z
0 ~
I
PROBLEM NO 2 LATERAL-TORSIONAL
Fig. 2.10 BASP output--lateral-torsional buckling of plexiglass Model 1 in configuration 1
30
.,
'""'
..
...
...
(f)
:z: 0
..... u LLJ -I u.. LLJ Cl
-I a: a:: LLJ ..... a: -I
0 0
0 (I)
0
0 N
0
Cl 0 LLJ I
N
-I a: 0 :c (I)
a:: 0 0 I :z:
0 0
PROBLEM NO
Per = 35.2 lb
~
1 )( • )(
1
PLEXIGLASS MODEL 1 1/4 POINT CF BRACING
COMPRESSION FLANGE
3 LATERAL-TORSIONAL
28.00
Fig. 2.11 BASP output--lateral-torsional buckling of plexiglass Model 1. in configuration 2
31
(f)
z 0
~
u w ...J LL w Cl
...J a: a: w ~
a: ...J
Cl w N
...J a: I:: a: 0 z
0 0
0
«? 0
0
~ 0
0 I
0
«? 0
I
0
~
--;'
I
PROBLEM NO
Per = 51.8 lb
~ * • *
PLEXIGLRSS MODEL 1 1/4 POINT CF BRACING
1
COMPRESSION
4-00
TENSION FLANGE
4 TENS. FL. MOVEMENT
FLANGE
28.00
Fig. 2.12 BASP output--tension flange movement of plexiglass Model 1 in configuration 2
32
"
If'
..
"
....
33
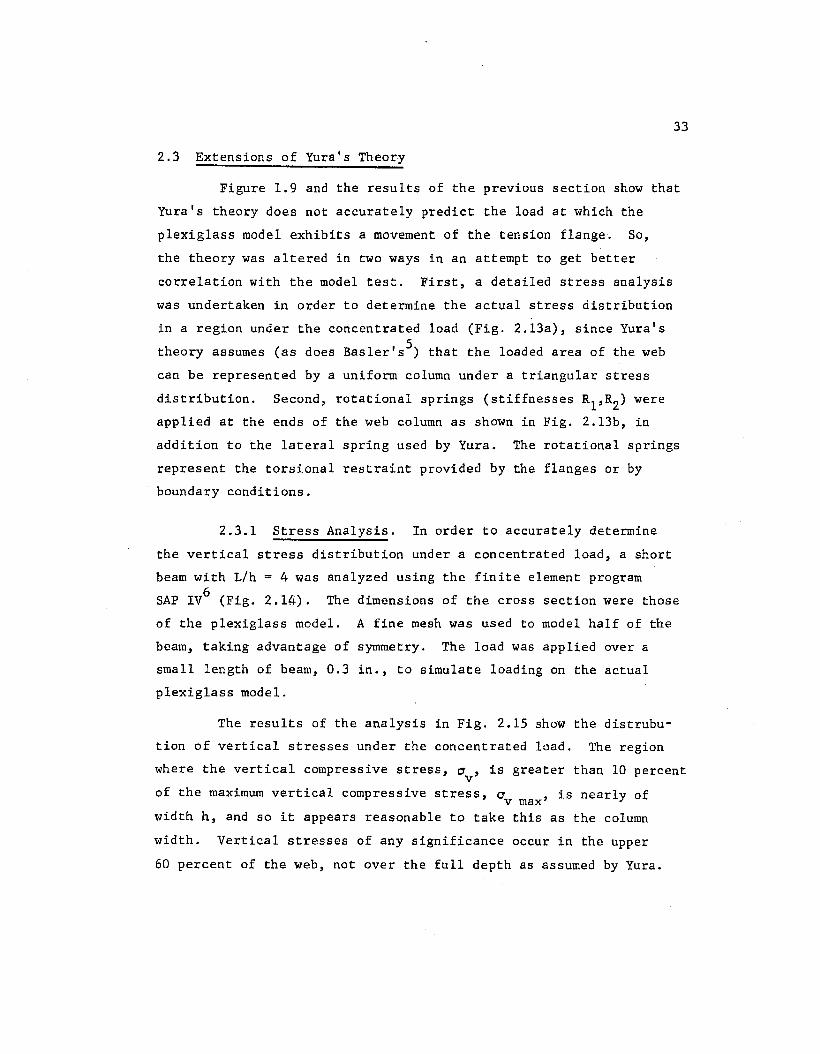
2.3 Extensions of Yura's Theory
Figure 1.9 and the results of the previous section show that
Yura's theory does not accurately predict the load at which the
plexiglass model exhibits a movement of the tension flange. So,
the theory was altered in two ways in an attempt to get better
correlation with the model test. First, a detailed stress analysis
was undertaken in order to determine the actual stress distribution
in a region under the concentrated load (Fig. 2.13a), since Yura's 5 theory assumes (as does Basler's ) that the loaded area of the web
can be represented by a uniform column under a triangular stress
distribution. Second, rotational springs (stiffnesses R1,R2) were
applied at the ends of the web column as shown in Fig. 2.13b, in
addition to the lateral spring used by Yura. The rotational springs
represent the torsional restraint provided by the flanges or by
boundary conditions.
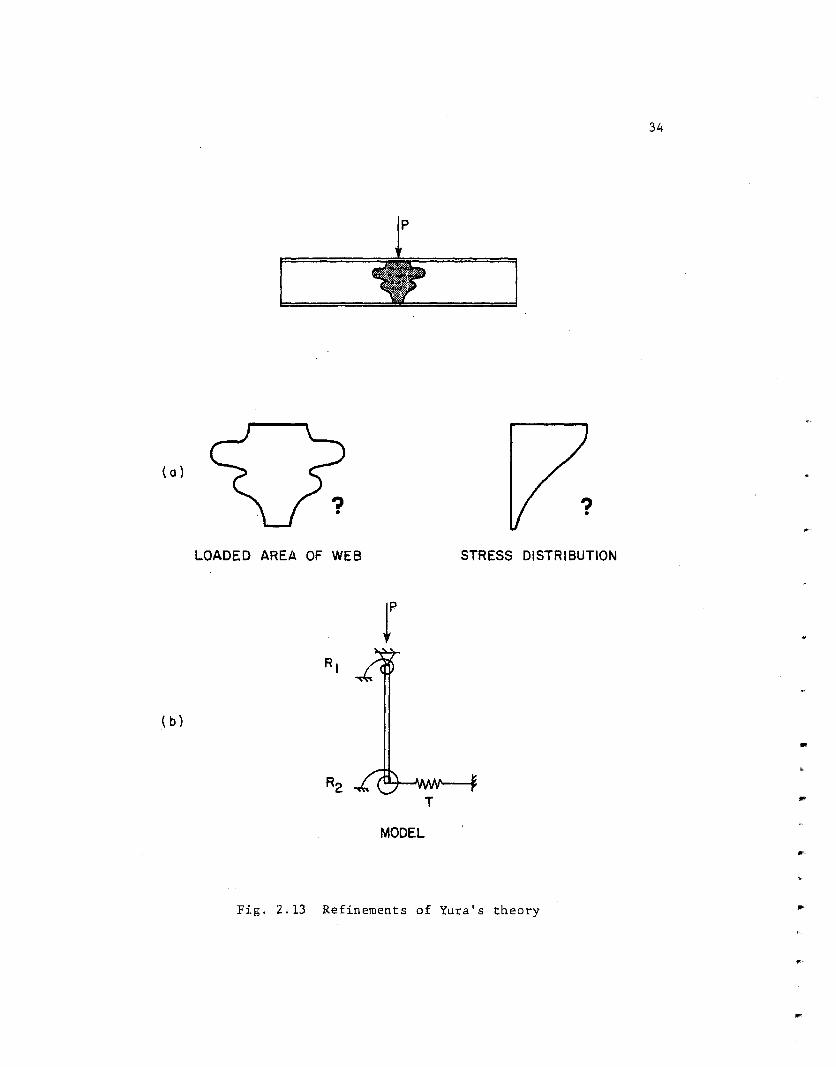
2.3.1 Stress Analysis. In order to accurately determine
the vertical stress distribution under a concentrated load, a short
beam with L/h = 4 was analyzed using the finite element program
SAP rv6 (Fig. 2.14). The dimensions of the cross section were those
of the plexiglass model. A fine mesh was used to model half of the
beam, taking advantage of symmetry. The load was applied over a
small length of beam, 0.3 in., to simulate loading on the actual
plexiglass model.
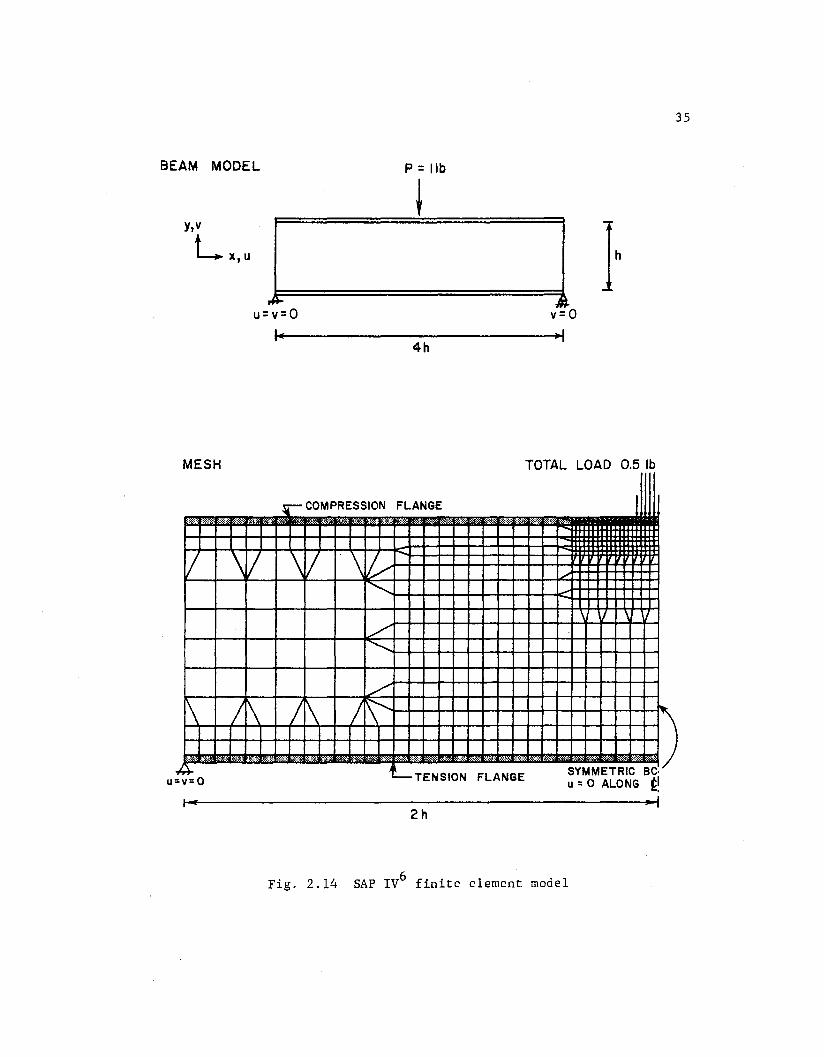
The results of the analysis in Fig. 2.15 show the distrubu
tion of vertical stresses under the concentrated load. The region
where the vertical compressive stress, ~ , is greater than 10 percent v
of the maximum vertical compressive stress, a , is nearly of v max width h, and so it appears reasonable to take this as the column
width. Vertical stresses of any significance occur in the upper
60 percent of the web, not over the full depth as assumed by Yura.
34
p
(a)
.. LOADED AREA OF WEB STRESS DISTRIBUTION
(b)
..
T .. MODEL
Fig. 2.13 Refinements of Yura's theory
..
BEAM MODEL
y,v
Lx,u
MESH
•H· u=v=O
p =lib
~
4h
~-.~ v=O
TOTAL LOAD 0.5 lb
~-COMPRESSION FLANGE . ' .~ . · ... '• .:'.;:-:;: :.. . ·~::::· ::~· .. : · ....
I I
I \I \I
\ /1\ /\ , , -., .. : • .,~ ,•.;.;.; • '• ~ '•!: • • , '• • • ·• -~·:·: ,• s·~.·:· * ~ ~-TENSION FLANGE
2h
Fig. 2.14 SAP rv6 finite element model
35
SQUARE COLUMN MODEL
h
I~ h
... I
TOTAL LOAD I lb I
0.3in ~
I
~
YURA STRESS DISTRIBUTION
36
~ STRESSED AREA - YURA
~ STRESSED AREA -SAP Ill:
(uv > 0.1 (jvmaxl
SAP llZ: STRESS DISTRIBUTION
Fig. 2:15 Results of SAP IV analysis
..
"'
...
...
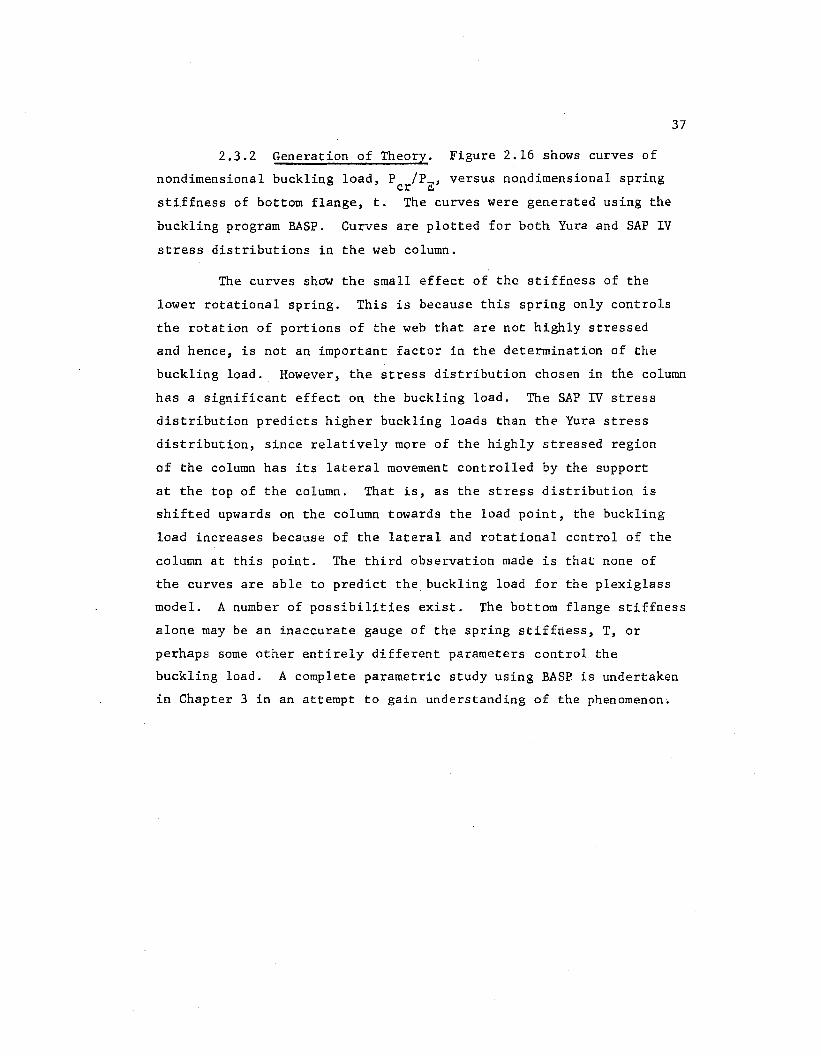
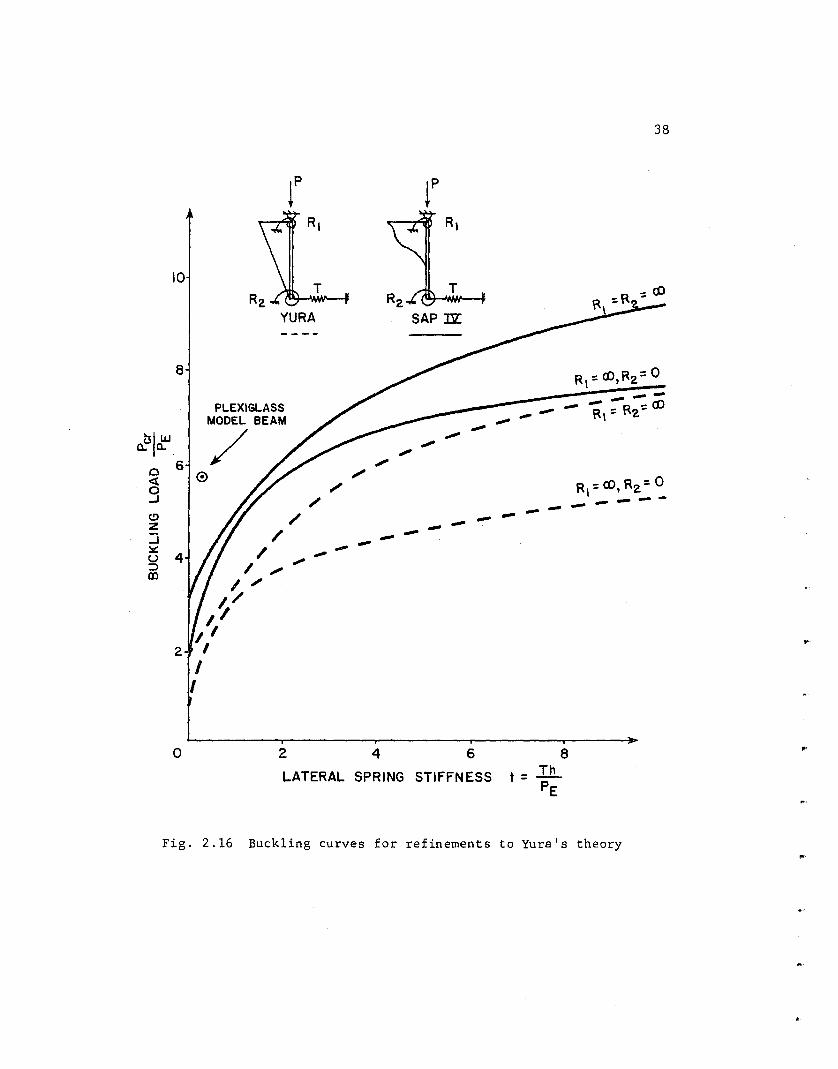
2.3.2 Generation of Theory. Figure 2.16 shows curves of
nondimensional buckling load, P /PE' versus nondimensional spring cr stiffness of bottom flange, t. The curves were generated using the
buckling program RASP. Curves are plotted for both Yura and SAP IV
stress distributions in the web column.
The curves show the small effect of the stiffness of the
lower rotational spring. This is because this spring only controls
the rotation of portions of the web that are not highly stressed
37
and hence, is not an important factor in the determination of the
buckling load. However, the stress distribution chosen in the column
has a significant effect on the buckling load. The SAP IV stress
distribution predicts higher buckling loads than the Yura stress
distribution, since relatively more of the highly stressed region
of the column has its lateral movement controlled by the support
at the top of the column. That is, as the stress distribution is
shifted upwards on the column towards the load point, the buckling
load increases because of the lateral and rotational control of the
column at this point. The third observation made is that none of
the curves are able to predict the buckling load for the plexiglass
model. A number of possibilities exist. The bottom flange stiffness
alone may be an inaccurate gauge of the spring stiffness, T, or
perhaps some other entirely different parameters control the
buckling load. A complete parametric study using BASP is undertaken
in Chapter 3 in an attempt to gain understanding of the phenomenon·.
0.0 a.. ... , LLJ
0 <(
g
10
8
6
2
0
YURA
PLEXIGLASS MODEL BEAM
/ 0
/ /
/ ,., I .,.,
I ,
'" ,, ,, I
I I
2
/
-,
-
SAP :DZ:
-..,. ,. ,., ,.., /
- -----
4 6
LATERAL SPRING STIFFNESS
---
---
38
R,:: CO,Rz= 0 -----R-eo R, = 2.-
R,:: co, Rz:: 0 ------
Fig. 2.16 Buckling curves for refinements to Yura's theory '""
C H A P T E R 3
PARAMETRIC COMPUTER ANALYSIS
3.1 Background
The Yura theory (or extensions of it) shows a large effect
on the buckling load depending on the existence of a bottom flange
lateral brace at the load point, especially if the flange is
laterally quite flexible. A lateral brace on the tension flange
at the load location corresponds to t =~in Fig. 2.16.
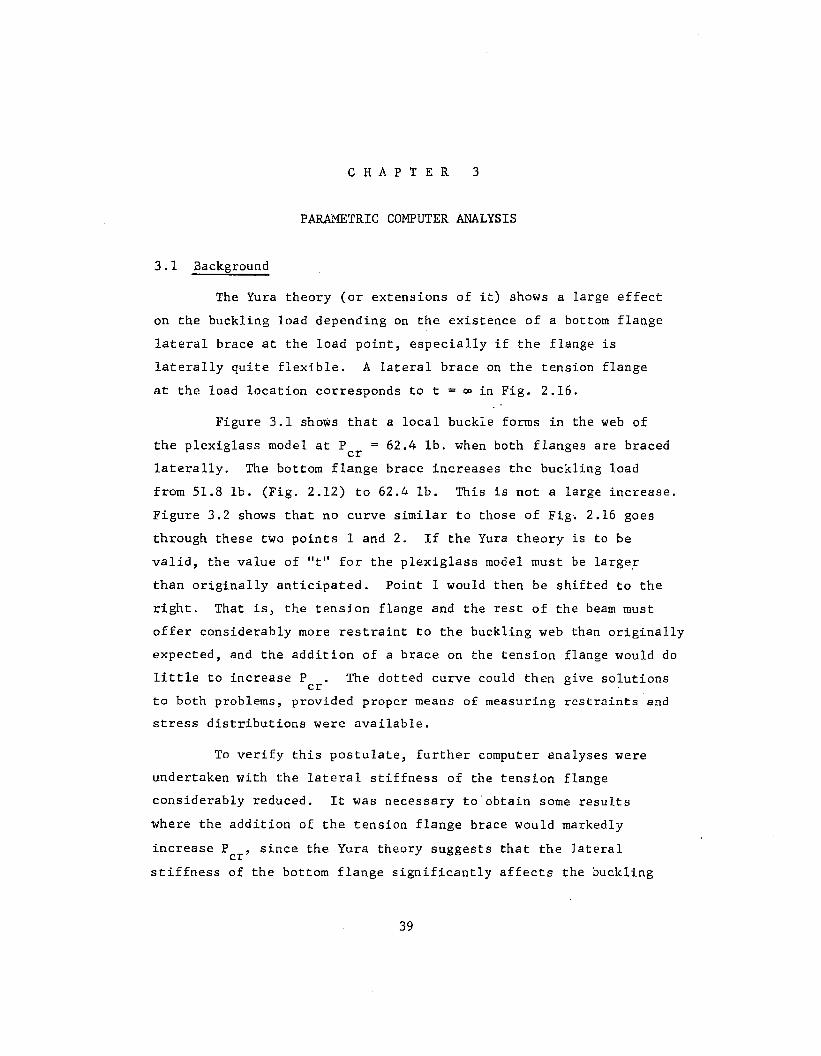
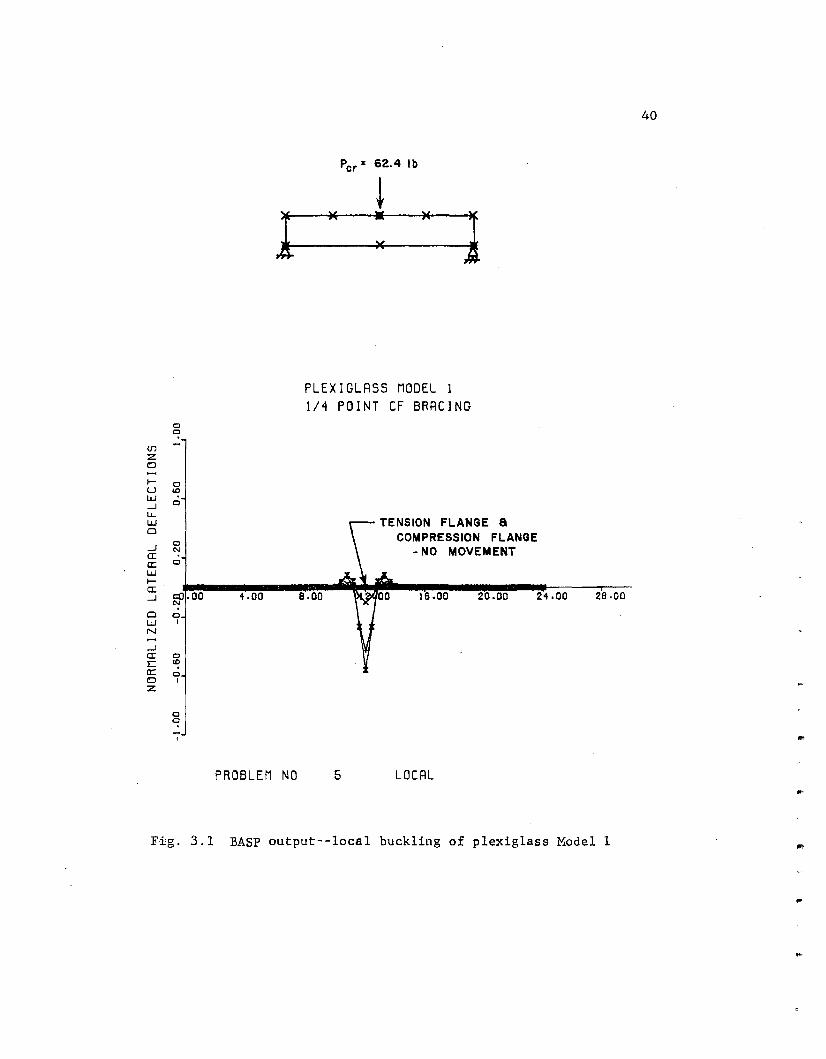
Figure 3.1 shows that a local buckle forms in the web of
the plexiglass model at P 62.4 lb. when both flanges are braced cr laterally. The bottom flange brace increases the buckling load
from 51.8 lb. (Fig. 2.12) to 62.4 lb. This is not a large increase.
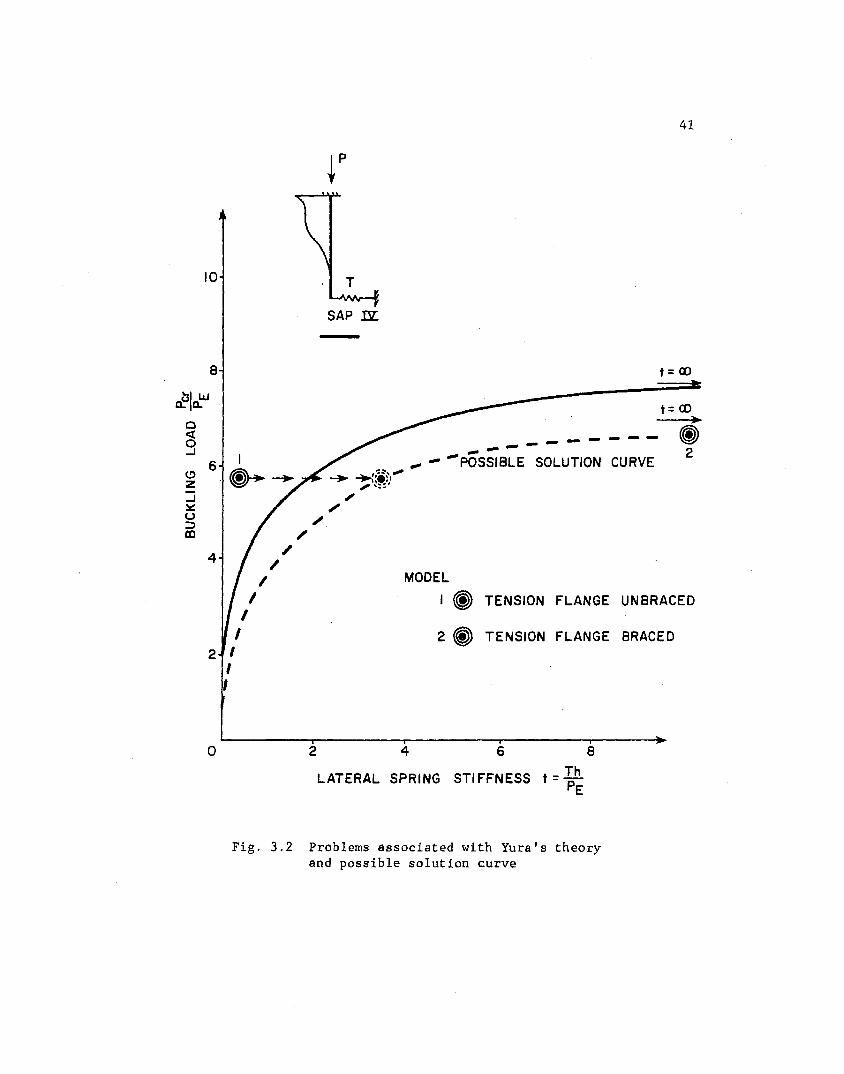
Figure 3.2 shows that no curve similar to those of Fig. 2.16 goes
through these two points 1 and 2. If the Yura theory is to be
valid, the value of "t" for the plexiglass model must be larger
than originally anticipated. Point 1 would then be shifted to the
right. That is, the tension flange and the rest of the beam must
offer considerably more restraint to the buckling web than originally
expected, and the addition of a brace on the tension flange would do
little to increase P The dotted curve could then give solutions cr
to both problems, provided proper means of measuring restraints and
stress distributions were available.
To verify this postulate, further computer analyses were
undertaken with the lateral stiffness of the tension flange
considerably reduced. It was necessary to obtain some results
where the addition of the tension flange brace would markedly
increase P , since the Yura theory suggests that the lateral cr stiffness of the bottom flange significantly affects the buckling
39
0
~ (f)
z Cl
...... 0 u "? I.LI _J 0
lL I.LI Cl
_J 0
CI ~ a:: 0
I.LI ...... a: _J ~ .oo -..oo Cl 0 I.LI I
N
_J
a: 0 :c "? a:: 0 Cl I
z
0
~ -I PROBLEM
1
NO
Per= 62.4 lb
)( : )(
PLEXIGLASS MODEL 1 1/4 POINT CF BRACING
a.oo
6
TENSION FLANGE 8 COMPRESSION FLANGE
-NO MOVEMENT
16.00 20.00 2<1.00
LOCAL
28.00
Fig. 3.1 BASP output--local buckling of plexiglass Modell
40
...
..
10
8
'-I LLI rf:a..
0 <( 0 ...1
6 (.!) z ...1 :ll::: u ::::> aJ
4
I I
/ I
I
/ /
~p
SAP Dr
-
_.. ~:.~ . .--, "::::'
/ /
,
----------.,.,. --POSSIBLE SOLUTION CURVE
MODEL
41
t =co
t =co )Ia
I ~ TENSION FLANGE UNBRACED
2 ~ TENSION FLANGE BRACED 2 I
0
I I
2 4 6
LATERAL SPRING STIFFNESS t = Th PE
8
Fig. 3.2 Problems associated with Yura's theory and possible solution curve
42
load. The reduction of the lateral ·stiffness, T, can be accomplished
in several ways. First, the length of the beam, L, can be increased -3 since T = f(L ). Second, the width of the tension flange, b, can
be decreased since T = f(b3). Both approaches were considered.
When the flange width was altered, the thickness of the flange
was also adjusted so that all beams studied would have the same
moment of inertia and bending stresses. Naturally, when the
length of the beam was varied, so was the bending stress distribution.
The following section presents a detailed study of these
parameters and others. The plexiglass model beam configuration is
used with changes to one or more parameters.
3.2 Analyses
All analyses were made with web element aspect ratios (length
of element to height of element) between 0.5 and 2.0. In this manner,
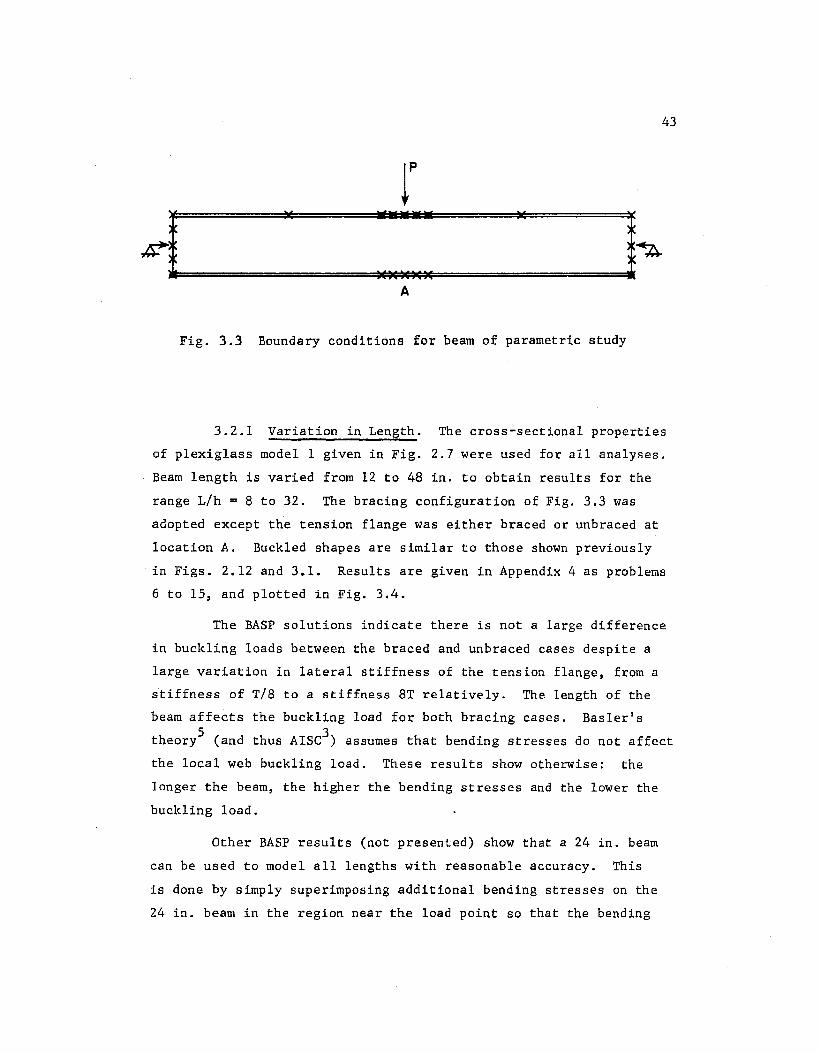
errors due to inaccurate element behavior are minimized. Bracing
under the load, either on the top or bottom flange, was employed
not just at one single node, but rather at five consecutive nodes
(Fig. 3.3). The braced length along the flanges of the load point
was approximately equal to the depth of the beam. The reasons for
the multiple braces were twofold. First, to better represent
engineering practice, where the load point is braced over a small
length, and second, to enhance the characteristics of the buckled
shape without significantly altering the buckling loads. In-plane
supports consisted of pins at mid-depth of the beam. The ends of
the beam were sometimes fully braced laterally when it was necessary
to prevent slight local buckling over the supports. Again, the load
was virtually unaffected while the buckled shape only showed the
characteristics of interest.
43
lp
'' ::::: lG
;~ A
Fig. 3.3 Boundary conditions for beam of parametric study
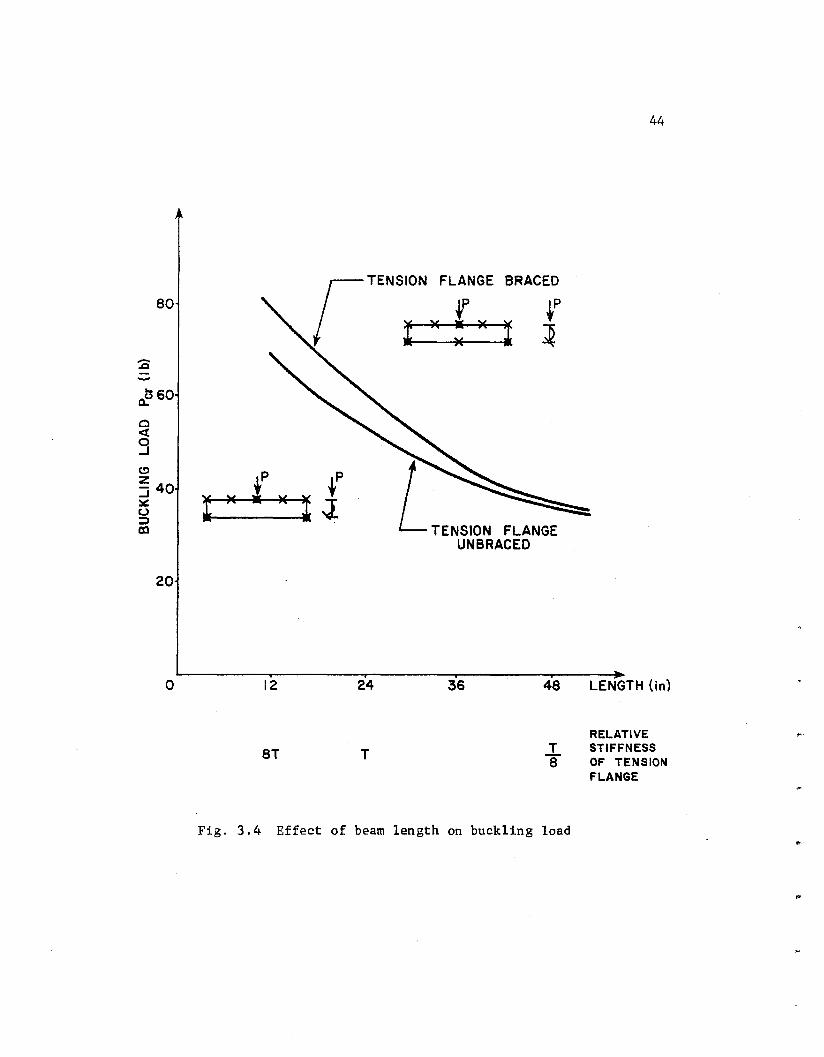
3.2.1 Variation in Length. The cross-sectional properties
of plexiglass model 1 given in Fig. 2.7 were used for all analyses.
Beam length is varied from 12 to 48 in. to obtain results for the
range L/h = 8 to 32. The bracing configuration of Fig. 3.3 was
adopted except the tension flange was either braced or unbraced at
location A. Buckled shapes are similar to those shown previously
in Figs. 2.12 and 3.1. Results are given in Appendix 4 as problems
6 to 15, and plotted in Fig. 3.4.
The BASP solutions indicate there is not a large difference
in buckling loads between the braced and unbraced cases despite a
large variation in lateral stiffness of the tension flange, from a
stiffness of T/8 to a stiffness 8T relatively. The length of the
beam affects the buckling load for both bracing cases. Basler's
theory5
(and thus AISC3) assumes that bending stresses do not affect
the local web buckling load. These results show otherwise: the
longer the beam, the higher the bending stresses and the lower the
buckling load.
Other BASP results (not presented) show that a 24 in. beam
can be used to model all lengths with reasonable accuracy. This
is done by simply superimposing additional bending stresses on the
24 in. beam in the region near the load point so that the bending
80 r TENSION FLANGE BRACED
t ·t :)(:)(l l
rE60
0 <t g (!)
~ 40 tp lp
~ l )( • )( l i CD
20
0 12
8T
24 36
T
48
T 8
Fig. 3.4 Effect of beam length on buckling load
44
LENGTH {in)
RELATIVE STIFFNESS OF TENSION FLANGE
stress distribution there is the same as that existing in the other
length beam. The tension flange stiffness remains that of a 24 in.
beam. These results further suggest that the important parameters
are both bending stress and vertical stress distributions in the
vicinity of the load point. Furthermore, bottom flange stiffness
seems insignificant, with tension flange bracing only slightly
increasing the buckling load.
45
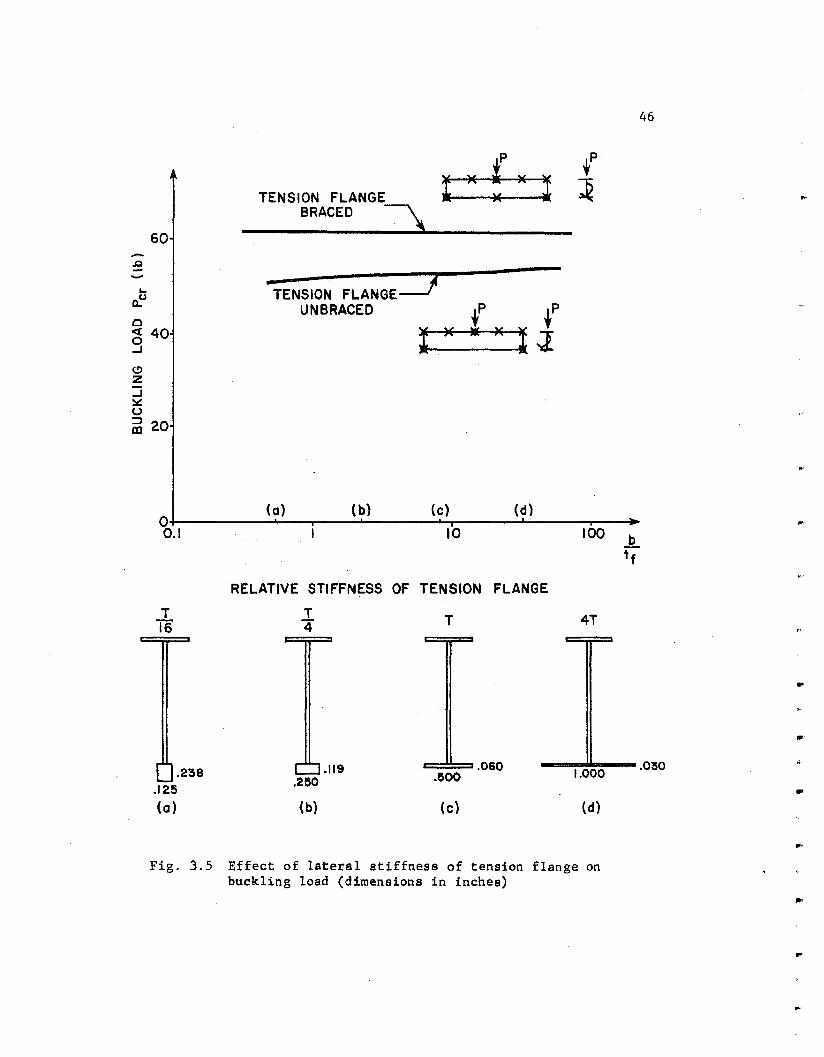
3.2.2 Variation in Tension Flange Width. Four different
beam cross sections were used to study the effect of width of the
tension flange on the buckling characteristics under a concentrated
load. The same plexiglass beam (Model 1) section was used (Fig. 2.7)
except for changes in the bottom flange. The width and thickness
were altered, but the area of the bottom flange remained equal to
the area of the top flange. In this manner, the neutral axis was
kept at mid-depth of the beam, and the moment of inertia about this
axis was virtually unchanged. Thus, the bending stress distribution
in the 24 in. long beam remains the same for all tests. The bottom
flange dimensions are varied over the range b/tf = 0.5 to 34. The
bracing and support conditions of Fig. 3.3 were used with the tension
flange either braced or unbraced. Results are given in Appendix 4 as
problems 8, 13 and 16 to 21, and are plotted in Fig. 3.5.
These results•confirm the previous observations. Despite
vast changes in the lateral stiffness of the tension flange (from
a stiffness of T/16 to a stiffness of 4T relatively), there is less
than 7 percent difference in the buckling loads when there is no
tension flange brace. There is, of course, no mifference in the
buckling loads when there is a tension flange brace, since the
bending stress distribution is the same for all beams.
The lateral stiffness of the top (compression) flange was
found not to be a factor in the buckling load when the beam is
simply supported for either braced or unbraced tension flanges.
The cross section of the beam "b" shown in Fig. 3.5 was changed
-... a..(J
0
60
C5 40 ..J
<!) z :J ~ u ~ 20
0 0.1
T T6
.238 .125
(a)
TENSION FLANGE BRACED :"\
TENSION FLANGE=--.! UNBRACEO t tp
l)(·)(~J
(a) (b) (c) (d)
10 100
RELATIVE STIFFNESS OF TENSION FLANGE
T T 4T 4
.060 .119 1.000 .250 .500
{b) (c) (d)
Fig. 3.5 Effect of lateral stiffness of tension flange on buckling load (dimensions in inches)
46
,.,
b
if
..
• .030
,,
..
..
..
..
47
so that the compression flange dimensions were like those of the
tension flange. There was a negligible effect on the buckling load.
The results are reported in Appendix 4 as problems 32 and 33.
3.2.3 Variation of Other Parameters. Web depth, h, affects
the web buckling load for two principal reasons. The depth influences
the magnitude of the flexural stresses and it is directly related to
web slenderness. The bending stress is a function of h-l and the web
column buckling load is a function of h-2 The Model 1 cross section
is used (Fig. 2.7) for variation in web depth studies and the
configuration of Fig. 3.3 with tension flange either braced or unbraced
adopted. The web depth is varied so as to obtain results for beams
of relative depth between flange centerlines of d/2, d and 2d. Length
is varied between 12 and 48 in. The combination of changes in 1 and
h gives a range of 1/h from 8 to 32. Results are reported in
Appendix 4 as problems 6, 8, 10, 11, 13, 15 and 34 to 41. They
confirm the importance of web depth as a parameter involved in the
determination of P cr
Basler suggests, P cr
The variation is almost linear. -1
is a function of h .
That is, as
The moment of inertia of a web section. buckling out of its 3
plane is a function of (t ) . Hence, slight variation in this w
parameter is likely to result in marked differences in P cr
Model 1 cross section (Fig. 2.7) is used with web thickness varia-
tion such that a stocky web of slenderness ratio h/t from 31 to w
62 is maintained. Results are reported in Appendix 4 as problems 8,
13, and 42 to 45. As expected, there was a rapid variation in P cr
with change in web thickness.
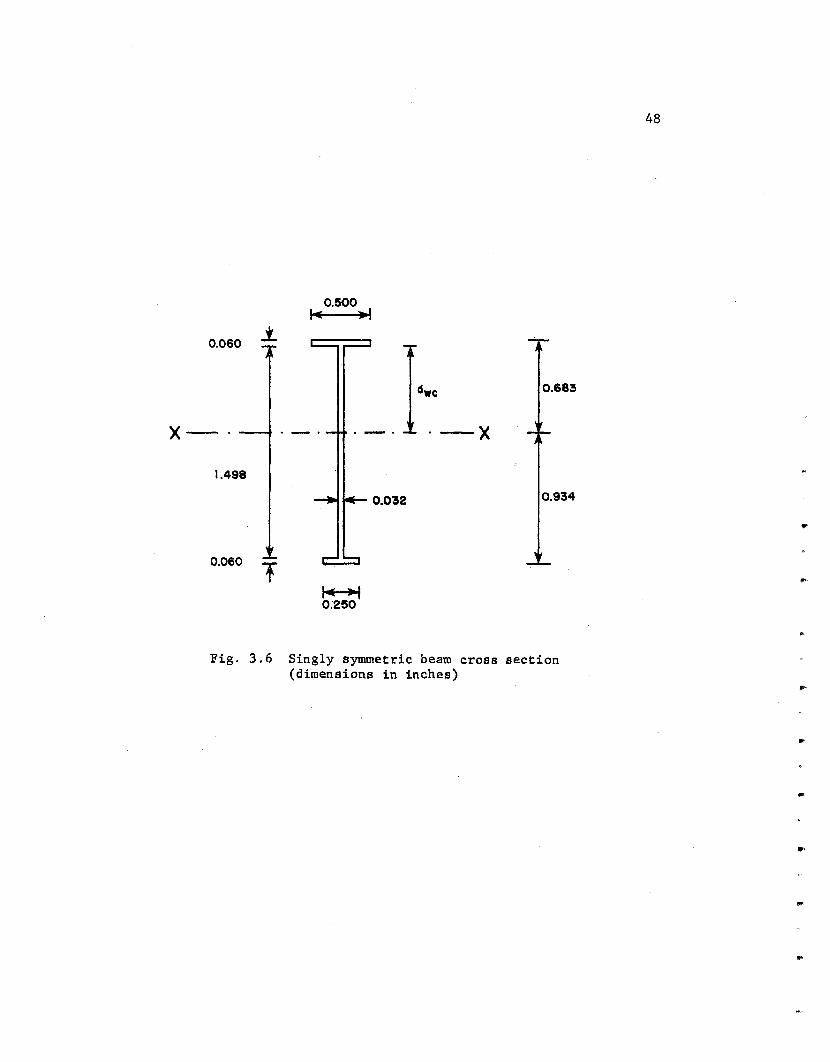
A singly symmetric cross section, shown in Fig. 3.6, is
considered. It has a reduced tension flange area resulting in a
higher neutral axis, a smaller moment of inertia and smaller
section moduli at both the top and bottom flanges. Thus, it has
higher bending stresses under unit loading. The beam has a pinned
roller simple support system in the plane, as the neutral axis is not
0.060 i
0.683
X-· ·-X
1.498
0.032 0.934
0.060 T ~ 0;2!50
Fig. 3.6 Singly symmetric beam cross section (dimensions in inches)
48
..
..
...
•..
...
49
at mid-depth of the beam (where the supports are). Apart from this
change, the configuration for the 24 in. long beam is as in Fig. 3.3,
with tension flange either braced or unbraced. The results,
problems 46 and.47 in Appendix 4, show a increase in buckling
loads over the standard doubly symmetric cross section, problems
8 and 13. This increase, despite higher bending st!esses, can be
attributed to the fact that the distance from the web-flange junction
to the neutral axis, dwc (depth of web in compression) is only
0.623 in. In the doubly symmetric beam, it is h/2 = 0.745 in.
Since a smaller length of web is in compression, it takes a higher
load to ~uckle it. For singly symmetric beams, d seems to be a we
relevant parameter in predicting P . cr
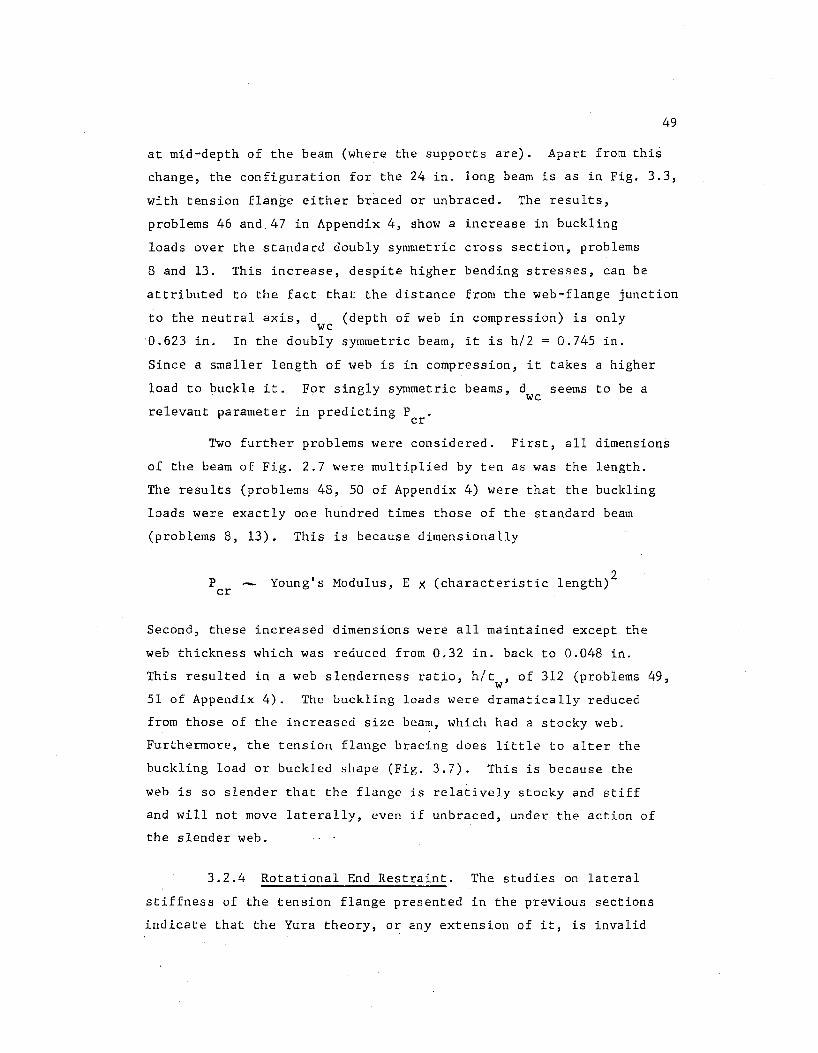
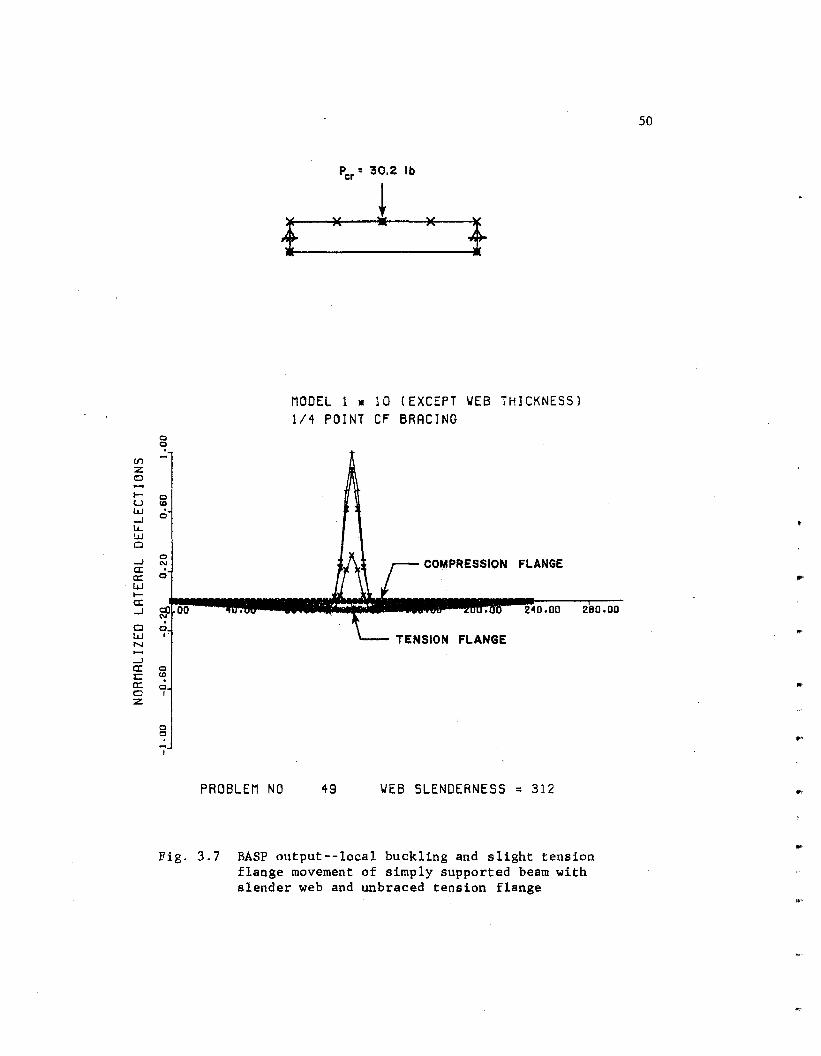
Two further problems were considered. First, all dimensions
of the beam of Fig. 2.7 were multiplied by ten as was the length.
The results (problems 48, 50 of Appendix 4) were that the buckling
loads were exactly one hundred times those of the standard beam
(problems 8, 13). This is because dimensionally
P Young's Modulus, E x (characteristic length) 2 cr
Second, these increased dimensions were all maintained except the
web thickness which was reduced from 0.32 in. back to 0.048 in.
This resulted in a web slenderness ratio, h/t , of 312 (problems 49, w 51 of Appendix 4). The buckling loads were dramatically reduced
from those of the increased size beam, which had a stocky web.
Furthermore, the tension flange bracing does little to alter the
buckling load or buckled shape (Fig. 3.7). This is because the
web is so slender that the flange is relatively stocky and stiff
and will not move laterally, even if unbraced, under the action of
the slender web.
3.2.4 Rotational End Restraint. The studies on lateral
stiffness of the tension flange presented in the previous sections
indicate that the Yura theory, or any extension of it, is invalid
U1 z 0
I-u w .....1 lL !.J.J Cl
.....1 a: a:: w I-a: .....1
Cl w N
.....1 a: :c a:: 0 z
Per= !0.2 lb
)( ! )(
MODEL 1 • l 0 (EXCEPT \IEB THICKNESSJ 1/4 POINT CF BRACING
0 0
0 !D
0
0 COMPRESSION FLANGE "'
0
~ .QQ 240.00 280.00
0 I TENSION FLANGE
0
~ 0
I
0
t:? -I PROBLEM NO 49 \JEB SLENDERNESS = 312
Fig. 3.7 BASP output--local buckling and slight tension flange movement of simply supported beam with slender web and unbraced tension flange
50
"
..
...
...
...
for simply supported beams. However, Yura obtained excellent
correlation between his theory and tests on continuous beams.
Since the only difference between simply supported beams and
continuous beams is end restraint and because of this, bottom
flange compression, a study was undertaken to determine the
interaction between bottom flange compression near the supports
and concentrated load effects on the web. The addition of varying
amounts of negative end moment, MN• can simulate all forms of
beam continuity, up to and past complete fixity. Pinned ends out
of the plane were used which permitted the beam to warp at the
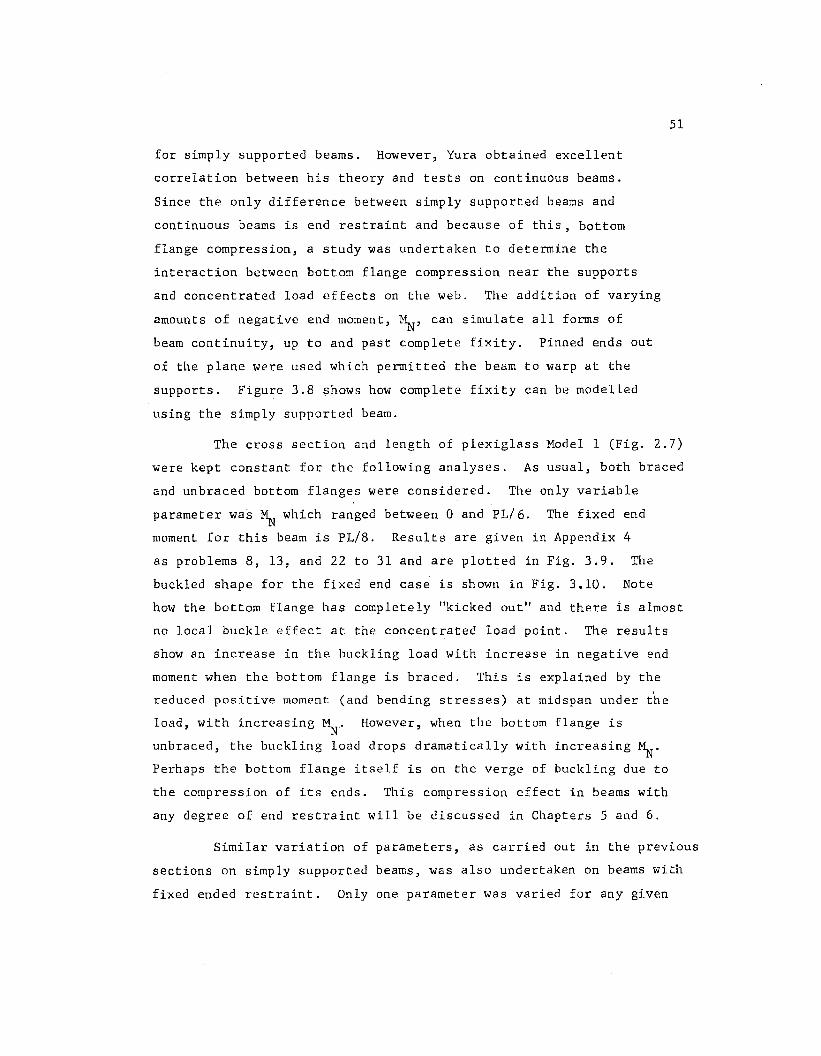
supports. Figure 3.8 shows how complete fixity can be modelled
using the simply supported beam.
51
The cross section and length of plexiglass Model 1 (Fig. 2.7)
were kept constant for the following analyses. As usual, both braced
and unbraced bottom flanges were considered. The only variable
parameter was~ which ranged between 0 and PL/6. The fixed end
moment for this beam is PL/8. Results are given in Appendix 4
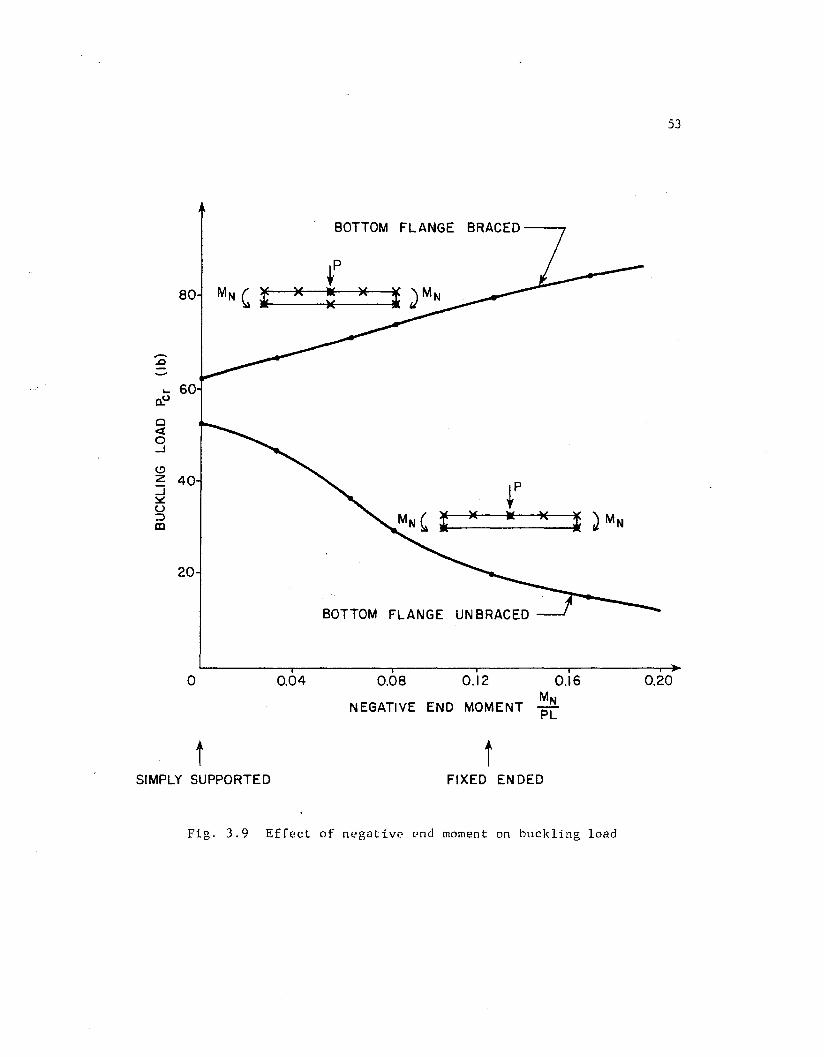
as problems 8, 13, and 22 to 31 and are plotted in Fig. 3.9. The
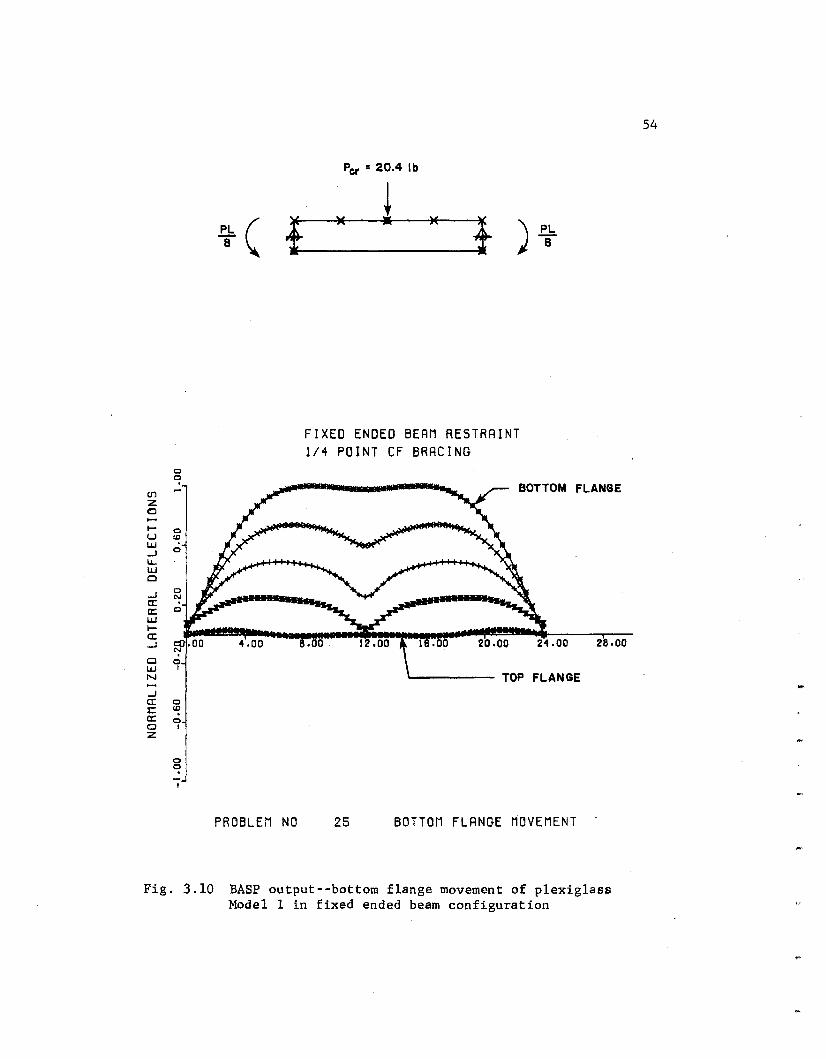
buckled shape for the fixed end case is shown in Fig. 3.10. Note
how the bottom flange has completely "kicked out" and there is almost
no local buckle effect at the concentrated load point. The results
show an increase in the buckling load with increase in negative end
moment when the bottom flange is braced. This is explained by the
reduced positive moment (and bending stresses) at midspan under the
load, with increasing MN· However, when the bottom flange is
unbraced, the buckling load drops dramatically with increasing~·
Perhaps the bottom flange itself is on the verge of buckling due to
the compression of its ends. This compression effect in beams with
any degree of end restraint will be discussed in Chapters 5 and 6.
Similar variation of parameters, as carried out in the previous
sections on simply supported beams, was also undertaken on beams with
fixed ended restraint. Only one parameter was varied for any given
LOADING A r BENDING MOMENT
~ PL 4
-
PL PL 8 8 ~ .lr).--------,..1#, )
+ ~------~-------~' pi
r
Fig. 3.8 Modelling of fixed ended beam
52
...
..
...
...
80
-.s:J
,_ 60 o_U
Cl ~ 0 ....J
(.!) 2 40 :J ~ u ::::> a:!
20
0 0.04
t SIMPLY SUPPORTED
BOTTOM FLANGE BRACED-~
~p )( • ~ ~ d MN
BOTTOM FLANGE UNBRACED
0.08 0.12 0.16 MN
NEGATIVE END MOMENT PL
t FIXED ENDED
Fig. 3.9 Effect of negativ0 ~nd moment on buckling load
53
0.20
0
~
tn z 0 ...... 1- 0 u ~ LLJ ...J 0
u... I..L.J Cl
...) 0
a: ~ a: 0
LLJ 1-a: ...)
Cl 0 LLJ I
N
...J a: 0 I: ~ a: 0 0 I z
0
~
'j'
Per = 20.4 lb
( l " ! " 1 P8L 't-----~ )
FIXED ENDED BEAM RESTRAINT 1/4 POINT CF BRACING
PL 8
BOTTOM FLANGE
4.00 20.00 28·00
~-------- TOP FLANGE
PROBLEM NO 25 BOTTOM FLANGE MOVEMENT
Fig. 3.10 BASP output--bottom flange movement of plexiglass Model 1 in fixed ended beam configuration
54
..
55
analysis. Both braced and unbraced bottom flanges were considered.
There was variation in length and depth of the beam such that 1/h
ranged from 8 to 32, variation in web thickness such that web
slenderness h/t ranged from 16 to 300, and also the singly symmetric w
section of Fig. 3.6 was studied. The results are reported in
Appendix 4 as problems 25, 30 and 52 to 69. They show that similar
trends are observed to those for simply supported beams. The
presence of end moment, however, increased the buckling load when
the bottom flange was braced, but decreased it otherwise. Very
slender webs (L/h = 150 to 300) exhibit local buckling even when
the bottom flange is unbraced, as discussed in the previous section
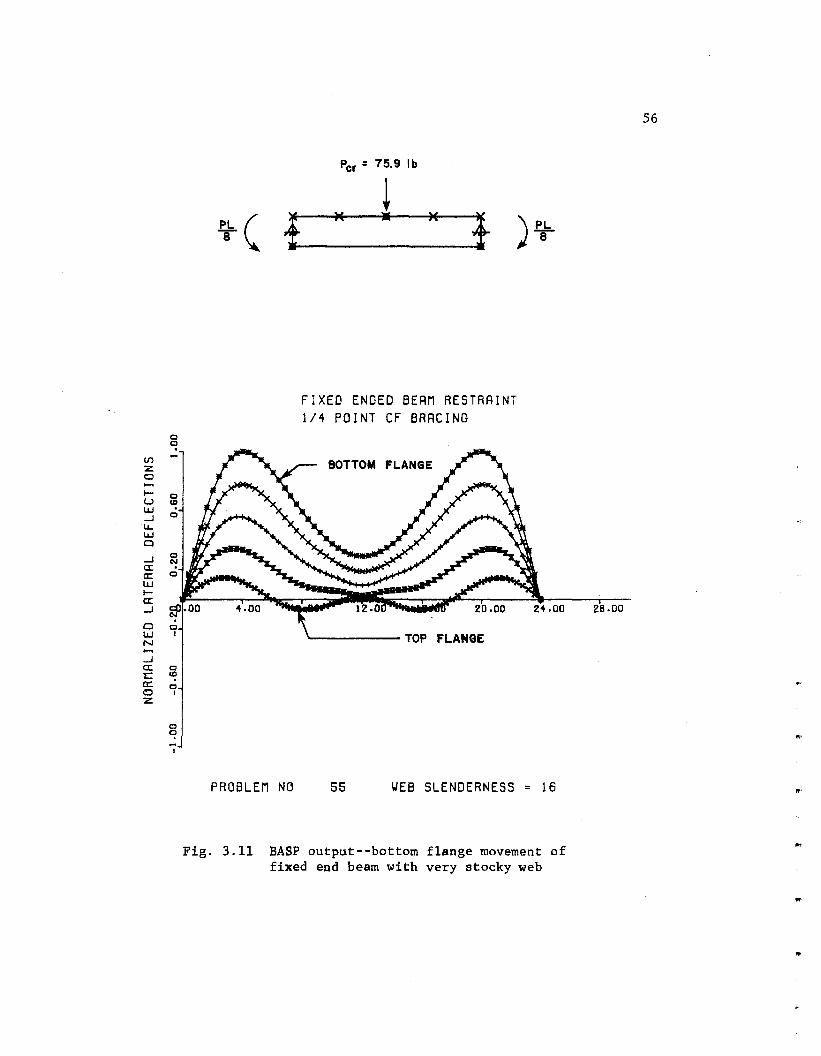
and shown on Fig. 3.7. Stocky webs (L/h = 15 to 30), however, will
not buckle locally at reasonable load levels. Other forms of
instability occur earlier. If the bottom flange brace is removed,
the stocky web acts as a restraining member for the "buckling"
bottom flange. The stockier the web, the better the restraint and
the less the movement of the bottom flange underneath the load
(Fig. 3.11).
3.3 Interpretation
The previous analyses raise points that were not earlier
recognized.
(1) The length of the beam, and thus the flexural stresses,
play an important role in the determination of P for cr
both local buckling (bottom flange braced at the load
point) and bottom flange movement (unbraced bottom
flange).
(2) The lateral stiffness of the bottom flange does not
significantly affect the buckling load for simply
supported beams with unbraced tension flanges.
0
~ (f) -z 0
.... 0 u "? w ....J 0
IJ.. w 0
....J 0
a: ~ a:: 0 w .... a: ....J
0 0 w I
N
....J a: 0 J:: "? a: 0 0 I z
0 ~ -I
Per = 75.9 lb
PeL ( i.....__)( _l -)( _..t
FIXED ENDED BERM RESTRAINT 1/4 POINT CF BRACING
BOTTOM FLANGE
TOP FLANGE
PROBLEM NO 55 IJEB SLENDERNESS "' 16
Fig. 3.11 BASP output--bottom flange movement of fixed end beam with very stocky web
56
28.00
..
..
57
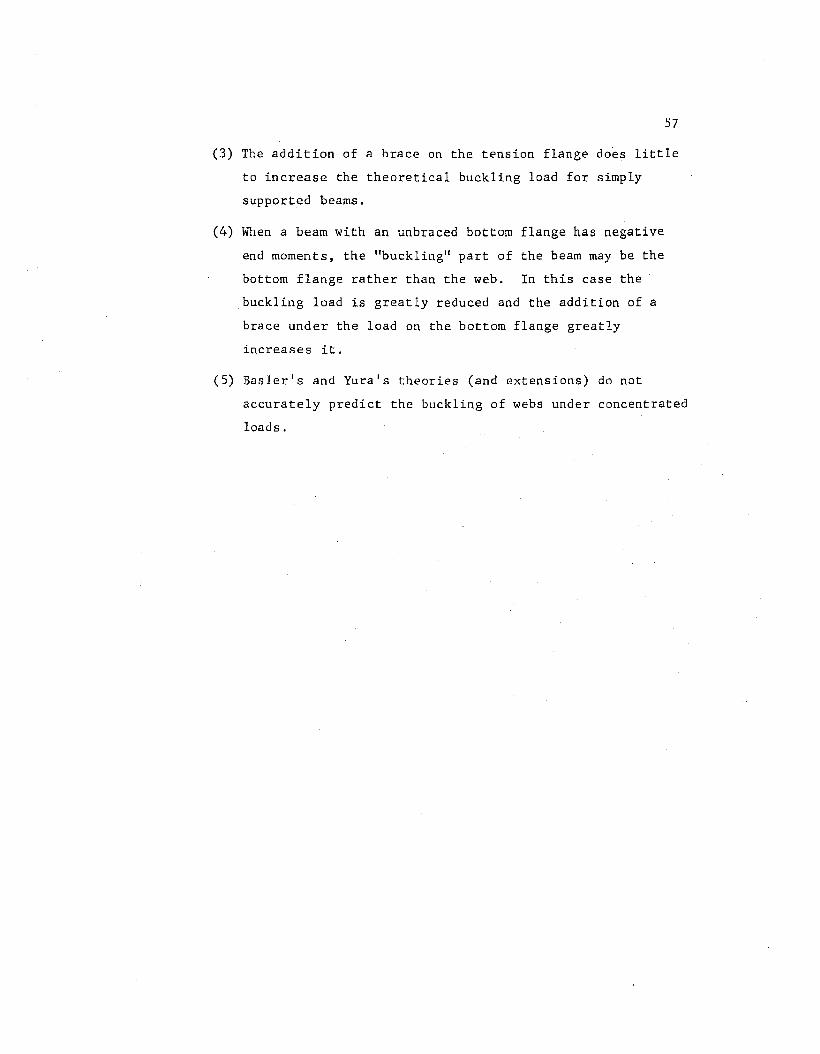
(3) The addition of a brace on the tension flange does little
to increase the theoretical buckling load for simply
supported beams.
(4) When a beam with an unbraced bottom flange has negative
end moments, the "buckling" part of the beam may be the
bottom flange rather than the web. In this case the
buckling load is greatly reduced and the addition of a
brace under the load on the bottom flange greatly
increases it.
(5) Basler's and Yura's theories (and extensions) do not
accurately predict the buckling of webs under concentrated
loads.
C H A P T E R 4
DESIGN RECOMMENDATIONS--SIMPLY SUPPORTED BEAMS
Th A Isc . f . . 3 1 B 1 I th 5 e current spec1 1cat1on emp oys as er s eory,
which ignores the bending stress contribution to the local web
buckle at a point of concentrated load. In this chapter an inter
action equation is developed that incorporates both a bending stress
term and a vertical stress term.
4.1 Tension Flange Braced
The equation to be developed must predict the buckling load
at the limits of design situations. Short beams have very low
bending stresses and at the buckling load, the vertical stress
distribution is the dominant factor causing the instability. Quite
the opposite occurs in long beams, where the bending stresses over
shadow the vertical stresses. BASP was used to determine the
buckling loads for these two extreme conditions.
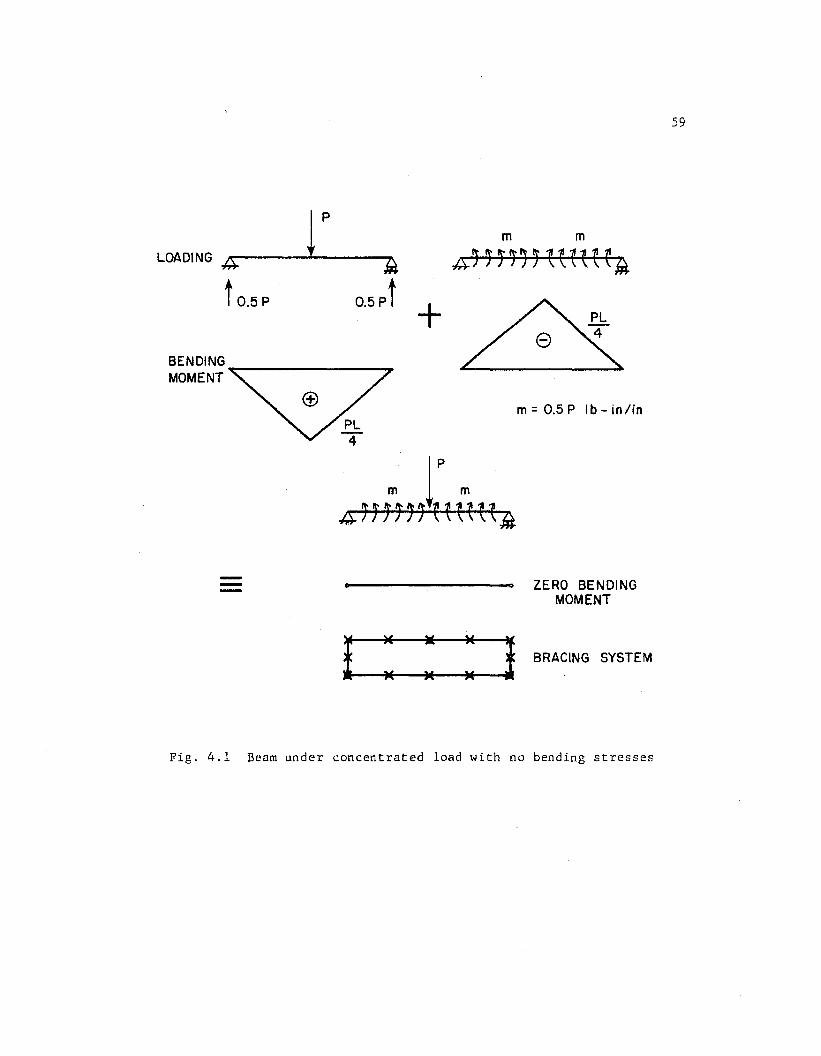
Figure 4.1 shows the manner in which the buckling load of
a beam with no bending stress was determined. A distributed moment
was applied in the opposite sense to the bending moment caused by
the vertical load. In this manner, a beam with very low bending
moments under a concentrated midspan load is obtained. The beam
cross section of Model 1 (Fig. 2.7) was used in the buckling analysis.
The bracing system adopted prevents all flange lateral movement;
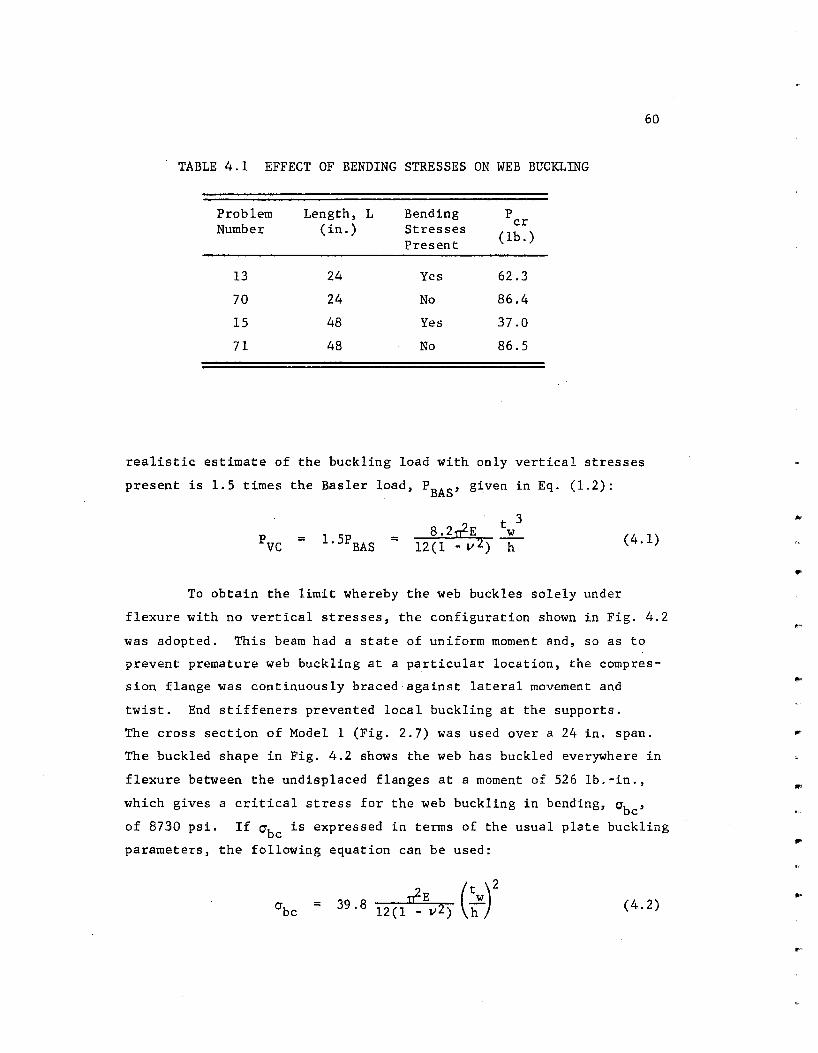
only local web buckling can occur. The results are shown in Table 4.1
for two model beam lengths, 24 in. and 48 in. These show that with
the bending stresses suppressed, the buckling load of 86.4 lb. is
independent of length. Basler's theory suggests that P = 57.8 lb. cr and this is conservative in this case by 49 percent. Hence, a more
58
...
...
...
..
r LOADING 4~---'----...,..~
t 0.5 p 0.5 p t BENDING MOMENT~~------""7
® PL 4
m m
+~ m=0.5P lb-in/in
l
p
m m
4tiiiii \~\\\\~
ZERO BENDING MOMENT
I : : : 1 BRACING SYSTEM
Fig. 4.1 Beam under concentrated load with no bending stresses
59
60
TABLE 4.1 EFFECT OF BENDING STRESSES ON WEB BUCKLING
Problem Length, L Bending p
Number (in.) Stresses cr
Present (lb.)
13 24 Yes 62.3
70 24 No 86.4
15 48 Yes 37.0
71 48 No 86.5
realistic estimate of the buckling load with only vertical stresses
present is 1.5 times the Basler load, PBAS' given in Eq. (1.2):
= = t 3
w h
(4.1)
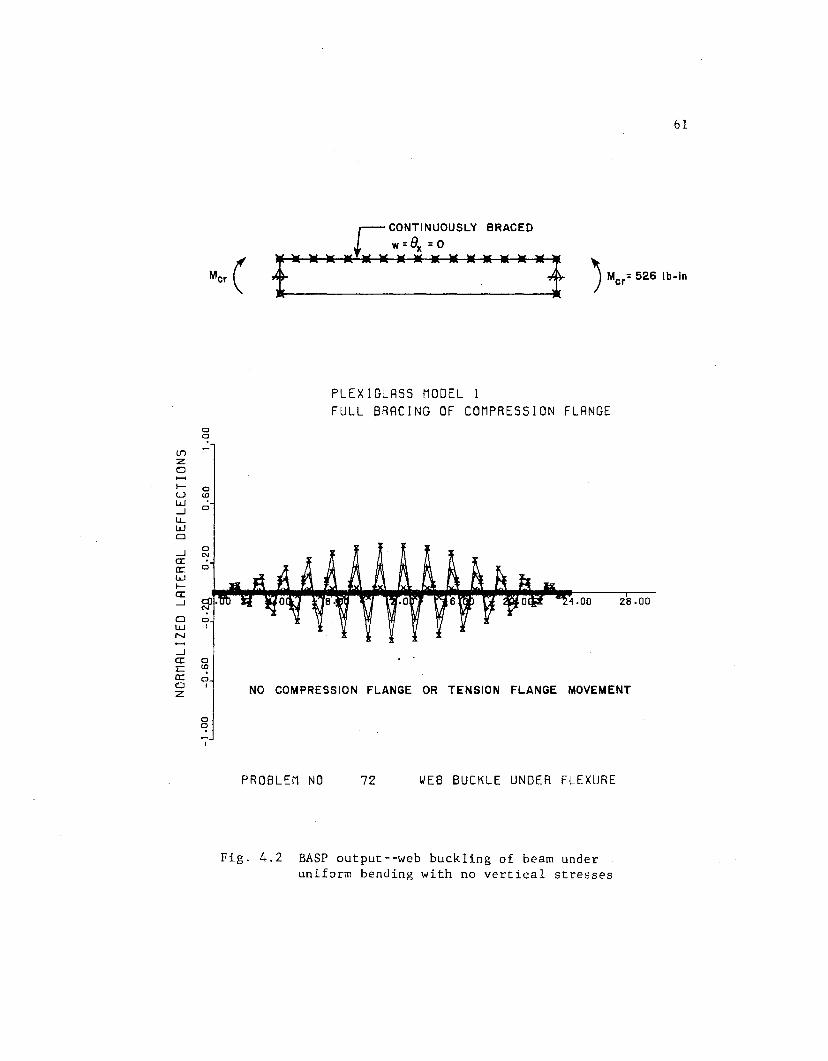
To obtain the limit whereby the web buckles solely under
flexure with no vertical stresses, the configuration shown in Fig. 4.2
was adopted. This beam had a state of uniform moment and, so as to
prevent premature web buckling at a particular location, the compres
sion flange was continuously braced against lateral movement and
twist. End stiffeners prevented local buckling at the supports.
The cross section of Model 1 (Fig. 2.7) was used over a 24 in. span.
The buckled shape in Fig. 4.2 shows the web has buckled everywhere in
flexure between the undisplaced flanges at a moment of 526 lb.-in.,
which gives a critical stress for the web buckling in bending, abc'
of 8730 psi. If abc is expressed in terms of the usual plate buckling
parameters, the following equation can be used:
= ifE (tw)2
39 ·8 12(1 - vZ) ~ (4.2)
...
...
,.
...
..
(f)
z 0
1-u w -' LL. w Cl
-' a: a:: w 1-a: -'
0 0
0 Ul
0
0 N
0
Cl 0 W I
N
-' a: 0 r: Ul
a:: 0 0 I
z
0 0
I
61
w=Bx=O
i""" c CONTINUOUSLY BRACED
. ·········t J Mer= 526 lb-in
PLEXIGLASS MODEL 1 FULL BRACING OF COMPRESSION FLANGE
'4.00 28.00
NO COMPRESSION FLANGE OR TENSION FLANGE MOVEMENT
PROBLEM NO 72 ~EB BUCKLE UNDER FLEXURE
Fig. 4.2 BASP output--web buckling of beam under uniform bending with no vertical stresses
62
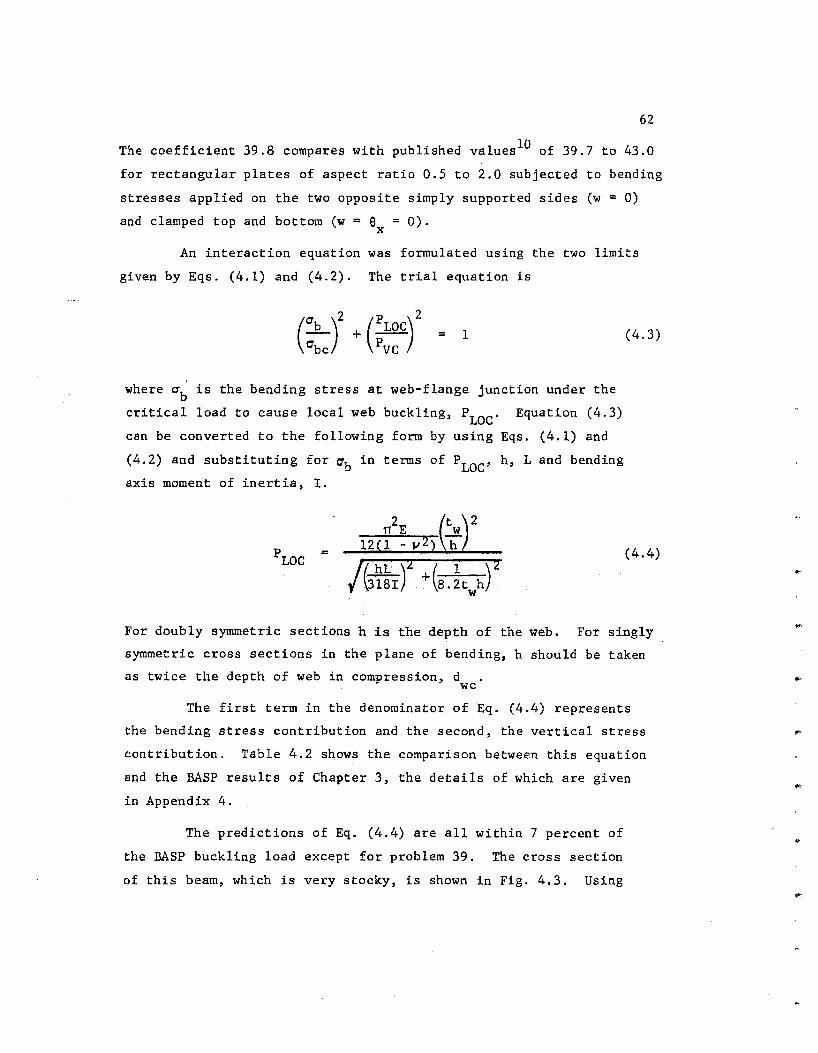
The coefficient 39.8 compares with published values 10 of 39.7 to 43.0
for rectangular plates of aspect ratio 0.5 to 2.0 subjected to bending
stresses applied on the two opposite simply supported sides (w = 0)
and clamped top and bottom (w = e = 0). X
An interaction equation was formulated using the two limits
given by Eqs. (4.1) and (4.2). The trial equation is
1
where ab is the bending stress at web-flange junction under the
critical load to cause local web buckling, PLoc· Equation (4.3)
can be converted to the following form by using Eqs. (4.1) and
(4.2) and substituting for ab in terms of PLOC' h, L and bending
axis moment of inertia, I.
=
/(....h.k-.)2 3181 ( 1 )2
+ 8.2t h w
(4.3)
(4.4)
For doubly symmetric sections h is the depth of the web. For singly
symmetric cross sections in the plane of bending, h should be taken
as twice the depth of web in compression, d we
The first term in the denominator of Eq. (4.4) represents
the bending stress contribution and the second, the vertical stress
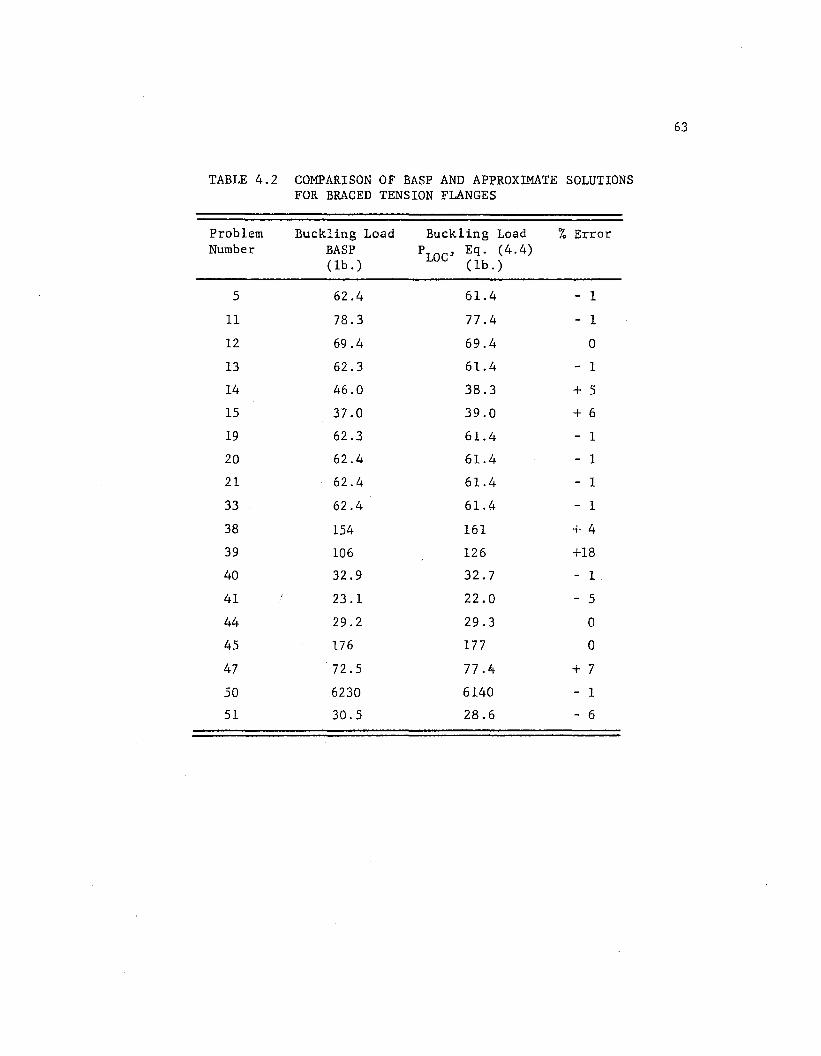
contribution. Table 4.2 shows the comparison between this equation
and the BASP results of Chapter 3, the details of which are given
in Appendix 4.
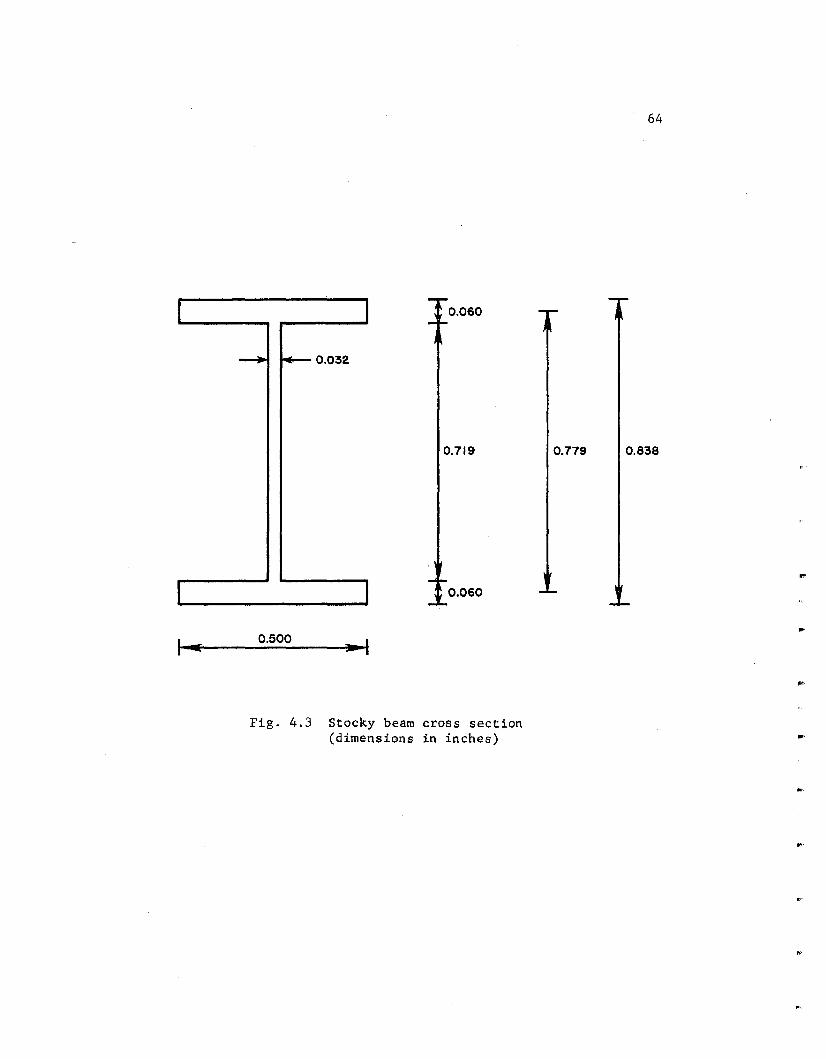
The predictions of Eq. (4.4) are all within 7 percent of
the BASP buckling load except for problem 39. The cross section
of this beam, which is very stocky, is shown in Fig. 4.3. Using
...
..
..
..
63
TABLE 4.2 COMPARISON OF BASP AND APPROXIMATE SOLUTIONS FOR BRACED TENSION FLANGES
Problem Buckling Load Buckling Load % Error Number BASP PLOC' Eq. (4.4)
(lb.) (lb.)
5 62.4 61.4 - l
11 78.3 77.4 - l
12 69.4 69.4 0
13 62.3 61.4 - l
14 46.0 38.3 + 5
15 37.0 39.0 + 6
19 62.3 61.4 - l
20 62.4 61.4 - 1
21 62.4 61.4 - 1
33 62.4 61.4 - 1
38 154 161 + 4
39 106 126 +18
40 32.9 32.7 - l
41 23.1 22.0 - 5
44 29.2 29.3 0
45 176 177 0
47 72.5 77.4 + 7
50 6230 6140 - 1
51 30.5 28.6 - 6
I
I
I 0.060
--+ ~0.032
0.719
l
0.500
Fig. 4.3 Stocky beam cross section (dimensions in inches)
64
0.779 0.838
..
..
..
..
65
the correct definition of h ( 0.719 in.), Eq. (4.4) gives P cr 126 lb., an 18 percent error. In BASP, however, the web elements
have a total depth d = 0.779 in., while the flanges are line elements
separated by this distance. Any shortening of the web elements to
accurately model the length of the web would result in a significant
reduction in the moment of inertia of the section. If h = d = 0.779
in. is used in Eq. (4.4), then P = 106 lb., an error of less than cr
0.1 percent. Thus, the difference between BASP and Eq. (4.4) is
mainly due to computer modeling of the web depth as the distance
between the flange centroids. Equation (4.4) appears to be valid
and can be easily used.
4.2 Tension Flange Unbraced
For web buckling at a point of concentrated load, the
current AISC specification makes no distinction between this case
and the tension flange "braced" problem of the previous section.
In Chapter 3, nineteen cases were observed in which significant
movement of the tension flange occurred in the buckled state. The
solutions are summarized in Table 4.3. The average difference
between the buckling loads for tension flange braced (Table 4.2) or
unbraced was 13 percent with a range of 1 percent to 23 percent.
The tension flange movement buckling load is always less than the
local web buckling load. After trying various approaches, it is
recommended when the tension flange is laterally unsupported, the
buckling load PTFU be determined by applying a reduction factor of
0.8 to the equation developed previously for braced tension flanges.
(4.5)
In this manner both bending stress effects and vertical stress
effects are modelled again. Table 4.3 shows the comparison between
this equation and the BASP results of Chapter 3.
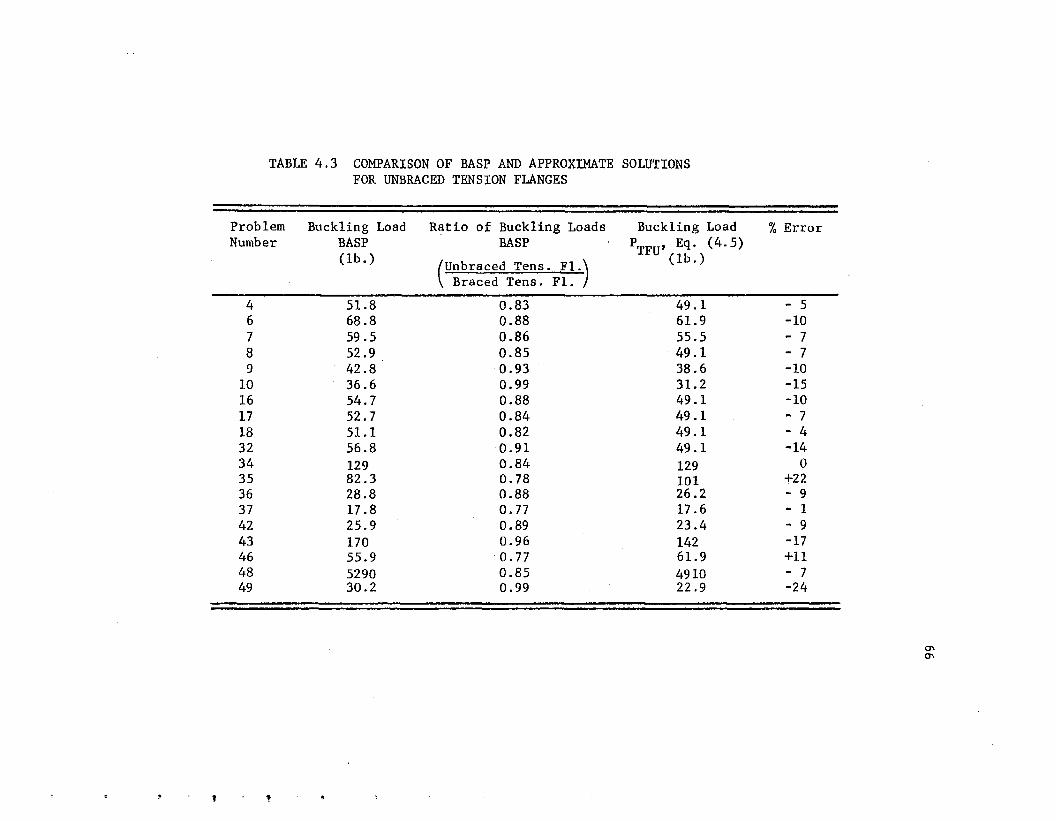
TABLE 4.3 COMPARISON OF BASP AND APPROXIMATE FOR UNBRACED TENSION FLANGES
Problem Buckling Load Ratio of Buckling Loads Number BASP BASP
(lb.) (Unbraced Tens. Fl.)
Braced Tens. Fl.
4 51.8 0.83 6 68.8 0.88 7 59.5 0.86 8 52.9 0.85 9 42.8 0.93
10 36.6 0.99 16 54.7 0.88 17 52.7 0.84 18 51.1 0.82 32 56.8 0.91 34 129 0.84 35 82.3 0.78 36 28.8 0.88 37 17.8 0.77 42 25.9 0.89 43 170 0.96 46 55.9 0.77 48 5290 0.85 49 30.2 0.99
l ,
SOLUTIONS
Buckling Load PTFU' Eq. (4.5)
(lb.)
49.1 61.9 55.5 49.1 38.6 31.2 49.1 49.1 49.1 49.1 129 101 26.2 17.6 23.4 142 61.9 4910 22.9
% Error
- 5 -10 - 7 - 7 -10 -15 -10 - 7 - 4 -14
0 +22 - 9 - 1 - 9 -17 +11 - 7 -24
Q'\ Q'\
67
The predictions of Eq. (4.5) are conservative on all but two
occasions: problems 35 and 46. In problem 35, the same section as
shown in Fig. 4.3 was used. For reasons discussed in the previous
section, BASP may also considerably underestimate PTFU when beams
are stocky. In problem 46, a singly symmetric cross section was
used. When the tension flange was braced, Eq. (4.4) overestimates
PLOC by 7 percent. For an unbraced tension flange, Eq. (4.5)
overestimates PTFU by 11 percent. Both these exceptions to the
conservativism of Eq. (4.5) should huve little concern to the user.
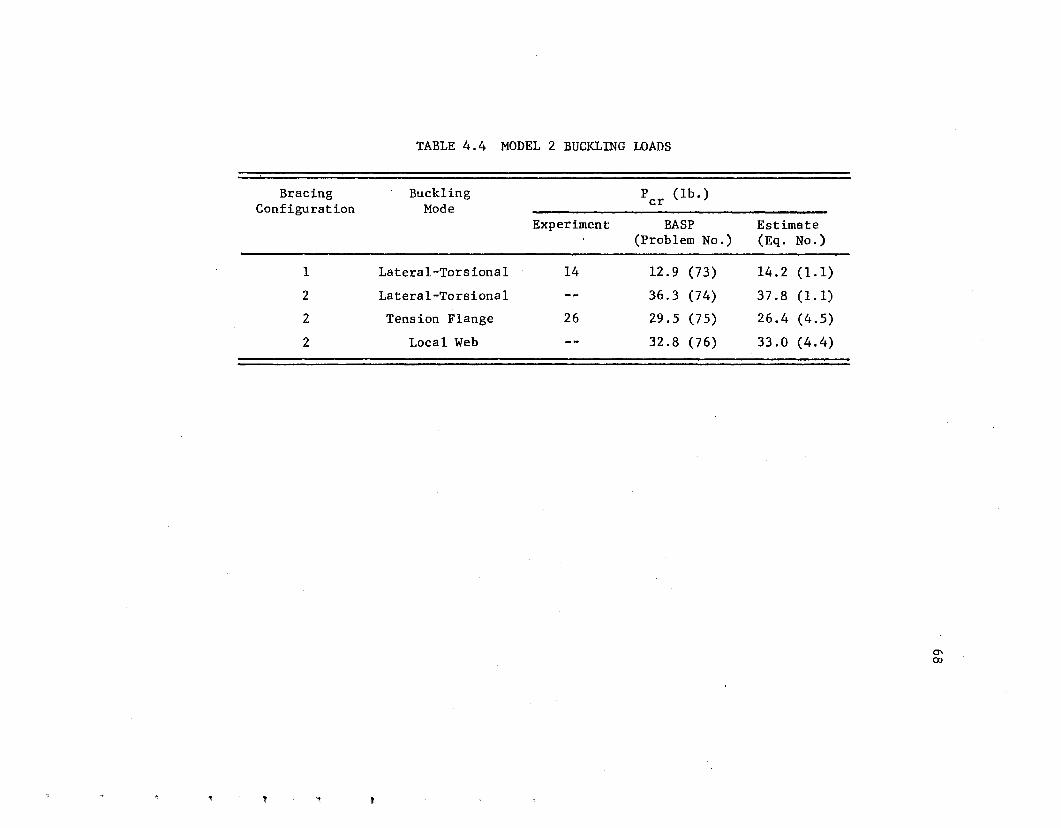
4.3 New Plexiglass Models
Equations (4.4) and (4.5) predict the loads to cause local
buckling and tension flange movement, respectively. Still, experi
mental verification of both these equations and the BASP results was
needed. It was decided to build a new plexiglass model beam that
could demonstrate the following phenomena: lateral-torsional
buckling in a conventional S-shape when braced at midspan only
(Configuration 1, Fig. 2.6), and tension flange movement when the
compression flange is braced at the 1/4-points (Configuration 2,
Fig. 2.6) at a lower load than that which causes lateral-torsional
buckling in a double S-shape.
The beam, Model 2, had very similar dimensions to those of
Model 1, the main difference being a thinner web. By reducing the
web thickness, the load to cause either local buckling or tension
flange movement should be considerably lessened, whereas the load
to cause lateral-torsional buckling would be relatively unaffected.
Model 2 dimensions are shown below with Model l dimensions in
parentheses.
b 0.500 in. (0.500 in.)
tf 0.065 in. (0.060 in.)
h 1.497 in. ( 1.498 in.)
t 0.025 in. (0.032 :i,n.) w
Bracing Configuration
1
2
2
2
TABLE 4.4 MODEL 2 BUCKLING LOADS
Buckling p (lb.) Mode cr
Experiment BASP (Problem No.)
Lateral-Torsional 14 12.9 (73)
Lateral-Torsional 36.3 (74)
Tension Flange 26 29.5 (75)
Local Web 32.8 (76)
Estimate (Eq. No.)
14.2 (1.1)
37.8 (1.1)
26.4 (4.5)
33.0 (4.4)
"' 00
69
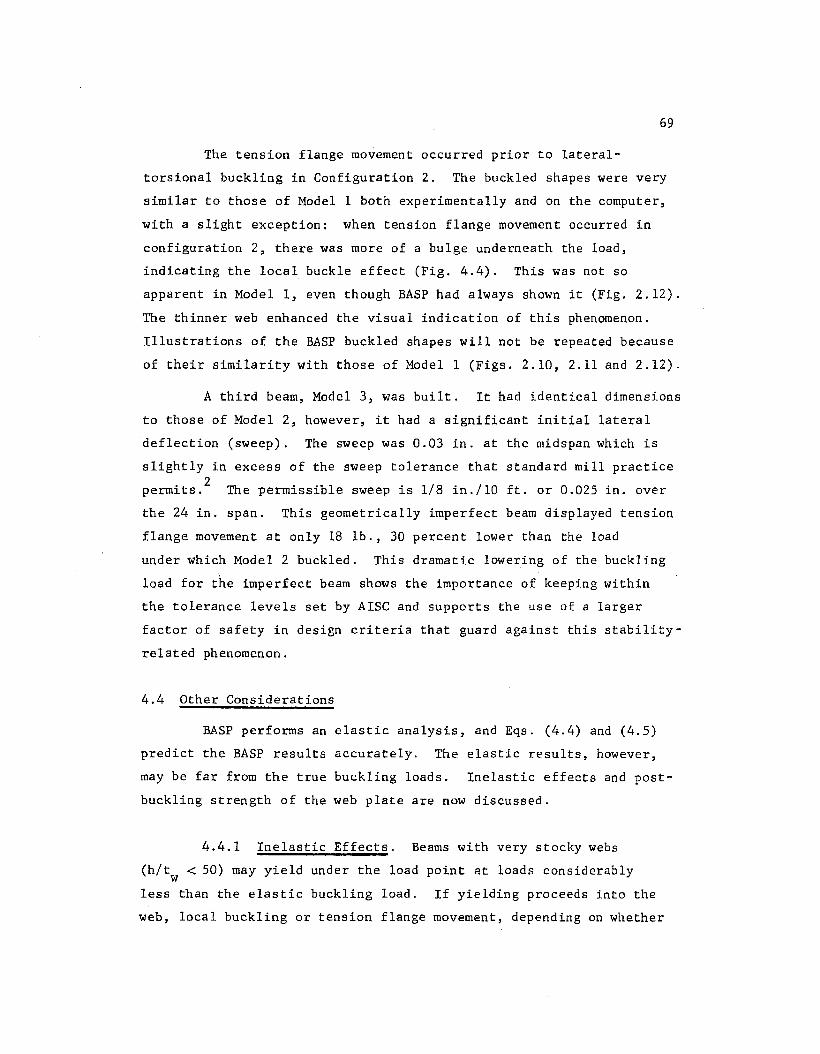
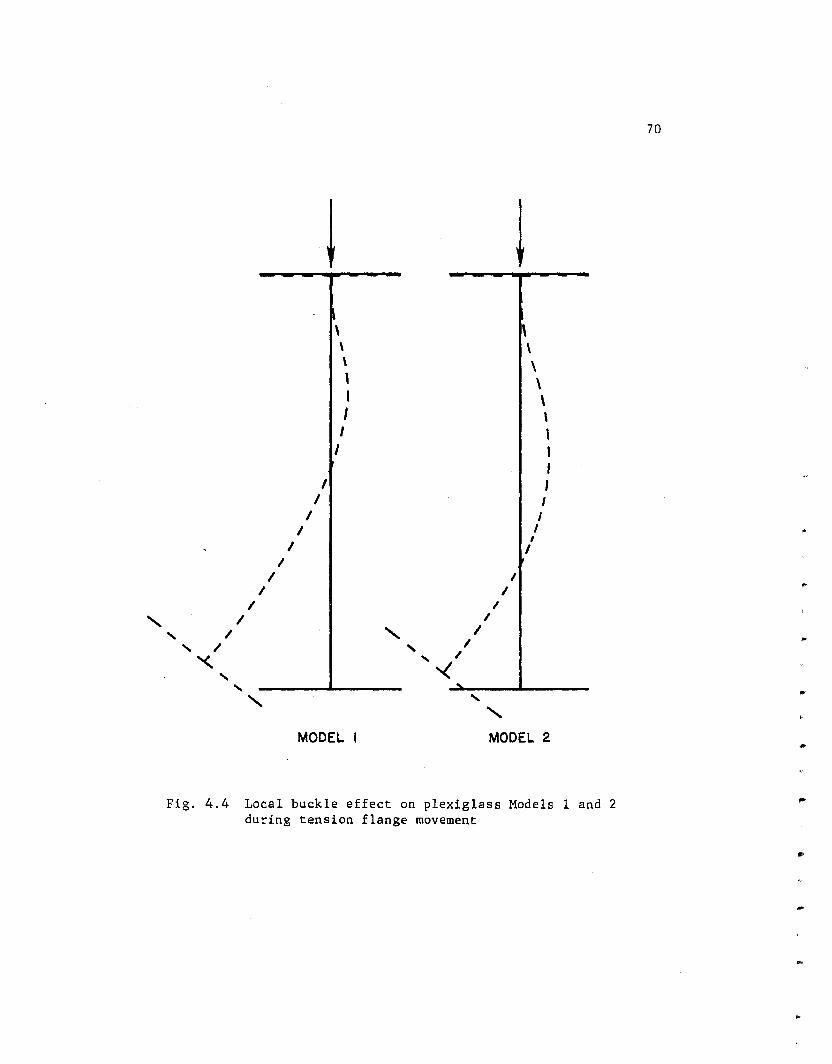
The tension flange movement occurred prior to lateral
torsional buckling in Configuration 2. The buckled shapes were very
similar to those of Model 1 both experimentally and on the computer,
with a slight exception: when tension flange movement occurred in
configuration 2, there was more of a bulge underneath the load,
indicating the local buckle effect (Fig. 4.4). This was not so
apparent in Model 1, even though BASP had always shown it (Fig. 2.12).
The thinner web enhanced the visual indication of this phenomenon.
Illustrations of the BASP buckled shapes will not be repeated because
of their similarity with those of Model 1 (Figs. 2.10, 2.11 and 2.12).
A third beam, Model 3, was built. It had identical dimensions
to those of Model 2, however, it had a significant initial lateral
deflection (sweep). The sweep was 0.03 in. at the midspan which is
slightly in excess of the sweep tolerance that standard mill practice
permits.2
The permissible sweep is 1/8 in./10 ft. or 0.025 in. over
the 24 in. span. This geometrically imperfect beam displayed tension
flange movement at only 18 lb., 30 percent lower than the load
under which Model 2 buckled. This dramatic lowering of the buckling
load for the imperfect beam shows the importance of keeping within
the tolerance levels set by AISC and supports the use of a larger
factor of safety in design criteria that guard against this stability
related phenomenon.
4.4 Other Considerations
BASP performs an elastic analysis, and Eqs. (4.4) and (4.5)
predict the BASP results accurately. The elastic results, however,
may be far from the true buckling loads. Inelastic effects and post
buckling strength of the web plate are now discussed.
4.4.1 Inelastic Effects. Beams with very stocky webs
(h/t < 50) may yield under the load point at loads considerably w less than the elastic buckling load. If yielding proceeds into the
web, local buckling or tension flange movement, depending on whether
'
\ \ \ \ \ \
' \ I \ I ' I ' I l
I I I
I I I I
I I I
I I I
I I I I
I I I I
' I ' I
' I ' I
'<.. '-...( I
' ....
' ' ' MODEL I MODEL 2
Fig. 4.4 Local buckle effect on plexiglass Models 1 and 2 during tension flange movement
70
..
...
...
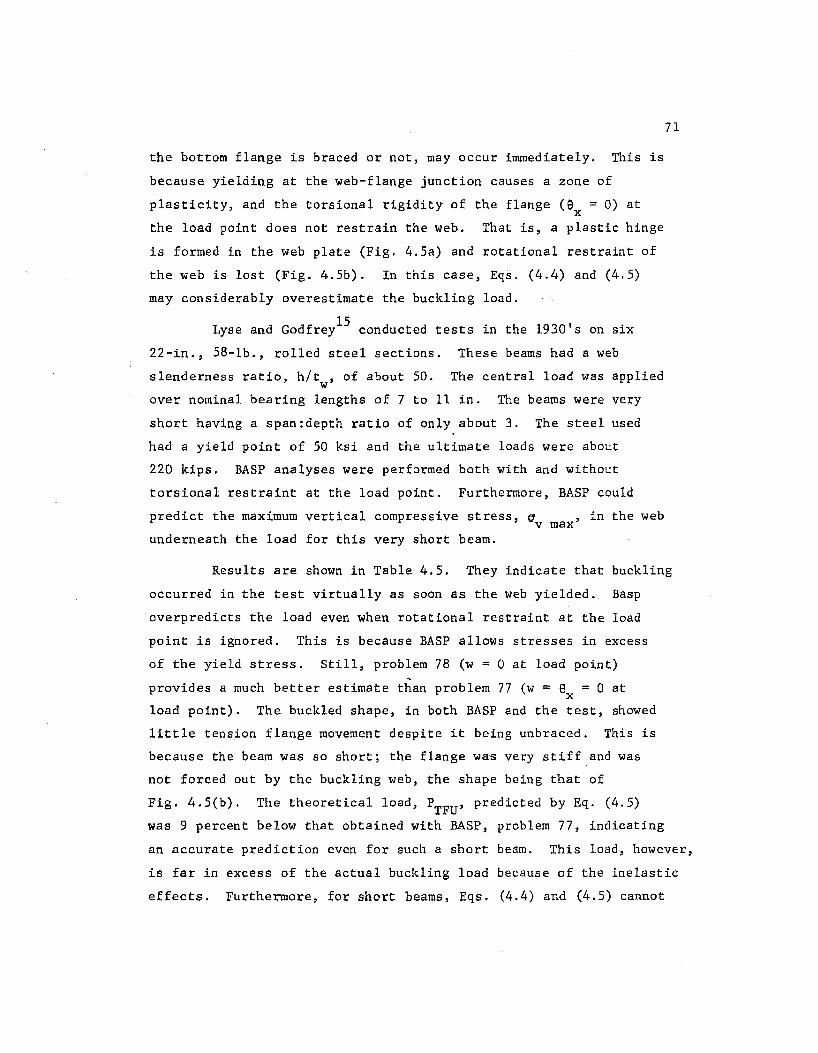
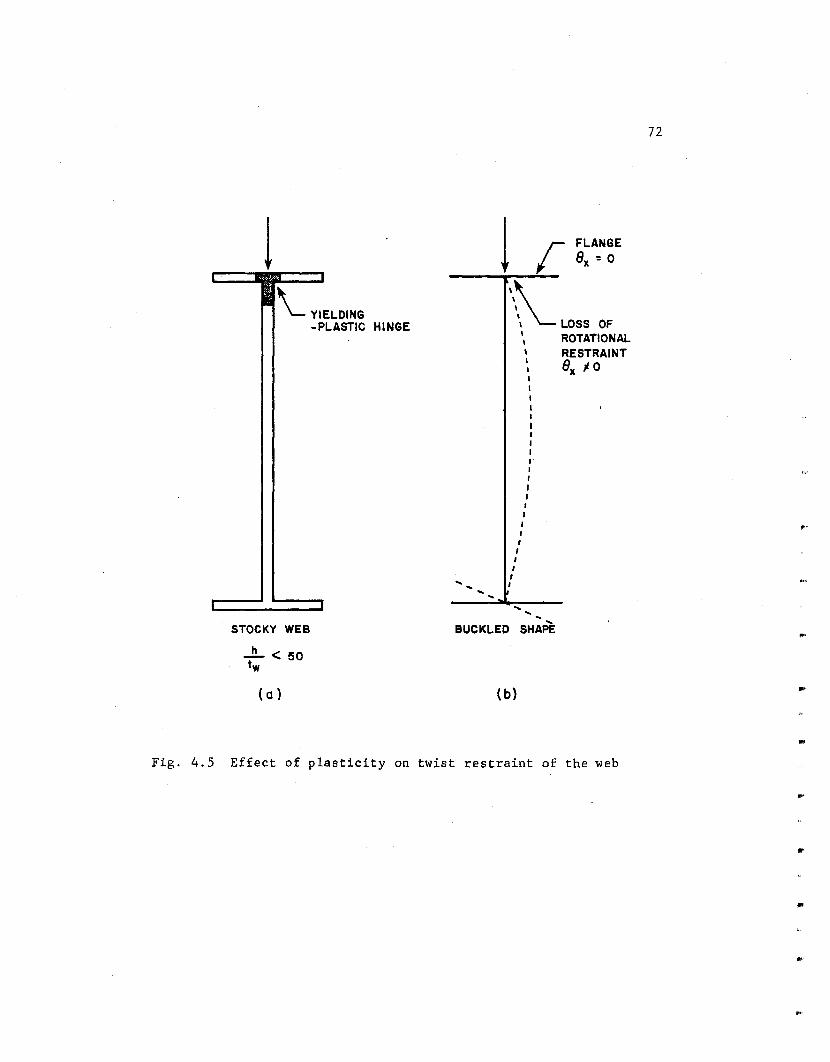
the bottom flange is braced or not, may occur immediately. This is
because yielding at the web-flange junction causes a zone of
plasticity, and the torsional rigidity of the flange (9 = 0) at X
the load point does not restrain the web. That is, a plastic hinge
is formed in the web plate (Fig. 4.5a) and rotational restraint of
the web is lost (Fig. 4.5b). In this case, Eqs. (4.4) and (4.5)
may considerably overestimate the buckling load.
15 Lyse and Godfrey conducted tests in the 1930's on six
22-in., 58-lb., rolled steel sections. These beams had a web
slenderness ratio, h/t , of about 50. The central load was applied w
over nominal bearing lengths of 7 to 11 in. The beams were very
short having a span:depth ratio of only about 3. The steel used
had a yield point of 50 ksi and the ultimate loads were about
220 kips. BASP ana lyses were performed both with and without
torsional restraint at the load point. Furthermore, BASP could
predict the maximum vertical compressive stress, a , in the web v max underneath the load for this very short beam.
71
Results are shown in Table 4.5. They indicate that buckling
occurred in the test virtually as soon as the web yielded. Basp
overpredicts the load even when rotational restraint at the load
point is ignored. This is because BASP allows stresses in excess
of the yield stress. Still, problem 78 (w = 0 at load point) ~
provides a much better estimate than problem 77 (w = e = 0 at X
load point). The buckled shape, in both BASP and the test, showed
little tension flange movement despite it being unbraced. This is
because the beam was so short; the flange was very stiff and was
not forced out by the buckling web, the shape being that of
Fig. 4.5(b). The theoretical load, PTFU' predicted by Eq. (4.5)
was 9 percent below that obtained with BASP, problem 77, indicating
an accurate prediction even for such a short beam. This load, however,
is far in excess of the actual buckling load because of the inelastic
effects. Furthermore, for short beams, Eqs. (4.4) and (4.5) cannot
l --•~m----•
\_YIELDING -PLASTIC HINGE
I
STOCKY WEB
..JL < !50 tw
(a)
_j
1 r FLANGE Bx = 0
-----~----
'\_LOSS OF
...
\ ROTATIONAL I RESTRAINT I Bx # 0
I' I I I I I I I I I I I I
I I
... .. BUCKLED SHAPE
(b)
Fig. 4.5 Effect of plasticity on twist restraint of the web
72
..
...
...
..
..
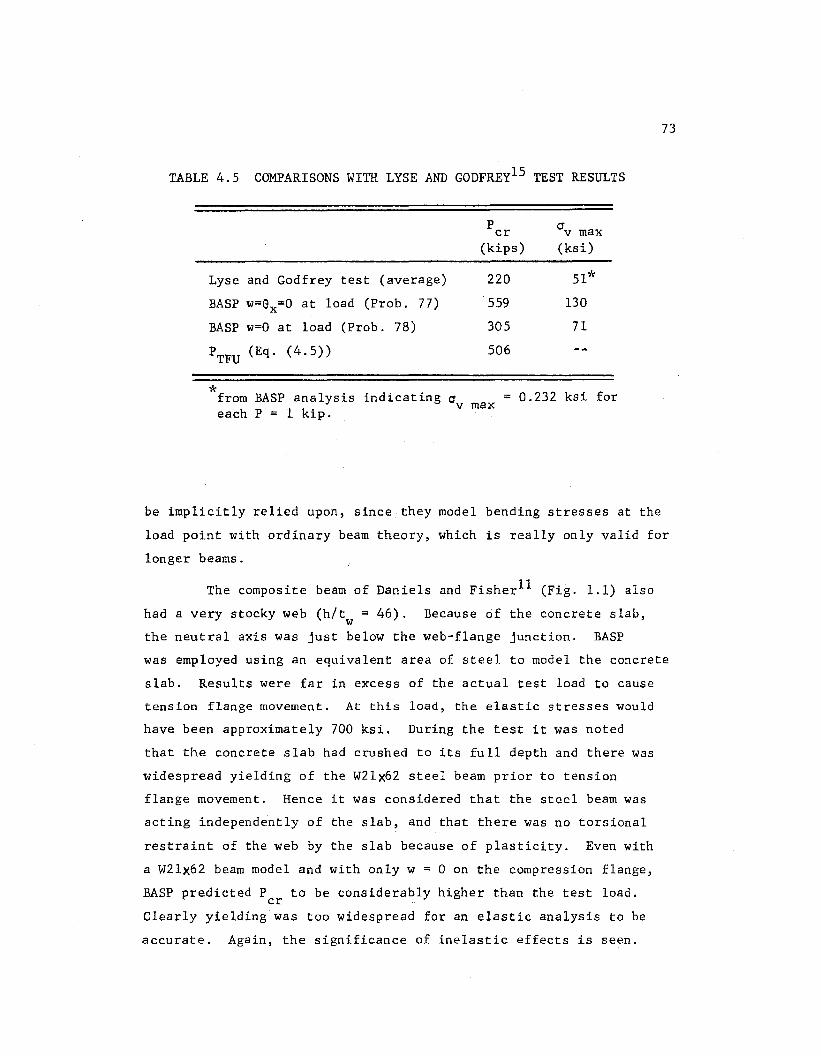
TABLE 4.5 COMPARISONS WITH LYSE AND GODFREY15 TEST RESULTS
p 0v max cr (kips) (ksi)
Lyse and Godfrey test (average) 220
BASP w=ex=O at load (Prob. 77) 559
BASP w=O at load (Prob. 78) 305
PTFU (Eq. (4.5)) 506
* from BASP analysis indicating a v max each P = 1 kip.
51*
130
71
0.232 ksi for
73
be implicitly relied upon, since they model bending stresses at the
load point with ordinary beam theory, which is really only valid for
longer beams.
The composite beam of Daniels and Fisher11 (Fig. 1.1) also
had a very stocky web (h/t = 46). Because of the concrete slab, w the neutral axis was just below the web-flange junction. BASP
was employed using an equivalent area of steel to model the concrete
slab. Results were far in excess of the actual test load to cause
tension flange movement. At this load, the elastic stresses would
have been approximately 700 ksi. During the test it was noted
that the concrete slab had crushed to its full depth and there was
widespread yielding of the W2lx62 steel beam prior to tension
flange movement. Hence it was considered that the steel beam was
acting independently of the slab, and that there was no torsional
restraint of the web by the slab because of plasticity. Even with
a W2lx62 beam model and with only w = 0 on the compression flange,
BASP predicted P to be considerably higher than the test load. cr Clearly yielding was too widespread for an elastic analysis to be
accurate. Again, the significance of inelastic effects is seen.
74
4.4.2 Post-Buckling Strength. The elastic analysis of BASP
is based on small-deflection theory whereby the buckled position is
in unstable equilibrium, close to the flat unbuckled original
position. Such a small out-of-plane displacement occurs in the web
plate at buckling. However, after this small displacement occurs,
tensile membrane stresses may arise in the mid-thickness plane which
tend to stabilize the plate. Any given element of a plate is
constrained by adjacent elements. Because these membrane effects
arise gradually during the loading of a plate girder, the sudden
buckling as for a compressed bar does not appear. The web of a
plate girder cannot collapse without the flanges surrounding it also
collapsing. The result of web buckling is to cause a redistribution
of stresses. As long as the flanges are capable of resisting an
increased share of the load, the web plate cannot fail until yielding
occurs. This phenomenon is known as post-buckling strength, and is
of course not modelled by the linear-buckling analysis program BASP.
Post-buckling strength usually only occurs in plate compres
sion elements that have edges supported. Free edges tend to move
during buckling and, hence, diminish the ability of membrane tensile
stresses to form. So, when the web buckles under the action of a
concentrated load, post-buckling strength can be expected when the
web remains elastic and the tension flange movement is minimal.
This tension flange movement can be prevented by bracing or by the
flanges being very stiff relative to the web. In this case, Eq. (4.4)
may be quite conservative in predicting PLoc· If, however, the
tension flange is free to move and is not that stiff relative to
the web, little post-buckling strength can be expected, and then
both Eq. (4.5) and BASP would accurately predict PTFU"
Bergfelt and Hovik7 conducted a number of tests on short
beams (L/h = 5 to 8) with exceptionally slender webs (h/t ; 150 to w 350). All plate girders had the same extremely thin web, t = 2 mm. w The girders were unbraced on the bottom flange, but because of the
•
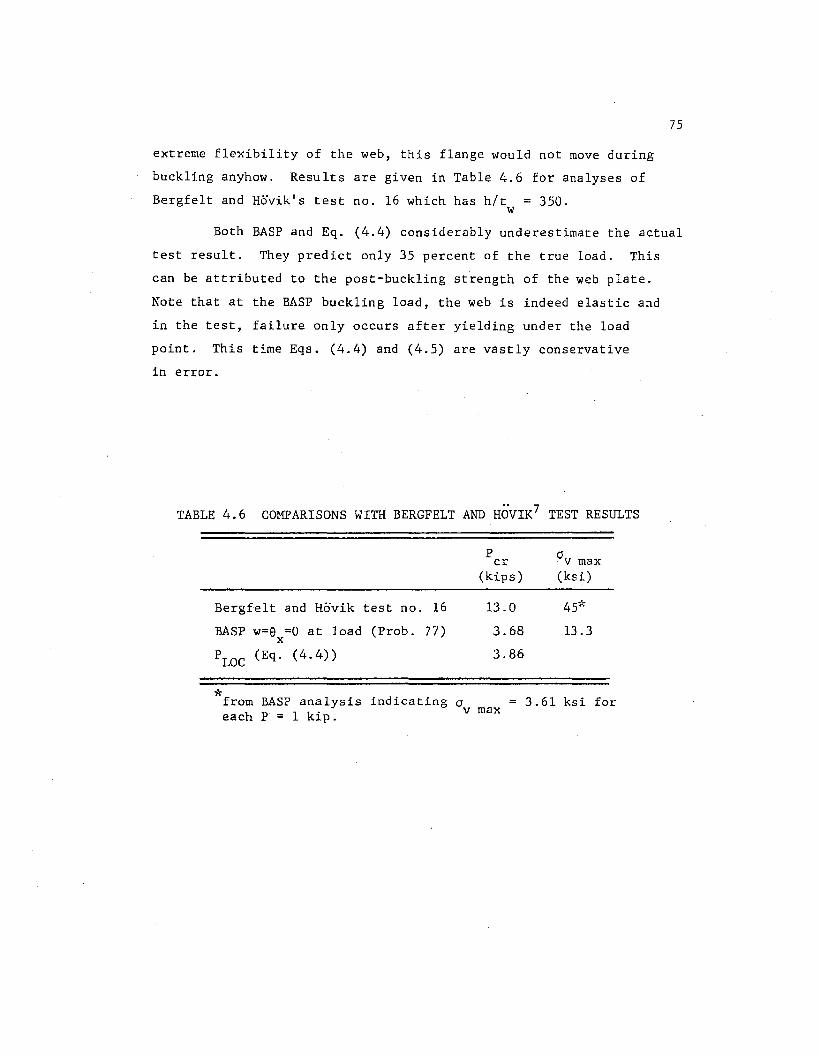
extreme flexibility of the web, this flange would not move during
buckling anyhow. Results are given in Table 4.6 for analyses of
Be~gfelt and Hovik's test no. 16 which has h/t = 350. w
75
Both BASP and Eq. (4.4) considerably underestimate the actual
test result. They predict only 35 percent of the true load. This
can be attributed to the post-buckling strength of the web plate.
Note that at the BASP buckling load, the web is indeed elastic and
in the test, failure only occurs after yielding under the load
point. This time Eqs. (4.4) and (4.5) are vastly conservative
in error.
TABLE 4.6 COMPARISONS WITH BERGFELT AND HOVIK7 TEST RESULTS
p 0v max cr (kips) (ksi)
Bergfelt and Hovik test no. 16 13.0 45~"
BASP w=e =0 at load (Prob. 77) 3.68 13.3 X
PLOC (Eq. (4.4)) 3.86
,'( indicating from BASP analysis 0 v max 3.61 ksi for
each p = 1 kip.
CHAPTER 5
DESIGN RECOMMENDATIONS--FIXED ENDED BEAMS
5.1 Bottom Flange Braced
As in the case of simply supported beams, the failure mode
of interest for fixed ended beams with both top and bottom flanges
braced at the load point is that of a local web buckle between
these braces. The end restraint simply reduces the midspan positive
moment and flexural stresses, resulting in a higher buckling load,
as seen in Fig. 3.9. End restraint has little effect onthe vertical
stress distribution under the load so Eq. (4.4) can be used with
one change. The span of the beam, 1, is replaced by the length
between inflection points, 11
. This is because the bending stress
at the web-flange junction under the load, ab' is the same function
of 11
in fixed ended beams as it is of 1 in simply supported beams.
With this change, Eq. (4.4) becomes
FLOC = (5 .1)
Once again, for singly symmetric cross sections use h = 2d we
Table 5.1 shows the comparison between this equation and the BASP
results of Chapter 3, the details of which are given in Appendix 4.
The results show that Eq. (5.1) can predict the web buckling loads
over the variety of conditions considered to within an accuracy of
±8 percent. Therefore, it successfully models the web behavior.
76
..
..
...
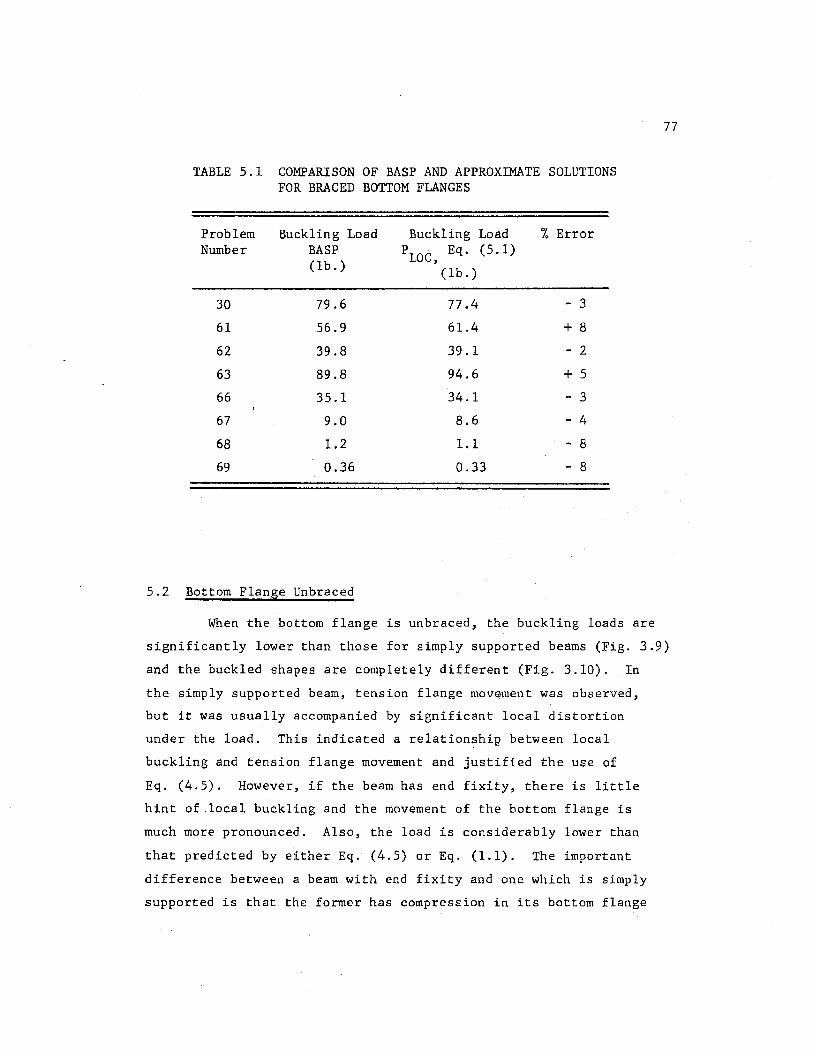
77
TABLE 5.1 COMPARISON OF BASP AND APPROXIMATE SOLUTIONS FOR BRACED BOTTOM FLANGES
Problem Buckling Load Buckling Load % Error Number BASP PLOC Eq. (5.1)
(lb.) ' (lb.)
30 79.6 77.4 - 3
61 56.9 61.4 + 8
62 39.8 39.1 - 2
63 89.8 94.6 + 5
66 35.1 34.1 - 3
67 9.0 8.6 - 4
68 1.2 1.1 - 8
69 0.36 0.33 - 8
5.2 Bottom Flange Unbraced
When the bottom flange is unbraced, the buckling loads are
significantly lower than those for simply supported beams (Fig. 3.9)
and the buckled shapes are completely different (Fig. 3.10). In
the simply supported beam, tension flange mov~ment was observed,
but it was usually accompanied by significant local distortion
under the load. This indicated a relationship between local
buckling and tension flange movement and justified the use of
Eq. (4.5). However, if the beam has end fixity, there is little
hint of .local buckling and the movement of the bottom flange is
much more pronounced. Also, the load is considerably lower than
that predicted by either Eq. (4.5) or Eq. (1.1). The important
difference between a beam with end fixity and one which is simply
supported is that the former has compression in its bottom flange
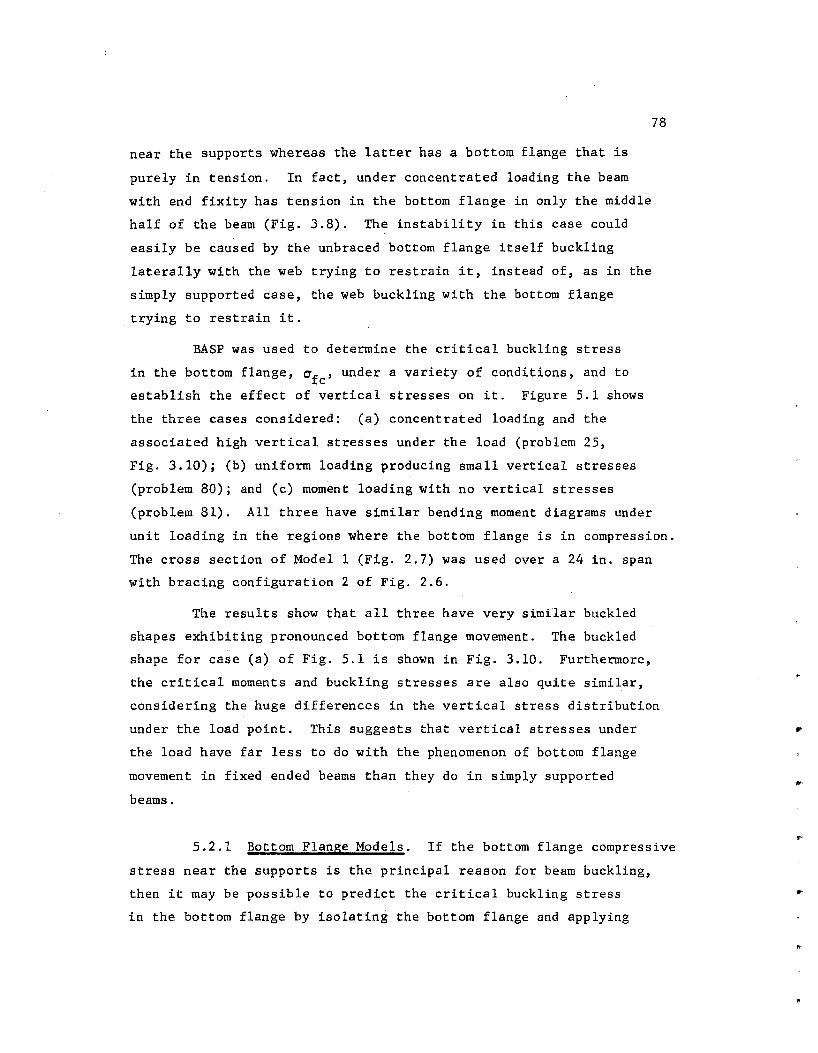
near the supports whereas the latter has a bottom flange that is
purely in tension. In fact, under concentrated loading the beam
with end fixity has tension in the bottom flange in only the middle
half of the beam (Fig. 3.8). The instability in this case could
easily be caused by the unbraced bottom flange itself buckling
laterally with the web trying to restrain it, instead of, as in the
simply supported case, the web buckling with the bottom flange
trying to restrain it.
BASP was used to determine the critical buckling stress
in the bottom flange, afc' under a variety of conditions, and to
establish the effect of vertical stresses on it. Figure 5.1 shows
the three cases considered: (a) concentrated loading and the
associated high vertical stresses under the load (problem 25,
78
Fig. 3.10); (b) uniform loading producing small vertical stresses
(problem 80); and (c) moment loading with no vertical stresses
(problem 81). All three have similar bending moment diagrams under
unit loading in the regions where the bottom flange is in compression.
The cross section of Model 1 (Fig. 2.7) was used over a 24 in. span
with bracing configuration 2 of Fig. 2.6.
The results show that all three have very similar buckled
shapes exhibiting pronounced bottom flange movement. The buckled
shape for case (a) of Fig. 5.1 is shown in Fig. 3.10. Furthermore,
the critical moments and buckling stresses are also quite similar,
considering the huge differences in the vertical stress distribution
under the load point. This suggests that vertical stresses under
the load have far less to do with the phenomenon of bottom flange
movement in fixed ended beams than they do in simply supported
beams.
5.2.1 Bottom Flange Models. If the bottom flange compressive
stress near the supports is the principal reason for beam buckling,
then it may be possible to predict the critical buckling stress
in the bottom flange by isolating the bottom flange and applying
79
f=>_, AMcr
"V ~ AMcr
Mer Ill( :.1
Lj2
High
1020
(a )
VERTICAL STRESSES UNDER LOAD
Low
crfc (psi)
1180
(b)
""i7 Mer
Ill( )lo I
Lj2
None
1290
(c)
Fig. 5.1 Effect of vertical stresses on critical buckling stress in the bottom flange of fixed ended beams
80
both the loads and lateral springs that match conditions in the real
beam. Figure 5.2 shows the bottom flange modelled as a column with
the same stress distribution in it as was the case when it was part
of the beam, supported by springs of variable lateral stiffness, k,
which represent the web's ability to restrain the flange.
Two cases were considered to see if this model could predict
the buckling loads. The cross section and length of plexiglass
Model 1 was used. Case 1 (problem 82) is shown in Fig. 5.3. The
top flange of the beam is continuously braced against twist and
lateral movement. In this manner, the web provides a uniform lateral
support for the bottom flange and the stiffness of the springs, k,
is constant per unit length of the flange. The spring constant is
taken as the stiffness of the web acting as a cantilever supported
at the top flange midsurface, k = 1/~ = 3EI /d3 where I w w moment of inertia of a unit width of web. The results show close
agreement; the model prediction of afc is 12 percent higher than the
true stress at which the beam buckles. This is because the model
does not take into account the effect of vertical and torsional
stresses.
Case 2, shown in Fig. 5.4, is the beam of problem 25, whose
buckled shape was presented in Fig. 3.10. Because the web is
restrained against twist only at the supports and at midspan, the
springs k will clearly be of variable stiffness along the length
of the flange. k may be estimated as 1/(~1 + ~2 + ~3 ) where
~l = translation of compression flange which is assumed to be zero
for Case 2 based on an examination of the buckled shape, and
~2 = rotation of the compression flange, a, multiplied by depth
of the web. Here 9 = 0 at the ends and at midspan. At the other
points along the length, assume that rotation e has a linear
distribution between the 1/4-points and the ends and midspan. At
the 1/4-point, 6 = (L/2) 2/SGJtf' which is the angle of twist
associated with uniform torsion in a bar.8
Jtf is the torsion
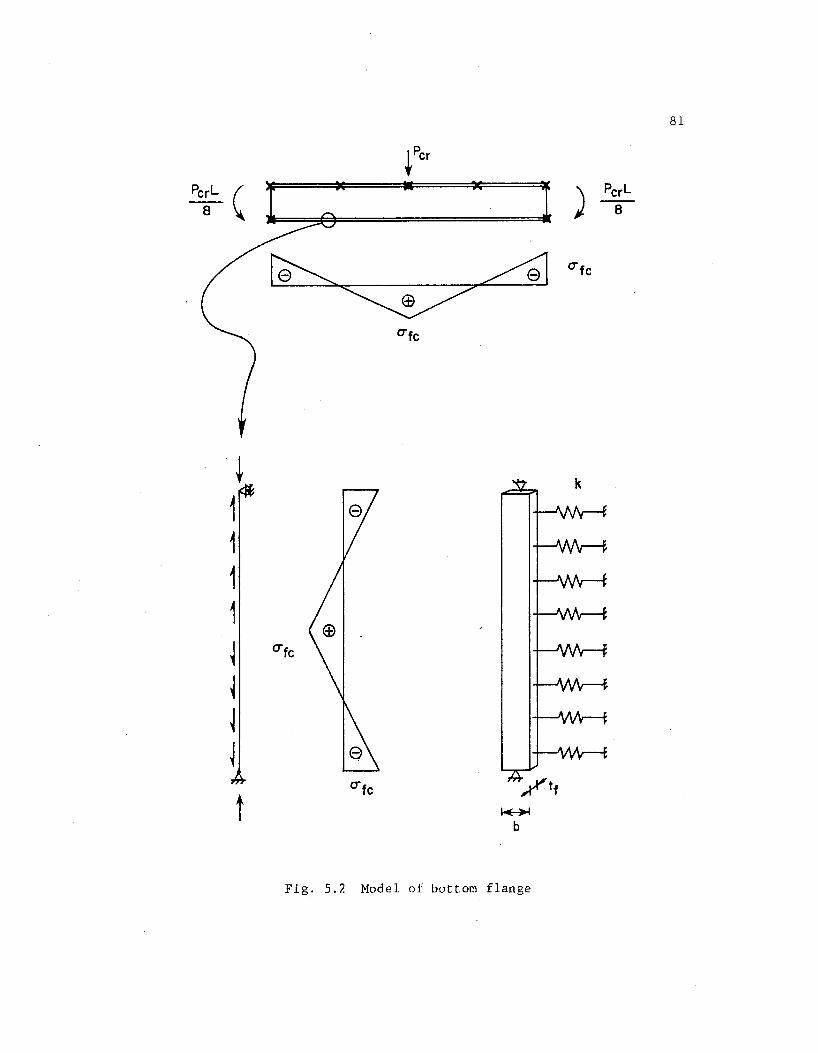
81
+ 1 1 1 1 ~ O"'fc
~
~
~
t o-fc
~
b
Fig. 5.2 Model of bottom flange
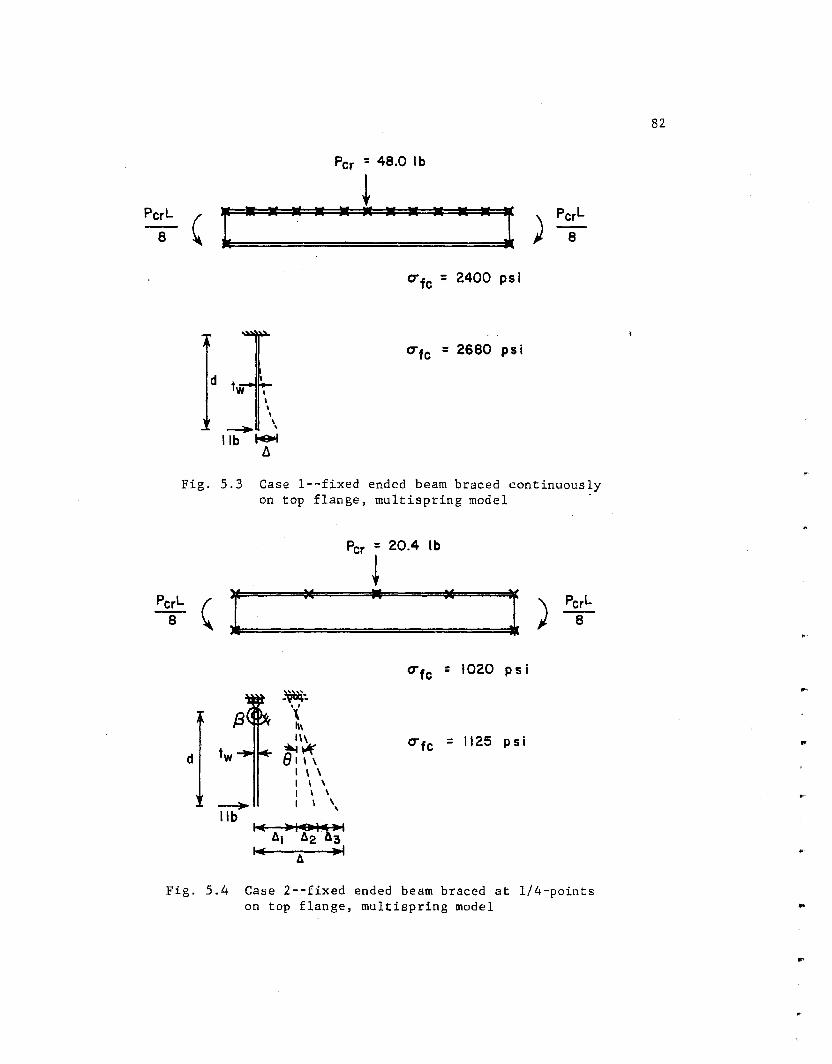
PerL
8 ' d
c •
I I I I \
---+ ' lib t-9ol a
Per
• • •
= 48.0 lb
! • • • • • I PerL ) --
8
u fe = 2400 psi
O"'fe = 2680 psi
Fig. 5.3 Case 1--fixed ended beam braced continuously on top flange, multispring model
Per = 20.4 lb
~ PerL ( I
u .. u
l ) PerL 8 8
u fe = 1020 psi
~-- -', \
"' ,,, u fe = 1125 psi
tw ~~ d e 1 , ,
I \ \ I I \ I I \
~ I I ' ' lib I~ )ll$1'\•1
At A2 3 I~
A .,
Fig. 5.4 Case 2--fixed ended beam braced at 1/4-points on top flange, multispring model
82
...
..
..
constant of the top flange which is equal to btf3/3. A3
is defined
in Fig. 5.3 as ~-
83
Using this variation in k, good correlation was obtained
between beam and model. The model prediction was 10 percent higher
than the beam buckling load and this again can be attributed to the
omission of the effect of the vertical stresses in the flange model.
5.2.2 Single Spring Model. The previous section suggests
that if the variation in lateral support spring stiffness along the
flange length is accurately determined, then an excellent prediction
of the critical buckling stress can be obtained. This procedure,
however, is not suited for design purposes. Simple parameters are
required to model the rest of the beam's ability to support the
buckling bottom flange. The beam of Fig. 5.4 has rotational restraint
of the top flange at midspan only. Consequently, in the calculation
of A = ~l + A2 + A3 it was found that at all locations except those
near the supports or midspan, ~2 was by far the major component of
~ since the torsional resistance of the top flange was not high.
Furthermore, most of the spring stiffnesses were less than 20 per
cent of the spring stiffness at the load point, with the springs
adjacent to midspan being only 40 percent of this value. This
suggested that a buckling model consisting of the flange with a
stress distribution as shown on Fig. 5.2, but supported laterally
only at one central location by a spring as in Fig. 5.5, could be
applicable. This figure also shows the buckling curve nondimension
alized by a* and k*, two reference values defined below. The curve
was generated using BASP. Note that up to k =>< 15k~·.-, an increase in
k results in an increase in afc and the buckled shape of the flange
is symmetric. However, for k > 15k*, the buckled shape is that of
an anti-symmetric S-shape with no lateral movement at the brace
point. Also, no increase in ofc is obtained for an increase in k.
The reference value a~" = p~'</Af where p''< = load at which an axially 2 2 compressed flange would buckle in the second mode 4n Eif/L ,
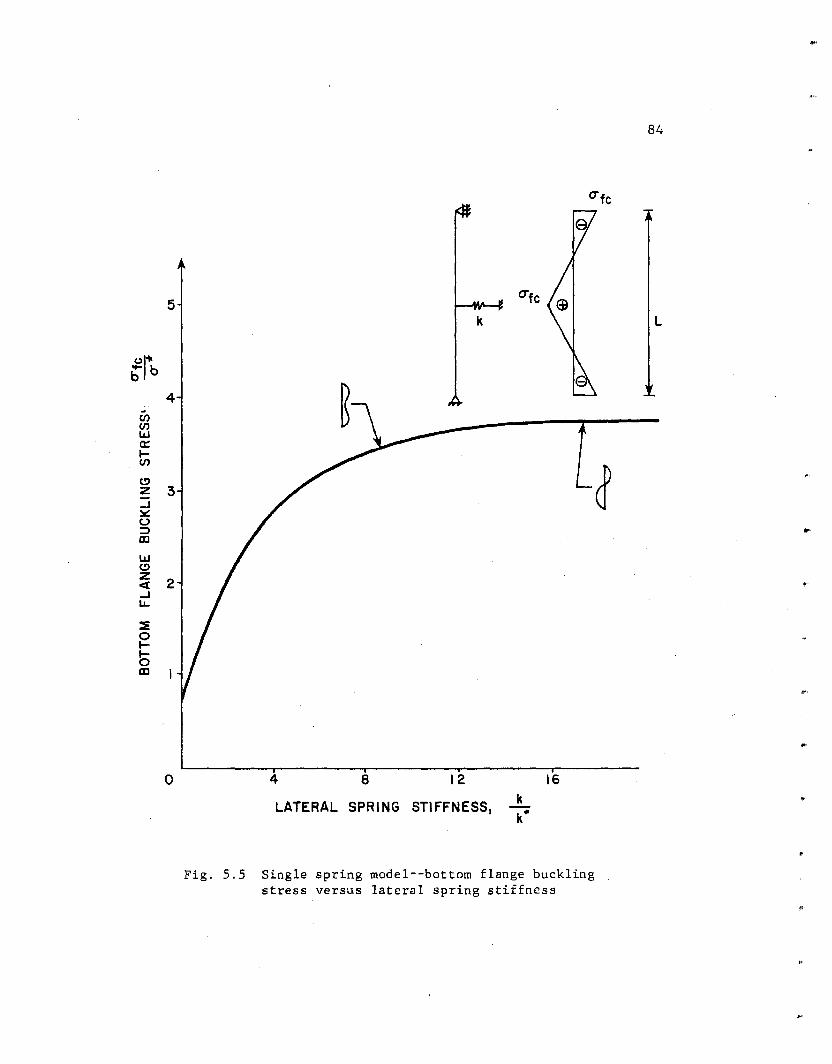
5
"I~ -b b 4
(/) (/) lLJ a:: 1-C/)
(!) z 3 ..J ~ u :::::1 Ill
LLI (!) z
2 <( ..J LL.
::.::E 0 1-1-0 ID
0
O"fc
k
4 8 12 16
LATERAL SPRING STIFFNESS,
Fig. 5.5 Single spring model--bottom flange buckling stress versus lateral spring stiffness
...
84
L
...
..
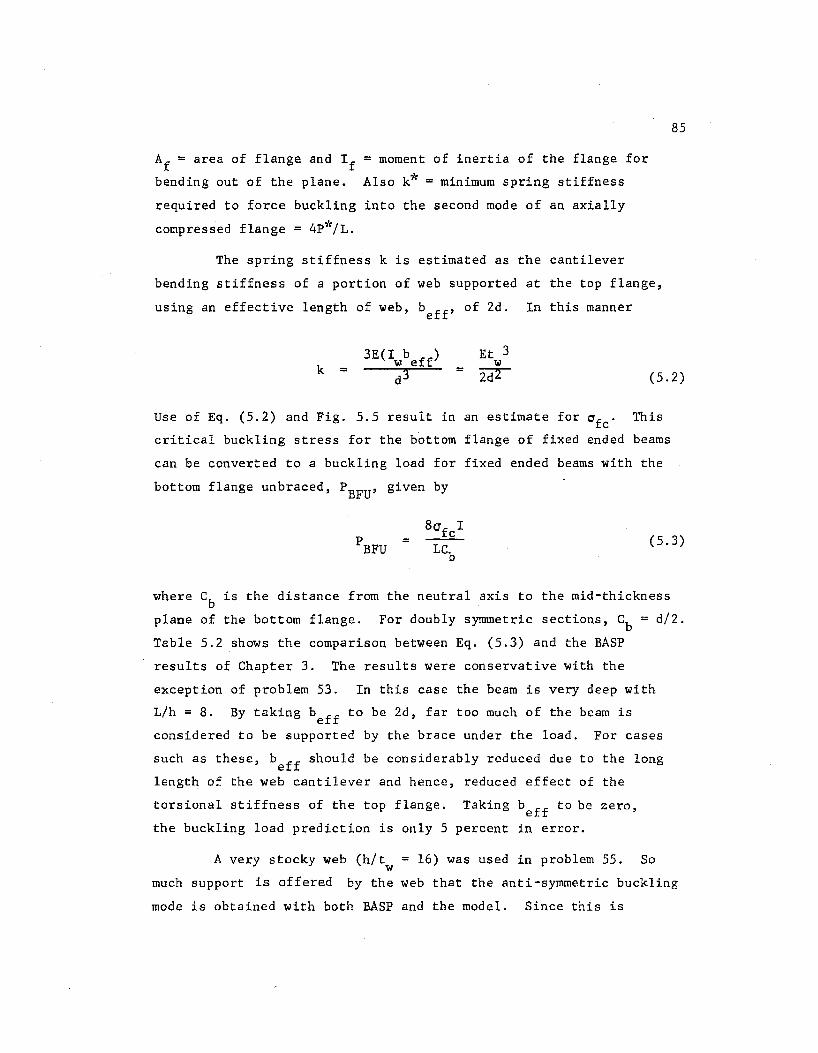
Af = area of flange and If = moment of inertia of the flange for
bending out of the plane. Also k* = minimum spring stiffness
required to force buckling into the second mode of an axially
compressed flange = 4P*/L.
The spring stiffness k is estimated as the cantilever
bending stiffness of a portion of web supported at the top flange,
using an effective length of web, beff' of 2d. In this manner
= = Et 3
w
85
k 2d2 (5.2)
Use of Eq. (5.2) and Fig. 5.5 result in an estimate for afc' This
critical buckling stress for the bottom flange of fixed ended beams
can be converted to a buckling load for fixed ended beams with the
bottom flange unbraced, PBFU' given by
= (5.3)
where Cb is the distance from the neutral axis to the mid-thickness
plane of the bottom flange. For doubly symmetric sections, Cb = d/2.
Table 5.2 shows the comparison between Eq. (5.3) and the BASP
results of Chapter 3. The results were conservative with the
exception of problem 53. In this case the beam is very deep with
L/h = 8. By taking beff to be 2d, far too much of the beam is
considered to be supported by the brace under the load. For cases
such as these, beff should be considerably reduced due to the long
length of the web cantilever and hence, reduced effect of the
torsional stiffness of the top flange. Taking beff to be zero,
the buckling load prediction is only 5 percent in error.
A very stocky web (h/t = 16) was used in problem 55. So w much support is offered by the web that the anti-symmetric buckling
mode is obtained with both BASP and the model. Since this is
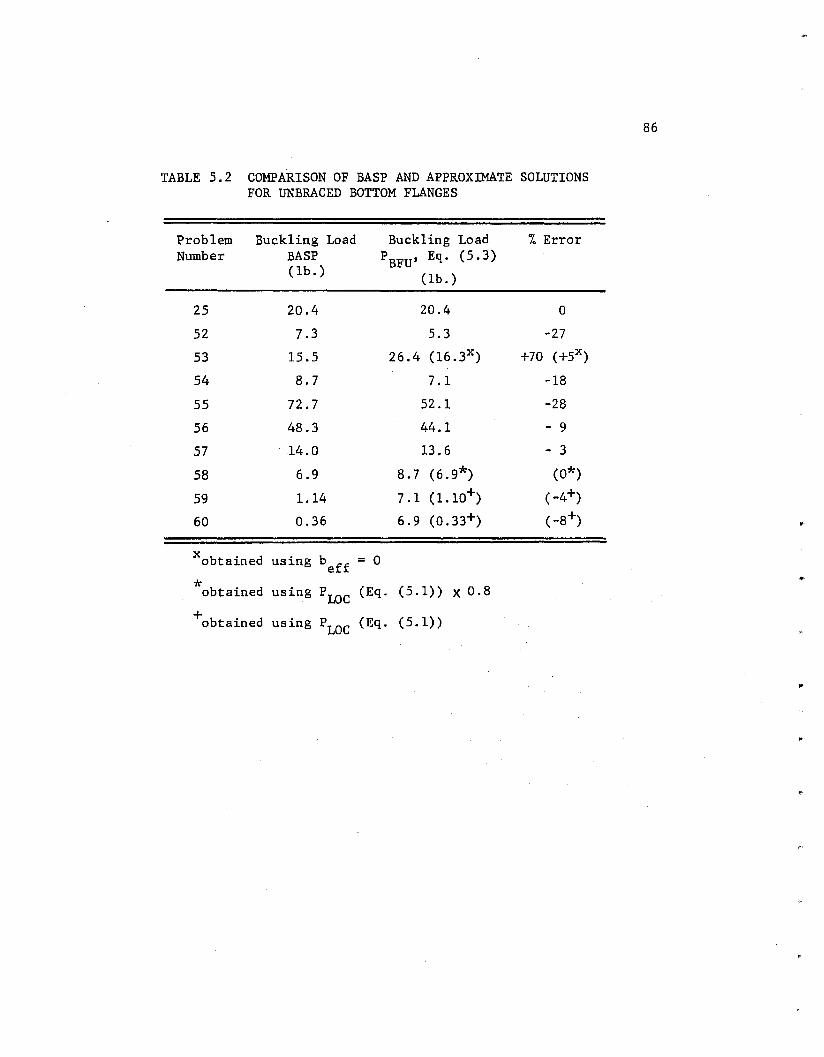
TABLE 5.2 COMPARISON OF BASP AND APPROXIMATE SOLUTIONS FOR UNBRACED BOTTOM FLANGES
Problem Buckling Load Buckling Load % Error Number BASP PBFU' Eq. (5.3)
(lb.) (lb.)
25 20.4 20.4 0
52 7.3 5.3 -27
53 15.5 26.4 (16.3x) +70 (+5x)
54 8.7 7.1 -18
55 72.7 52.1 -28
56 48.3 44.1 - 9
57 14.0 13,6 - 3
58 6.9 8.7 (6.9*) (O*)
59 1.14 7.1 (1.10+) (-4+)
60 0.36 6.9 (0.33+) ( -8+)
X obtained using beff = 0
* (Eq. (5.1)) X 0.8 obtained using PLOC
+obtained using PLOC (Eq. (5.1))
86
..
87
equivalent to full bracing at midspan, Eq. (1.1) could be used to
predict the buckling load. Indeed, this is a lateral-torsional
buckle between brace points and Eq. (1.1) yields P = 65 lb. cr
The buckled shapes of problems 58, 59 and 60 indicate that
local web buckling effects are dominating because of the slenderness
of the web (h/t = 100, 200 and 300, respectively). In this case, w Eq. (5.3) is grossly unconservative and Eq. (5.1) for PLOC (or
strictly speaking, 0.8 X P10C) should be used. These results
indicate that local buckling can still occur in a fixed ended beam
with an unbraced bottom flange.
5.2.3 Limitations. Equations (5.2), (5.3) and Fig. 5.5 .are
only valid as an estimate of the buckling load for fixed ended beams
with twist restraint at the load, but at no other point in the span.
Lateral restraint is assumed to be present at the load and also at
some other points on the top flange along the span. This prevents
appreciable lateral movement of the top flange during buckling,
which is assumed in the derivation in Eq. (5.2). The predictions
of the model are for elastic behavior and are based upon very simple
assumptions. Real behavior, however, is a complicated interaction
of many factors.
Several points must be made concerning the validity of the
model:
(1) Beams with slender webs (h/t > 100) must also be checked w for local web buckling, which may occur at loads lower than those
to cause movement of the bottom flange. Equation (5.1) can be used
to check web buckling for extremely slender webs (h/t > 200) as in w problems 59 and 60 where the bottom flange will not move anyway.
For slenderness ratios in the range 100 < h/t < 200, it is w recommended to take P as 0.8 times the value obtained from Eq. (5.1),
cr as in problem 58 because of bottom flange movement.
(2) For deep beams (L/h < 10), beff should be taken as
considerably less than the recommended value for ordinary beams,
2d. Conservatively, take beff = O, thus considering the flange as
unbraced along its length. Note also that for very deep beams,
the beam theory used in Eq. (5.3) becomes questionable.
(3) The model becomes very conservative for stocky webs
(h/t < 25) because of significant torsional resistance . w
(4) The model is conservative for stocky top flanges since
the contribution of its torsional stiffness has been ignored. It
was, however, considered in Case 2 of Sec. 5.2.1.
(5) As the thickness of the web increases, so does the
stiffness of the supporting spring, k (Eq. (5.2)). In the limit
88
this is equivalent to the bottom flange being braced at the load
point. At this stage, the model (Eqs. (5.2), (5.3), and Fig. 5.5)
should give the same buckling load as Eq. (1.1) for lateral torsional
buckling between brace points. It is found that the model is
conservative for web slenderness ratio h/t < 25, but unconservative w for h/t > 25, because of the manner in which torsional resistance w is considered. Nevertheless, it is reasonably accurate, but should
not be used in place of Eq. (1.1).
C H A P T E R 6
DESIGN RECOMMENDATIONS--BEAMS WITH VARYING END MOMENTS
6.1 Bottom Flange Braced
The interaction equation developed for simply supported
beams and modified for fixed ended beams can accurately model local
web buckling between top and bottom flanges braces in a beam with
any degree of end restraint. Equation (5.1) can be used with L1 the length between inflection points. Hence, as the end restraint
approaches zero, length L1
approached span length, L, and Eq. (5.1)
becomes the original equation for PLOC' Eq. (4.4). Table 6.1 shows
the comparison between Eq. (5.1) and the BASP.results shown pre
viously in Fig. 3.9.
The results show that Eq. (5.1) can accurately predict the
local web buckling load over the full range of end moments, ~'
between 0 and PL/6. As expected, increasing end moment increases
the buckling load, PLOC' because the bending stresses under the
load are reduced.
6.2 Bottom Flange Unbraced
For a simply supported beam, the phenomenon of tension
flange movement seems related to web buckling. Although the
movement is pronounced, there is a clear local distortion under
the load (Fig. 2.12). The buckling load, PTFU' is predicted by
Eq. (4.5) which is 80 percent of the load to cause local web buckling.
For fixed ended beams, however, the bottom flange movement is almost
unrelated to web behavior, and is caused by lateral buckling of the
bottom flange. Equations (5.2), (5.3), and Fig. 5.5 predict the
load that causes this movement of the bottom flange, PBFU"
89
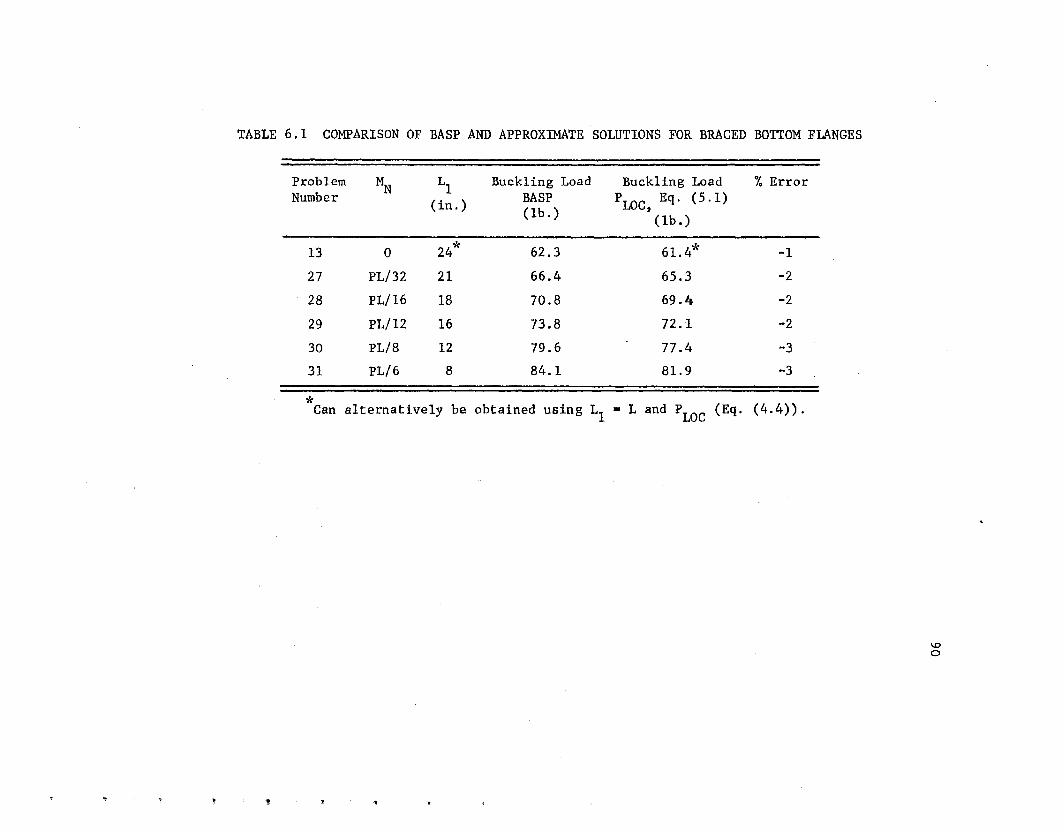
TABLE 6.1 COMPARISON OF BASP AND APPROXIMATE SOLUTIONS FOR BRACED BOTTOM FLANGES
Problem ~ Ll Buckling Load Buckling Load % Error Number (in.) BASP PLOC Eq. (5 .1)
(lb.) ' (lb.)
13 0 24* 62.3 61.4* -1
27 PL/32 21 66.4 65.3 -2
28 PL/16 18 70.8 69.4 -2
29 PL/12 16 73.8 72.1 -2
30 PL/8 12 79.6 77.4 -3
31 PL/6 8 84.1 81.9 -3
* Can alternatively be obtained using L1 = L and PLOC (Eq. (4.4)).
\0 0

Quite clearly, beams with end restraint between zero and
PL/8 (i.e., beams in between simple spans and complete fixity) will
exhibit behavior that is an interaction of these two effects. With
91
increasing end restraint, the bottom flange compressive stresses
increase and cause the bottom flange instability to dominate over
the web instability. Note that simultaneously the web becomes less
likely to buckle because of reduced bending stresses under the load.
An interaction equation is proposed to model this behavior. The
negative end moment, MN' is represented by the coefficient, ~,
defined by~= a(PL/8). A linear interaction is proposed between
PTFU for simply supported beams (Eq. (4.5)) and PBFU for fixed
ended beams (Eq. (5.3)). The buckling load for any a, PBFUa is
(6.1)
This equation is only suggested in the range from simply supported
beams up to complete fixity, and not beyond (i.e.,~~ 1). Table 6.2
shows the comparison between this equation and the BASP results
shown in Fig. 3.9. The results show reasonable correlation between
BASP results and the estimate of Eq. (6.1). They, however, reaffirm
that the equation should not be extrapolated beyond a= I. Problem 26
where a= 1.33 is conservatively but inaccurately modelled by Eq. (6.1)
with a 28 percent error.
6.3 Continuous Beams
Tests on continuous steel beams performed at the University 4 18 of Texas at Austin and reported by Bansal and Yura are now
examined. The estimate of the buckling loads given by BASP and
Eq. (6.1) will be compared to the test results.
The test set-up of the 20 ft. main span beams is described
in Chapter 1, and cases of both elastic and inelastic buckling were
reported with movement of the flange primarily in tension (Figs. 1.2
and 1.3). The results of the tests of four of the beams are shown
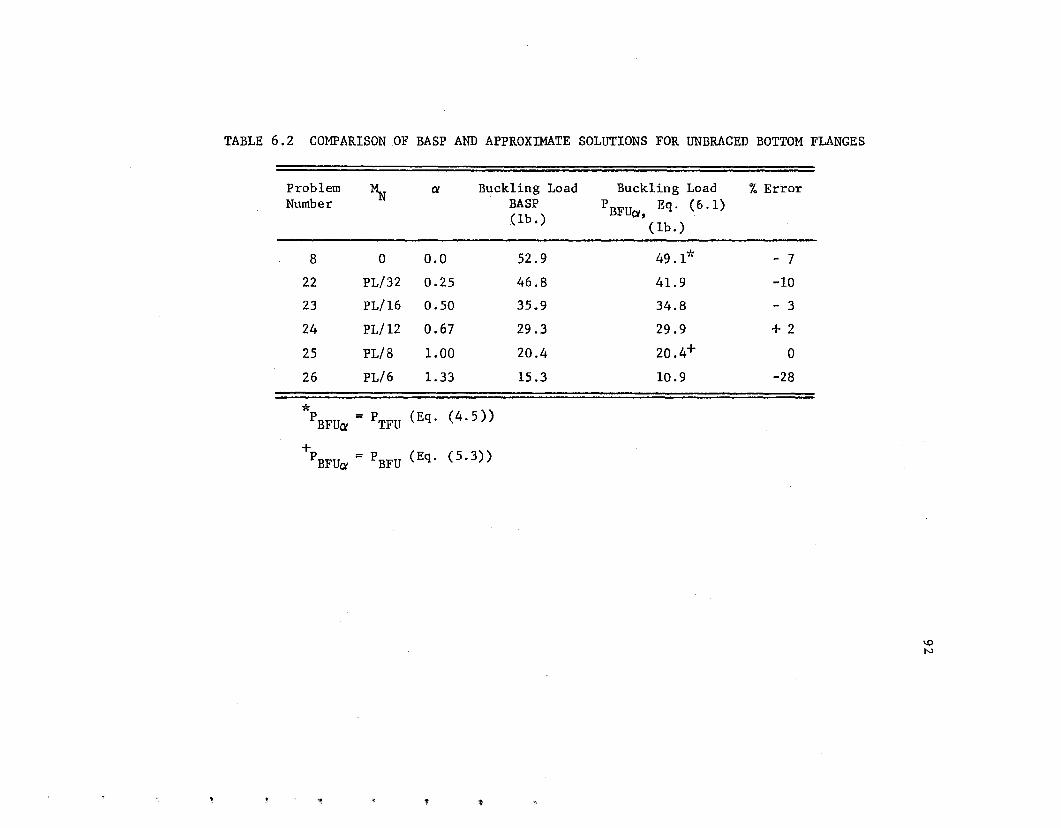
TABLE 6.2 COMPARISON OF BASP AND APPROXIMATE SOLUTIONS FOR UNBRACED BOTTOM FLANGES
Problem ~
Buckling Load Buckling Load % Error Number BASP p Eq. (6 .1)
(lb.) BFU~,
(lb.)
8 0 o.o 52.9 49.1* - 7
22 PL/32 0.25 46.8 41.9 -10
23 PL/16 0.50 35.9 34.8 - 3
24 PL/12 0.67 29.3 29.9 + 2
25 PL/8 1.00 20.4 20.4+ 0
26 PL/6 1.33 15.3 10.9 -28
* (Eq. (4.5)) PBFUot = PTFU
+ PBFU~ = PBFU (Eq. (5.3))
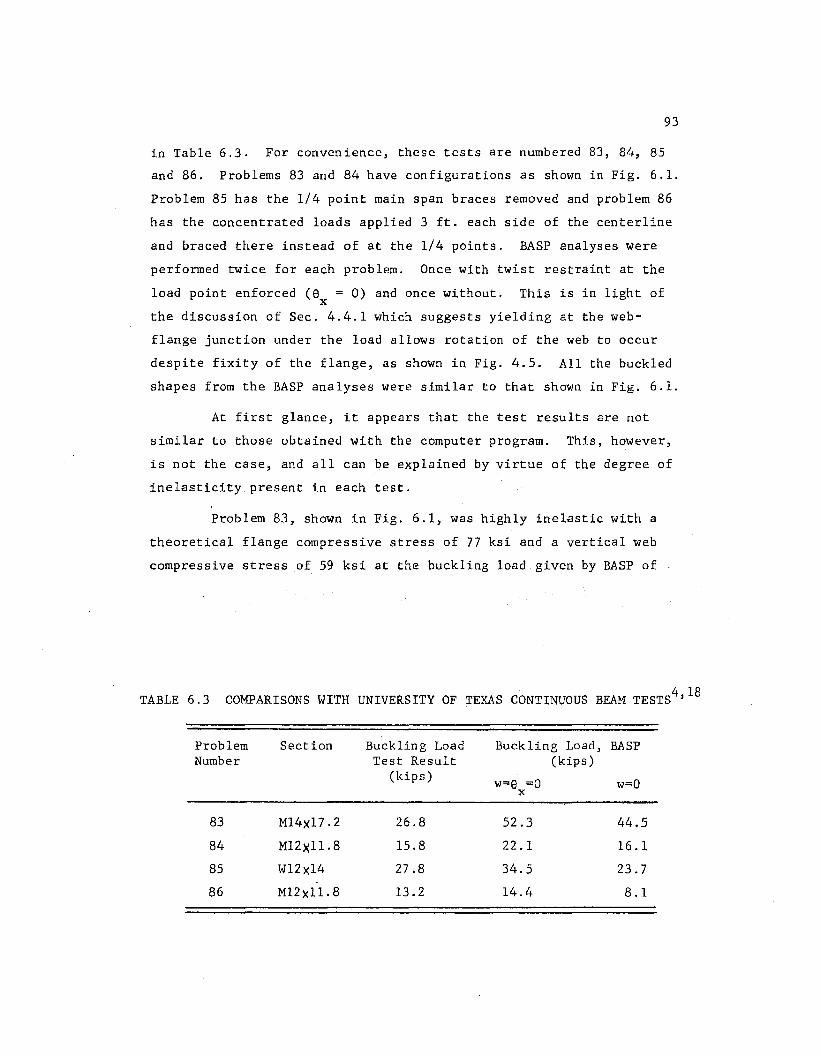
93
in Table 6.3. For convenience, these tests are numbered 83, 84, 85
and 86. Problems 83 and 84 have configurations as shown in Fig. 6.1.
Problem 85 has the 1/4 point main span braces removed and problem 86
has the concentrated loads applied 3 ft. each side of the centerline
and braced there instead of at the 1/4 points. BASP analyses were
performed twice for each problem. Once with twist restraint at the
load point enforced (9 = O) and once without. This is in light of X
the discussion of Sec. 4.4.1 which suggests yielding at the web-
flange junction under the load allows rotation of the web to occur
despite fixity of the flange, as shown in Fig. 4.5. All the buckled
shapes from the BASP analyses were similar to that shown in Fig. 6.1.
At first glance, it appears that the test results are not
similar to those obtained with the computer program. This, however,
is not the case, and all can be explained by virtue of the degree of
inelasticity.present in each test.
Problem 83, shown in Fig. 6.1, was highly inelastic with a
theoretical flange compressive stress of 77 ksi and a vertical web
compressive stress of 59 ksi at the buckling load given by BASP of
TABLE 6.3 COMPARISONS WITH UNIVERSITY OF TEXAS CONTINUOUS BEAM TESTS4 ' 18
Problem Section Buckling Load Buckling Load, BASP Number Test Result (kips)
(kips) w=e =0 X
w=O
83 Ml4x17.2 26.8 52.3 44.5
84 Ml2xll.8 15.8 22.1 16.1
85 Wl2xl4 27.8 34.5 23.7
86 Ml2xll.8 13.2 14.4 8.1
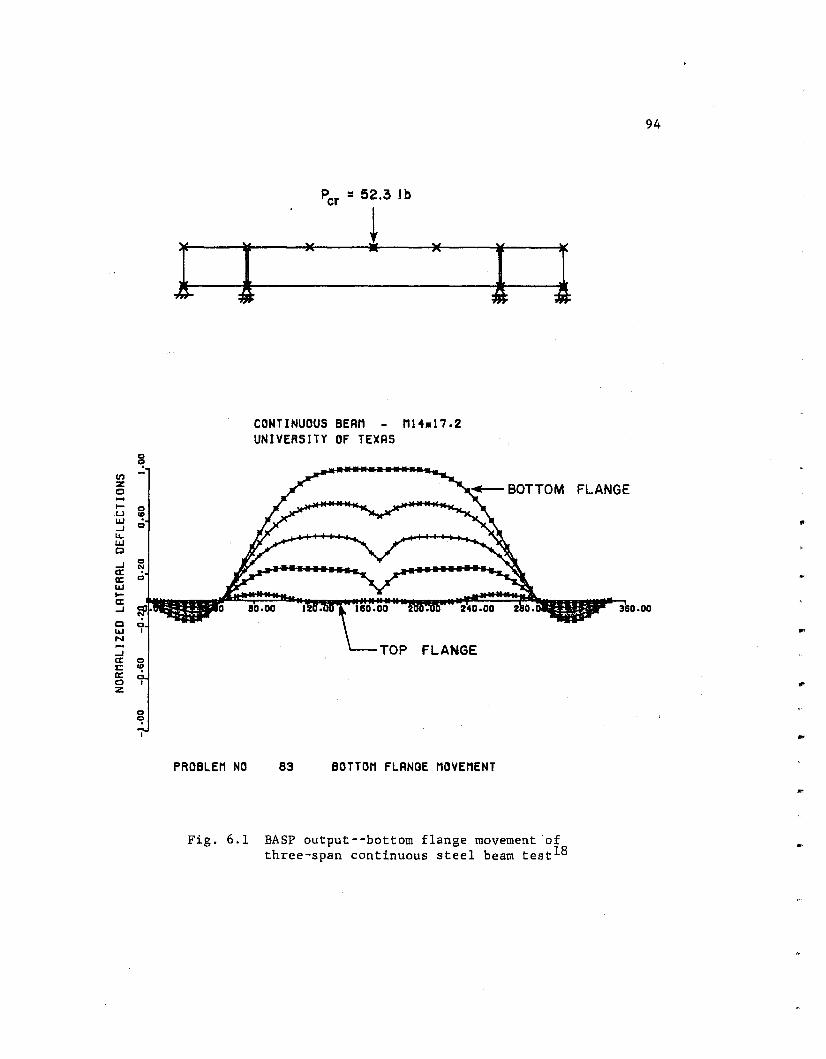
Per = 52.3 lb
1 1 )( i )(
1 1
CONTINUOUS BERM M14•17.2 UNIVERSITY OF TEXRS
VI
~ BOTTOM FLANGE -1-u
94
w • -' Ll.. w Q
-' a: a: w 1-a: -' .oo Q w ~
N
-' a: :1:: a: 0 z
PROBLEM NO
Fig. 6.1
TOP FLANGE
83 BOTTOM FLANGE MOVEMENT
BASP output--bottom flange movement of three-span continuous steel beam testl8
..
95
52.3 kips. The yield stress of the material was 38 ksi. Theoretically
yielding commenced at a load of only 25 kips and most certainly twist
restraint of the web at the load point was lost. In such a highly
inelastic problem, the elastic buckling program is grossly uncon
servative. However, the test result of 26.8 kips may also be low,
as a 0.25 in. sweep was noted, which is at the tolerance limit of
standard mill practice. 2
Test beam 84 had a yield stress of 38.5 ksi. At the BASP
buckling load for twist restraint removed, 16.1 kips, the flange
stress is 43 ksi, slightly greater than the measured yield point.
Hence, the BASP estimate should be valid; the comparison with the
test result of 15.8 kips is very favorable.
The load to buckle the beam of test 85 was midway between
the two BASP estimates. At the BASP estimate ~or the case w = 0,
the flange stress is 48 ksi whereas when w = ex = o, the flange
buckling stress is 72 ksi. The yield stress for this beam, 65 ksi,
is between these two values and so is the buckling load.
Finally, test beam 86, which is just over yield when buckling
occurs (39.6 ksi and 38.5 ksi for buckling stress and yield stress,
respectively) is accurately predicted by BASP with rotational restraint
enforced.
The buckling load PBFU~ given by Eq. (6.1) is compared to the
BASP result for problem 83 in Sec. 6.4 following
6.4 Design Example
The buckling load for the beam of Fig. 6.1 will be calculated
using the design recommendations presented in the previous sections.
The beam is an M14xl7.2 with a = 65 ksi. The central span is 20ft. y and the outside spans are 4 ft.- 6 in. Relevant data are
96
E = 29000 ksi b = 4.000 in. I = 149 in~
v = 0.3 tf = 0.272 in. 1.451 4.
If in.
t 0.231 in. w Af = 1.09 in?
d = 13.728 in.
h = 13.456 in.
In accordance with Eq. (6. 1) a, PTFU and PBFU must be determined.
From statics, L1 138 in. and ~ = 0.85
'From Eq. (4.4), PLOC = 98.2 kips
From Eq. (4.5), PTFU 0.8 X 98.2 78.6 kips
2
Also, p* 4TT Elf
28.83 kips = L2 =
a* p*
-- = 26.5 ksi - Af
k* 4p* =- = 0.481 k/in. L
From Eq. (5.2), k = 0.948 k/in.
From Fig. 5.5, = 54.7 ksi
... From Eq . ( 5 . 3) , PBFU = 39.6 kips
Thus, substituting a, PTFU' PBFU into Eq. (6.1),
Per = PBFUa = 0.85 X 39.6 + 0.15 X 78.6
45.5 kips
..
97
This is 13 percent on the conservative side of the BASP
estimate, 52.3 kips. Note that at P = 45.5 kips, the flange stress cr
is 67 ksi which is just above a y
= 65 ksi. The final estimate for
P would conservatively be taken as 45.5 x 65/67 = 44 kips. cr
beam would remain elastic up to this load.
The
C H A P T E R 7
SUMMARY AND CONCLUSIONS
A research program was carried out to study the phenomenon
of lateral movement of the bottom flange of W-shaped beams under
concentrated loading. The purpose of the study was to examine
this p~enomenon and determine whether or not the movement of this
flange, primarily in tension, significantly affects the strength of
the beam. Beams examined were simply supported or end restrained to
any degree in the plane. Laterally, the ends were free to warp.
The beams were loaded at midspan by a single concentr9ted load
applied on the top flange, which was braced at this point both
laterally and against twist. Plexiglass model beams were tested,
analytical studies were undertaken using an elastic finite element
linear-buckling program, and the results were compared to full-scale
tests performed by others. Design recommendations for the control
of this behavior were presented. It was discovered that the provi
sions in the AISC specification3 for local web buckling under a
concentrated load at midspan were unsatisfactory. Alternative
recommendations were given.
The results of the study are:
(1) When the bottom flange of either simply supported or
restrained beams is ··braced at the load point, then local web buckling
can occur. The bending stresses at the load point, as well as the
direct vertical stresses, heavily influence the buckling of the web
plate. The load at which local buckling occurs is given by Eq. (4.4)
for simply supported beams and Eq. (5.1) for restrained beams. The
current AISC specification assumes that bending stresses do not
98
affect the local web buckling load and may, at times, be grossly
unconservative.
99
(2) If the bottom flange of a simply supported beam is not
braced at the load point, movement of this flange may occur together
with a varying amount of local web distortion. Despite movement
of the flange, the phenomenon is still related to the local web
instability. The tension flange movement reduces the web buckling
load by 20 percent (Eq. (4.5)), and hence, the costly addition of a
brace may be unwarranted. However, with the bottom flange braced,
significant post-buckling strength could be expected if the beam
remained elastic, whereas, if the bottom flange were unbraced, none
could be relied upon. This observation could be the subject of a
future study.
(3) When the bottom flange of a fixed ended beam is unbraced
under the load, its movement may be pronounced with little hint of
local web distortion. The cause of this bottom flange movement is
different than that in a simply supported beam. The end fixity
induces compression in the bottom flange between the supports and
the 1/4-points. The flange itself, peing unbraced, triggers the beam
buckling at loads considerably lower than those at which buckling
occurs when the bottom flange is braced. Equations (5.2), (5.3),
and Fig. 5.5 present some guidelines for calculation of this load.
The addition of a brace on the bottom flange under the load may
definitely prove worthwhile.
(4) If the beam is continuous, or has any degree of end
restraint between zero and complete fixity, the interaction
equation (6.1) can be used when the bottom flange is unbraced.
In this case, the phenomenon is an interaction between web buckling
and compression buckling of the bottom flange.
(5) Slender webbed beams with end restraint must also be
checked for local web buckling.
100
(6) Beams with significant initial lateral deflection (sweep)
displayed movement of the bottom flange at loads considerably lower
than those without this sweep. It is important to keep within
tolerance levels set by AISC, and to use a larger factor of safety
to guard against this stability-related phenomenon.
(7) If yielding of the beam at the web-flange junction occurs,
the twist restraint at this point can be lost, as a plastic hinge
is formed. In this case, significantly lower buckling loads can
be expected. Generally speaking, slender webs remain elastic at
buckling, whereas stocky webs become inelastic under the load and
should be examined carefully. Inelastic buckling may also be the
subject of future research.
A P P E N D I X I
BASLER THEORY
101
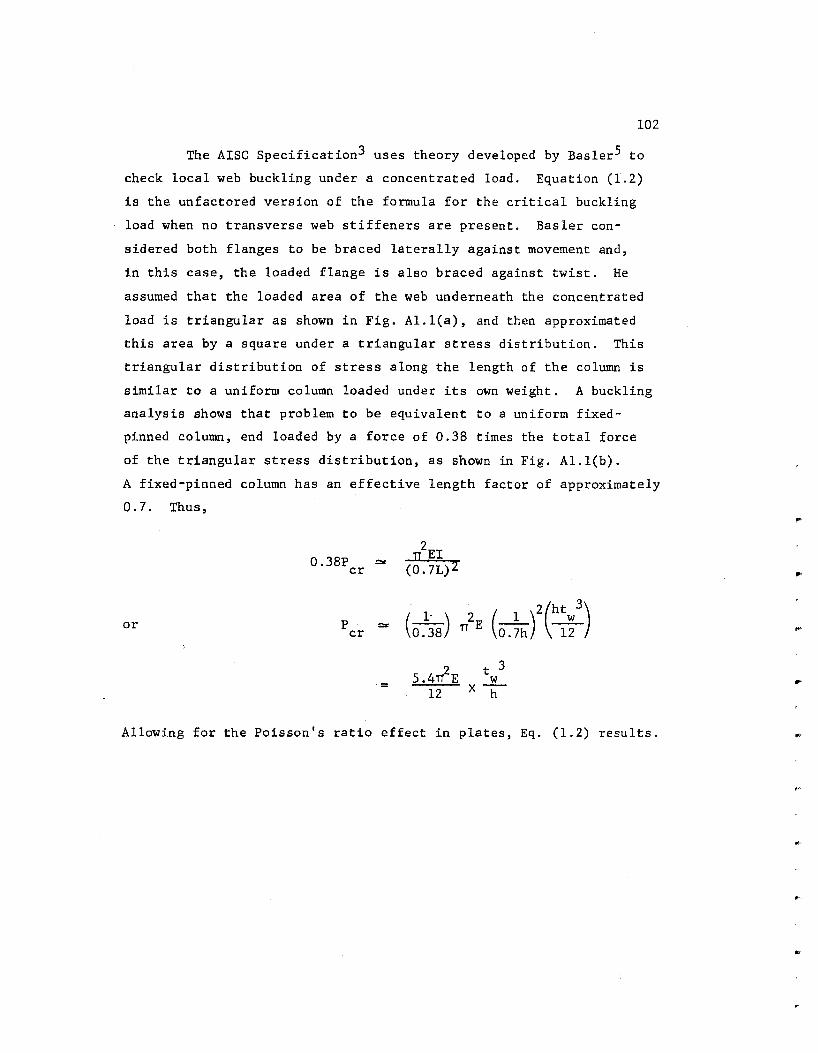
102
The AISC Specification3 uses theory developed by BaslerS to
check local web buckling under a concentrated load. Equation (1.2)
is the unfactored version of the formula for the critical buckling
load when no transverse web stiffeners are present. Basler con
sidered both flanges to be braced laterally against movement and,
in this case, the loaded flange is also braced against twist. He
assumed that the loaded area of the web underneath the concentrated
load is triangular as shown in Fig. Al.l(a), and then approximated
this area by a square under a triangular stress distribution. This
triangular distribution of stress along the length of the column is
similar to a uniform column loaded under its own weight. A buckling
analysis shows that problem to be equivalent to a uniform fixed
pinned column, end loaded by a force of 0.38 times the total force
of the triangular stress distribution, as shown in Fig. Al.l(b).
A fixed-pinned column has an effective length factor of approximately
0.7. Thus,
0.38P ""' II2EI
cr (0. 71)2
1· 2 ( 1 /(htw3
) or p = (0.38) TT E 0.7h 12 cr
5 .4,1E t 3
= -lL 12 X h
Allowing for the Poisson's ratio effect in plates, Eq. (1.2) results.
..
..
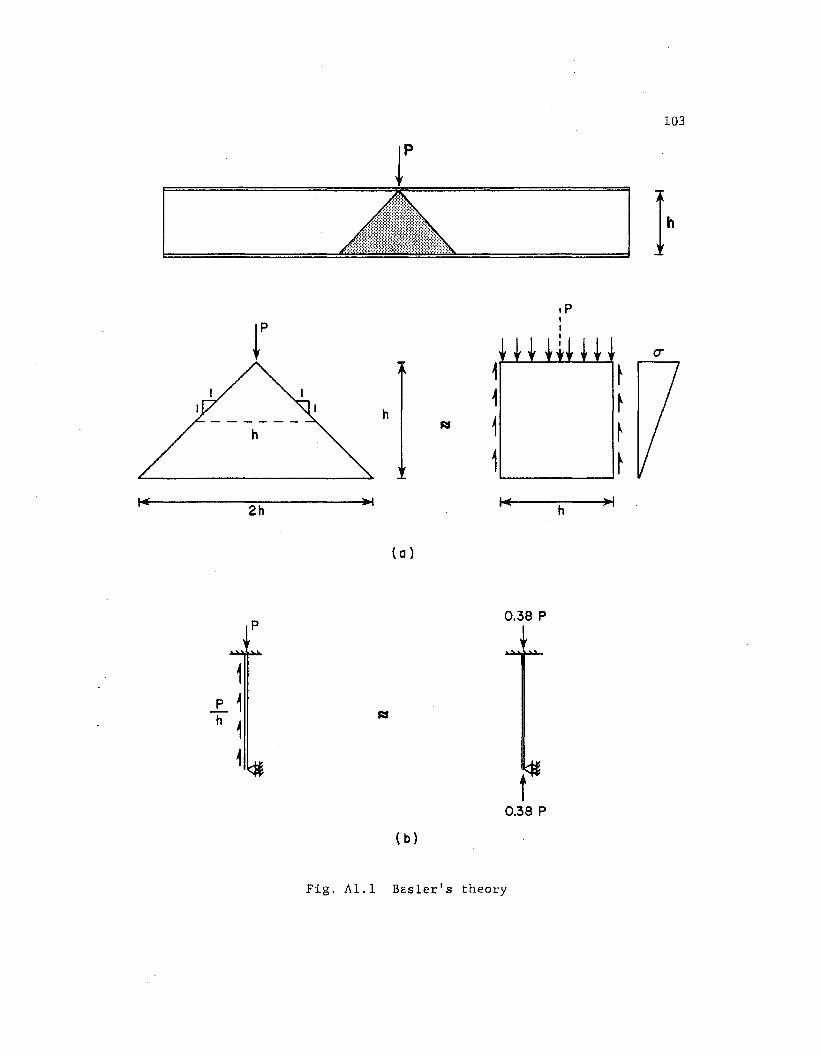
1 p 1 h ~
i
tp
2h
p
p
~
~ h
1 1
1..:
(a)
t 0.38 p
(b)
Fig. Al.l Basler 1 s theory
103
.p
CT
~
~
~
~
h Jol
A P P E N D I X II
YURA THEORY
.,.
...
104
..
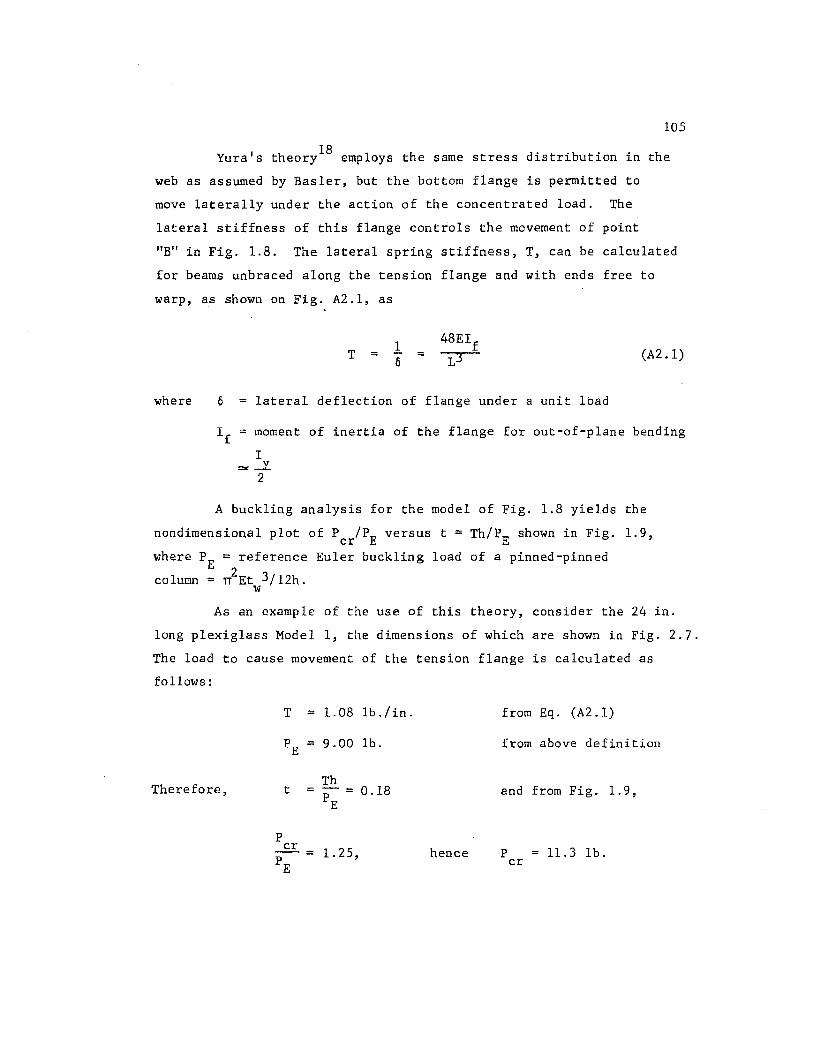
105
18 Yura's theory employs the same stress distribution in the
web as assumed by Basler, but the bottom flange is permitted to
move laterally under the action of the concentrated load. The
lateral stiffness of this flange controls the movement of point
"B" in Fig. 1.8. The lateral spring stiffness, T, can be calculated
for beams unbraced along the tension flange and with ends free to
warp, as shown on Fig. A2.1, as
where
T = l 6 =
lateral deflection of flange under a unit load
(A2 .1)
If moment of inertia of the flange for out-of-plane bending
I .,.._y
2
A buckling analysis for the model of Fig. 1.8 yields the
nondimensional plot of Pcr/PE versus t = Th/PE shown in Fig. 1.9,
where PE = reference Euler buckling load of a pinned-pinned
column = rr2Et 3jl2h. w
As an example of the use of this theory, consider the 24 in.
long plexiglass Model 1, the dimensions of which are shown in Fig. 2.7.
The load to cause movement of the tension flange is calculated as
follows:
T = 1.08 lb./in. from Eq. (A2 .1)
PE = 9.00 lb. from above definition
Therefore, Th
t PE
- 0.18 and from Fig. 1.9,
p cr
1.25, hence -- = PE
p 11.3 lb. cr
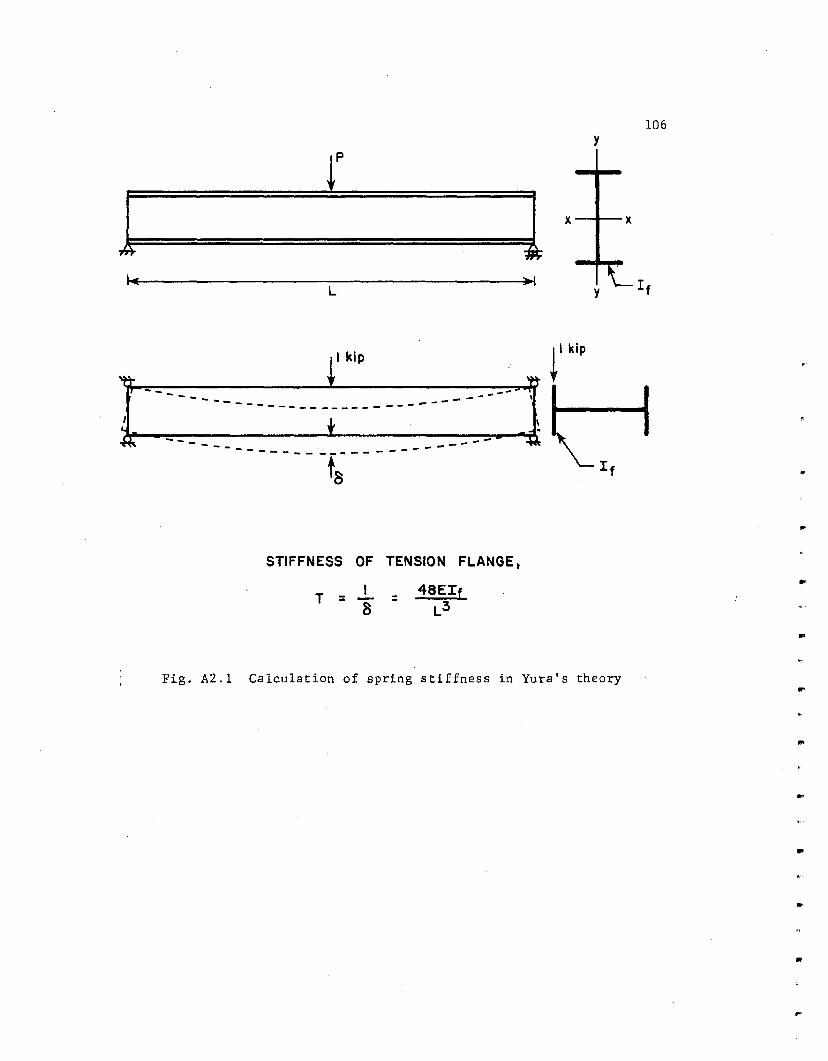
L
I kip
.. -- ... --------------------------------- --- --------------------
ta
STIFFNESS OF TENSION FLANGE,
T = I 8
=
y
X X
r kip
Fig. A2.1 Calculation of spring stiffness in Yura's theory
106
..
..
..
..
..
•
"'
"'
..
A P P E N D I X 3
LATERAL-TORSIONAL BUCKLING EXAMPLES
107
108
As examples of the use of Eq. (1.1) consider the plexiglass
Model 1 (Fig. 2.7), simply supported over a 24 in. span and braced
in the two configurations of Fig. 2.6.
First consider configuration 1 where the compression flange
is braced at midspan and at the supports. The unbraced length, ~'
16 is 12 in. The buckling coefficient, c1, is 1.83 for this problem.
Use of Eq. (1.1) yields M = 77.2 lb.-in. and hence, P = 12.9 lb. cr cr
The calculation of P for Configuration 2 (1/4-point cr compression flange bracing) can -be conservatively estimated using
L = 6 in. and c1
1.32 since in the critical central quarter-spans,
the moment ratio M /M1 = -0.5, as shown in Figs. A3.l(a) and (b).16
sm a This yields M = 188 lb.-in. and hence, P 31.4 lb. This is
cr cr lower than the value of 35.2 lb. given by BASP (Fig. 2.11).
A better estimate, however, can be made using an effective
unbraced length in Eq. (1.1). When the central quarter spans, BC
and CD, shown'in Fig. A3.l(b) try to buckle, the outside quarter
spans, AB and DE, are not on the verge of buckling because of
reduced stresses in these regions. The outside spans can offer
restraint to the central buckling portions. For the whole beam to
buckle, however, all portions must be on the verge of buckling and
so P is greater than the conservative estimate of 31.4 lb. given cr above.
The effective unbraced length can be estimated by the
following alignment chart procedure, in which the beam is treated
as a continuous column.l9
M In BC, CD sm --= -0.5
In AB, DE 0
..
...
..
..
..
..
...
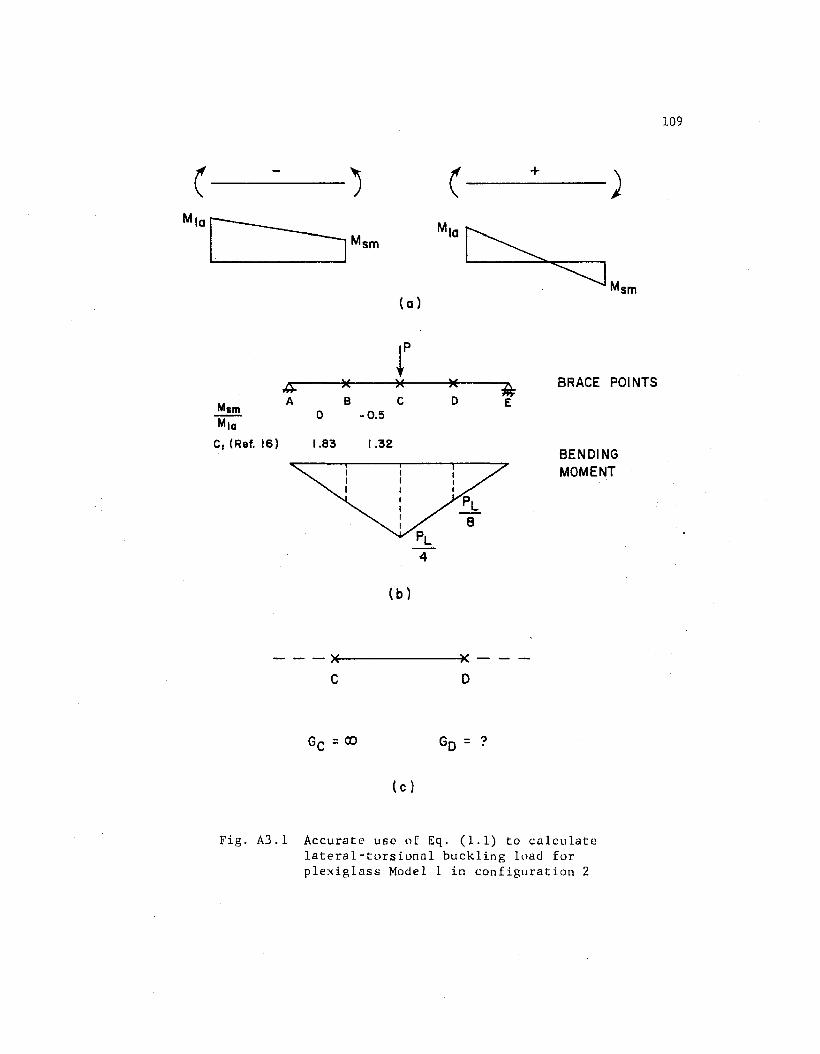
(--) M1aL=-:J
Msm
{a)
r A. )( )(
Mam A B c
Mia D -0.5
C1 (Ref. 16) 1.83 1.32
{b)
(-+-)
Mia~
~ · Msm
)(
D
BRACE POl NTS
BENDING MOMENT
-~~--------------~~---
c 0
Gc =co = ?
(c)
Fig. A3.1 Accurate use of Eq. (1.1) to calculate lateral-torsional buckling lllad for plexiglass Model 1 in configuration 2
109
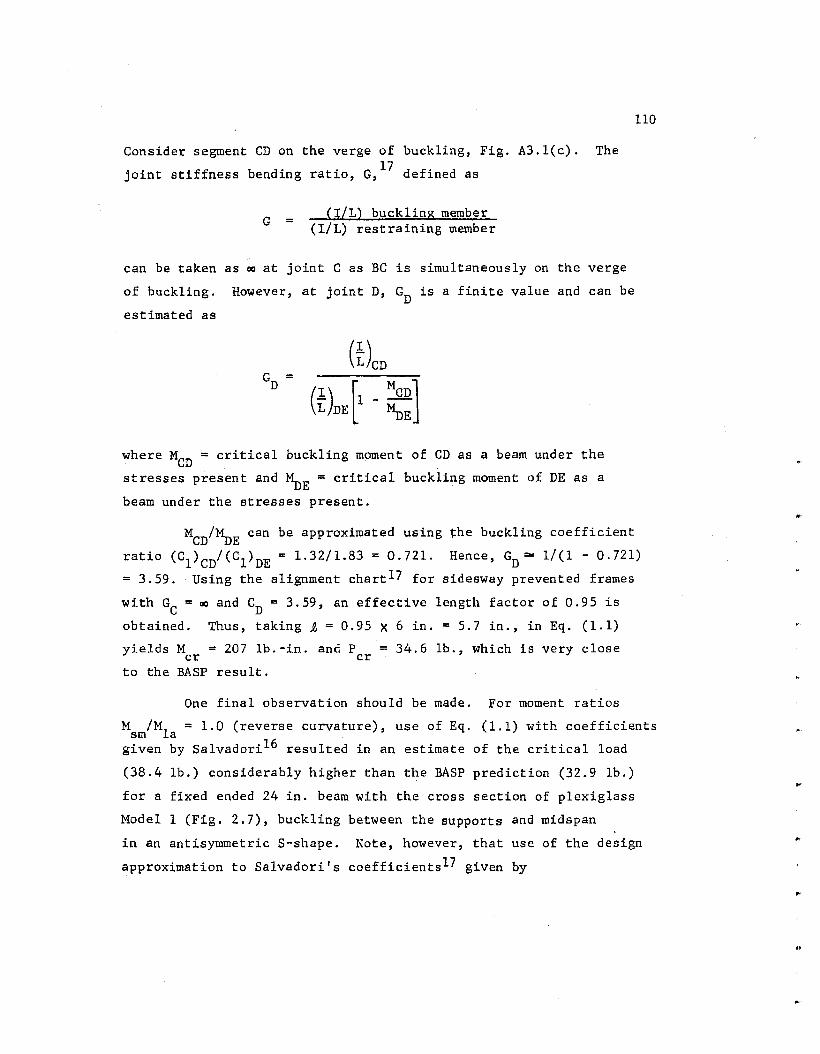
Consider segment CD on the verge of buckling, Fig. A3.l(c). The
joint stiffness bending ratio, G,17
defined as
G = (I/L) buckling member (I/L) restraining member
can be taken as ~ at joint C as BC is simultaneously on the verge
of buckling. However, at joint D, GD is a finite value and can be
estimated as
(r) [ Men] L DE
1 - ~E
where MCD = critical buckling moment of CD as a beam under the
stresses present and ~E = critical buckling moment of DE as a
beam under the stresses present.
110
MCD/~E can be approximated using the buckling coefficient
ratio (Cl)CD/(Cl)DE = 1.32/1.83 = 0.721. Hence, GD~ 1/(1- 0.721)
= 3.59. Using the alignment chartl7 for sidesway prevented frames
with Gc = IXl and CD = 3. 59' an effective length factor of 0.95 is
obtained. Thus, taking ;., == 0.95 X 6 in. = 5.7 in., in Eq. ( 1.1)
yields M = 207 lb.-in. and p = 34.6 lb.' which is very close cr cr
to the BASP result.
One final observation should be made. For moment ratios
M /M1
= 1.0 (reverse curvature), use of Eq. (1.1) with coefficients sm a given by Salvadori16 resulted in an estimate of the critical load
(38.4 lb.) considerably higher than the BASP prediction (32.9 lb.)
for a fixed ended 24 in. beam with the cross section of plexiglass
Model 1 (Fig. 2.7), buckling between the supports and midspan
in an antisymmetric S-shape. Note, however, that use of the design
approximation to Salvadori's coefficientsl7 given by
..
..
..
lll
= 1.75 + 1.05~~:) + 0.3(:~:)2
~ 2.3 (A3.l)
results in an accurate estimate of the buckling load (32.4 lb.). At
other moment ratios considered in this study, Salvadori's coefficients
resulted in accurate predictions of P . Further investigation needs cr
to be done to establish the extent of the inaccuracies.
A P P E N D I X 4
RESULTS OF PARAMETRIC STUDY
112
The parametric study presented in Chapter 3 involved the
BASP analyses of 64 problems, designated as problems 6 through 69.
The standard beam dimensions were those of plexiglass Model 1
(Fig. 2.7) over a 24 in. simple span, but for each problem one
of more parameters were varied. The bracing configuration was
that of Fig. 3.3 with the tension flange either braced or unbraced
at location A. The results are shown in Table A4.1.
113
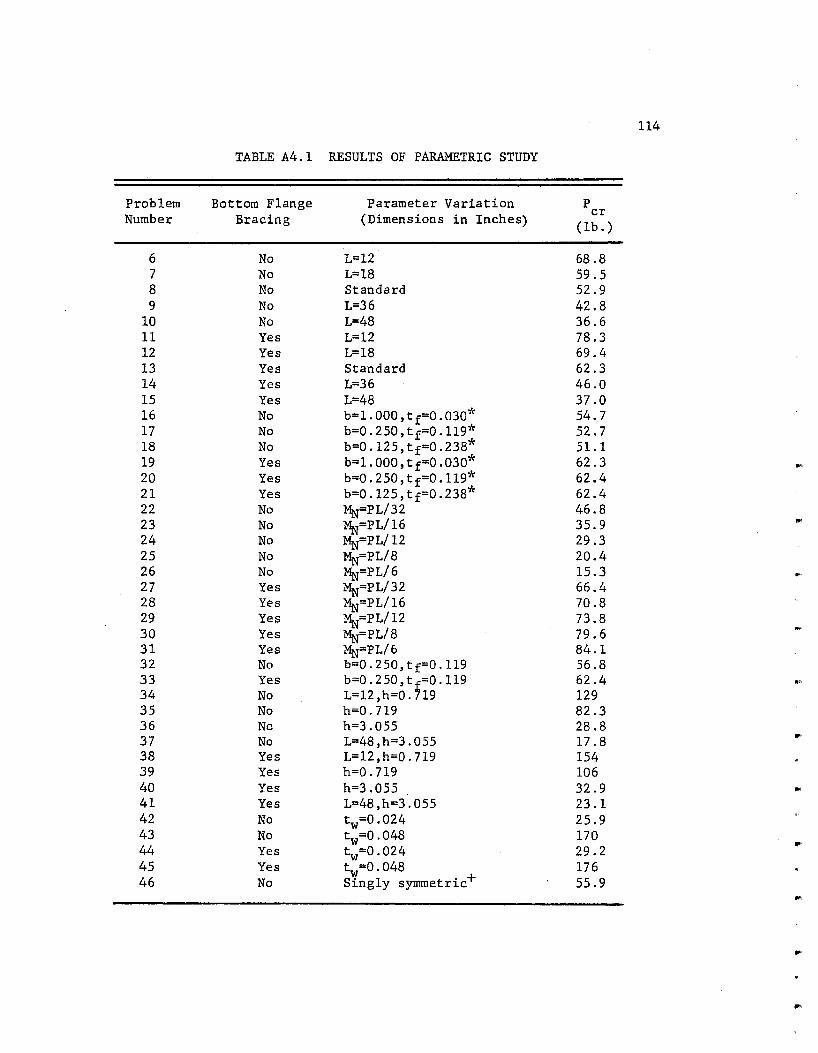
114
TABLE A4.1 RESULTS OF PARAMETRIC STUDY
Problem Bottom Flange Parameter Variation p
Number Bracing (Dimensions in Inches) cr
(lb.)
6 No L=l2 68.8 7 No L=l8 59.5 8 No Standard 52.9 9 No L=36 42.8
10 No L=48 36.6 11 Yes L=l2 78.3 12 Yes L=l8 69.4 13 Yes Standard 62.3 14 Yes L=36 46.0 15 Yes L=48 37.0 16 No b=l.OOO,tf=0.030* 54.7 17 No b=0.250,tf=O.ll9* 52.7 18 No b=O.l25,tf=0.238* 51.1 19 Yes b=l.OOO,tf=0.030* 62.3 .. , 20 Yes b=0.250,tf=O.l19* 62.4 21 Yes b=0.125,tf=0.238* 62.4 22 No MN=PL/32 46.8 23 No ~=PL/16 35.9 ... 24 No MN=PL/12 29.3 25 No MN=PL/8 20.4 26 No MN=PL/6 15.3 ... 27 Yes MN=PL/32 66.4 28 Yes MN=PL/16 70.8 29 Yes ~=PL/12 73.8 30 Yes MN=PL/8 79.6 "" 31 Yes ~=PL/6 84.1 32 No b=O. 250, tf=O. 119 56.8 33 Yes b=O . 2 50, t ro . 119 62.4 .. 34 No L=l2,h=O. 19 129 35 No h=0.719 82.3 36 No h=3.0.S5 28.8 37 No L=48,h=3.055 17.8
.. 38 Yes L=12,h=0.719 154 39 Yes h=0.719 106 40 Yes h=3.055 32.9 .. 41 Yes L=48,h=3.055 23.1 42 No tw=0.024 25.9 43 No tw=0.048 170 .. 44 Yes tw=0.024 29.2 45 Yes tw=0.048 176 46 No Singly symmetric+ 55.9 ..
..
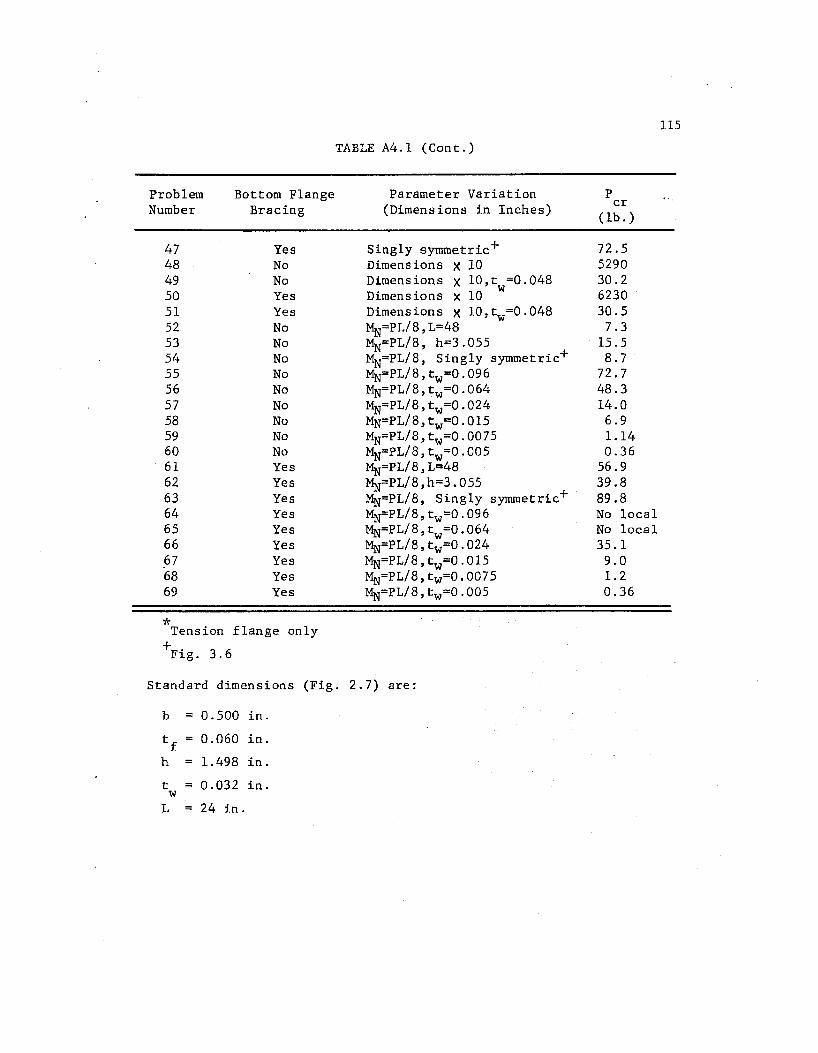
Problem Number
47 48 49 so 51 52 53 54 55 56 57 58 59 60 61 62 63 64 65 66 67 68 69
~~
Bottom Flange Bracing
Yes No No Yes Yes No No No No No No No No No Yes Yes Yes Yes Yes Yes Yes Yes Yes
Tension flange only
+F. 3 6 ~g. .
TABLE A4.1 (Cont.)
Parameter Variation (Dimensions in Inches)
Singly symmetric+ Dimensions X 10 Dimensions x lO,t =0.048 Dimensions x 10 w Dimensions X 10,tw=0.048 MN=PL/8,L=48 MN=PL/8, h=3.055 MN=PL/8, Singly symmetric+ MN=PL/8,tw=0.096 MN=PL/8,tw=0.064 MN=PL/8,tw=0.024 MN=PL/8,tw=O.Ol5 MN=PL/8,tw=0.0075 MN=PL/8,tw=0.005 MN=PL/8,1=48 MN=PL/8,h=3.055 MN=PL/8, Singly symmetric+ MN=PL/8,tw=0.096 MN=PL/8,tw=0.064 MN=PL/8,tw=0.024 MN=PL/8,tw=O.Ol5 MN=PL/8,tw=0.0075 MN=PL/8,tw=0.005
Standard dimensions (Fig. 2.7) are:
b = 0.500 in.
tf 0.060 in.
h 1.498 in.
t = 0.032 in. w L 24 in.
p cr
(lb.)
72.5 5290 30.2 6230 30.5 7.3
15.5 8.7
72.7 48.3 14.0 6.9 1.14 0.36
56.9 39.8 89.8 No local No local 35.1 9.0 1.2 0.36
115
B I B L I 0 G R A P H Y
1. Akay, H. U., Johnson, C. P., and Will, K. M., "Lateral and Local Buckling of Beams and Frames," Journal of the Structural Division, ASCE, Vol. 103, No. ST9, Proc. Paper 13226, Sept. 1977, pp. 1821-1832.
2. American Institute of Steel Construction, Manual of Steel Construction, 8th ed., Chicago, Illinois, 1980.
3. American Institute of Steel Construction, Specification for the Design, Fabrication and Erection of Structural Steel for Buildings, Chicago, Illinois, 1978.
4. Bansal, J. P., "The Lateral Instability of Continuous Steel Beams," unpublished Ph.D. dissertation, The University of Texas at Austin, Austin, Texas, 1971.
5. Basler, K., "New Provisions for Plate Girder Design," Appendix C, 1961 Proceedings, AISC National Engineering Conference, pp. 65-74.
6. Bathe, K., Wilson, E. L., and Peterson, F. E., "SAP IV: A Structural Analysis Program for Static and Dynamic Response of Linear Systems," Earthquake Engineering Research Center, University of California, Berkeley, California, Report No. EERC 73-11, June 1973, Revised April, 1974.
7. Bergfelt, A., and Hb'vik, J., "Thin-Walled Deep Plate Girders under Static Loads," IABSE, 8th Congress, New York, 1968, pp. 465-478. -----
8. Blodgett, 0. W., Design of Welded Structures, The James F. Lincoln Arc Welding Foundation, Cleveland, Ohio, July 1976.
9. Clark, J. W., and Hill, H. N., "Lateral Buckling of Beams and Girders," Trans. ASCE, Vol. 127, Part II, 1962, pp. 180-201.
10. Column Research Committee of Japan, Handbook of Structural Stability, Corona Publishing Company, Ltd., Tokyo, Japan, 1971.
11. Daniels, J. H., and Fisher, J. W., "Static Behavior of Composite Beams with Variable Load Position, 11 Fritz Engineering Laboratory Report No. 324.3, Lehigh University, Bethlehem, Pennsylvania, March 1967.
116
117
12. Hendry, A. W., Elements of Experimental Stress Analysis, SI Ed., Pergamon Press Ltd., Oxford, England, 1977.
13. Johnson, C. P., "Lateral Buckling of Rigid Frames by Finite Element Procedure," CESM Report, No. 72-1, Department of Civil Engineering, The University of Texas at Austin, Austin, Texas, January 1972.
14. Johnson, C. P., and Will, K. M., "Beam Buckling by Finite Element Procedure," Journal of the Structural Division, ASCE, Vol. 100, No. ST3~ Proc Paper 10432, March 1974, pp. 669-685.
15. Lyse, I., and Godfrey, H. J., "Investigation of Web Buckling in Steel Beams," Trans., ASCE Vol. 100, Paper No. 1907, discussion by Lyse, I., and Godfrey, H. J., 1935, pp. 675-706.
16. Salvadori, M. G., "Lateral Buckling of Eccentrically Loaded I-Columns," Trans., ASCE, Vol. 121, 1956, pp. 1163,.;ll78.
17. Structural Stability Research Council, Guide to Stability Design Criteria for Metal Structures, 3rd ed., John W1ley and Sons, Inc., New York, 1976.
18. Yura, J. A., "Web Behavior of Concentrated Loads in Steel Beams," presented at the Annual Meeting of the Column Research Council, March 24-25, 1970, St. Louis, Missouri.
19. Standards Association of Australia, SAA Steel Structures Code, Metric Units, AS1250-1975, Sydney, Australia, 1975.
...
...
..
..