Embed Size (px)
Citation preview
CBN Journal of Applied Statistics Vol. 5 No.2 (December, 2014) 95
The Balance Sheet Channel of Monetary Policy Transmission:
Evidence from Nigeria1
2 Olorunsola E. Olowofeso, Abiodun S. Bada, Kufre J. Bassey and
Kumafan S. Dzaan
This paper assesses the existence of a balance sheet channel of monetary
policy transmission in Nigeria by examining whether variation in the official
interest rate, with respect to the 2007- 2008 global financial crisis, feeds
through to the deposit money banks (DMBs) balance sheets, and ultimately
reflects in output and prices. Using quarterly macroeconomic data and stock
from 2002 to 2012, the study employs an ordinary least squares (OLS) and
autoregressive (VAR) framework to investigate the linkages between policy,
DMB balance sheet, output and price. The results reveal the existence of a
balance sheet channel in Nigeria with a significant impact of DMBs balance
sheet composition on output growth and price. However, output and price did
not react homogeneously to changes in monetary policy variations due to the
global financial crisis.
Keywords: Balance sheets Channel; Deposit Money Bank; Financial Crisis;
Monetary Policy; Output; Price
JEL Classification: E31, E44, E52, E58
1.0 Introduction
Balance sheet channel defines the role and the financial position of a
commercial bank in the transmission mechanism of monetary policy. It arises
as official interest rates generate variations in capital and interest income
which have an effect on micro and aggregate expenditure, output and prices of
economic mediators, given that they affect the balance sheet items of the
accounts of commercial banks directly (Boivin et al., 2010).
According to Bacchetta and Ballabriga (2000), there are at least three
proposed views of the role of banks in monetary transmission. First is the
standard money view, where bank loans have no special role: here, monetary
shocks affect output through changes in monetary aggregates. The second
view is the narrow credit channel or the bank lending channel, where
1 The views expressed in this paper are that of the authors and do not reflect the position of the Central
Bank of Nigeria. 2 Statistics Department, Central Bank of Nigeria, Abuja. Emails: [email protected];
[email protected]; [email protected]; and [email protected].

96 The Balance Sheet Channel of Monetary Policy Transmission:
Evidence from Nigeria Olowofeso et al.
monetary policy changes directly affect bank‟s balance sheet with reduction in
bank loans, which in turn affect output: – here, output changes are directly
caused by changes in bank loans. And the third view is the broad credit
channel or the balance sheet channel: here, monetary policy affects interest
rates and output in a way similar to the money channel or influences output
via a different channel.
In Nigeria, DMBs always show greater sensitivity during periods of tight or
loosed monetary policy with greater effect on those that are potentially
financially-constrained. Hence, based on the balance sheet theory3, where the
status of balance sheets affects the economy‟s response to monetary and other
shocks (Melander, 2009; Kashyap and Stein, 1994), the study builds on the
assumption that aggregate DMBs‟ balance sheet variables change with policy
rate, and also reflects on output and prices. Focus is on examining how
variation in the official interest rate, feeds through to the DMBs balance
sheets, and ultimately reflects in output and prices, with specific recourse to
the 2007- 2008 global financial crisis. The results of this expedition are
expected to enunciate on the possible existence or otherwise of a balance sheet
channel of monetary policy transmission in Nigeria.
The rest of the paper is so structured that the second section described the
evolution and characteristics of monetary policy and DMBs balance sheet to
the global financial crisis. The third section presents the literature review on
DMBs response and other related studies on the balance sheet channel.
Section four presents the study methodology, while the fifth section presents
the results of the investigations. The concluding remarks and policy
implication are given in section six with valid references of similar studies.
2.0 Stylized Fact on Monetary Policy and DMBs Balance Sheet in
Nigeria
It is argued that a change in official interest rates may either weaken or
strengthen bank‟s balance sheet, reflect in aggregate demand and, ultimately,
in output and prices(Allen et al. 2002). It is also anticipated that financial
crisis occurs when there is a plunge in demand for financial assets4. In
3 An economy‟s resilience to a range of shocks, including financial shocks, hinges in part on
the composition of the country‟s stock of liabilities and assets (see Allens et al., 2002).
4 The deterioration of Financial Institutions‟ Balance Sheets was one of the major causes of
the financial crisis (Soludo, 2009). If the state of banks‟ balance sheets is compromised, the
CBN Journal of Applied Statistics Vol. 5 No.2 (December, 2014) 97
Nigeria, DMBs are generally known to play a major role in the financial
markets activities as they are well positioned to engage in information-
producing activities which produce productive investments for the economy.
Howbeit, they are also influenced by the adjustment of the Central Bank of
Nigeria‟s (CBN) target for a short-term nominal interest rate. This influence
does reflect not only in the volume of the DMBs‟ activities but also in the
composition of their assets and liabilities5.
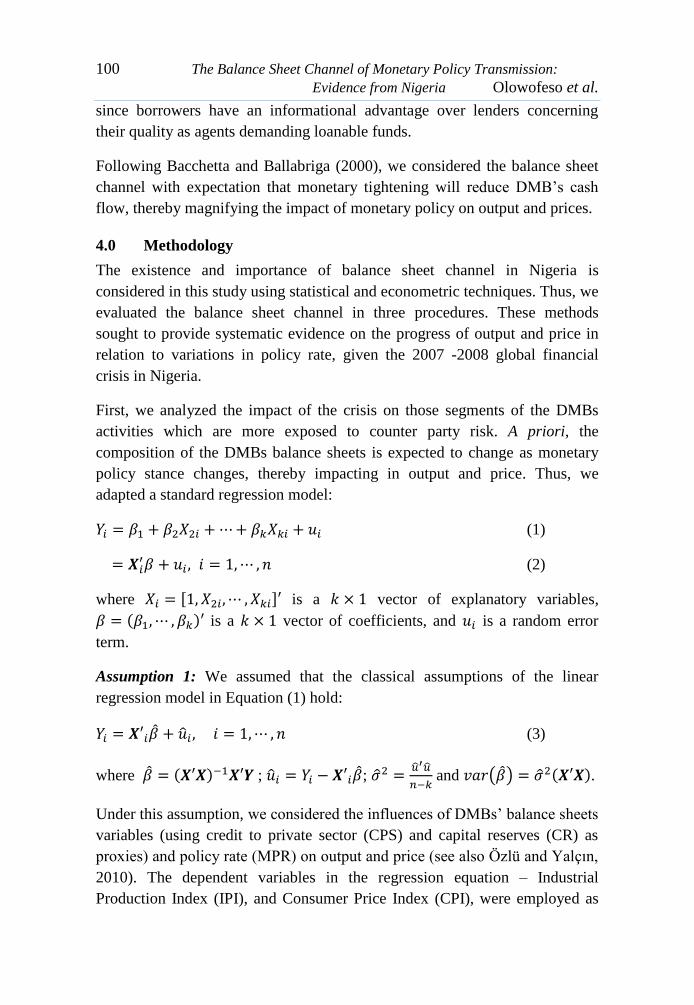
Figure 1: DMBs Balance Sheet Characteristics before, during and after the Crisis
Source: Central Bank of Nigeria Statistical Bulletin.
(Note: Balance sheets positions is proxied by both credit to private sector (CPS) and capital reserve
(CR) from 2002 – 2006; 2007 – 2009 and 2010 – 2012)
Thus, during the global financial crisis that started in 2007, there was
widespread credit contraction, causing financial institutions in various
countries to tighten their credit standards in light of deteriorating balance
sheets at the first quarter of 2008 and by the fourth quarter of 2008, the spilled
balance sheets are likely to suffer substantial contractions in their capital. These would
therefore lead to decline in lending, and consequently result in a decline in investment
spending, thereby slowing down economic activity
(http://www.slidefinder.net/F/Financial_Crises/5965800).
5 Banks might not lend out to private sector even if they have a good risk, thereby resulting in
a drop in cash flow. Hence, adverse selection and moral hazard problems may become more
severe, impacting lending, investment, and overall economic activity.
0
4,000
8,000
12,000
16,000
02 03 04 05 06 07 08 09 10 11 12
CPS
0
400
800
1,200
1,600
2,000
02 03 04 05 06 07 08 09 10 11 12
CR

98 The Balance Sheet Channel of Monetary Policy Transmission:
Evidence from Nigeria Olowofeso et al.
over effect spread into consumer and other credits (Sanusi, 2010). Albeit, it
could be seen from Figure 1 that there was rather a positive influence on the
DMBs lending where credit to private sector (CPS) expanded though with a
gradual contraction in the capital reserve (CR) from the first quarter of 2009
up to the fourth quarter. These were not unconnected with the cuts in interest
rate and injections of liquidity as some of the varying measures taken by the
Nigerian Central Bank to restore liquidity, as well as the fiscal stimulus
packages that stimulated aggregate demand (see, for example, Soludo, 2009).
3.0 Review of Literature
In the aftermath of the 2007 financial crisis, Ajakaiye and Fakiyesi (2009)
reported that the gravity and depth of the crisis in the banking sector were not
fully certified by citing some indicators as evidence. The cited indicators
include bank lending that witnessed growth of about 60.9%, indicating that
Nigerian banks were doing well in the face of the crisis. But Olowe (2011)
rejected the hypothesis of asymmetry and leverage effect after investigated the
volatility of interbank call rates in Nigeria.
Aliyu (2012) reported that the Nigeria‟s stock market reacted to the monetary
policy shocks over the period January, 2007 to August, 2011, showing a
destabilizing effect on Nigerian stock exchange‟s returns through an
unanticipated component of policy innovations on broad money (M2) and
monetary policy rate (MPR).
Atuanya and Obodo (2012) reported also that Nigeria was facing complex
bank lending crisis and went further to expressed the claim by financial
analysts that Nigerian banks aversion to lending to the real sector was a
complex problem with no easy solutions, and that finding a way for DMBs to
lend innovatively to Nigerian businesses had become a hard nut to crack.
Perhaps the lending increased during the crisis and dropped afterwards due to
CBN intervention, but whether or not it reflected on output and prices was still
an opened problem.
There are several other empirical studies that have investigated bank- and
firm-balance sheet channels independently and in combination. See, for
example, Bernanke and Blinder (1992), Kashyap and Stein (2000), Kishan
and Opiela (2000), Jayaratne and Morgan (2000), Ashcraft (2006), Gan
(2007), Khwaja and Mian (2008), Black et al. (2009), Chaney et al. (2009),
among others, on the bank; Gertler and Gilchrist (1994) and Bernanke et al.
CBN Journal of Applied Statistics Vol. 5 No.2 (December, 2014) 99
(1996), among others, on the firm side, as well as Jiménez et al.(2011) on
both.
Some of these studies approached the issue by looking at the relationship
between money and output, and bank loans and output either through
correlations or Granger-causality tests (King, 1986 and Ramey, 1994), or by
examining the role of bank loans using autoregressions (see Bernanke and
Blinder, 1992).
Cappelletti et al. (2011) used banks‟ balance sheet assets and liabilities to
examine how crisis impacted on interbank funding relationships. The analysis
showed that the crisis had a clear negative impact on interbank funding,
though there was no drastic fall in the overall interbank activity.
Shabbir (2012), following the theoretical setup presented by Bernanke and
Gertler (1995), used data of non-financial listed firms over a period of 1999 –
2010 to investigate the effectiveness of balance sheet channel of monetary
transmission mechanism in Pakistan.
Angelopoulou and Gibson (2007) examined the sensitivity of investment to
cash flow using a panel of UK firms in manufacturing with a view to shedding
some light on the existence of a balance sheet channel or financial accelerator.
In addition to examining the impact of cash flow in different subsamples
based on company size or financial policy (dividend payouts, share issues and
debt accumulation), they also investigated the extent to which investment
becomes more sensitive to cash flow in periods of monetary tightness.
Allen et al. (2002) designed an analytical framework for understanding crises
in emerging markets based on examination of stock variables in the
aggregated balance sheet of a country and the balance sheets of its main
sectors (assets and liabilities).
Bacchetta and Ballabriga (2000) provided systematic evidence on the
evolution of banks‟ balance sheets and output in response to a monetary shock
by examining 13 European countries in addition to the US.
Mínguez (1997) opined that monetary policy effects on the soundness and
composition of the private non-financial sector balance-sheet and on its cash-
flow can affect the willingness of credit institutions to lend to those agents,
which emphasizes the role of asymmetric information in financial markets,
100 The Balance Sheet Channel of Monetary Policy Transmission:
Evidence from Nigeria Olowofeso et al.
since borrowers have an informational advantage over lenders concerning
their quality as agents demanding loanable funds.
Following Bacchetta and Ballabriga (2000), we considered the balance sheet
channel with expectation that monetary tightening will reduce DMB‟s cash
flow, thereby magnifying the impact of monetary policy on output and prices.
4.0 Methodology
The existence and importance of balance sheet channel in Nigeria is
considered in this study using statistical and econometric techniques. Thus, we
evaluated the balance sheet channel in three procedures. These methods
sought to provide systematic evidence on the progress of output and price in
relation to variations in policy rate, given the 2007 -2008 global financial
crisis in Nigeria.
First, we analyzed the impact of the crisis on those segments of the DMBs
activities which are more exposed to counter party risk. A priori, the
composition of the DMBs balance sheets is expected to change as monetary
policy stance changes, thereby impacting in output and price. Thus, we
adapted a standard regression model:
(1)
(2)
where [ ] is a vector of explanatory variables,
( ) is a vector of coefficients, and is a random error
term.
Assumption 1: We assumed that the classical assumptions of the linear
regression model in Equation (1) hold:
(3)
where ( ) ; ;
and ( ) ( ).
Under this assumption, we considered the influences of DMBs‟ balance sheets
variables (using credit to private sector (CPS) and capital reserves (CR) as
proxies) and policy rate (MPR) on output and price (see also Özlü and Yalçın,
2010). The dependent variables in the regression equation – Industrial
Production Index (IPI), and Consumer Price Index (CPI), were employed as
CBN Journal of Applied Statistics Vol. 5 No.2 (December, 2014) 101
proxies for output and price, respectively. The representative models
explaining the variables are as shown in Equations (6) and (7).
We introduced a time period dummy to reflect the variations in monetary
conditions. This dummy was constructed based on MPR variations due to
external shocks and the global financial imbalances believed to have ended up
with a contraction in the overall economic activity of some countries. The
dummy variable took the value of 1 when the data referred to the loose period
( ) and zero for
the tight period, and was interacted with all the regressor variables in the
models. This was to allow us examine the existence of balance sheet channel
via the relation of MPR variations from a tight to a loose period on output and
price. Recall that the DMBs‟ balance sheets variables are theoretically
believed to vary with MPR homogeneously.
Assumption 2: The classical assumptions of the linear regression model in
Equation (1) do not hold:
Under this assumption, several residual diagnostics statistical and econometric
tests were carried out following Bacchetta and Ballabriga (2000) and Agha et
al. (2005) to examine the dynamics of the balance sheet channel of
transmission mechanism in Nigeria. All the five variables were incorporated
into a VAR system where the variance-covariance matrix of the VAR system
was diagonalized using a triangular orthogonalization scheme called Choleski
scheme (see also Lin, 2008). Generally, this scheme relies on a particular
ordering of variables and has the advantage that shocks to the VAR system
can be identified as shocks to the endogenous variables.
Thus, a multivariate VAR with variables and lags over time was
considered as follows:
∑ ( ) ( )
∑
( )
where is a column vector of observations at time on all the five
variables (IPI, CPI, CPS, CR, MPR); is the matrix coefficients to

102 The Balance Sheet Channel of Monetary Policy Transmission:
Evidence from Nigeria Olowofeso et al.
be estimated. This implies that ∑ where
contemporaneous coefficient matrix; matrix polynomial in the
lag operator while column vector of random disturbances
assumed to be non autocorrelated over time.
The model representations of the variables of interest using the logarithm of
all the variables except the policy rate were obtained as:
( ) (6)
( ) (7)
following assumption 1, and
( ) (8a)
following assumption 2.
Secondly, we examined the response of other variables that can influence the
balance sheet channel of transmission mechanism to a shock to MPR, which
include the GDP growth rate (GDPG), changes in CPI (P), growth rates of
credit to private sector (CPSG) and net credit to government (NCGG), as well
as the prime lending rate (PLR). The model representation is given under
assumption 2 as:
( ) (8b)
4.1 Diagnostic Tests
Prior to the VAR system analysis, the time series properties of the variables
were determined using some statistical and econometric tests. Under
assumption 2, the Augmented Dickey Fuller (ADF) test was conducted using
a standard equation of the form:
∑
( )
In other word, a unit root test was carried out on the coefficient of in the
regression for the existence of unit root in variable . The unit root test was
conducted in two cases: with intercept only and with intercept and trend, to
take into account the impact of trend in the series (Table 4).
A Lagrange Multiplier (LM) statistic of the form:
CBN Journal of Applied Statistics Vol. 5 No.2 (December, 2014) 103
∑ ( ) ⁄
( )
was also carried out for residual serial correlation, where T is the sample size,
S(t) is the partial sum of residuals, and is an estimator of the residual
spectrum at frequency zero.
Other econometric tests included the multivariate extensions of the Jarque-
Bera residual normality test (Jarque and Bera, 1980), which compared the
third and fourth moments of the residual‟s distribution to those from the
normal distribution based on the estimated moments of the residuals given by
⁄ ∑
; and such that
[
(
)
] ( )
( )
where is the estimated mean of the residuals, is the estimated variance,
is the third moment that measures skewness, and is the fourth moment
that measures kurtosis.
Cumulative sum of squares (CUSUM) tests were also carried out to validate
parameter stability in the estimation of Equations 6-7, while a variance
decomposition and impulse response functions that traced the effects of a
shock to one endogenous variable on to the other variables in the VAR system
was used to evaluate the overall influence of monetary policy on output and
price for the periods under consideration. This test gave the expected time
path of the dependent variable(s) that would result when a shock is added to a
model in steady state.
4.2 Data and the Choice of Variables
In this study, we considered the following five variables: DMBs capital
reserves, CR; DMBs credit to private sector, CPS; monetary policy rate,
MPR; industrial production index, IPI; and consumer price index, CPI, as
balance sheet channel variables following several authors in the literature.
Further variables like the GDP growth rate (GDPG), changes in CPI (P),
growth rates of credit to private sector (CPSG) and net credit to government
(NCGG), as well as the prime lending rate (PLR) were also considered for
robustness check. All quarterly data were extracted from the CBN statistical
bulletins of 2002Q1 – 2014Q1.
104 The Balance Sheet Channel of Monetary Policy Transmission:
Evidence from Nigeria Olowofeso et al.
5.0 Empirical Results and Discussion
5.1 Statistical Analysis
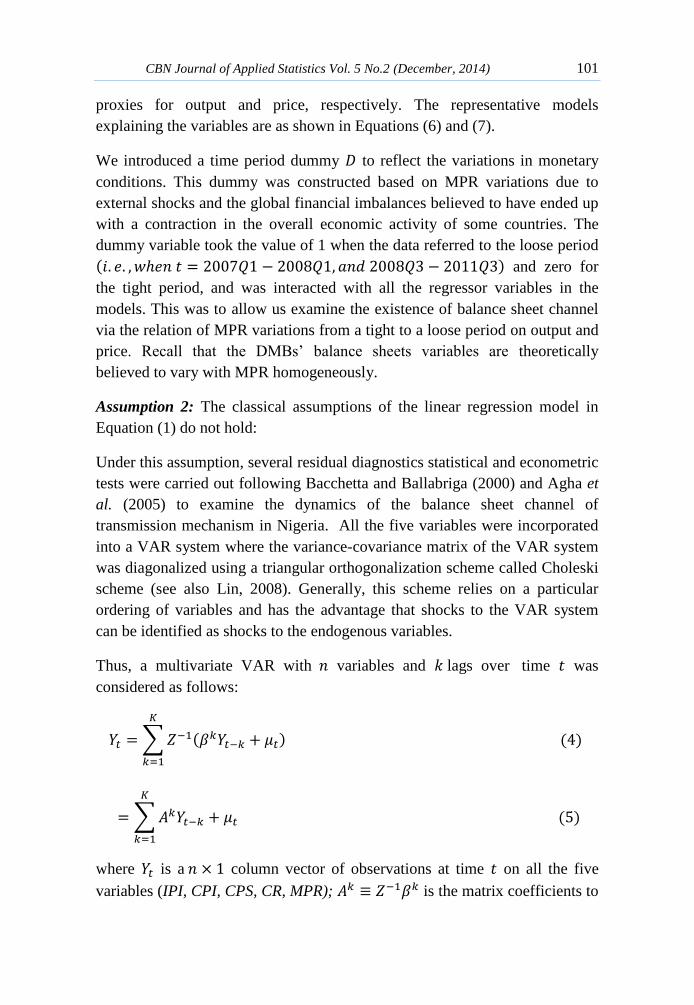
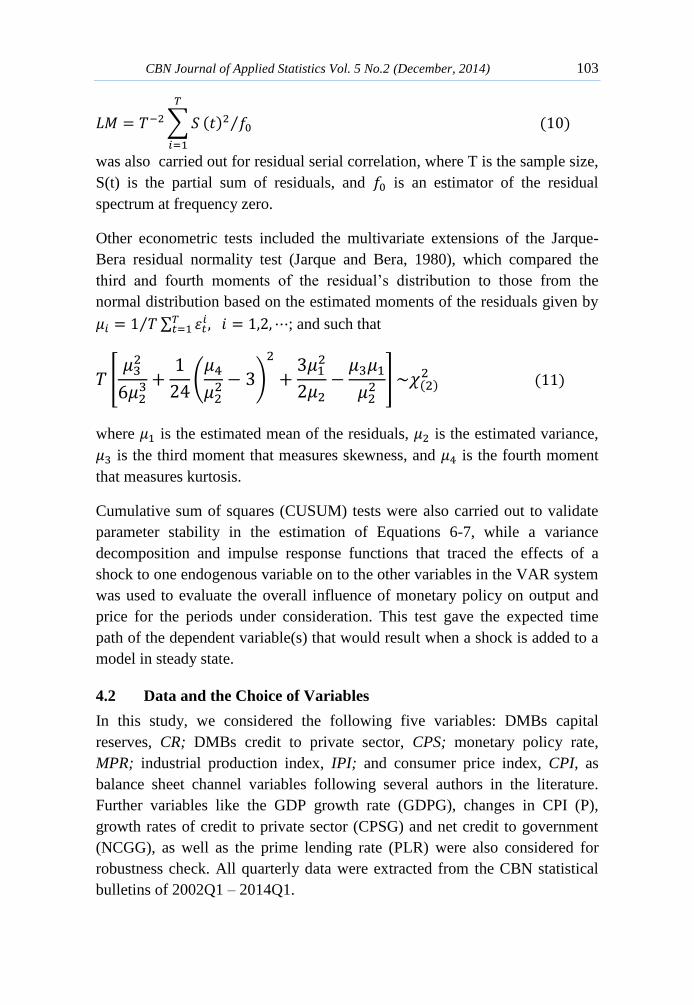
The results of the regression estimates are presented in Tables 1 – 3. The
percentage variations of output and price explained by the impact of MPR
variations from a tight to a loose period and the response of CPS and CR was
given by the and , respectively, while the proportion of the
variability that was due to DMBs balance-sheets specific components was
explained by the adjusted and , respectively.
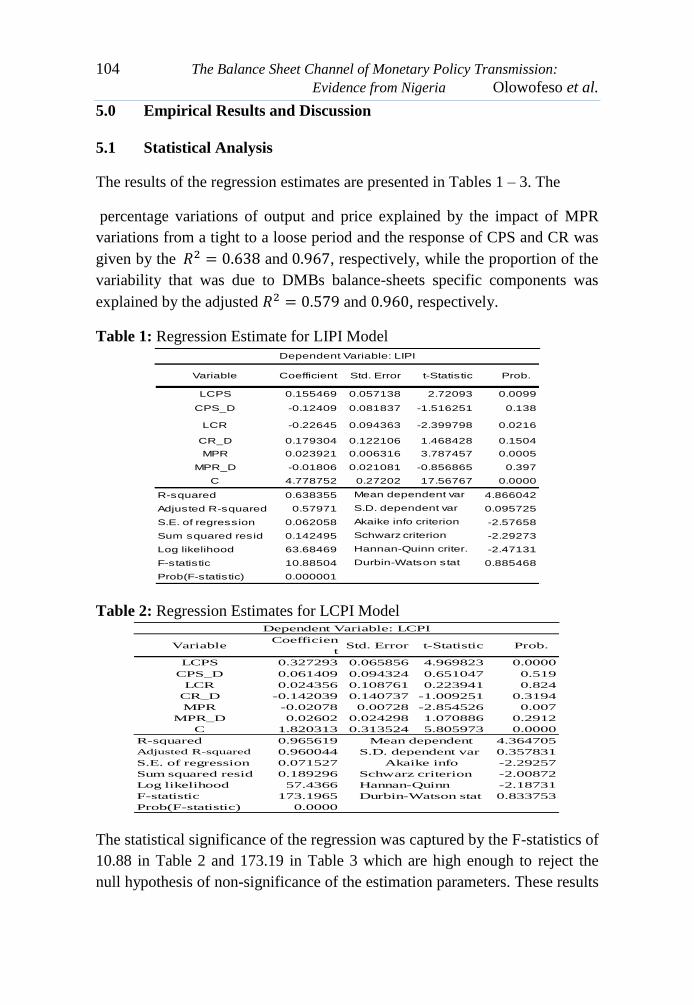
Table 1: Regression Estimate for LIPI Model
Table 2: Regression Estimates for LCPI Model
The statistical significance of the regression was captured by the F-statistics of
10.88 in Table 2 and 173.19 in Table 3 which are high enough to reject the
null hypothesis of non-significance of the estimation parameters. These results
Variable Coefficient Std. Error t-Statistic Prob.
LCPS 0.155469 0.057138 2.72093 0.0099
CPS_D -0.12409 0.081837 -1.516251 0.138
LCR -0.22645 0.094363 -2.399798 0.0216
CR_D 0.179304 0.122106 1.468428 0.1504
MPR 0.023921 0.006316 3.787457 0.0005
MPR_D -0.01806 0.021081 -0.856865 0.397
C 4.778752 0.27202 17.56767 0.0000
R-squared 0.638355 4.866042
Adjusted R-squared 0.57971 0.095725
S.E. of regression 0.062058 -2.57658
Sum squared resid 0.142495 -2.29273
Log likelihood 63.68469 -2.47131
F-statistic 10.88504 0.885468
Prob(F-statistic) 0.000001
S.D. dependent var
Akaike info criterion
Schwarz criterion
Hannan-Quinn criter.
Durbin-Watson stat
Dependent Variable: LIPI
Mean dependent var
VariableCoefficien
tStd. Error t-Statistic Prob.
LCPS 0.327293 0.065856 4.969823 0.0000
CPS_D 0.061409 0.094324 0.651047 0.519
LCR 0.024356 0.108761 0.223941 0.824
CR_D -0.142039 0.140737 -1.009251 0.3194
MPR -0.02078 0.00728 -2.854526 0.007
MPR_D 0.02602 0.024298 1.070886 0.2912
C 1.820313 0.313524 5.805973 0.0000
R-squared 0.965619 4.364705
Adjusted R-squared 0.960044 0.357831
S.E. of regression 0.071527 -2.29257
Sum squared resid 0.189296 -2.00872
Log likelihood 57.4366 -2.18731
F-statistic 173.1965 0.833753
Prob(F-statistic) 0.0000
Durbin-Watson stat
Dependent Variable: LCPI
Mean dependent
S.D. dependent var
Akaike info
Schwarz criterion
Hannan-Quinn

CBN Journal of Applied Statistics Vol. 5 No.2 (December, 2014) 105
indicate the existence of balance sheet channel but also establish non
significance impact of the global financial crisis on output and price through
DMBs‟ balance sheets in Nigeria. The non-significant impact of the crisis was
in consonance with Ajakaiye and Fakiyesi (2009). In particular, the existence
of balance sheet channel was underscored following the statistically
significant effect of CPS, CR and MPR on output, as well as CPS and MPR
on price. This also implies that the variations in MPR influence economic
response indirectly.
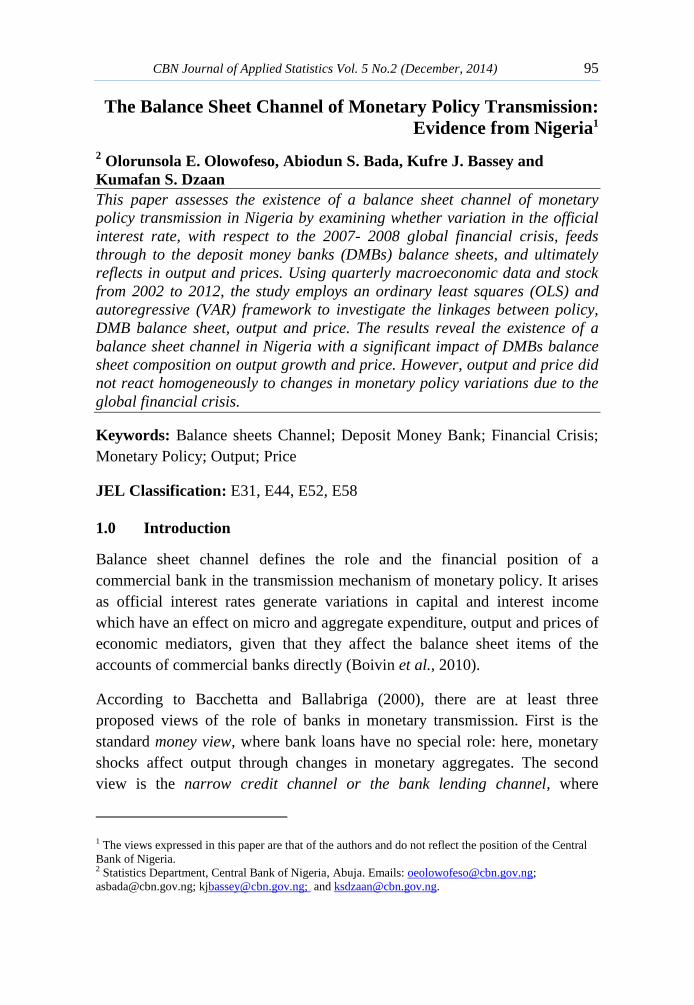
Before drawing conclusions from the estimated regressions, a stability test
was conducted to make sure that the assumptions of the classical linear
regression model were satisfied. The tests results indicated no episode of
instability in the variables used as the residual variance remained generally
stable within a 5 percent critical band (Figures 1 and 2).
Fig. 1: Stability Test for IPI Model
Fig. 2: Stability Test for CPI Model
-0.4
-0.2
0.0
0.2
0.4
0.6
0.8
1.0
1.2
1.4
IV I II III IV I II III IV I II III IV I II III IV I II III IV
2008 2009 2010 2011 2012
CUSUM of Squares 5% Significance
-0.4
-0.2
0.0
0.2
0.4
0.6
0.8
1.0
1.2
1.4
IV I II III IV I II III IV I II III IV I II III IV I II III IV
2008 2009 2010 2011 2012
CUSUM of Squares 5% Significance
106 The Balance Sheet Channel of Monetary Policy Transmission:
Evidence from Nigeria Olowofeso et al.
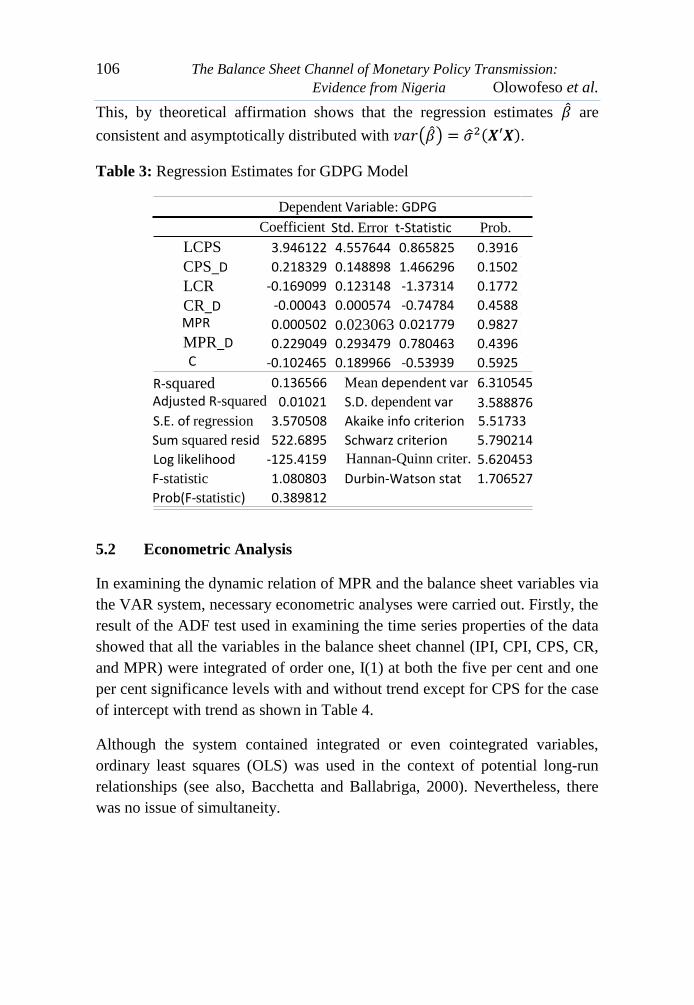
This, by theoretical affirmation shows that the regression estimates are
consistent and asymptotically distributed with ( ) ( ).
Table 3: Regression Estimates for GDPG Model
5.2 Econometric Analysis
In examining the dynamic relation of MPR and the balance sheet variables via
the VAR system, necessary econometric analyses were carried out. Firstly, the
result of the ADF test used in examining the time series properties of the data
showed that all the variables in the balance sheet channel (IPI, CPI, CPS, CR,
and MPR) were integrated of order one, I(1) at both the five per cent and one
per cent significance levels with and without trend except for CPS for the case
of intercept with trend as shown in Table 4.
Although the system contained integrated or even cointegrated variables,
ordinary least squares (OLS) was used in the context of potential long-run
relationships (see also, Bacchetta and Ballabriga, 2000). Nevertheless, there
was no issue of simultaneity.
Coefficient Std. Error t-Statistic Prob.
LCPS 3.946122 4.557644 0.865825 0.3916
CPS_D 0.218329 0.148898 1.466296 0.1502
LCR -0.169099 0.123148 -1.37314 0.1772
CR_D -0.00043 0.000574 -0.74784 0.4588 MPR 0.000502 0.023063 0.021779 0.9827 MPR_D 0.229049 0.293479 0.780463 0.4396 C -0.102465 0.189966 -0.53939 0.5925
R-squared 0.136566 Mean dependent var 6.310545 Adjusted R-squared 0.01021 S.D. dependent var 3.588876 S.E. of regression 3.570508 Akaike info criterion 5.51733
Sum squared resid 522.6895 Schwarz criterion 5.790214
Log likelihood -125.4159 Hannan-Quinn criter. 5.620453
F-statistic 1.080803 Durbin-Watson stat 1.706527
Prob(F-statistic) 0.389812
Dependent Variable: GDPG
CBN Journal of Applied Statistics Vol. 5 No.2 (December, 2014) 107
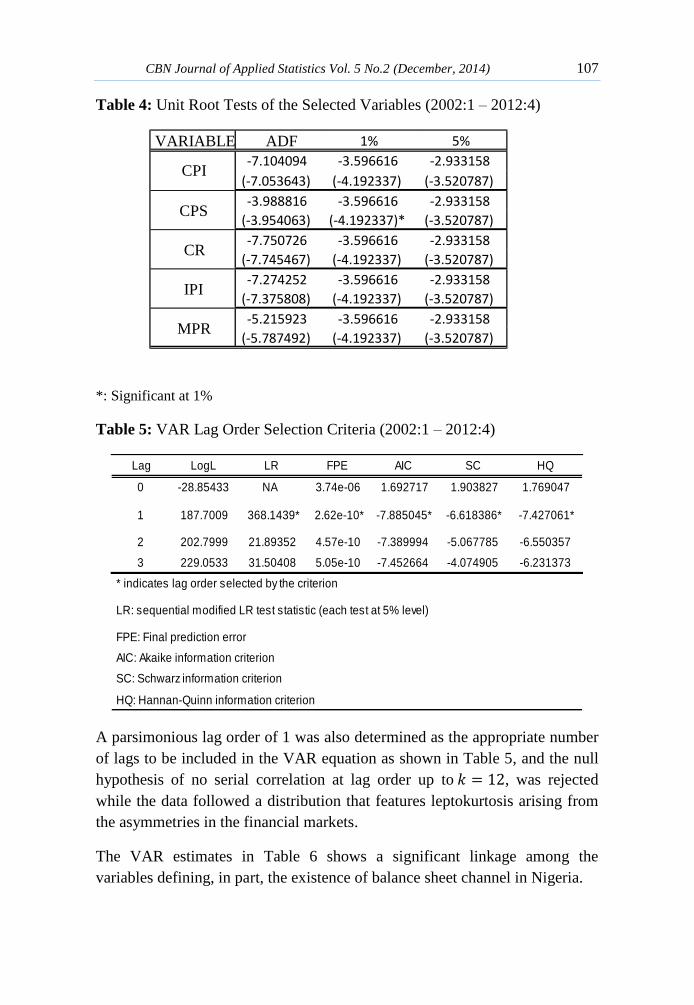
Table 4: Unit Root Tests of the Selected Variables (2002:1 – 2012:4)
*: Significant at 1%
Table 5: VAR Lag Order Selection Criteria (2002:1 – 2012:4)
A parsimonious lag order of 1 was also determined as the appropriate number
of lags to be included in the VAR equation as shown in Table 5, and the null
hypothesis of no serial correlation at lag order up to , was rejected
while the data followed a distribution that features leptokurtosis arising from
the asymmetries in the financial markets.
The VAR estimates in Table 6 shows a significant linkage among the
variables defining, in part, the existence of balance sheet channel in Nigeria.
Lag LogL LR FPE AIC SC HQ
0 -28.85433 NA 3.74e-06 1.692717 1.903827 1.769047
1 187.7009 368.1439* 2.62e-10* -7.885045* -6.618386* -7.427061*
2 202.7999 21.89352 4.57e-10 -7.389994 -5.067785 -6.550357
3 229.0533 31.50408 5.05e-10 -7.452664 -4.074905 -6.231373
HQ: Hannan-Quinn information criterion
* indicates lag order selected by the criterion
LR: sequential modified LR test statistic (each test at 5% level)
FPE: Final prediction error
AIC: Akaike information criterion
SC: Schwarz information criterion
VARIABLE ADF 1% 5%
-7.104094 -3.596616 -2.933158
(-7.053643) (-4.192337) (-3.520787)
-3.988816 -3.596616 -2.933158
(-3.954063) (-4.192337)* (-3.520787)
-7.750726 -3.596616 -2.933158
(-7.745467) (-4.192337) (-3.520787)
-7.274252 -3.596616 -2.933158
(-7.375808) (-4.192337) (-3.520787)
-5.215923 -3.596616 -2.933158
(-5.787492) (-4.192337) (-3.520787)
CPI
CPS
CR
IPI
MPR

108 The Balance Sheet Channel of Monetary Policy Transmission:
Evidence from Nigeria Olowofeso et al.
Table 5: VAR Lag Order Selection Criteria (2002:1 – 2012:4)
Table 6: VAR Estimates (2002:1 – 2012:4)
Lag LogL LR FPE AIC SC HQ
0 -28.85433 NA 3.74e-06 1.692717 1.903827 1.769047
1 187.7009 368.1439* 2.62e-10* -7.885045* -6.618386* -7.427061*
2 202.7999 21.89352 4.57e-10 -7.389994 -5.067785 -6.550357
3 229.0533 31.50408 5.05e-10 -7.452664 -4.074905 -6.231373
HQ: Hannan-Quinn information criterion
* indicates lag order selected by the criterion
LR: sequential modified LR test statistic (each test at 5% level)
FPE: Final prediction error
AIC: Akaike information criterion
SC: Schwarz information criterion
DLIPI DLCPI DLCPS DLCR DMPR
DLIPI(-1) 0.804730 0.034947 0.165045 -0.24673 5.930483
(0.13016) (0.08210) (0.14462) (0.47851) (2.88586)
[ 6.18258] [ 0.42566] [ 1.14124] [-0.51562] [ 2.05502]
DLCPI(-1) 0.006399 0.911783 -0.051374 0.663651 1.141667
(0.09583) (0.06045) (0.10648) (0.35232) (2.12480)
[ 0.06677] [ 15.0836] [-0.48247] [ 1.88368] [ 0.53731]
DLCPS(-1) 0.018412 0.034153 0.891966 -0.05351 -0.96676
(0.03656) (0.02306) (0.04062) (0.13441) (0.81061)
[ 0.50360] [ 1.48099] [ 21.9577] [-0.39812] [-1.19263]
DLCR(-1) -0.03283 -0.00878 0.170830 0.726561 0.943997
(0.03784) (0.02387) (0.04204) (0.13911) (0.83894)
[-0.86758] [-0.36796] [ 4.06333] [ 5.22308] [ 1.12523]
DMPR(-1) 0.003300 -0.0001 -0.018518 0.021179 0.743077
(0.00512) (0.00323) (0.00569) (0.01884) (0.11359)
[ 0.64417] [-0.03110] [-3.25304] [ 1.12445] [ 6.54153]
C 0.938651 0.018070 -0.489686 0.278158 -29.031
(0.61711) (0.38925) (0.68566) (2.26868) (13.6823)
[ 1.52104] [ 0.04642] [-0.71418] [ 0.12261] [-2.12179]
R-squared 0.777253 0.992937 0.997214 0.874966 0.927773
Adj. R-squared 0.746316 0.991956 0.996827 0.857601 0.917742
Sum sq. resids 0.084540 0.033635 0.104364 1.142559 41.55747
S.E. equation 0.048459 0.030566 0.053842 0.178151 1.074418
F-statistic 25.12368 1012.196 2577.324 50.38456 92.48604
Log likelihood 70.77689 90.13190 66.35294 16.09697 -59.373
Akaike AIC -3.08461 -4.00628 -2.873949 -0.48081 3.112999
Schwarz SC -2.83638 -3.75804 -2.625711 -0.23257 3.361238
Mean dependent 4.862217 4.365887 8.256825 6.352928 11.50000
S.D. dependent 0.096213 0.340805 0.955889 0.472100 3.746136
1.43E-10
6.62E-11
194.2292
-7.82044
-6.57925
Determinant resid covariance
(dof adj.)
Determinant resid covariance
Log likelihood
Akaike information criterion
Schwarz criterion
Vector Autoregression Estimates
CBN Journal of Applied Statistics Vol. 5 No.2 (December, 2014) 109
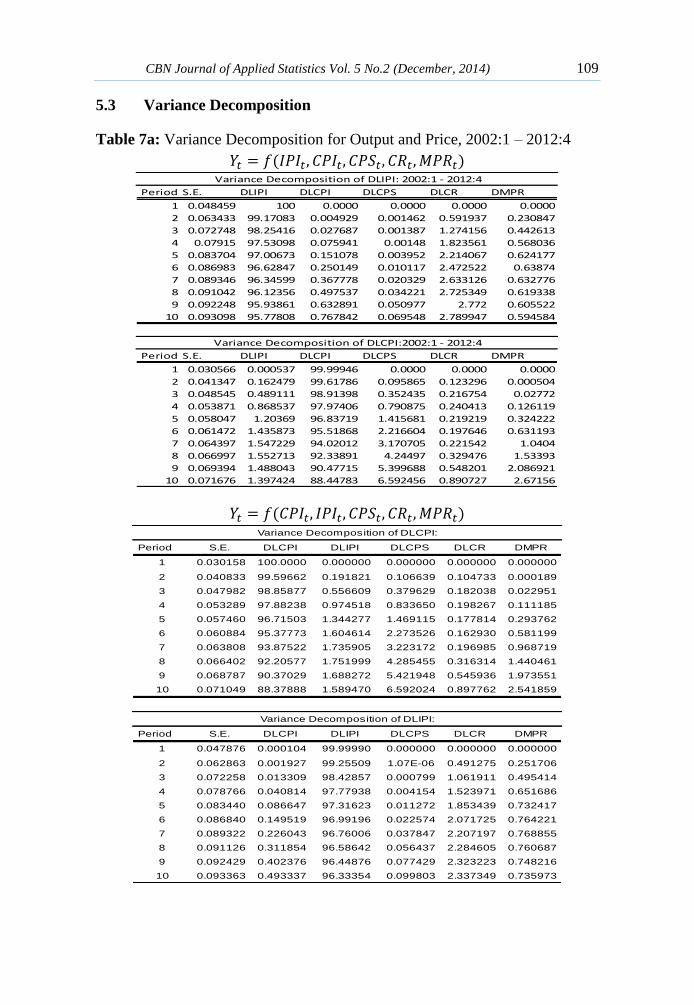
5.3 Variance Decomposition
Table 7a: Variance Decomposition for Output and Price, 2002:1 – 2012:4
( )
( )
Period S.E. DLIPI DLCPI DLCPS DLCR DMPR
1 0.048459 100 0.0000 0.0000 0.0000 0.0000
2 0.063433 99.17083 0.004929 0.001462 0.591937 0.230847
3 0.072748 98.25416 0.027687 0.001387 1.274156 0.442613
4 0.07915 97.53098 0.075941 0.00148 1.823561 0.568036
5 0.083704 97.00673 0.151078 0.003952 2.214067 0.624177
6 0.086983 96.62847 0.250149 0.010117 2.472522 0.63874
7 0.089346 96.34599 0.367778 0.020329 2.633126 0.632776
8 0.091042 96.12356 0.497537 0.034221 2.725349 0.619338
9 0.092248 95.93861 0.632891 0.050977 2.772 0.605522
10 0.093098 95.77808 0.767842 0.069548 2.789947 0.594584
Period S.E. DLIPI DLCPI DLCPS DLCR DMPR
1 0.030566 0.000537 99.99946 0.0000 0.0000 0.0000
2 0.041347 0.162479 99.61786 0.095865 0.123296 0.000504
3 0.048545 0.489111 98.91398 0.352435 0.216754 0.02772
4 0.053871 0.868537 97.97406 0.790875 0.240413 0.126119
5 0.058047 1.20369 96.83719 1.415681 0.219219 0.324222
6 0.061472 1.435873 95.51868 2.216604 0.197646 0.631193
7 0.064397 1.547229 94.02012 3.170705 0.221542 1.0404
8 0.066997 1.552713 92.33891 4.24497 0.329476 1.53393
9 0.069394 1.488043 90.47715 5.399688 0.548201 2.086921
10 0.071676 1.397424 88.44783 6.592456 0.890727 2.67156
Variance Decomposition of DLIPI: 2002:1 - 2012:4
Variance Decomposition of DLCPI:2002:1 - 2012:4
Period S.E. DLCPI DLIPI DLCPS DLCR DMPR
1 0.030158 100.0000 0.000000 0.000000 0.000000 0.000000
2 0.040833 99.59662 0.191821 0.106639 0.104733 0.000189
3 0.047982 98.85877 0.556609 0.379629 0.182038 0.022951
4 0.053289 97.88238 0.974518 0.833650 0.198267 0.111185
5 0.057460 96.71503 1.344277 1.469115 0.177814 0.293762
6 0.060884 95.37773 1.604614 2.273526 0.162930 0.581199
7 0.063808 93.87522 1.735905 3.223172 0.196985 0.968719
8 0.066402 92.20577 1.751999 4.285455 0.316314 1.440461
9 0.068787 90.37029 1.688272 5.421948 0.545936 1.973551
10 0.071049 88.37888 1.589470 6.592024 0.897762 2.541859
Period S.E. DLCPI DLIPI DLCPS DLCR DMPR
1 0.047876 0.000104 99.99990 0.000000 0.000000 0.000000
2 0.062863 0.001927 99.25509 1.07E-06 0.491275 0.251706
3 0.072258 0.013309 98.42857 0.000799 1.061911 0.495414
4 0.078766 0.040814 97.77938 0.004154 1.523971 0.651686
5 0.083440 0.086647 97.31623 0.011272 1.853439 0.732417
6 0.086840 0.149519 96.99196 0.022574 2.071725 0.764221
7 0.089322 0.226043 96.76006 0.037847 2.207197 0.768855
8 0.091126 0.311854 96.58642 0.056437 2.284605 0.760687
9 0.092429 0.402376 96.44876 0.077429 2.323223 0.748216
10 0.093363 0.493337 96.33354 0.099803 2.337349 0.735973
Variance Decomposition of DLCPI:
Variance Decomposition of DLIPI:
110 The Balance Sheet Channel of Monetary Policy Transmission:
Evidence from Nigeria Olowofeso et al.
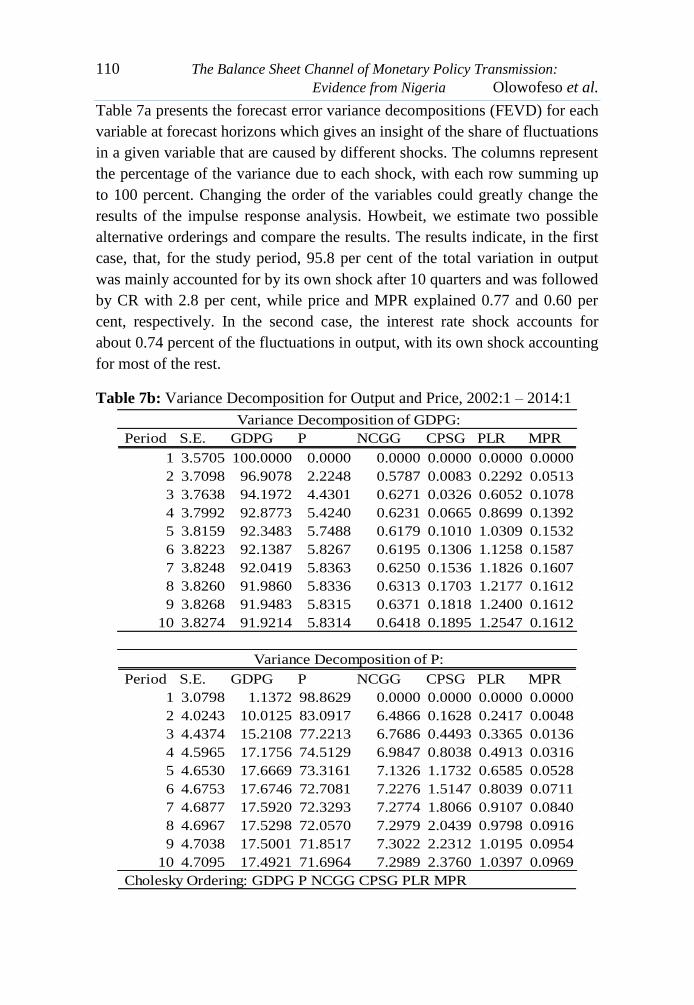
Table 7a presents the forecast error variance decompositions (FEVD) for each
variable at forecast horizons which gives an insight of the share of fluctuations
in a given variable that are caused by different shocks. The columns represent
the percentage of the variance due to each shock, with each row summing up
to 100 percent. Changing the order of the variables could greatly change the
results of the impulse response analysis. Howbeit, we estimate two possible
alternative orderings and compare the results. The results indicate, in the first
case, that, for the study period, 95.8 per cent of the total variation in output
was mainly accounted for by its own shock after 10 quarters and was followed
by CR with 2.8 per cent, while price and MPR explained 0.77 and 0.60 per
cent, respectively. In the second case, the interest rate shock accounts for
about 0.74 percent of the fluctuations in output, with its own shock accounting
for most of the rest.
Table 7b: Variance Decomposition for Output and Price, 2002:1 – 2014:1
Period S.E. GDPG P NCGG CPSG PLR MPR
1 3.5705 100.0000 0.0000 0.0000 0.0000 0.0000 0.0000
2 3.7098 96.9078 2.2248 0.5787 0.0083 0.2292 0.0513
3 3.7638 94.1972 4.4301 0.6271 0.0326 0.6052 0.1078
4 3.7992 92.8773 5.4240 0.6231 0.0665 0.8699 0.1392
5 3.8159 92.3483 5.7488 0.6179 0.1010 1.0309 0.1532
6 3.8223 92.1387 5.8267 0.6195 0.1306 1.1258 0.1587
7 3.8248 92.0419 5.8363 0.6250 0.1536 1.1826 0.1607
8 3.8260 91.9860 5.8336 0.6313 0.1703 1.2177 0.1612
9 3.8268 91.9483 5.8315 0.6371 0.1818 1.2400 0.1612
10 3.8274 91.9214 5.8314 0.6418 0.1895 1.2547 0.1612
Period S.E. GDPG P NCGG CPSG PLR MPR
1 3.0798 1.1372 98.8629 0.0000 0.0000 0.0000 0.0000
2 4.0243 10.0125 83.0917 6.4866 0.1628 0.2417 0.0048
3 4.4374 15.2108 77.2213 6.7686 0.4493 0.3365 0.0136
4 4.5965 17.1756 74.5129 6.9847 0.8038 0.4913 0.0316
5 4.6530 17.6669 73.3161 7.1326 1.1732 0.6585 0.0528
6 4.6753 17.6746 72.7081 7.2276 1.5147 0.8039 0.0711
7 4.6877 17.5920 72.3293 7.2774 1.8066 0.9107 0.0840
8 4.6967 17.5298 72.0570 7.2979 2.0439 0.9798 0.0916
9 4.7038 17.5001 71.8517 7.3022 2.2312 1.0195 0.0954
10 4.7095 17.4921 71.6964 7.2989 2.3760 1.0397 0.0969
Cholesky Ordering: GDPG P NCGG CPSG PLR MPR
Variance Decomposition of GDPG:
Variance Decomposition of P:
CBN Journal of Applied Statistics Vol. 5 No.2 (December, 2014) 111
Again, the FEVD of price shows that 88.5 per cent of the variation was
accounted for by its own shock while CPS explained 6.59 per cent, MPR
explained 2.67 while output and CR explained 1.40 and 0.90 per cent,
respectively. The implication of these results in both cases is that,
comparatively, interest rate innovations are relatively strong determinant of
fluctuations in economic activity with respect to price than output in the
balance sheet channel in Nigeria.
The existence of the balance sheet channel, though not as significantly as was
expected, could also be accounted for by the dual innovations of capital
reserves for output and credit to private sector to prices.
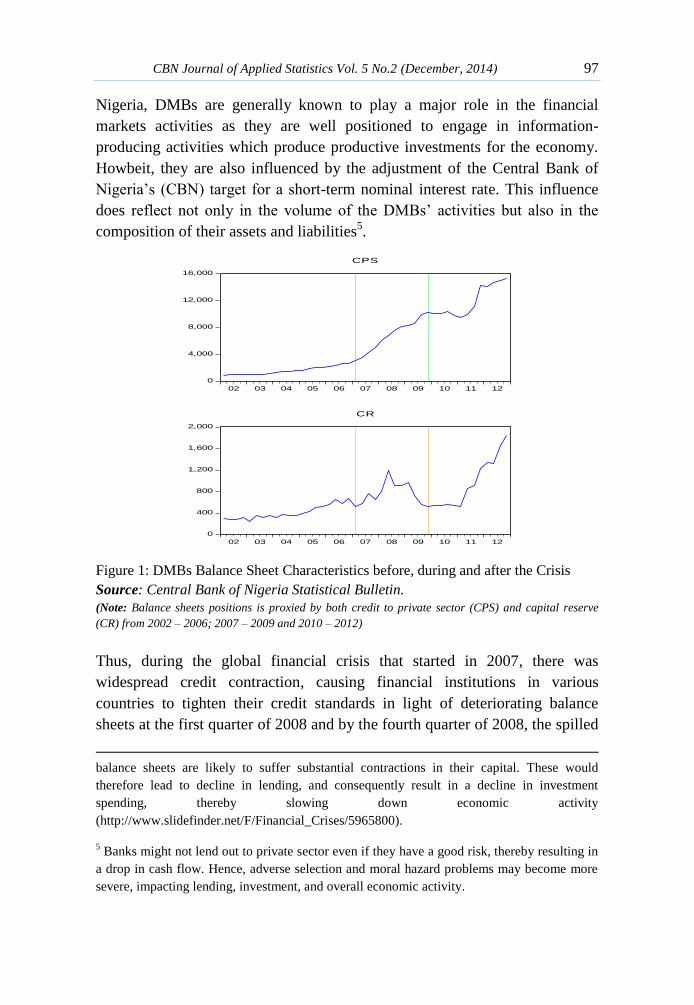
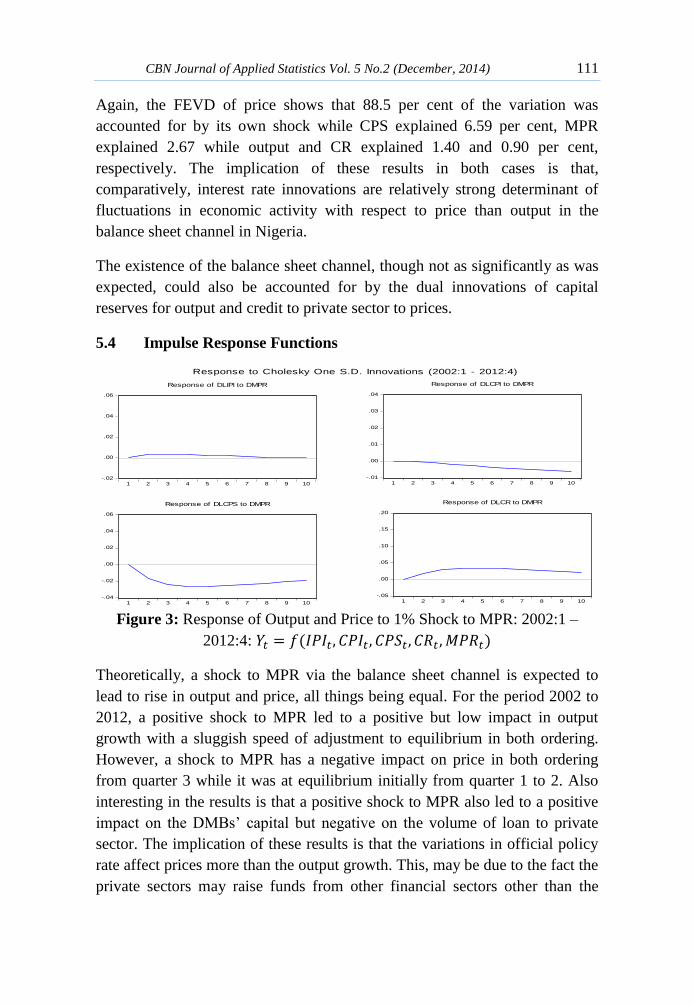
5.4 Impulse Response Functions
Figure 3: Response of Output and Price to 1% Shock to MPR: 2002:1 –
2012:4: ( )
Theoretically, a shock to MPR via the balance sheet channel is expected to
lead to rise in output and price, all things being equal. For the period 2002 to
2012, a positive shock to MPR led to a positive but low impact in output
growth with a sluggish speed of adjustment to equilibrium in both ordering.
However, a shock to MPR has a negative impact on price in both ordering
from quarter 3 while it was at equilibrium initially from quarter 1 to 2. Also
interesting in the results is that a positive shock to MPR also led to a positive
impact on the DMBs‟ capital but negative on the volume of loan to private
sector. The implication of these results is that the variations in official policy
rate affect prices more than the output growth. This, may be due to the fact the
private sectors may raise funds from other financial sectors other than the
-.02
.00
.02
.04
.06
1 2 3 4 5 6 7 8 9 10
Response of DLIPI to DMPR
-.01
.00
.01
.02
.03
.04
1 2 3 4 5 6 7 8 9 10
Response of DLCPI to DMPR
-.04
-.02
.00
.02
.04
.06
1 2 3 4 5 6 7 8 9 10
Response of DLCPS to DMPR
-.05
.00
.05
.10
.15
.20
1 2 3 4 5 6 7 8 9 10
Response of DLCR to DMPR
Response to Cholesky One S.D. Innovations (2002:1 - 2012:4)
112 The Balance Sheet Channel of Monetary Policy Transmission:
Evidence from Nigeria Olowofeso et al.
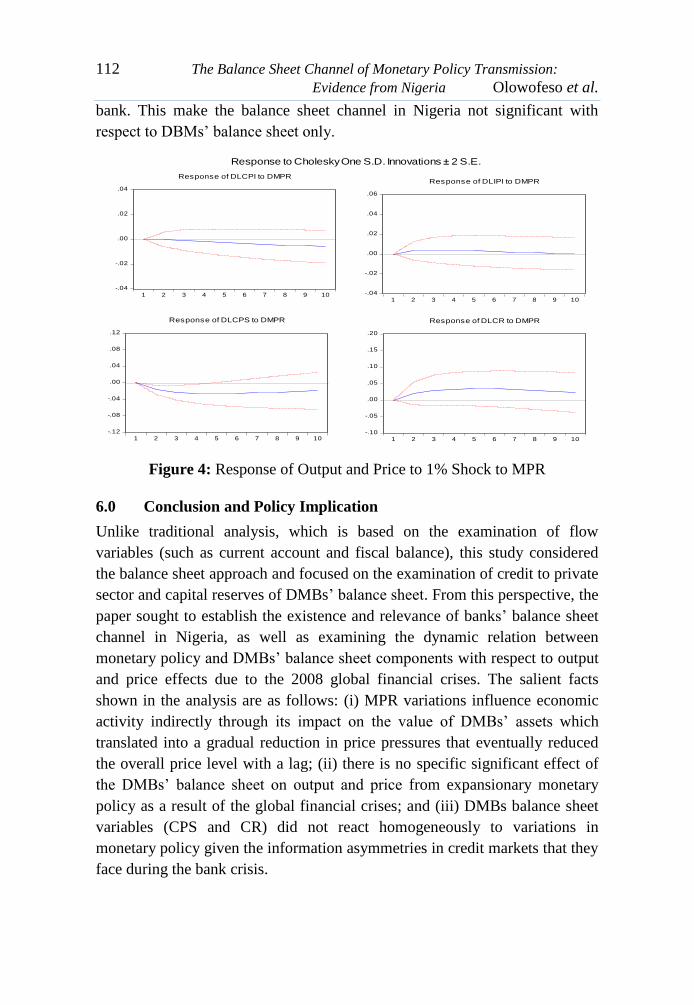
bank. This make the balance sheet channel in Nigeria not significant with
respect to DBMs‟ balance sheet only.
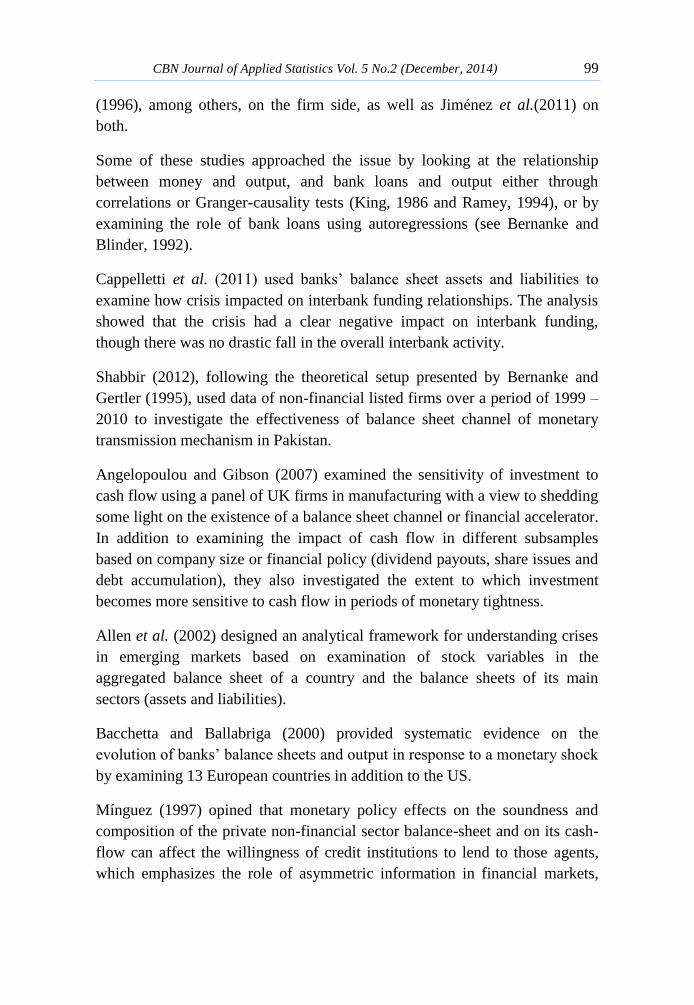
Figure 4: Response of Output and Price to 1% Shock to MPR
6.0 Conclusion and Policy Implication
Unlike traditional analysis, which is based on the examination of flow
variables (such as current account and fiscal balance), this study considered
the balance sheet approach and focused on the examination of credit to private
sector and capital reserves of DMBs‟ balance sheet. From this perspective, the
paper sought to establish the existence and relevance of banks‟ balance sheet
channel in Nigeria, as well as examining the dynamic relation between
monetary policy and DMBs‟ balance sheet components with respect to output
and price effects due to the 2008 global financial crises. The salient facts
shown in the analysis are as follows: (i) MPR variations influence economic
activity indirectly through its impact on the value of DMBs‟ assets which
translated into a gradual reduction in price pressures that eventually reduced
the overall price level with a lag; (ii) there is no specific significant effect of
the DMBs‟ balance sheet on output and price from expansionary monetary
policy as a result of the global financial crises; and (iii) DMBs balance sheet
variables (CPS and CR) did not react homogeneously to variations in
monetary policy given the information asymmetries in credit markets that they
face during the bank crisis.
-.04
-.02
.00
.02
.04
1 2 3 4 5 6 7 8 9 10
Response of DLCPI to DMPR
-.04
-.02
.00
.02
.04
.06
1 2 3 4 5 6 7 8 9 10
Response of DLIPI to DMPR
-.12
-.08
-.04
.00
.04
.08
.12
1 2 3 4 5 6 7 8 9 10
Response of DLCPS to DMPR
-.10
-.05
.00
.05
.10
.15
.20
1 2 3 4 5 6 7 8 9 10
Response of DLCR to DMPR
Response to Cholesky One S.D. Innovations ± 2 S.E.

CBN Journal of Applied Statistics Vol. 5 No.2 (December, 2014) 113
The implication of these results is that monetary policy influences output and
price indirectly by affecting the DMBs balance sheet composition since they
are the primary source of loanable funds to some firms. In other words, the
effects of a monetary contraction will be magnified by the reduction in loans
supplied by DMBs, and ultimately amplifies the demand-side effects on
expenditure decisions of the private sector if there is no external intervention.
Hence, the extent to which a balance-sheet channel can be significance in
Nigeria depends on the substitutability between internal and external sources
of DMBs funds.
Looking forward, improvements in using more than DMBs‟ balance-sheets
are essential steps for unclogging the wheels of balance sheet transmission
mechanism and improving the mechanism of monetary policy in Nigeria.
References
Agha, A. I., Ahmed, N., Mubarik, Y. A. and Shah, H. (2005). “Transmission
Mechanism of Monetary Policy in Pakistan”, SBP Research Bulletin,
1:1, 2005.
Ajakaiye, O. and Fakiyesi, T. (2009): Global Financial Crisis Discussion
Series, Paper 8: Nigeria.
Allen M., Rosenberg C., Keller C., Setser B. and Roubini N. (2002). A
Balance Sheet Approach to Financial Crisis, IMF Working Paper,
WP/02/210.
Aliyu, S. U. R. (2012). Reactions of Stock Market to Monetary Policy Shocks
during the Global Financial Crisis: The Nigerian Case, CBN Journal of
Applied Statistics, 3(1):17-41.
Angelopoulou E. and Gibson H. D. (2007). The Balance Sheet Channel of
Monetary Policy Transmission: Evidence from the Uk, Bank of Greece
Working Paper, No. 53.
Ashcraft, A. (2006). New Evidence on the Lending Channel, Journal of
Money, Credit and Banking, 38: 751-775.
Atuanya P. and Obodo E. (2012): Nigeria Faces Complex Bank Lending
Crisis, Business Day News, Monday, 26 November 2012.
114 The Balance Sheet Channel of Monetary Policy Transmission:
Evidence from Nigeria Olowofeso et al.
Bacchetta, P. and Ballabriga, F. (2000). The Impact of Monetary Policy and
Banks‟ balance Sheets: Some International Evidence, Applied
Financial Economics, 10:15- 26.
Bernanke, B. S. and Blinder, A. S. (1992). The Federal Funds Rate and the
Channels of Monetary Transmission. American Economic Review 82,
901-922.
Bernanke, B. S. and Gertler, M. (1995). “Inside the Black Box: The Credit
Channel of Monetary Policy”, The Journal of Economic Perspectives,
9:4, (Autumn), 27-48.
Bernanke, B. S., M. Gertler, and S. Gilchrist, 1996, The Financial Accelerator
and the Flight to Quality, Review of Economics and Statistics 78, 1-15.
Black, L., Hancock D. and Passmore W. (2009). Core Deposit Funding of
Subprime Mortgages and the Effect of Monetary Policy, (Board of
Governors of the Federal Reserve System, Washington DC), Mimeo.
Boivin J., Kiley, M. T. and Mishkin, F. S. (2010). How has the Monetary
Transmission Mechanism Evolved over Time? NBER Working Paper
Series, http://www.nber.org/papers/w15879.
Cappelletti, G., De Socio, A., Guazzarotti, G. and Mallucci, E. (2011). The
Impact of the Financial Crisis on Inter-Bank Funding: Evidence from
Italian Balance Sheet Data, Occasional Papers No. 95, Bank of Italy,
www.bancaditalia.it.
Chaney, T., Sraer D. and Thesmar, D. (2009). The Collateral Channel: How
Real Estate Shocks affect Corporate Investment, Princeton University,
Princeton.
Gan, J. (2007). "The Real Effects of Asset Market Bubbles: Loan‐ and Firm‐
Level Evidence of a Lending Channel," Review of Financial Studies
20, 1941‐1973.
Gertler, M. and Gilchrist, S. (1994). Monetary Policy, Business Cycles and
the Behaviour of Small Manufacturing Firms, Quarterly Journal of
Economics, CIX: 309 - 40.

CBN Journal of Applied Statistics Vol. 5 No.2 (December, 2014) 115
Jarque, C.M. and A.K. Bera (1980). „Efficient Tests for Normality,
Homoscedasticity and Serial Independence of Regression Residuals,
Economic Letters, 6:255-259.
Jayaratne, J., and D.P. Morgan, 2000, Capital Market Frictions and Deposit
Constraints at Banks, Journal of Money, Credit and Banking 32, 74-
92.
Jiménez G., Ongena S., Peydró J. and Saurina J. (2011). The Impact of
Economic and Monetary Conditions on Loan Supply: Identifying Firm
and Bank Balance-Sheet Channels, Banco de España.
Kashyap, A.K., and Stein J.C. (2000). What Do A Million Observations on
Banks Say About the Transmission of Monetary Policy? American
Economic Review 90, 407-428.
Kashyap, A.K. and Stein, J.C. (1994). Monetary Policy and Bank Lending. In:
Monetary Policy, N. G. Mankiw (ed), University of Chicago Press.
Khwaja, A., and Mian A. (2008). Tracing the Impact of Bank Liquidity
Shocks: Evidence from an Emerging Market, American Economic
Review, 98:1413-1442.
King, S. (1986). Monetary transmission ± through bank loans or bank
liabilities? Journal of Money, Credit, and Banking, 18: 290 - 303.
Kishan, R.P., Opiela, T.P., 2000. Bank Size, Bank Capital and the Bank
Lending Channel. Journal of Money, Credit and Banking 32:121–141.
Lin, J. (2008). Notes on Testing Causality. http://faculty.ndhu.edu.tw /~jlin/
files/ causality.pdf
Melander O. (2009). The Effect of Cash Flow on Investment: An Empirical
Test of the Balance Sheet Channel, Sveriges Riksbank Working Paper
Series No. 228.
Mfnguez J.M.G. (1997). The Balance-Sheet Transmission Channel of
Monetary Policy: The Cases of Germany and Spain, Bundesbank,
http://www.bde.es and http://www.bde.inf.
116 The Balance Sheet Channel of Monetary Policy Transmission:
Evidence from Nigeria Olowofeso et al.
Olowe, R. A. (2011). Inter-Bank Call Rate Volatility and the Global Financial
Crisis: The Nigerian Case; International Journal of Economics and
Finance, 3(1): 283-296.
Özlü P. and Yalçın C. (2010). The Trade Credit Channel of Monetary Policy
Transmission: Evidence from Non-financial Firms in Turkey, Central
Bank of the Republic of Turkey Working Paper No: 10/16.
Ramey, V. (1994). How Important is the Credit Channel in the Transmission
of Monetary Policy, Carnegie-Rochester Conference Series on Public
Policy, 39:1 – 45.
Sanusi L. S. (2010). “The Nigerian Banking Industry: what went wrong and
the way forward”, A Convocation Lecture delivered at the
Convocation Square, Bayero University, Kano, on Friday 26
February.
Shabbir, S. (2012): Balance Sheet Channel of Monetary Transmission in
Pakistan: An Empirical Investigation; SBP Research Bulletin, 8(1): 1-
12.
Soludo, C.C. (2009). “Global Financial And Economic Crisis: How
Vulnerable is Nigeria? Central Bank of Nigeria.