Embed Size (px)
Citation preview
The Australian Centre for Precision Agriculture Symposium on Precision Agriculture Research in
Australasia
Proceeding of the 2000 Symposium
hÇ|äxÜá|àtá f|wÇx|xÇá|á
cÜÉzÜtÅÅx Éy cÜxáxÇàtà|ÉÇ Welcome
Alex McBratney, The Australian Centre for Precision Agriculture, The University of Sydney
PA Systems The Opportunity for Precision and Management in Agriculture
Brett Whelan, The Australian Centre for Precision Agriculture, The University of Sydney
Applications of PA Systems in New Zealand
Ian Yule, Massey Univeristy, Murray Craighead, Lincoln Ventures, NZ, John-Paul Praat, Ravensdown Fertilizers, NZ
Progress in Precision Viticulture - Variation in Yield, Quality and Soil Properties
Robert Bramley, CSIRO Land and Water Science 5 Years of Data - Where to Now?
Jon Medway, Charles Sturt University
Data Layers & Interpretation Digital Elevation Models as a Crucial Layer for PA
Alex McBratney & Tom Bishop, The Australian Centre for Precision Agriculture, The University of Sydney
Forecasting Yield in Rice Using Remote Sensing and Crop Growth Models
David Lamb, Charles Sturt University
Yield and Protein Variation Within a Controlled Traffic System Tim Neale, Queensland Department of Primary Industries
Precision Agriculture: From a Very Mobile Perspective
Ian Pine, Horizon Harvesting Variable-Rate Nitrogen Fertilisation in Cotton
Craig Stewart, The Australian Centre for Precision Agriculture, The University of Sydney
Page 1 of 24 Symposium on Precision Agriculture 2000 Universitas Sidneiensis
Site-Specific Weed Control - Can We Measure & Predict Weed Distributions Accurately?
Lisa Rew, Tamworth Centre for Crop Imporovement, NSW Agriculture
Agronomic Principles for Improved Interpretation of the Yield Map Wayne Strong & Rob Kelly, Queensland Department of Primary Industries
Putting It to Work Precision Agriculture: A Commercial Systems Approach
Nick Raleigh, SST (Australia), Pty Ltd. Case IH - New Initiatives in PA
Robert Lindores, Case IH
Page 2 of 24 Symposium on Precision Agriculture 2000 Universitas Sidneiensis
gtuÄx Éy VÉÇàxÇàá
WELCOME 4
THE OPPORTUNITY FOR PRECISION AND MANAGEMENT IN AGRICULTURE6
APPLICATION OF PA SYSTEMS IN NEW ZEALAND 9
PROGRESS IN THE DEVELOPMENT OF PRECISION VITICULTURE - VARIATION IN GRAPE YIELD AND QUALITY IN COONAWARRA AND SUNRAYSIA AND ITS RELATIONSHIP WITH SOIL PROPERTY VARIATION. 10
5 YEARS OF DATA - WHERE TO NOW? 12
DIGITAL ELEVATION MODELS AS A CRUCIAL LAYER FOR PRECISION AGRICULTURE 13
FORECASTING YIELD IN RICE CROPS USING REMOTE SENSING AND CROP GROWTH MODELS 14
YIELD AND PROTEIN VARIATION WITHIN A CONTROLLED TRAFFIC SYSTEM 15
PRECISION AGRICULTURE: FROM A VERY MOBILE PERSPECTIVE 16
VARIABLE-RATE NITROGEN APPLICATION IN COTTON 17
SITE-SPECIFIC WEED CONTROL - CAN WE PREDICT WEED DISTRIBUTIONS ACCURATELY 18
AGRONOMIC PRINCIPLES FOR IMPROVED INTERPRETATION OF THE YIELD MAP 19
PRECISION AGRICULTURE: A COMMERCIAL SYSTEMS APPROACH 20
CASE IH - NEW INITIATIVES IN PA 21
APPENDIX A 23
YIELD AND PROTEIN VARIATION WITHIN A PLANTER WIDTH 23
Page 3 of 24 Symposium on Precision Agriculture 2000 Universitas Sidneiensis
Welcome Alexander McBratney, The Australian Centre for Precision Agriculture, The University of Sydney I would like to welcome the Australasian Precision Agriculture community to our 4th Symposium on Precision Agriculture. It's great to see you again. Once again we have representatives from industry, research organizations, growers and consultants. A few intrepid Australians, who enjoy good food and fine wine, travelled to Minneapolis a couple of weeks ago to attend the 5th International Conference on Precision Agriculture with its 700 attendees. I think we came away with the conclusion that the `management zone' concept, which we advocate and on which we base much of our research here, has been vigorously taken up in the US. There was hardly any talk about grid sampling. Decision-support models and education are still the major stumbling blocks to implementation. However there is a growing realisation that these aspects are very necessary as "Precision Ag practitioners continue their pursuit of precision by turning data into decisions." Meanwhile, economic studies are now beginning to show advantages of precision management and the specialist software providers are beginning to merge. I expect a degree of rationalisation both in software and hardware over the next few years. In Australia we are seeing considerable activity in the cotton, grains and wine industries, and no doubt others will soon follow. However given the potential benefits of precision management our research effort is very small compared with the US and some European countries. Germany has for example one 40 million DM ($A37 million) project and many other smaller ones. Brazil, with the third largest delegation at the international conference after the US and Canada, is also emerging as a force in precision agriculture. I believe we are doing excellent research here in Australia. In some aspects we lead the world. But we are suffering a lack of recognition, particularly by government. Agricultural debate rages on the negative aspects of GMOs and biotechnology, the environment and land clearing, and deregulation. We, on the other hand, have a positive message. The application of information technology to agriculture is profitable, can create jobs in the bush, is environmentally friendly, and can give consumers a deserved confidence in the production process. We should sell this message vigorously, it's a good message. If not we'll fall behind _ no medals for us.
Page 4 of 24 Symposium on Precision Agriculture 2000 Universitas Sidneiensis

Enjoy what our speakers have to say. They truly are unrecognised pioneers. You will hear much wisdom today. There is a great future here, if we can only grab the public's attention.
Alex McBratney on behalf of the Staff & Students at the Australian Centre for Precision Agriculture
Page 5 of 24 Symposium on Precision Agriculture 2000 Universitas Sidneiensis
The Opportunity for Precision and Management in Agriculture Brett Whelan, The Australian Centre for Precision Agriculture, University of Sydney The management qualities of Australian farmers can be argued as the single most important contributor to the efficiency of our internationally competitive cropping industries. Efficient managers operate by gathering relevant information on their production process and employing it in critical decisions. Without information, operational decisions are essentially left to guesswork. As we attempt to gain even greater efficiency in our agricultural production, it is the information on variability in resources (soil /climate/inputs) and output (yield) that becomes more relevant. Step forward Precision Agriculture. Precision agriculture is in general, a scientific endeavour to improve the management of agricultural industries through improvements in the detail and quality of information available. This improvement must be considered in terms of profitability and environmental impact (both short and long term). In this context, site-specific crop management (one form of Precision Agriculture) can be defined as: `Matching resource application and agronomic practices with soil and crop requirements as they vary in space and time within a field'. Implied in this definition, is the quantification of spatial and temporal variability in important crop and soil parameters. This variability must be correctly characterised before it can be used in management decisions. The possible decisions have focused on the variable-rate application (VRA) of inputs, based on the intuitive economic and environmental attractiveness, a desire for technological advancement in production and because we can. It should be remembered that this information is aimed at improving production. A paddock may not prove "variable enough" for VRA in any crops or in certain crops. Some crops may show up as financially unsuitable for some paddocks. Areas may consistently display a financial loss in all crops and warrant consideration of alternative uses. Boundary changes may become apparent to avoid VRA. Production information in greater detail (e.g. yield maps) may be used for financial dealings in town or for future land purchases. Application maps, whether VRA or not, may prove useful in checking application accuracy and avoiding litigation in the future. The list goes on. The first hurdle is to decide what the variability observed in yield and soil properties is suggesting. Figure 1 provides an example of the decision process that could be employed following a study of field variability. This model begins with the premise that variability in crop yield is the initial signal that VRA might be warranted. Another model might begin with the observation of soil variability. However, until the environmental cost of fertiliser wastage is imposed as a grower penalty in Australia, the economic imperative of optimising crop yield will no doubt guide management decisions.
Page 6 of 24 Symposium on Precision Agriculture 2000 Universitas Sidneiensis
In this model, differential treatment is then examined as an option based on: a) the degree of variation (magnitude/spatial pattern) b) the cause/s of variation c) suitability for management intervention
Continuously variable treatment or division of a field into management sub-units is determined based on the spatial dependency observed. Again, this decision marks the point of a conceptual schism. If variability and treatment can be observed and controlled at a fine scale then the question becomes: Should fields be treated as continuously variable in yield potential or can some classification into management units of `homogeneous' yield potential be accepted? If the later is chosen then another question arises: Should these units be treated with uniform rates of ameliorants if the controlling factor for application was not used to define the management unit? The answers to such questions are most likely complex and as yet unknown. Options at this point in the model are more than likely governed by limiting factors such as technology, economics and lack of research.
Page 7 of 24 Symposium on Precision Agriculture 2000 Universitas Sidneiensis
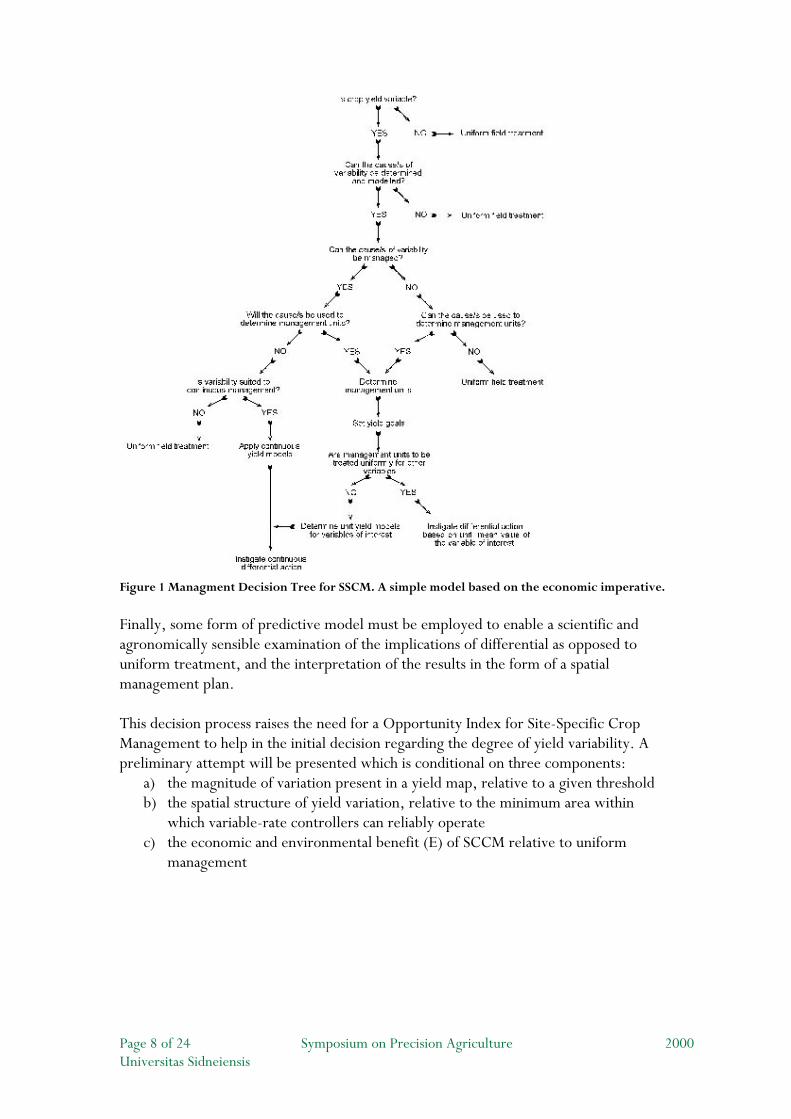
Figure 1 Managment Decision Tree for SSCM. A simple model based on the economic imperative. Finally, some form of predictive model must be employed to enable a scientific and agronomically sensible examination of the implications of differential as opposed to uniform treatment, and the interpretation of the results in the form of a spatial management plan. This decision process raises the need for a Opportunity Index for Site-Specific Crop Management to help in the initial decision regarding the degree of yield variability. A preliminary attempt will be presented which is conditional on three components:
a) the magnitude of variation present in a yield map, relative to a given threshold b) the spatial structure of yield variation, relative to the minimum area within
which variable-rate controllers can reliably operate c) the economic and environmental benefit (E) of SCCM relative to uniform
management
Page 8 of 24 Symposium on Precision Agriculture 2000 Universitas Sidneiensis

Application of PA Systems in New Zealand I.Yule1, J.P.Praat2 ,M.Craighead3 1Massey University, New Zealand 2Lincoln Ventures, New Zealand
3Ravensdown Fertilisers, New Zealand
The paper describes a number of projects involving the New Zealand Centre for Precision Agriculture. In addition to arable cropping, applications involving pastoral systems are illustrated. These include applying variable rate technology (VRT) for aerial application of fertiliser. An investigation into spatial variation within an intensively managed rotational grazing system is also described. The importance of information on quality is illustrated through observation of the production process in an apple orchard where a bin tracking system has been tested. GIS has been used in this application to provide maps of crop quality as well as yield. A comprehensive project on arable cropping is summarised and some implications of the work are discussed. Three properties in the Canterbury Plain were selected, within each property a single paddock was used for intensive investigation, over 9,000 measurements have been taken of soil and crop related factors. Although the study has not been completed some interesting results have emerged. The authors wish to demonstrate the many possibilities for spatial technologies to be utilised to improve management strategies and standards. A final sequence of slides illustrates just how far we have to go before user needs will be satisfied.
Page 9 of 24 Symposium on Precision Agriculture 2000 Universitas Sidneiensis
Progress in the Development of Precision Viticulture - Variation in Grape Yield and Quality in Coonawarra and Sunraysia and its Relationship with Soil Property Variation. Robert G.V. Bramley, CSIRO Land and Water and Cooperative Research Centre for Viticulture, Glen Osmond, SA. The recent commercial availability of yield monitoring equipment for winegrape harvesters presents grape and wine producers with opportunities to tailor production of both grapes and wine according to expectations of vineyard performance and desired goals in terms of both yield, quality and the environment; the results of a recent survey suggests that grape growers are keen to take up these opportunities. However, successful adoption of the new technology depends, amongst other things, on an understanding of the factors driving vineyard variability and of the temporal stability of spatial variation in vineyard performance. In this presentation, some results from the 1999 and 2000 vintages will be discussed with respect to variation in grape yield and quality and soil depth variation at two sites in Coonawarra and Sunraysia with contrasting soils, climate and management. In both Coonawarra and Sunraysia yield variation was substantial and of a similar order of magnitude in both 1999 and 2000 in spite of a substantial difference in the mean yield between the two years. For example, in Coonawarra, 1999 yields ranged from approximately 0 to 18 t ha-1 with a mean yield of 6.2 t ha-1 whilst in the more difficult 2000 vintage, the mean yield was only 4.6 t ha-1. At the much higher yielding Sunraysia site, 27.9 t ha-1 were produced in 1999 compared to only 17.3 t ha-1 in 2000. However, the pattern of yield variation at both sites was remarkably consistent over the two years as evidenced by a comparison of the normalised yields obtained for the two years. At both sites, this comparison suggested that relative to the mean yield obtained in a given year, the poorer producing parts of the vineyard tended to perform even less well at the 2000 vintage compared to 1999, whilst the better parts were still relatively better. Analysis of EM38 survey data in the context of soil depth using moving window regression suggests that at Coonawarra, EM38 is a robust predictor of soil depth to within ± 20mm over more than 90% of the vineyard, and that the low yielding areas correspond to zones of shallow soil. Consequently there is a limited volume of soil in the root zone and correspondingly limited available water. Thus, in a water limited year such as 2000 when hot and dry conditions were experienced at both sites post-veraison, the shallowest soils are less well able to supply the vines with water than deeper soils and so, relative to the mean, perform particularly poorly; conversely, the deepest soils perform relatively well. Whilst we do not yet have similar quantitative depth and EM38 data for the Sunraysia site, a knowledge of the vineyard suggests that the sandy A horizon is at its shallowest, and the slowly permeable clay subsoil closest to the surface, in the lowest yielding zone of the vineyard.
Page 10 of 24 Symposium on Precision Agriculture 2000 Universitas Sidneiensis
In Coonawarra in 1999, grape maturity (Bé) followed a similar, but inverse spatial pattern to yield and acidity (TA) also tended to be greatest in areas of low yield. In contrast, variation in colour was less obviously related to variation in other properties. These results, together with those from the EM38 survey suggest that careful soil management could promote greater control over variation in grape yield and some aspects of quality. However, covariation of soil and vine/grape indices does not appear to be constant in space. Thus, we conclude that an improved understanding of the relationships between the inputs to grape production systems and their outputs is required if targeted management is to be successful. Further work at both sites therefore aims to further quantify the factors driving variation in both grape yield and fruit quality with a view to identifying opportunities for targeted management and the successful adoption of precision viticulture
Page 11 of 24 Symposium on Precision Agriculture 2000 Universitas Sidneiensis

5 Years of Data - Where to Now? Jon Medway, Farrer Centre for Conservation Farming, Charles Sturt University, Wagga Wagga, NSW.
Since the first yield maps in southern NSW where generated in 1995 there has been an explosion of data capture, farmer involvement and interest and commercial service provision, yet the question of the role of this technology is still being asked. The focus of activities at Charles Sturt University's Farrer Centre has been the investigation of the extent of variability present in typical dryland farming paddocks. Intensive monitoring activites are being used to quanitfy how much crop parameters are varying to identify the potential for precision agriculture apppications. Remote sensing, electromagnetic surveying and other data sources are then being used to investigate and determine the most appropriate strategies for collection of the necessary information. With the goal being improved crop management, not maximun use of technology, research and farmer experience has shown that grid sampling is not essential in taking the first steps towards improved crop management and that simple activities can provide substantial cost savings.
Page 12 of 24 Symposium on Precision Agriculture 2000 Universitas Sidneiensis
Digital Elevation Models as a Crucial Layer for Precision Agriculture Tom. Bishop, The Australian Centre for Precision Agriculture, University of Sydney An often ignored aspect of GPS technology is the ability to measure position in three rather than two dimensions. Major reasons for this include the poor positional accuracy of standard differential GPS and secondly, and most importantly, the price of carrier phase GPS capable of decimeter vertical accuracy. In the near future both impediments should be removed with improving technology and declining prices resulting in the increased availability of decimeter vertical accuracy GPS. Once obtained an elevation map is particularly useful as it provides a representation of the land surface which enables the derivation of attributes which can be directly related to processes affecting crop growth. Examples include:
a) Water movement and accumulation in the landscape b) Solar irradiation due to changes in slope and aspect c) Erosional processes
This presentation will cover the use of GPS technology for the creation of digital elevation models, includng:
a) Interpolation of the elevation data b) The accuracy of the elevation data c) A possible sampling methodology
Finally the use of digital elevation models will be examined with an example of mapping with-in field erosion risk.
Page 13 of 24 Symposium on Precision Agriculture 2000 Universitas Sidneiensis
Forecasting Yield in Rice Crops using Remote Sensing and Crop Growth models David W. Lamb, Cooperative Research Centre for Sustainable Rice Production, Farrer Centre, Charles Sturt University, Wagga Wagga, NSW. Predicting crop yield using remote sensing traditionally relies on empirical correlations between crop density/biomass and ultimate yield. However, primarily due to the influence of climate, the strength of any direct relationship between remotely-estimated crop canopy parameters and yield generally degrades as the time interval between estimation and harvest increases. This consequently limits the interval of reliable forecasts to only a couple of weeks. The integration of remotely-sensed images of crops with crop growth models allows the user to model the impact of a range of climatic conditions, and consequently to produce more reliable crop yield estimates from much earlier in crop development. Furthemore, the use of metre-resolution imagery offers the option of estimating yield in the form of metre-resolution maps. This presentation will outline progress in incorporating multispectral airborne imagery of rice crops with a crop growth model to predict yield. Preliminary results suggest rice yields may be estimable to an accuracy of better than 2 t/Ha as early as 15 weeks prior to harvest.
Page 14 of 24 Symposium on Precision Agriculture 2000 Universitas Sidneiensis
Yield and Protein Variation Within a Controlled Traffic System Troy Jensen, Graham Powell and Tim Neale, National Centre for Engineering in Agriculture, Department of Primary Industries, Queensland. Although co-operators Jamie Grant and Rob Taylor had implemented a Controlled Traffic Farming (CTF) system more than 5 years ago, the harvester wheeltracks did not match those used for the rest of their operations. Their configuration consisted of three separate sets of `tramlines' through their paddocks and occurred between rows 3 to 10. The boom spray, trailed behind a Toyota utility, was on 60 inch (1520 mm) centres, matching the tractor used for planting. The inside dual of header along with the wheels of the chaser bin was on 120 inch (3050 mm) and the outside dual of the header used an 180 inch (4570 mm) track. In an attempt to quantify crop variation on a micro-scale within this system, the officers measured row-by-row variation in crop yield and protein at Jamie Grant's property at Jimbour, Queensland. Trials were conducted on two crops of grain sorghum (Sorghum bicolor) and a crop of maize (Zea mays). One of the sorghum crops and the maize crop were not fully analysed due to expense and infrastructure limitations. The raw data was imported into Microsoft Excel and the contour plot capacity was utilised to produce the yield maps presented below. It should be noted that the raw data was used to produce the graphs and no smoothing or processing was performed. Other trials on sorghum have not been presented. When carrying out controlled traffic farming operations, there is a yield benefit in matching all wheeltracks of the farming system. Although the harvester is difficult to intergrate into the system , it can be done as Jamie and Rob have shown. There is a direct benefit in minimising the number of sets of wheeltracks in the paddock and this is to maximise the yield potential. The research also shows that there is considerable yield variation within paddocks at a sub-harvester scale. Although full statistical analysis has not been carried out, `relative' yields in each sample plot demonstrate that compaction may have an effect on yield. View a version with images in Appendix A
Page 15 of 24 Symposium on Precision Agriculture 2000 Universitas Sidneiensis
Precision Agriculture: From a Very Mobile Perspective Ian Pine, Horizon Harvesting Pty Ltd, Gunnedah, NSW "PA is gathering information for better management" says Brett. "It's not the technology that counts _ it's how you use it" says Alex. After 4 years of gathering yield information in grain crops and reporting to our farmer clients with colourful maps and statistical records we believe that it's time farmers took hold of the technology now available to upgrade the profitability and sustainability of Australian grain production. Our experience relates to harvesting 17 crop types including cereals, oilseeds and pulses for 87 farmer clients geographically spread over 1,500 kilometres from Roma to Rand.
Page 16 of 24 Symposium on Precision Agriculture 2000 Universitas Sidneiensis
Variable-Rate Nitrogen Application in Cotton Craig Stewart, The Australian Centre for Precision Agriculture, University of Sydney, NSW.
An area in which the development of technologies associated with precision agriculture is expected to bring significant benefit is through the variable-rate application of fertilisers. The technology to apply different rates of fertiliser within a single field already exists, however no method for determining fertiliser rates at this scale has been developed, relevant to cotton in Australia. To examine this the Cotton Research and Development Corporation established a project aimed at testing a number of methods for applying nitrogen fertiliser site-specifically. A majority of the research into variable-rate fertiliser application has focused on either developing a `nutrient budget' for a crop based on pre-sowing soil levels and crop nutrient uptake or by identifying similar regions of yield potential within a field termed `management zones' by coalescing both spatial and temporal data sources. In this study, measurement of pre-sowing soil nitrate levels from directed soil sampling within each field based on yield maps and soil electrical conductivity data enabled a nitrogen fertiliser requirement map to be generated using NutriLOGIC recommendations. Secondly, multivariate clustering of a number of spatial data layers was used to determine homogeneous zones within each field which then received fertiliser based on their estimated yield potential. Both methods were implemented simultaneously within each field as well as the traditional fertiliser approach used by the farmer as a means of comparison. Results to date showed no yield improvement but increased fertiliser efficiency use by employing the variable-rate strategies. These results were due mainly to the inadequacy of the current fertiliser recommendations for predicting site-specific requirement. At both sites, fertiliser rates were much too high. Encouragingly, the management zone approach was very successful at dividing the field up based on yield potential. Once fertiliser recommendations specific to a management zone have been developed, the benefits of a variable-rate approach should be forthcoming.
Page 17 of 24 Symposium on Precision Agriculture 2000 Universitas Sidneiensis
Site-Specific Weed Control - Can We Predict Weed Distributions Accurately Lisa Rew, NSW Agriculture, Tamworth Centre for Crop Improvement, Tamworth, NSW Numerous studies have demonstrated the patchy distribution of weeds within-fields. The majority of these studies have used discrete sampling; recording weed densities at the intersections of regular grids. In this study, Avena spp. seedlings were recorded on square grids at four sites. The data were then divided into test and real data sets, using the whole, two-thirds and half of the data, to evaluate the consistency of global variogram models and accuracy of ordinary kriging estimates. Kriging provided poor weed density estimates at both very low and high densities, i.e. data were smoothed, when compared with true values. Grid sampling took considerable time and therefore money to complete, whereas continuous sampling with multispectral imagery (performed at one site) was much quicker, cheaper and at a finer resolution. It is suggested that continuous sampling is more appropriate for site-specific weed management at present. However, it may be possible to improve estimates of weed density and distribution from discrete data, by using other spatial analysis techniques, e.g. spatial-point-process analysis, heterotopic co-kriging, regression kriging, etc. Such methods should be evaluated.
Page 18 of 24 Symposium on Precision Agriculture 2000 Universitas Sidneiensis
Agronomic Principles for Improved Interpretation of the Yield Map Wayne Strong, Rob Kelly, Troy Jensen, David Butler, Farming Systems Institute, Queensland Department of Primary Industries, Toowoomba, QLD In Australia's northern cereal region, supplies of water and nitrogen frequently limit cereal crop production. Grain protein concentration of wheat and other cereal crops grown in this region appears to be a reliable, though retrospective, indicator of relative supplies of water and nitrogen available for the crop. For example, low wheat protein (<11.5%) is recognised as originating from crops to which the nitrogen supply frequently limits grain yield and is therefore likely to be the primary limiting factor to production. Alternatively, high wheat protein (>13%) is recognised as originating from crops to which the water supply frequently limits grain yield and is therefore likely to be the primary limiting factor to production. Mapping grain protein and grain yield coincidently, therefore, should identify sites where nitrogen and / or water supplies are likely to have been the primary cause for yield variation in cereal crops like wheat, barley and sorghum. These and other inferences about supplies of water and nitrogen, obtained from regional nutrition trials, are being applied on a site-specific basis to coincidental maps of grain yield and grain protein concentrations gathered from northern cereal crops in 1998 and 1999.
Page 19 of 24 Symposium on Precision Agriculture 2000 Universitas Sidneiensis
Precision Agriculture: A Commercial Systems Approach Nick Raleigh, SST Development Group Australia Pty Ltd
Over the past 12 months, SST Development Group Australia Pty Ltd has been involved in some exciting developments in Precision Agriculture in Australia. SST has grown steadily in this time and is reaching into a range of agricultural markets through our relationship with various participants in the Precision Ag industry. SST is witnessing considerable growth in the number of organizations participating in or offering data collection and analysis services. These businesses include well-established retail organizations, private consultants and farmer groups. There is an exciting increase in the number of agricultural contracting operations that are equipping themselves with precision ag tools such as GPS receivers, light bar guidance, moving map displays and yield monitors. Importantly, interested members of the agricultural community are acknowledging the importance of "open systems" architecture and not being limited by file types, closed systems, etc. Companies that continue to offer format import/export services and couple this with data management, analysis capabilities and reporting functionality will consolidate their position in the Australian precision ag market. The SST Information Lab program is advancing rapidly both here and in the USA with 11 Information Labs now operating in the USA. Queensland Cotton is the newest member of the Information Lab program, servicing primarily the Australian cotton industry with precision ag services offered by their SciAg program
Page 20 of 24 Symposium on Precision Agriculture 2000 Universitas Sidneiensis
Case IH - New Initiatives in PA Robert Lindores and Keiran Hogan, Case IH Our objective in this presentation is to give an overview of our company's plans and current activities in respect of new products, particularly the imminent grain analyser. We'll approach this by cutting the presentation into three topics,
a) First there's the big idea - what's CaseIH trying to achieve with AFS. b) Then we'll overview some of the products, so you see what's new and available. c) Finally we will look at the new protein monitor, and some associated issues.
The AFS objective: We think we have an opportunity, even a responsibility, to make sure our machines integrate the most useful and productive technologies available. These new advanced technologies belong in machines, they make combines tractors, seeders, planters and sprayers more useful, more productive and more valuable. New Yield Monitor: We've just introduced the new universal display plus monitor, and this is fitted standard it to most new CaseIH combines. This monitor is portable, designed to be carried from tractor to harvester, to picker, to sprayer, and so on. It is not set up for all those machines yet, but that's the plan, and so far it works with combines, and with most of our tractor ranges where it connects with CaseIH planters and concord air seeders. The Universal Display Plus is a smart device. "Plug & play" it knows where it is, so when installed in a CaseIH Axial Flow combine it knows its in a combine and presents itself accordingly. Likewise, connected to a concord seeder, it opens ready to control the seeder. The objectives with this new yield monitor are to:
a) Improve user friendliness b) Lower the training requirement c) Improve versatility d) Adopt the CAN BUS interface
The information is now stored on an ATA flash card, which will hold about 480 operating hours of information in total, more than a year's harvesting for most machines in this country. Operating in seeding/planting mode, the Universal Display Plus presents information such as rate of seed or fertiliser being delivered, bin levels, etc. The rate can be changed on the go, and the display presents accordingly. In automatic mode the operator makes a prescription map, before the sowing season, on the office computer, and loads that into the UD+, using the ATA flash card. Selecting auto mode, the machine sows to this set of instructions.
Page 21 of 24 Symposium on Precision Agriculture 2000 Universitas Sidneiensis
The operator can over-ride the system at any time, and go back to manual sowing. If selected, the system will make an "as applied" map at the same time as delivering the prescription. If sowing is carried out in auto mode, the prescription map will be identical to the as applied map, if the operator sometimes reverts to manual mode, the "As Applied" map will be different to the prescription map. Up to four material rates, can be controlled, for example two grains, a granular fertiliser and anhydrous ammonia. Software: CaseIH has released AFS 2000 software. The new CD includes Instant Yield Map 2000, and Instant Application Map 2000. Both these softwares are supplied standard with all the Universal display Plus monitors, whether with combine or seeder. To simplify administration there's no longer a requirement for unlock codes, the disk is simply installed to the computer, then follow the instructions. The concept behind AFS 2000 is to provide simple, general purpose software, user-friendly, intuitive, and with low training/experience requirement. Future Products: Three propositions in respect of grain farming are put forward and discussed:
a) Quality is paramount b) The Virtual Warehouse will be a part of the future of grain marketing c) The farmer who knows what he/she's got to sell has more bargaining power
The Grain Quality Analyser is a tool that addresses all these three propositions. It will help manage quality, help market grain in the virtual warehouse, and is the real answer for farmers wanting to know how best to go to market with grain. Technology, operation, calibration, cost, availability, and accuracy are all discussed. A number of future issues are identified and discussed. These are:
a) Calibration issues, including standard protocols. b) Sources of value in the new grain price environment c) Marketplace understanding of accuracy and consistency
Page 22 of 24 Symposium on Precision Agriculture 2000 Universitas Sidneiensis

Appendix A
Yield and Protein Variation Within a Planter Width Troy Jensen, Graham Powell and Tim Neale, National Centre for Engineering in
Agriculture, Department of Primary Industries, Queensland.
Page 23 of 24 Symposium on Precision Agriculture 2000 Universitas Sidneiensis
YIELD AND PROTEIN VARIATION WITHIN A PLANTER WIDTH Troy Jensen, Graham Powell and Tim Neale
National Centre for Engineering in Agriculture, Department of Primary Industries, Queensland. PO Box 102, TOOWOOMBA QLD 4350, email: [email protected]
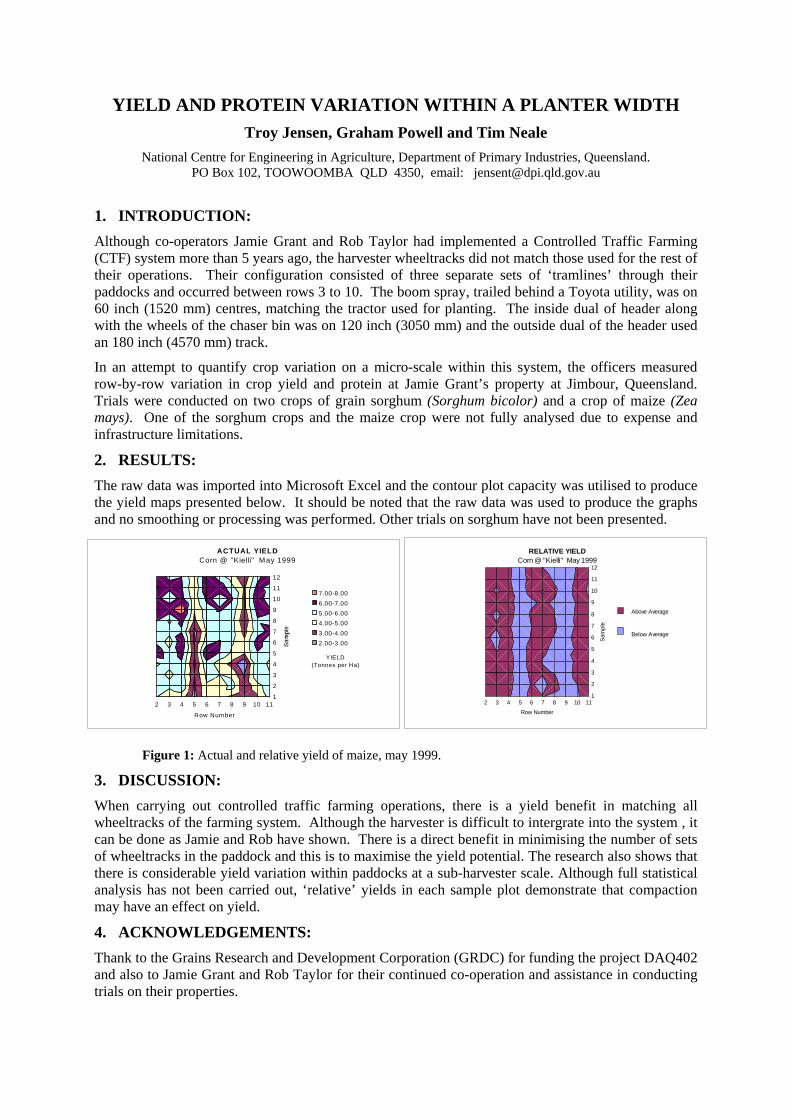
1. INTRODUCTION: Although co-operators Jamie Grant and Rob Taylor had implemented a Controlled Traffic Farming (CTF) system more than 5 years ago, the harvester wheeltracks did not match those used for the rest of their operations. Their configuration consisted of three separate sets of ‘tramlines’ through their paddocks and occurred between rows 3 to 10. The boom spray, trailed behind a Toyota utility, was on 60 inch (1520 mm) centres, matching the tractor used for planting. The inside dual of header along with the wheels of the chaser bin was on 120 inch (3050 mm) and the outside dual of the header used an 180 inch (4570 mm) track.
In an attempt to quantify crop variation on a micro-scale within this system, the officers measured row-by-row variation in crop yield and protein at Jamie Grant’s property at Jimbour, Queensland. Trials were conducted on two crops of grain sorghum (Sorghum bicolor) and a crop of maize (Zea mays). One of the sorghum crops and the maize crop were not fully analysed due to expense and infrastructure limitations.
2. RESULTS: The raw data was imported into Microsoft Excel and the contour plot capacity was utilised to produce the yield maps presented below. It should be noted that the raw data was used to produce the graphs and no smoothing or processing was performed. Other trials on sorghum have not been presented.
2 3 4 5 6 7 8 9 10 111
2
3
4
5
6
7
8
9
10
11
12
Row Number
ACTUAL YIELD Corn @ "Kielli" May 1999
7.00-8.006.00-7.005.00-6.004.00-5.003.00-4.002.00-3.00
YIELD(Tonnes per Ha)
2 3 4 5 6 7 8 9 10 111
2
3
4
5
6
7
8
9
10
11
12
Row Number
Sam
ple
RELATIVE YIELD Corn @ "Kielli" May 1999
Above Average
Below Average
Figure 1: Actual and relative yield of maize, may 1999.
3. DISCUSSION: When carrying out controlled traffic farming operations, there is a yield benefit in matching all wheeltracks of the farming system. Although the harvester is difficult to intergrate into the system , it can be done as Jamie and Rob have shown. There is a direct benefit in minimising the number of sets of wheeltracks in the paddock and this is to maximise the yield potential. The research also shows that there is considerable yield variation within paddocks at a sub-harvester scale. Although full statistical analysis has not been carried out, ‘relative’ yields in each sample plot demonstrate that compaction may have an effect on yield.
4. ACKNOWLEDGEMENTS: Thank to the Grains Research and Development Corporation (GRDC) for funding the project DAQ402 and also to Jamie Grant and Rob Taylor for their continued co-operation and assistance in conducting trials on their properties.