Embed Size (px)
Citation preview
Saskatchewan Geological Survey 1 Summary of Investigations 2012, Volume 2
The Athabasca Basin Ore-systems Project: An Update on Geochemistry, Spectral Data, and Core Logging
Sean A. Bosman, Colin D. Card, Scott G. MacKnight 1, and Stephanie Boulanger 2
Bosman. S.A., Card, C.D., MacKnight, S.G., and Boulanger, S. (2012): The Athabasca Basin ore-systems project: an update on geochemistry, spectral data, and core logging; in Summary of Investigations 2012, Volume 2, Saskatchewan Geological Survey, Sask. Ministry of the Economy, Misc. Rep. 2012-4.2, Paper A-5, 10p.
Abstract The Athabasca Basin ore-systems project is a multi-faceted approach to providing publicly available geoscience related to the uranium deposits associated with the Athabasca Basin. The project’s goal is to create a geologically meaningful three-dimensional (3-D) model of the Athabasca Basin. The geological framework will act as a display area for various datasets, both old and new, that can be interpreted in the 3-D environment. This new perspective will provide insights into the ore-forming processes in the Athabasca Basin. The most significant components for advancement of the Athabasca Basin 3-D model include: 1) data collection necessary to construct a best-fit geologic model for the Athabasca Basin, 2) regional compilation of geoscience information, and 3) generation of new data. Based on these components, a new sub-Athabasca Group unconformity surface was created which, in turn, was utilized to estimate the present day volume of Athabasca Group to be ~59 000 km3. The products of the 3-D modelling are also now digitally available from the Saskatchewan Geological Survey as a new data type called ‘3-D Files’.
During its second year, the program has included the collection of: 1) several supplementary geochemical datasets, 2) additional spectral data, and 3) drillcore data including sandstone and basement logs from the Key Lake area and archived drillcores in Regina. Samples for geochemical analysis were collected from outcrop and drillcores in an attempt to have ~100 samples from each of the Athabasca Group formations and some stratigraphic members. At present, the geochemical dataset includes 837 outcrop samples and 385 drillcore samples. Collection of spectral data, utilizing an Analytical Spectral Device, continued in the summer of 2012. A total of 16 drillcores have now been analysed with sample spacing between 0.75 and 1.5 m. The results from the short-wave infrared spectral analysis show some very abrupt changes in the mineralogy at many of the Athabasca Group lithostratigraphic contacts. In particular, the unconformity surface between the Manitou Falls and Lazenby Lake formations contains a sharp change from dickite to kaolinite.
Drillcore logging continues to support refinements in the outcrop extent of the Athabasca Group sedimentary rocks and thus to the Athabasca Basin geology map. The two Davy Lake drillcores support the presence of a lithostratigraphic high near the centre of the basin. These holes are also positioned on either side of an unnamed major brittle fault with a minimum vertical offset of 192 m. In addition, the Davy Lake drillholes contain a significant amount of diabase, likely part of the Mackenzie suite, which has resulted in silicification of the core. Other modifications to the Athabasca Basin geology map include changes to the extent of the Wolverine Point and Lazenby Lake formations. The interpreted outcrop extent of the sub-Athabasca Group unconformity has also been improved. In the Key Lake area, 49 basement logs and 18 sandstone logs were completed, in addition to 13 sandstone and eight basement logs from archived drillcores at the Subsurface Geological Laboratory in Regina.
Keywords: Athabasca Basin, uranium ore systems, Athabasca Group, lithostratigraphy, Davy Lake, Manitou Falls, Lazenby Lake, Wolverine Point, Locker Lake, digital core logging, 3-D modelling, Analytical Spectral Device (ASD), geochemistry, diagenesis.
1. Introduction The Saskatchewan Geological Survey’s Athabasca Basin ore-systems project, initiated in 2011 (Bosman et al., 2011), represents the next generation of a publicly funded geoscience initiative and builds on past Athabasca Basin projects including EXTECH IV (Jefferson and Delaney, 2007) as well as Saskatchewan Geological Survey lithostratigraphic work (Bosman and Schwab, 2009) and basement mapping peripheral to the basin (Card, 2009). Ore-systems projects are designed to study both the regional and local processes involved in the genesis of
1 Department of Geology, University of Regina, 3737 Wascana Parkway, Regina, SK S4S 0A2. 2 Department of Geology, University of Saskatchewan, 114 Science Place, Saskatoon, SK S7N 5E2.
Saskatchewan Geological Survey 2 Summary of Investigations 2012, Volume 2
economic ore deposits in a particular environment rather than using the traditional ore-deposit model approach in which the host rocks are the most important factor. The postulated result is a better understanding of processes that have made the Athabasca region a prolific source of uranium since the 1950s.
The Athabasca Basin ore-systems project is a multi-faceted initiative that involves both regional compilation and new geoscience. The goal of the project is to present data in the 3-D environment 3 using Mira Geoscience’s ParadigmTM GOCAD® Mining Suite (GOCAD). The project is broken down into several components, the most significant ones being: 1) field- and office-based data collection aimed at furthering our understanding of both the Athabasca Group and the underlying basement; 2) regional compilation of available geoscience information, and 3) generation of new data and its addition to existing data in order to better understand the ore-forming processes (Bosman et al., 2011).
During the past research year, data of several types were collected and produced. This paper contains information on how these data were collected, their current availability status and, if available, where they can be obtained. It also provides a preliminary interpretation of the spectral data collected from the Rumpel Lake drillcore, lithostratigraphic results of the Davy Lake drillcores (Bosman et al., 2011), changes to the outcrop map of the Athabasca Basin, and advancements completed on the 3-D model.
2. Data Collection in 2012
a) Geochemical Data
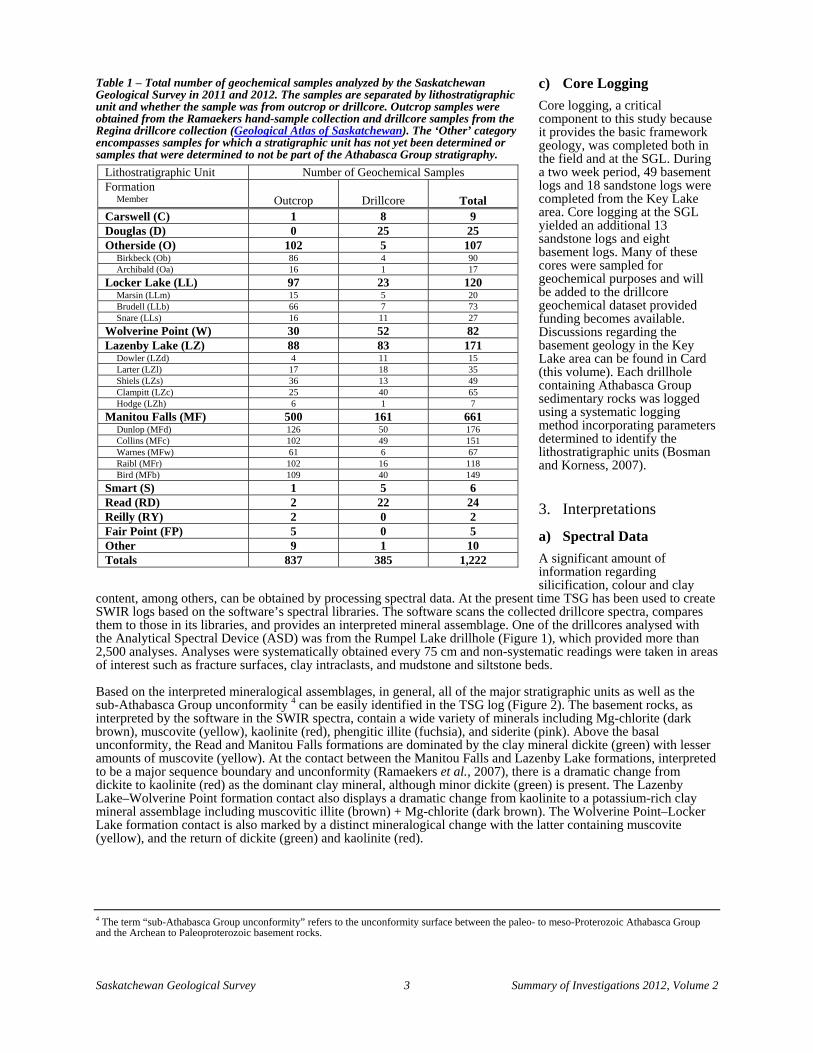
This past winter/spring we continued to utilize the Subsurface Geological Laboratory (SGL) in Regina by collecting new geochemical data from archived rock samples of the Athabasca Group which were collected between 1975 and 1981 (Ramaekers, 1990). In 2011, 642 samples from this set were selected to provide a good spatial distribution across the Athabasca Basin and analyzed for whole-rock geochemistry (Card et al., 2011). In 2012, a supplementary whole-rock geochemical dataset, which included 195 additional samples, was obtained to augment the results published in 2011. These samples were selected to achieve a statistically meaningful representative suite (~100 samples) for each of the Athabasca Group formations and, in some cases, formation members (Card and Bosman, 2012). In addition to this outcrop geochemical dataset, samples were collected from 10 drillcores stored at the SGL. These samples were analyzed using the same geochemical package as the outcrop data. Sandstone from each drillcore was sampled at ~20 m spacing in addition to an occasional representative sample collected in areas of interest such as mudstones or siltstones (Bosman and Card, 2012). This sample spacing was chosen because it is similar to the spacing used in the Industry Drillcore Data geochemical dataset (Saskatchewan Ministry of Energy and Resources, 2010). The drillcores were selected to: 1) augment the Industry Drillcore Data dataset, and 2) to increase the number of samples in units for which the outcrop geochemical dataset contained less than 100. In total, 1,242 samples have been analysed – 837 from outcrops and 385 from drillcores (Table 1). Future additions to this geochemical dataset are planned.
b) Spectral Data
Collecting spectral data is another component of the Athabasca Basin ore-systems study. To date, 16 drillcores have been analysed using a FieldSpec® Pro FR portable spectroradiometer (Analytical Spectral Devices, Inc.). This instrument measures spectral radiance in the visible (VIS, 350 to 780 nm), near infrared (NIR, 780 to 1300 nm), and short-wave infrared (SWIR, 1300 to 2500 nm) regions. Spectral resolution ranges from about 3 nm in the visible and near infrared regions up to 10 nm in the SWIR region (Percival et al., in press). Four drillcores were analysed in 2010 using 75 cm spacing. An additional 12 drillcores were analysed in the summer of 2012, initially using 75 cm spacing, which was increased to 1.5 m to improve productivity.
Processing of the spectral data is done with ‘The Spectral Geologist Pro’ (TSG) software, distributed by AusSpec International. Using the spectral libraries of the software, eight of the 16 drillcores have been interpreted based on the SWIR spectra. A discussion of some of these findings will be presented later in the paper.
3 The phrase “the 3-D environment” encompasses all aspects of 3-D modelling including 2.5-D, 3-D, and 4-D space: 2.5-D space is where 2-D objects are displayed in the third dimension; true 3-D space contains objects that are volumes, and 4-D space attempts to bring a temporal component to the modelling.
Saskatchewan Geological Survey 3 Summary of Investigations 2012, Volume 2
Table 1 – Total number of geochemical samples analyzed by the Saskatchewan Geological Survey in 2011 and 2012. The samples are separated by lithostratigraphic unit and whether the sample was from outcrop or drillcore. Outcrop samples were obtained from the Ramaekers hand-sample collection and drillcore samples from the Regina drillcore collection (Geological Atlas of Saskatchewan). The ‘Other’ category encompasses samples for which a stratigraphic unit has not yet been determined or samples that were determined to not be part of the Athabasca Group stratigraphy.
c) Core Logging
Core logging, a critical component to this study because it provides the basic framework geology, was completed both in the field and at the SGL. During a two week period, 49 basement logs and 18 sandstone logs were completed from the Key Lake area. Core logging at the SGL yielded an additional 13 sandstone logs and eight basement logs. Many of these cores were sampled for geochemical purposes and will be added to the drillcore geochemical dataset provided funding becomes available. Discussions regarding the basement geology in the Key Lake area can be found in Card (this volume). Each drillhole containing Athabasca Group sedimentary rocks was logged using a systematic logging method incorporating parameters determined to identify the lithostratigraphic units (Bosman and Korness, 2007).
3. Interpretations
a) Spectral Data
A significant amount of information regarding silicification, colour and clay
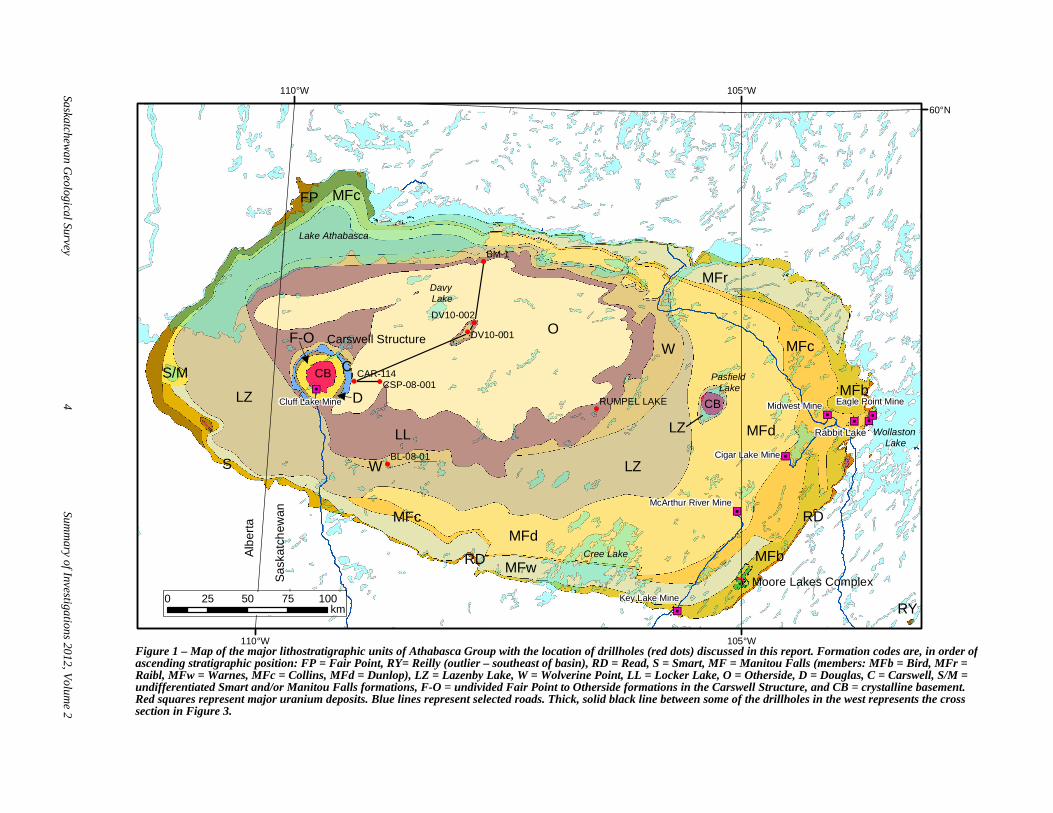
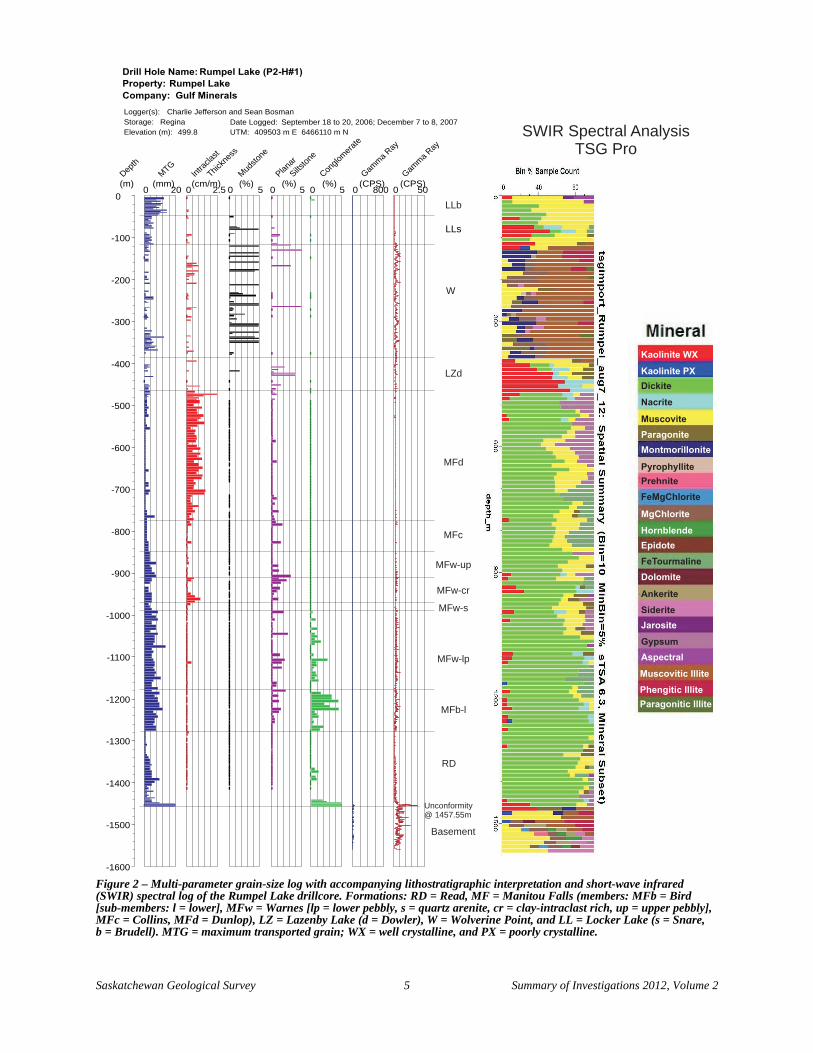
content, among others, can be obtained by processing spectral data. At the present time TSG has been used to create SWIR logs based on the software’s spectral libraries. The software scans the collected drillcore spectra, compares them to those in its libraries, and provides an interpreted mineral assemblage. One of the drillcores analysed with the Analytical Spectral Device (ASD) was from the Rumpel Lake drillhole (Figure 1), which provided more than 2,500 analyses. Analyses were systematically obtained every 75 cm and non-systematic readings were taken in areas of interest such as fracture surfaces, clay intraclasts, and mudstone and siltstone beds.
Based on the interpreted mineralogical assemblages, in general, all of the major stratigraphic units as well as the sub-Athabasca Group unconformity 4 can be easily identified in the TSG log (Figure 2). The basement rocks, as interpreted by the software in the SWIR spectra, contain a wide variety of minerals including Mg-chlorite (dark brown), muscovite (yellow), kaolinite (red), phengitic illite (fuchsia), and siderite (pink). Above the basal unconformity, the Read and Manitou Falls formations are dominated by the clay mineral dickite (green) with lesser amounts of muscovite (yellow). At the contact between the Manitou Falls and Lazenby Lake formations, interpreted to be a major sequence boundary and unconformity (Ramaekers et al., 2007), there is a dramatic change from dickite to kaolinite (red) as the dominant clay mineral, although minor dickite (green) is present. The Lazenby Lake–Wolverine Point formation contact also displays a dramatic change from kaolinite to a potassium-rich clay mineral assemblage including muscovitic illite (brown) + Mg-chlorite (dark brown). The Wolverine Point–Locker Lake formation contact is also marked by a distinct mineralogical change with the latter containing muscovite (yellow), and the return of dickite (green) and kaolinite (red).
4 The term “sub-Athabasca Group unconformity” refers to the unconformity surface between the paleo- to meso-Proterozoic Athabasca Group and the Archean to Paleoproterozoic basement rocks.
Lithostratigraphic Unit Number of Geochemical Samples Formation Member
Outcrop
Drillcore
Total
Carswell (C) 1 8 9 Douglas (D) 0 25 25 Otherside (O) 102 5 107 Birkbeck (Ob) 86 4 90 Archibald (Oa) 16 1 17
Locker Lake (LL) 97 23 120 Marsin (LLm) 15 5 20 Brudell (LLb) 66 7 73 Snare (LLs) 16 11 27
Wolverine Point (W) 30 52 82 Lazenby Lake (LZ) 88 83 171 Dowler (LZd) 4 11 15 Larter (LZl) 17 18 35 Shiels (LZs) 36 13 49 Clampitt (LZc) 25 40 65 Hodge (LZh) 6 1 7
Manitou Falls (MF) 500 161 661 Dunlop (MFd) 126 50 176 Collins (MFc) 102 49 151 Warnes (MFw) 61 6 67 Raibl (MFr) 102 16 118 Bird (MFb) 109 40 149
Smart (S) 1 5 6 Read (RD) 2 22 24 Reilly (RY) 2 0 2 Fair Point (FP) 5 0 5 Other 9 1 10 Totals 837 385 1,222
Saskatchewan G
eological Survey 4
Summ
ary of Investigations 2012, Volum
e 2
Figure 1 – Map of the major lithostratigraphic units of Athabasca Group with the location of drillholes (red dots) discussed in this report. Formation codes are, in order of ascending stratigraphic position: FP = Fair Point, RY= Reilly (outlier – southeast of basin), RD = Read, S = Smart, MF = Manitou Falls (members: MFb = Bird, MFr = Raibl, MFw = Warnes, MFc = Collins, MFd = Dunlop), LZ = Lazenby Lake, W = Wolverine Point, LL = Locker Lake, O = Otherside, D = Douglas, C = Carswell, S/M = undifferentiated Smart and/or Manitou Falls formations, F-O = undivided Fair Point to Otherside formations in the Carswell Structure, and CB = crystalline basement. Red squares represent major uranium deposits. Blue lines represent selected roads. Thick, solid black line between some of the drillholes in the west represents the cross section in Figure 3.
"J
"J
"J"J
"J
"J
"J"J
MFd
LZ
Carswell Structure
Moore Lakes Complex
Rabbit LakeLZ
CBLZ
S/M
F-O
C
D
LL
W
MFc
S
RDMFw
RD
MFd
MFc
MFb
MFr
MFcFP
MFb
CB
W
RY
O
Midwest Mine
Key Lake Mine
Cluff Lake Mine
Cigar Lake Mine
Eagle Point Mine
McArthur River Mine
BM-1
CAR-114
DV10-002
DV10-001
BL-08-01
CSP-08-001
RUMPEL LAKE
105°W
105°W
110°W
110°W
60°N
Alb
ert
a
Sa
ska
tch
ew
an
Cree Lake
Lake Athabasca
Wollaston Lake
0 25 50 75 100km
Pasfield Lake
Davy Lake
Saskatchewan Geological Survey 5 Summary of Investigations 2012, Volume 2
Figure 2 – Multi-parameter grain-size log with accompanying lithostratigraphic interpretation and short-wave infrared (SWIR) spectral log of the Rumpel Lake drillcore. Formations: RD = Read, MF = Manitou Falls (members: MFb = Bird [sub-members: l = lower], MFw = Warnes [lp = lower pebbly, s = quartz arenite, cr = clay-intraclast rich, up = upper pebbly], MFc = Collins, MFd = Dunlop), LZ = Lazenby Lake (d = Dowler), W = Wolverine Point, and LL = Locker Lake (s = Snare, b = Brudell). MTG = maximum transported grain; WX = well crystalline, and PX = poorly crystalline.
LLb
W
LZd
MFd
MFc
MFw-up
MFw-cr
MFw-s
MFw-lp
MFb-l
RD
Basement
Unconformity @ 1457.55m
Gam
ma
Ray
0
-100
-200
-300
-400
-500
-600
-700
-800
-900
-1000
-1100
-1200
-1300
-1400
-1500
-1600
Depth
0 20 0 0 0 02.5 5 55(mm) (cm/m) (%) (%) (%)
MTG
Intra
clast
Thick
ness
Mud
ston
e
Plana
r
Siltsto
ne
Congl
omer
ate
(m) (CPS)G
amm
a Ray
0 800 0 50(CPS)
Drill Hole Name: Rumpel Lake (P2-H#1)
Property: Rumpel Lake
Company: Gulf Minerals
Logger(s): Charlie Jefferson and Sean Bosman
Date Logged: September 18 to 20, 2006; December 7 to 8, 2007Storage: Regina
Elevation (m): 499.8 UTM: 409503 m E 6466110 m N
LLs
SWIR Spectral AnalysisTSG Pro
Kaolinite PX
Kaolinite WX
Dickite
Nacrite
Muscovite
Paragonite
Montmorillonite
Pyrophyllite
Prehnite
FeMgChlorite
MgChlorite
Hornblende
Epidote
FeTourmaline
Dolomite
Ankerite
Siderite
Jarosite
Gypsum
Aspectral
Muscovitic Illite
Phengitic Illite
Paragonitic Illite
Saskatchewan Geological Survey 6 Summary of Investigations 2012, Volume 2
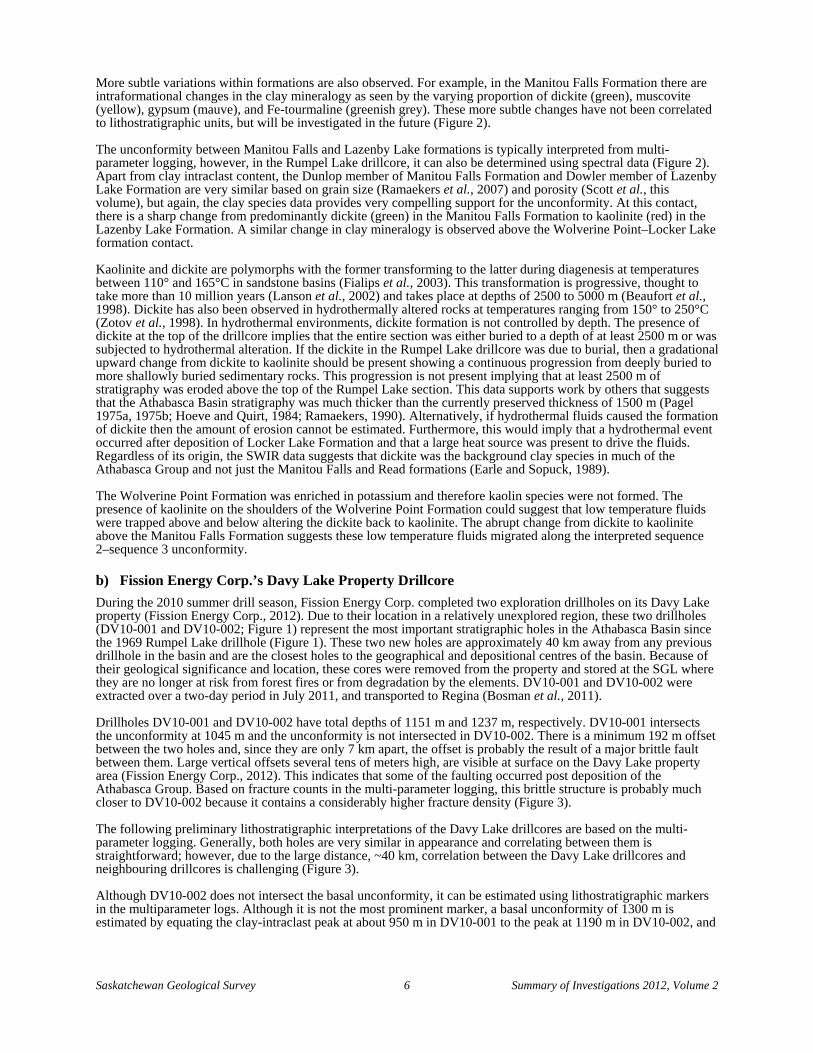
More subtle variations within formations are also observed. For example, in the Manitou Falls Formation there are intraformational changes in the clay mineralogy as seen by the varying proportion of dickite (green), muscovite (yellow), gypsum (mauve), and Fe-tourmaline (greenish grey). These more subtle changes have not been correlated to lithostratigraphic units, but will be investigated in the future (Figure 2).
The unconformity between Manitou Falls and Lazenby Lake formations is typically interpreted from multi-parameter logging, however, in the Rumpel Lake drillcore, it can also be determined using spectral data (Figure 2). Apart from clay intraclast content, the Dunlop member of Manitou Falls Formation and Dowler member of Lazenby Lake Formation are very similar based on grain size (Ramaekers et al., 2007) and porosity (Scott et al., this volume), but again, the clay species data provides very compelling support for the unconformity. At this contact, there is a sharp change from predominantly dickite (green) in the Manitou Falls Formation to kaolinite (red) in the Lazenby Lake Formation. A similar change in clay mineralogy is observed above the Wolverine Point–Locker Lake formation contact.
Kaolinite and dickite are polymorphs with the former transforming to the latter during diagenesis at temperatures between 110° and 165°C in sandstone basins (Fialips et al., 2003). This transformation is progressive, thought to take more than 10 million years (Lanson et al., 2002) and takes place at depths of 2500 to 5000 m (Beaufort et al., 1998). Dickite has also been observed in hydrothermally altered rocks at temperatures ranging from 150° to 250°C (Zotov et al., 1998). In hydrothermal environments, dickite formation is not controlled by depth. The presence of dickite at the top of the drillcore implies that the entire section was either buried to a depth of at least 2500 m or was subjected to hydrothermal alteration. If the dickite in the Rumpel Lake drillcore was due to burial, then a gradational upward change from dickite to kaolinite should be present showing a continuous progression from deeply buried to more shallowly buried sedimentary rocks. This progression is not present implying that at least 2500 m of stratigraphy was eroded above the top of the Rumpel Lake section. This data supports work by others that suggests that the Athabasca Basin stratigraphy was much thicker than the currently preserved thickness of 1500 m (Pagel 1975a, 1975b; Hoeve and Quirt, 1984; Ramaekers, 1990). Alternatively, if hydrothermal fluids caused the formation of dickite then the amount of erosion cannot be estimated. Furthermore, this would imply that a hydrothermal event occurred after deposition of Locker Lake Formation and that a large heat source was present to drive the fluids. Regardless of its origin, the SWIR data suggests that dickite was the background clay species in much of the Athabasca Group and not just the Manitou Falls and Read formations (Earle and Sopuck, 1989).
The Wolverine Point Formation was enriched in potassium and therefore kaolin species were not formed. The presence of kaolinite on the shoulders of the Wolverine Point Formation could suggest that low temperature fluids were trapped above and below altering the dickite back to kaolinite. The abrupt change from dickite to kaolinite above the Manitou Falls Formation suggests these low temperature fluids migrated along the interpreted sequence 2–sequence 3 unconformity.
b) Fission Energy Corp.’s Davy Lake Property Drillcore
During the 2010 summer drill season, Fission Energy Corp. completed two exploration drillholes on its Davy Lake property (Fission Energy Corp., 2012). Due to their location in a relatively unexplored region, these two drillholes (DV10-001 and DV10-002; Figure 1) represent the most important stratigraphic holes in the Athabasca Basin since the 1969 Rumpel Lake drillhole (Figure 1). These two new holes are approximately 40 km away from any previous drillhole in the basin and are the closest holes to the geographical and depositional centres of the basin. Because of their geological significance and location, these cores were removed from the property and stored at the SGL where they are no longer at risk from forest fires or from degradation by the elements. DV10-001 and DV10-002 were extracted over a two-day period in July 2011, and transported to Regina (Bosman et al., 2011).
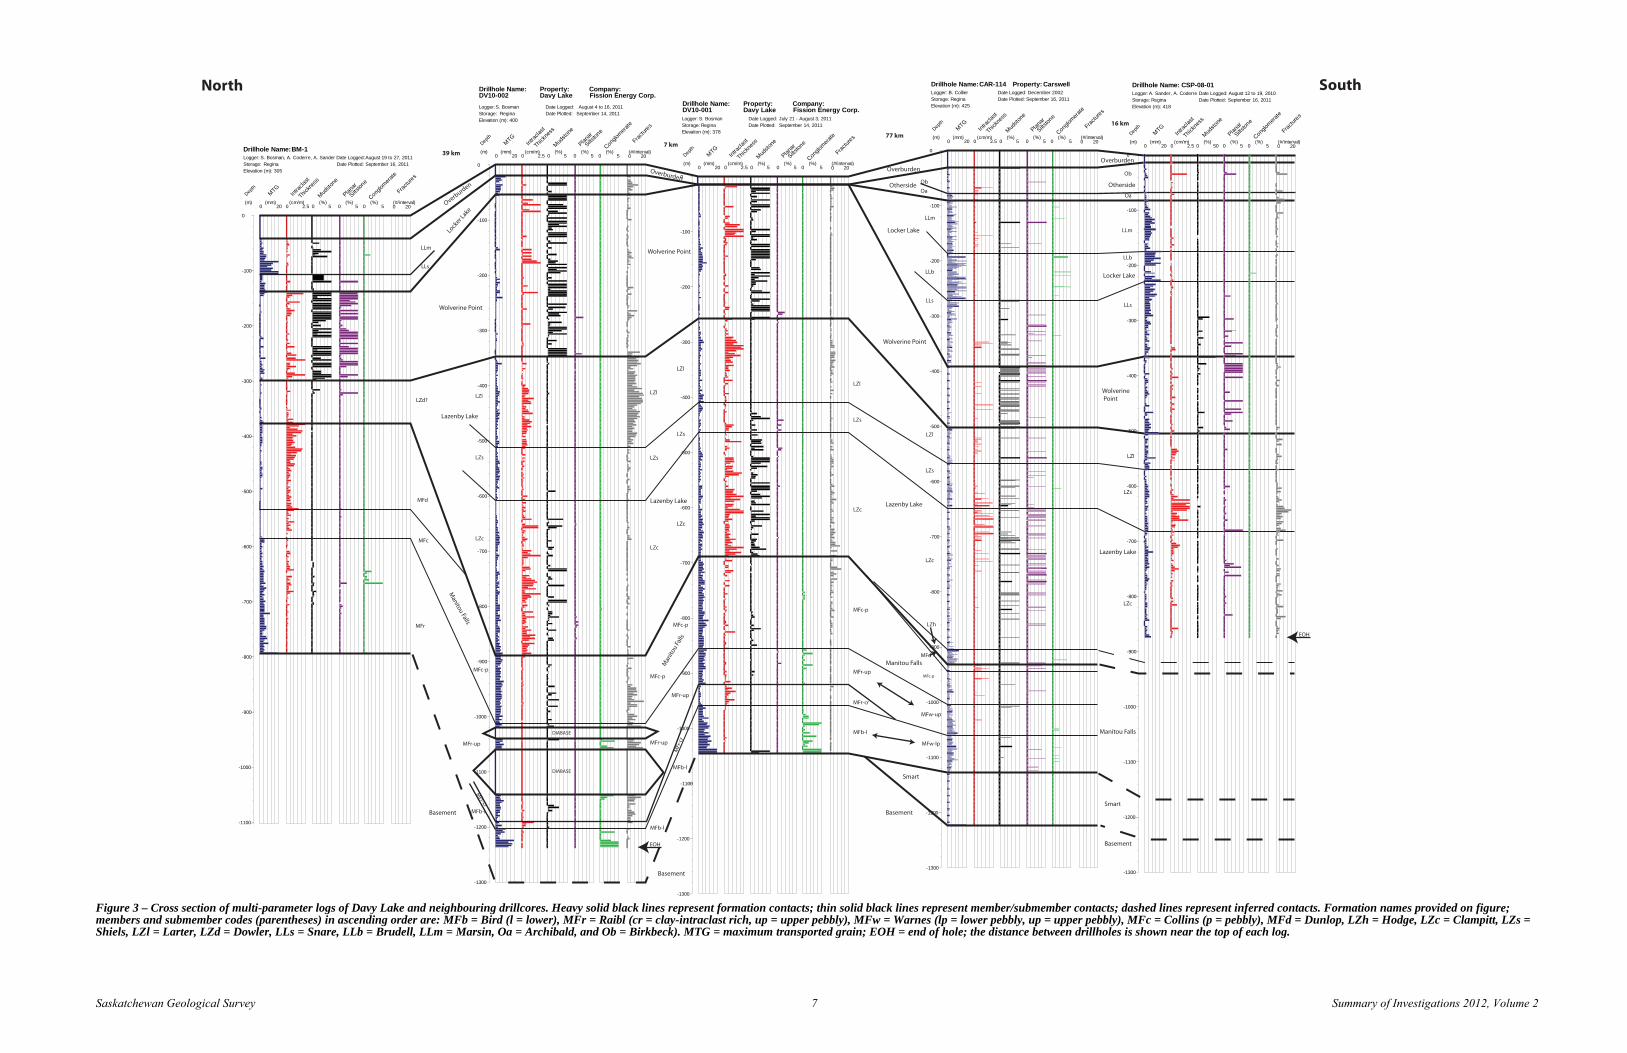
Drillholes DV10-001 and DV10-002 have total depths of 1151 m and 1237 m, respectively. DV10-001 intersects the unconformity at 1045 m and the unconformity is not intersected in DV10-002. There is a minimum 192 m offset between the two holes and, since they are only 7 km apart, the offset is probably the result of a major brittle fault between them. Large vertical offsets several tens of meters high, are visible at surface on the Davy Lake property area (Fission Energy Corp., 2012). This indicates that some of the faulting occurred post deposition of the Athabasca Group. Based on fracture counts in the multi-parameter logging, this brittle structure is probably much closer to DV10-002 because it contains a considerably higher fracture density (Figure 3).
The following preliminary lithostratigraphic interpretations of the Davy Lake drillcores are based on the multi-parameter logging. Generally, both holes are very similar in appearance and correlating between them is straightforward; however, due to the large distance, ~40 km, correlation between the Davy Lake drillcores and neighbouring drillcores is challenging (Figure 3).
Although DV10-002 does not intersect the basal unconformity, it can be estimated using lithostratigraphic markers in the multiparameter logs. Although it is not the most prominent marker, a basal unconformity of 1300 m is estimated by equating the clay-intraclast peak at about 950 m in DV10-001 to the peak at 1190 m in DV10-002, and
Basement
Overburden
Lock
er Lake
Wolverine Point
Lazenby Lake
Manitou Falls
Smart
Overburden
Otherside
Locker Lake
Wolverine Point
Lazenby Lake
Manitou Falls
Overburden
Wolverine Point
Lazenby Lake
Man
itou
Falls
Overburden
Otherside
Locker Lake
Wolverine Point
Lazenby Lake
Manitou Falls
Smart
39 km7 km
77 km
16 km
Basement
Basement
Basement
EOH
EOH
LLm
LLs
MFd
MFc
MFr
LZd?
MFw-lp
MFw-up
MFd
LZh
LZc
LZs
LZl
LLs
LLb
LLm
LLm
LLb
LLs
Oa
Ob
Oa
Ob
LZc
LZs
LZl
MFb-l
MFr-cr
MFr-up
MFc-p
LZc
LZs
LZl
MFb-l
MFr
-cr
MFr-up
MFc-p
LZc
LZs
LZl
MFb-l
MFr-up
MFc-p
LZc
LZs
LZl
MFb-l
MFr-cr
MFr-up
MFc-p
LZc
LZs
LZl
0
-100
-200
-300
-400
-500
-600
-700
-800
-900
-1000
-1100
-1200
-1300
Depth
Drillhole Name:
Logger: Date Logged:
0 20 0 0 0 02.5 5 55(mm) (cm/m) (%) (%) (%)
MTG
Intra
clast
Thick
ness
Mud
ston
e
Plana
r
Siltsto
ne
Conglom
erat
e
(m)
Property: Company:
Date Plotted:Storage:Elevation (m): 400
200
Fract
ures
(#/interval)
S. Bosman
DV10-002
August 4 to 16, 2011
Davy Lake Fission Energy Corp.
Regina September 14, 2011
0
-100
-200
-300
-400
-500
-600
-700
-800
-900
-1000
-1100
Depth
Drillhole Name:Logger: Date Logged:
0 20 0 0 0 02.5 5 55(mm) (cm/m) (%) (%) (%)
MTG
Intra
clast
Thick
ness
Mud
ston
e
Plana
r
Siltsto
ne
Conglom
erat
e
(m)
Date Plotted:Storage:Elevation (m): 305
200
Fract
ures
(#/interval)
S. Bosman, A. Coderre, A. Sander
BM-1August 19 to 27, 2011
Regina September 16, 2011
0
-100
-200
-300
-400
-500
-600
-700
-800
-900
-1000
-1100
-1200
-1300
Depth
Logger: Date Logged:
0 20 0 0 0 02.5 5 55(mm) (cm/m) (%) (%) (%)
MTG
Intra
clast
Thick
ness
Mud
ston
e
Plana
r
Siltsto
ne
Conglom
erat
e
(m)
Date Plotted:Storage:Elevation (m): 378
200
Fract
ures
(#/interval)
S. Bosman July 21 - August 3, 2011Regina September 14, 2011
0
-100
-200
-300
-400
-500
-600
-700
-800
-900
-1000
-1100
-1200
-1300
Depth
Drillhole Name:Logger: Date Logged: December 2002
0 20 0 0 0 02.5 5 55(mm) (cm/m) (%) (%) (%)
MTG
Intra
clast
Thick
ness
Mud
ston
e
Plana
r
Siltsto
ne
Conglom
erat
e
(m)
Property:
Date Plotted:Storage:Elevation (m): 425
200
Fract
ures
(#/interval)
B. Collier
CAR-114 Carswell
Regina September 16, 2011
DIABASE
DIABASE
MFc-p
Drillhole Name: Property: Company:DV10-001 Davy Lake Fission Energy Corp.
Drillhole Name:Logger: Date Logged:
Date Plotted:Storage:Elevation (m): 418
A. Sander, A. Coderre
CSP-08-01August 12 to 19, 2010
Regina September 16, 2011
0
-100
-200
-300
-400
-500
-600
-700
-800
-900
-1000
-1100
-1200
-1300
Depth
0 20 0 0 0 02.5 50 55(mm) (cm/m) (%) (%) (%)
MTG
Intra
clast
Thick
ness
Mud
ston
e
Plana
r
Siltsto
ne
Conglom
erat
e
(m)200
Fract
ures
(#/interval)
SouthNorth
Saskatchewan Geological Survey 7 Summary of Investigations 2012, Volume 2
Figure 3 – Cross section of multi-parameter logs of Davy Lake and neighbouring drillcores. Heavy solid black lines represent formation contacts; thin solid black lines represent member/submember contacts; dashed lines represent inferred contacts. Formation names provided on figure; members and submember codes (parentheses) in ascending order are: MFb = Bird (l = lower), MFr = Raibl (cr = clay-intraclast rich, up = upper pebbly), MFw = Warnes (lp = lower pebbly, up = upper pebbly), MFc = Collins (p = pebbly), MFd = Dunlop, LZh = Hodge, LZc = Clampitt, LZs = Shiels, LZl = Larter, LZd = Dowler, LLs = Snare, LLb = Brudell, LLm = Marsin, Oa = Archibald, and Ob = Birkbeck). MTG = maximum transported grain; EOH = end of hole; the distance between drillholes is shown near the top of each log.
Saskatchewan Geological Survey 8 Summary of Investigations 2012, Volume 2
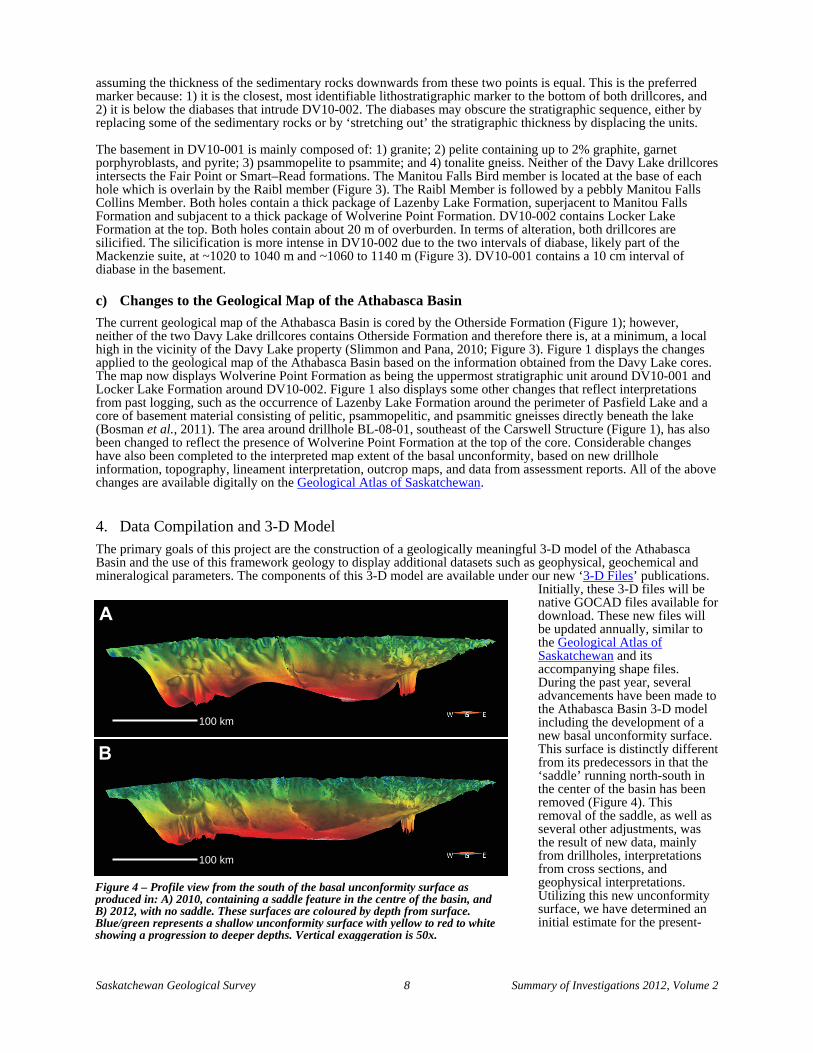
Figure 4 – Profile view from the south of the basal unconformity surface as produced in: A) 2010, containing a saddle feature in the centre of the basin, and B) 2012, with no saddle. These surfaces are coloured by depth from surface. Blue/green represents a shallow unconformity surface with yellow to red to white showing a progression to deeper depths. Vertical exaggeration is 50x.
assuming the thickness of the sedimentary rocks downwards from these two points is equal. This is the preferred marker because: 1) it is the closest, most identifiable lithostratigraphic marker to the bottom of both drillcores, and 2) it is below the diabases that intrude DV10-002. The diabases may obscure the stratigraphic sequence, either by replacing some of the sedimentary rocks or by ‘stretching out’ the stratigraphic thickness by displacing the units.
The basement in DV10-001 is mainly composed of: 1) granite; 2) pelite containing up to 2% graphite, garnet porphyroblasts, and pyrite; 3) psammopelite to psammite; and 4) tonalite gneiss. Neither of the Davy Lake drillcores intersects the Fair Point or Smart–Read formations. The Manitou Falls Bird member is located at the base of each hole which is overlain by the Raibl member (Figure 3). The Raibl Member is followed by a pebbly Manitou Falls Collins Member. Both holes contain a thick package of Lazenby Lake Formation, superjacent to Manitou Falls Formation and subjacent to a thick package of Wolverine Point Formation. DV10-002 contains Locker Lake Formation at the top. Both holes contain about 20 m of overburden. In terms of alteration, both drillcores are silicified. The silicification is more intense in DV10-002 due to the two intervals of diabase, likely part of the Mackenzie suite, at ~1020 to 1040 m and ~1060 to 1140 m (Figure 3). DV10-001 contains a 10 cm interval of diabase in the basement.
c) Changes to the Geological Map of the Athabasca Basin
The current geological map of the Athabasca Basin is cored by the Otherside Formation (Figure 1); however, neither of the two Davy Lake drillcores contains Otherside Formation and therefore there is, at a minimum, a local high in the vicinity of the Davy Lake property (Slimmon and Pana, 2010; Figure 3). Figure 1 displays the changes applied to the geological map of the Athabasca Basin based on the information obtained from the Davy Lake cores. The map now displays Wolverine Point Formation as being the uppermost stratigraphic unit around DV10-001 and Locker Lake Formation around DV10-002. Figure 1 also displays some other changes that reflect interpretations from past logging, such as the occurrence of Lazenby Lake Formation around the perimeter of Pasfield Lake and a core of basement material consisting of pelitic, psammopelitic, and psammitic gneisses directly beneath the lake (Bosman et al., 2011). The area around drillhole BL-08-01, southeast of the Carswell Structure (Figure 1), has also been changed to reflect the presence of Wolverine Point Formation at the top of the core. Considerable changes have also been completed to the interpreted map extent of the basal unconformity, based on new drillhole information, topography, lineament interpretation, outcrop maps, and data from assessment reports. All of the above changes are available digitally on the Geological Atlas of Saskatchewan.
4. Data Compilation and 3-D Model The primary goals of this project are the construction of a geologically meaningful 3-D model of the Athabasca Basin and the use of this framework geology to display additional datasets such as geophysical, geochemical and mineralogical parameters. The components of this 3-D model are available under our new ‘3-D Files’ publications.
Initially, these 3-D files will be native GOCAD files available for download. These new files will be updated annually, similar to the Geological Atlas of Saskatchewan and its accompanying shape files. During the past year, several advancements have been made to the Athabasca Basin 3-D model including the development of a new basal unconformity surface. This surface is distinctly different from its predecessors in that the ‘saddle’ running north-south in the center of the basin has been removed (Figure 4). This removal of the saddle, as well as several other adjustments, was the result of new data, mainly from drillholes, interpretations from cross sections, and geophysical interpretations. Utilizing this new unconformity surface, we have determined an initial estimate for the present-
A
B
100 km
100 km
Saskatchewan Geological Survey 9 Summary of Investigations 2012, Volume 2
day total volume of material in the Athabasca Basin to be ~59 000 km3. This estimate does not account for the volume of diabase within the Athabasca Group and therefore this number slightly overestimates the volume of sedimentary rocks in the Athabasca Group. A more accurate calculation using only the Athabasca Group rocks will be completed in the future. The new geochemical and spectral data discussed above will also be utilized in the 3-D model in the future.
5. Summary The primary goal of the Athabasca Basin ore-systems project is to present regional geoscience data, traditionally reserved for two-dimensional viewing, in the 3-D environment. Once a 3-D model for the geology of the Athabasca Basin is generated, data, both new and historic, can be displayed, better facilitating its interpretation. Through a combination of office- and field-based data collection, compilation of pre-existing information and new interpretation techniques, the geology and history of the Athabasca Basin can be presented in a manner never before seen. The fundamental objective of the project is a better understanding of the processes that led to the formation of economic uranium deposits in the Athabasca Basin and its underlying basement.
The Saskatchewan Geological Survey has undertaken several new tasks aimed at accomplishing these goals. The first is an ambitious data-compilation exercise that will allow for the best presentation of the various elements of the Athabasca Basin. In addition, we have generated new data, specifically geochemical and spectral datasets, that will allow us to better interpret the diagenetic and hydrothermal fluid history of the Athabasca Basin. We also continue to undertake field activities to collect and preserve data from critical parts of the Athabasca Basin.
6. Acknowledgements The authors are grateful to Jeanne Percival of the Geological Survey of Canada for allowing us to use her Analytical Spectral Device. We also thank Paul Ramaekers for some thoughtful discussions. The authors are also appreciative of the support from the staff at the SGL in arranging examination tables for our drillcore and sample needs.
7. References Beaufort, D., Cassagnabère, A., Petit, S., Lanson, B., Berger, G., Lacharpagne, J.C., and Johansen, H. (1998):
Kaolinite-to-dickite reaction in sandstone reservoirs; Clay Minerals, v33, p297-316.
Bosman, S.A., Card, C.D., Brewster, Z., and Fehr, C. (2011): The Athabasca Basin ore-systems project: a new generation of geoscience in the Athabasca Basin; in Summary of Investigations 2009, Volume 2, Saskatchewan Geological Survey, Sask. Ministry of Energy and Resources, Misc. Rep. 2011-4.2, Paper A-4, 9p, URL<http://er.gov.sk.ca/adx/aspx/adxGetMedia.aspx?DocID=12186,12185,11458,11455,11228,3385,5460,2936,Documents&MediaID=38848&Filename=A-4+Bosman+et+al.pdf>.
Bosman, S.A. and Card, C.D. (2012): Geochemical analyses of Athabasca Group drillholes in Saskatchewan (NTS 64L, 74F to 74K, and 74N to 74P) – supplementary to Data File Reports 24, 29, and 30; Sask. Geological Survey, Sask. Ministry of the Economy, Data File 31, URL <http://www.er.gov.sk.ca/DF31>.
Bosman, S.A. and Korness, J. (2007): Building Athabasca stratigraphy; revising, redefining, and repositioning; in Summary of Investigations 2007, Volume 2, Saskatchewan Geological Survey, Sask. Ministry of Energy and Resources, Misc. Rep. 2007-4.2, CD-ROM, Paper A-8, 29p.
Bosman, S.A. and Schwab, M. (2009): Preliminary report: lithostratigraphic investigations of the north and northeast Athabasca Basin, Saskatchewan; in Summary of Investigations 2009, Volume 2, Saskatchewan Geological Survey, Sask. Ministry of Energy and Resources, Misc. Rep. 2009-4.2, Paper A-6, 13p, URL <http://er.gov.sk.ca/adx/aspx/adxGetMedia.aspx?DocID=11862,11861,11458,11455,11228,3385,5460,2936,Documents&MediaID=36797&Filename=A-6+bosman.pdf>.
Card, C.D. (2009): Cree South project 2009: reconnaissance bedrock mapping in the Lloyd Domain and Virgin River Shear Zone; in Summary of Investigations 2009, Volume 2, Saskatchewan Geological Survey, Sask. Ministry of Energy and Resources, Misc. Rep. 2009-4.2, Paper A-7, 21p, URL <http://er.gov.sk.ca/adx/aspx/ adxGetMedia.aspx?DocID=11862,11861,11458,11455,11228,3385,5460,2936,Documents&MediaID=36798&Filename=A-7+Card.pdf>.
Saskatchewan Geological Survey 10 Summary of Investigations 2012, Volume 2
Card, C.D. and Bosman, S.A. (2012): Geochemical analyses of Athabasca Group outcrops in Saskatchewan (NTS 64L, 74F to 74K, and 74N to 74P) – supplementary to Data File Report 29; Sask. Ministry of Energy and Resources, Data File 30, URL <http://www.er.gov.sk.ca/DF30>.
Card, C.D., Bosman, S.A., Slimmon, W.L., Zmetana, D.J., and Delaney, G.D. (2011): Geochemical analyses of Athabasca Group outcrops in Saskatchewan (NTS 64L, 74F to 74K, and 74N to 74P); Sask. Ministry of Energy and Resources, Data File 29, URL <http://www.er.gov.sk.ca/DF29>.
Earle, S.A.M. and Sopuck, V.J. (1989): Regional lithogeochemistry of the eastern part of the Athabasca Basin uranium province, Saskatchewan, Canada, in Uranium Resources and Geology of North America, IAEA, Tech. Doc. 500, p263-296.
Fialips, C-I., Majzlan, J., Beaufort, D., and Navrotsky, A. (2003): New thermochemical evidence on the stability of dickite vs. kaolinite, Amer. Mineral., v88, p837-845.
Fission Energy Corp. (2012): Davy Lake, SK; URL <http://www.fission-energy.com/s/davylake.asp>, accessed 15 Oct 2012.
Hoeve, J. and Quirt, D. (1984): Mineralization and host rock alteration in relation to clay mineral diagenesis and evolution of the Middle Proterozoic Athabasca Basin, northern Saskatchewan, Canada, Sask. Resear. Counc., Publ. R-855-2-B, 187p.
Jefferson, C.W. and Delaney, G. (eds.) (2007): EXTECH IV: Geology and Uranium EXploration TECHnology of the Proterozoic Athabasca Basin, Saskatchewan and Alberta; Geol. Surv. Can., Bull. 588/Sask. Geol. Soc., Spec. Publ. No. 18/Geol. Assoc. Can., Min. Dep. Div., Spec. Publ. 4, 644p.
Lanson, B., Beaufort, D., Berger, G., Bauer, A., Cassagnabère, A., and Meunier, A. (2002): Authigenic kaolin and illitic minerals during diagenesis of sandstones: a review; Clay Minerals, v37, p1-22.
Pagel, M. (1975a): Determination des conditions physicochimiques de la silicification diagenetique des gres Athabasca (Canada) au moyen des inclusions fluides, C.R. Acad. Sci. (Paris), v28, p2,301-2,304.
__________ (1975b): Cadre geologique des gisements d'uranium dans la structure Carswell (Saskatchewan-Canada), etude des phases fluides, unpubl. Ph.D. thesis, Univ. Nancy, France, 156p.
Percival, J.B., Bosman, S.A., Potter, E.G., Ramaekers, P., Venance, K.E., Hunt, P.A., Davis, W., and Jefferson, C.W. (in press): Hydrothermal alteration in hydro-fractured Athabasca sandstone: distal expression of uranium mineralization?; Exploration and Mining and Geology (CIM).
Ramaekers, P. (1990): Geology of the Athabasca Group (Helikian) in Northern Saskatchewan; Sask. Energy Mines, Rep. 195, 49p.
Ramaekers, P., Jefferson, C.W., Yeo, G.M., Collier, B., Long, D.G.F., Drever, G., McHardy, S., Jiricka, D., Cutts, C., Wheatley, K., Catuneanu, O., Bernier, S., Kupsch, B., and Post, R.T., (2007): Revised geological map and stratigraphy of the Athabasca Group, Saskatchewan and Alberta; in Jefferson, C.W. and Delaney, G. (eds.), EXTECH IV: Geology and Uranium EXploration TECHnology of the Proterozoic Athabasca Basin, Saskatchewan and Alberta; Geol. Surv. Can., Bull. 588/Sask. Geol. Soc., Spec. Publ. No. 18/Geol. Assoc. Can., Min. Dep. Div., Spec. Publ. 4, p155-191.
Saskatchewan Ministry of Energy and Resources (2010): Industry Drillcore Data – Regina Subsurface Core Facility – Uravan Minerals Inc., Athabasca Basin (NTS 64L, 74F to 74K, and 74N to 74P) 2010 Drillcores Analysed; Sask. Ministry of Energy and Resources, Data File Report 24, URL <http://www.er.gov.sk.ca/DF24>.
Slimmon, W.L. and Pana, D.I. (comps.) (2010): Geology and Mineral Resources of the Athabasca Basin and Environs, Saskatchewan and Alberta; Sask. Ministry of Energy and Resources, Geoscience Map 2010-1/Energy Resources Conservation Board, ERCB/AGS Map 538, 1:500 000 scale, URL <http://www.er.gov.sk.ca/ GM2010-1>.
Zotov, A., Mukhamet-Galeev, A., and Schott, J. (1998): An experimental study of kaolinite and dickite relative stability at 150-300°C and the thermodynamic properties of dickite, Amer. Mineral., v83, p516-524.