Embed Size (px)
Citation preview
Measurement in Physical Education and Exercise Science, 14: 211–224, 2010Copyright © Taylor & Francis Group, LLCISSN: 1091-367X print / 1532-7841 onlineDOI: 10.1080/1091367X.2010.495559
ARTICLES
The Application of Social NetworkAnalysis to Team Sports
Dean Lusher and Garry Robins
Psychological Sciences,University of Melbourne, Parkville, Victoria, Australia
Peter KremerSchool of Psychology, Deakin University,
Geelong, Victoria, Australia
This article reviews how current social network analysis might be used to investigate individual andgroup behavior in sporting teams. Social network analysis methods permit researchers to exploresocial relations between team members and their individual-level qualities simultaneously. As such,social network analysis can be seen as augmenting existing approaches for the examination of intra–group relations among teams and provide detail of team members’ informal connections to otherswithin the team. Social network analysis is useful in addressing the issue of interdependencies inthe data inherent in team structures. Social network terms are introduced and explained by way ofan example team, software and resources are discussed, and a statistical approach to social networkanalysis is introduced.
Key words: social network analysis, methodology, sporting teams, intra-group relations
INTRODUCTION
Intra-group relations are important for sport teams and include aspects such as cohesiveness andhierarchies among players. Researchers interested in investigating such intra-group processesare invariably confronted by a number of challenges. For instance, agreed behavioral norms have
Correspondence should be sent to Dr. Dean Lusher, Psychological Sciences, University of Melbourne, Parkville,Victoria 3010, Australia. E-mail: [email protected]
212 LUSHER, ROBINS, AND KREMER
been indicated as a key correlate of team cohesion (Carron & Dennis, 1998) and are particularlypertinent since sports groups, unlike workplace-based and other types of groups, often involvesmall numbers of individuals, and their membership may change relatively frequently (e.g., annu-ally or seasonally). However, assessing how norms (and other intra-group relations) operate anddevelop is particularly challenging due to at least four main issues: the lack of a validated instru-ment, small sample sizes, issues relating to the assumption of independence of team members,and delineation of individual and group.
Fundamentally, to be concerned with intra-group relations of a team, a focus on actual rela-tions between team members is important, not just on the attributes (e.g., attitudes) of the teammembers about the team more generally. For instance, it is well known that team captains areoften quite influential, in part because they occupy a position of hierarchy within the team.Emirbayer (1997) asserts that a fundamental dilemma in social science is whether research isbased upon a substantialist (or essence-based approach) or a relational perspective. This meansthat on the one hand, being the captain can be seen as an attribute that the captain holds. However,from a relational perspective, the captain has a formal relation of power with others in the team.Importantly, beyond formal relations, there are informal relations between team members (e.g.,friendships) that affect how a team operates. The influence of such informal relations on the teamcannot readily be understood just by asking about the team in general. This article argues thatinformal social relations between team members need to be explored to better understand teams,and that social network analysis (SNA) is a useful methodology for doing this.
Continuing with the example of team norms, each of these issues is now examined. First, teamnorms have proven difficult to measure. Carron, Prapavessis, and Estabrooks (1999) developedthe Team Norm Questionnaire (TNQ), and this instrument has been used in a number of pub-lished studies (e.g., Colman & Carron, 2001; Patterson, Carron, & Loughead, 2005); however,validation of the TNQ has proved difficult and was subsequently abandoned (Carron, Shapcott,& Burke, 2007). A second issue is the need for sufficient respondents to ensure adequate power,which is dependent upon the number of observations. Sporting teams often have few members(i.e., relatively small ns), and this invariably creates limits for quantitative evaluation.
Third, a major assumption of standard statistical techniques is the independence of observa-tions. This assumption is undermined in a team environment, where individuals are, by definition,interdependent.1 For instance, if a senior player suggests longer training sessions, more juniorplayers may feel impelled to publicly agree due to social pressure, even if they personally dis-agree. In this case, the responses of a junior member of a team may not be independent of a seniormember’s responses. A team is not simply the agglomeration of independent individuals. Beinga team member is to be in social (and, therefore, dependent) relations with others in the team(Abbott, 1997). In on-field terms, a forward’s ability to score a goal may indeed be dependentupon a defender passing the ball to them in the first place. Gorgenyi (1998) noted these dependen-cies and relations between players as the informal ranking of players in teams, or “the hierarchy.”This informal ranking is separate to other formal hierarchies such as that between players andthe coach, captain, or team leaders. The exploration of both on-field and off-field team issuescan be done through standard statistical techniques and can provide useful information aboutindividuals and their attributes. But the dependencies and systemic elements of team behavior
1Note that multi-level modeling can deal with this if the dependence only arises from the team categorization.
SOCIAL NETWORK ANALYSIS AND TEAM SPORTS 213
may not be well understood simply by aggregated analyses of the team’s individual members asseparate “independent” entities (Carron, Colman, Wheeler, & Stevens, 2002; Carron, Widmeyer,& Brawley, 1985; Gammage, Carron, & Estabrooks, 2001). One approach to explore explicitlythe interdependencies and relations between individuals in a group is sociometry. Sociometry isa precursor to SNA and began with the invention of the sociogram—a systematic method for thegraphical representation of individuals and relations between them, which is still used in SNAtoday. However, although sociometric methods may provide visual and descriptive informationabout intra-group relations, they are unable to quantitatively model more complex processes,modeling that may be desirable for the investigation of teams.
A fourth issue is the core concern of distinguishing between individual and group for anexamination of group dynamics (Carron et al., 1985; Lucius & Kuhnert, 1997). Robins andKashima (2008) suggested that psychology often focuses upon individual cognition and per-ception, without looking at how these factors agglomerate into a social system; sociology oftenfocuses upon the systemic structures of interaction and disregards individual-level attributes.Clearly, an approach that is able to combine the attributes of individuals and their social relationsto one another would be beneficial.
SNA
Recent developments in the overlap of fields, such as sociology, economics, anthropology, math-ematics, political science, history, and social psychology, have seen the emergence of a newapproach to analysis of complex intra-group relations. SNA is a set of methodological tools thatfocus on the “relationships among social entities, and on the patterns and implications of theserelationships” (Wasserman & Faust, 1994, p. 3). SNA had its origins in the 1930s in work byMoreno in sociometry (Wasserman & Faust, 1994), though the use of the term is often attributedto Barnes (1954). It is important not to confuse SNA with social networking sites, where peo-ple accumulate “friends” on their web profile. The social science analytic approach to a socialnetwork that is inherent in SNA is emphasized here.
The advantage of an explicitly relational methodology is that a team can be viewed as amicro-social system. Here, relational methodology means a method that focuses upon the rela-tionships between individuals in a given context, rather than a method that views individuals asindependent and autonomous units. A particular advantage of SNA is its ability to examine bothsocial structures and individual attributes simultaneously. Therefore, SNA has the capacity toaccount for structural regularities but also individual attributes, and it is well suited for investi-gating the complex relations that exist within teams. There is rapidly growing interest in SNAin organizational research and in work team applications in particular (for a review, see Borgatti& Foster, 2003). As a broad set of techniques, SNA has been used extensively in organizationalsettings such as business and government (e.g., examining leadership, governance of environ-mental resources, advice relations, innovation, information sharing), health-related applications(e.g., HIV networks, mental health support, bullying in schools), politics (alliance formation,social movements), and defense (e.g., terrorist networks).
In a social network, individuals (otherwise referred to as actors) may be represented as nodesin a graph, and the relations between them are represented as edges. Importantly, this does notjust refer to a social network as members who “socialize with” or who are their friends. Certainly,
214 LUSHER, ROBINS, AND KREMER
friendship is a type of social network relation, but there are many others, such as trust, advice,collaboration, and even negative relations such as conflicts or bullying. SNA is therefore con-cerned with examining a specific relation between network members, because this will providedetailed information about the ways in which particular types of relations operate within a groupor team. In addition, individual-level attributes (such as age, sporting ability, playing experi-ence, team position) can be incorporated into a social network investigation to see how suchattributes are associated with social relations within the team. This article introduces a numberof methodological concepts currently utilized in SNA and illustrates them with examples froman elite-level sporting team. The specific advantages of SNA will be outlined, highlighting itspotential application for the study of intra-team relations, such as norms, hierarchies and otherinformal social structure, and cohesion, and thus provide conceptually distinct information fromindividual-level approaches.
SNA AND TEAM STRUCTURES
To date, very little work has been conducted on sporting teams using a social network method-ology (Gould & Gatrell, 1980; Leifer, 1990). Commenting from the field of sport sociology,Nixon (1993) highlighted a number of areas where SNA could be applied to the study ofsports, including “small group and subcultural analyses,” “organizational analyses,” and “man-agerial recruitment and stacking” (pp. 317–319). Nixon further noted that few sport sociologyresearchers have adopted an SNA conceptual orientation or methodological techniques. The sameappears true for the broad area of social psychology of sport and exercise. However, it seemsthat sporting teams are ideally suited to a social network investigation, as sporting teams arecomposed of bounded, well-defined groups of individuals, or, in social network terms, a fullnetwork. These individuals are interdependent, the team has clear and measurable performanceoutcomes, and the effectiveness of team members’ inter-relationships has a direct impact on thoseoutcomes.
POTENTIAL RESEARCH APPLICATIONS
Importantly, the set of tools that comprise SNA are not seen as a replacement to existinginstruments of methods, but as additions. For instance, it may be informative to know if thoseindividuals who are most popular or prominent within the team are also those who have thestrongest investment in the team’s goals and feel the team is highly bonded as a group (as mea-sured by the Group Environment Questionnaire for example; Carron, et al., 1985). A particularadvantage is that SNA permits the incorporation of social hierarchy to individual-level measures.In most teams, there are players who are more influential than others. SNA can take such powerdifferentials into account rather than assuming each team member has an equal say, which is theunderlying assumption of using the average of the aggregated scores of individuals.
SNA has the potential to answer research-only questions as well as have specific applica-tions for the team itself. Indeed, these are not mutually exclusive domains. For example, trustis seen as fundamental aspect of teams. Using SNA, it is possible to examine the interpersonaltrust relations between players within a team and examine how these may be associated with
SOCIAL NETWORK ANALYSIS AND TEAM SPORTS 215
individual qualities of these individuals within the teams, such as ability and experience. Further,the formation of norms in teams can be explored within teams because SNA permits the investi-gation of prominent individuals within the team and how they may indeed “drive” social normsthrough their informal social influence within the team. And to what degree can a positive teamclimate be identified as a particular arrangement of social relations within a network? What doparticular social network structures (for instance, high reciprocally agreed-upon social ties orstrong clustering into groups) tell us about the team? Clearly, SNA offers a range of tools thatcan augment and extend existing instruments and methods for the analysis of a number of thecomplex processes that operate within sporting teams.
COLLECTING SOCIAL NETWORK DATA
Social network data is relatively easy to collect within teams. For whole network studies, it isimportant that all team members provide information about their social network ties to otherteam members. Usually, a roster can be given out to all team members (or team members canuse free recall). Members can then place a tick next to those in the list depending upon the socialnetwork question asked (e.g., “Who do you trust?” or “Who is influential?”). With whole networkstudies, there cannot be anonymous responses, and this may be problematic in some instances.Team members need to be identified so that their individual-level data can be aligned with theirsocial network ties. However, de-identification is possible and desirable. Missing data can be asignificant problem with social network data because, as noted, individuals are considered in asocial context as interdependent in their social ties. This is certainly a limitation of SNA (seeKossinets, 2006), though methods for dealing with such issues have been proposed (Robins,Pattison, & Woolcock, 2004).
In collecting social network data, attention should be paid to three interrelated questions: Whatis a social network tie? Who are the network actors (and what attributes are important)? Whatis the boundary? Collectively, these three questions refer to the problem of boundary specifica-tion. Within sporting teams, these questions may prove simpler to answer because of the naturalboundary of players in the team. However, consideration should also be given to whether coachesand support staff are included, or excluded, from study. Regarding network ties, it is importantthat the question is not too general (e.g., who do you know in this team?), because in such cases,you may find that everyone is connected to everyone else. In such a situation, the exploration ofsocial networks will add nothing to an understanding of sporting teams. However, asking teammembers who they trust most in difficult situations is likely to be much more differentiating.Finally, as noted by White, Boorman, and Breiger (1976), it is not just important where socialnetwork ties occur, but also where they do not. So, it is important for a researcher to have aclear understanding of what counts as a non-tie. This may seem obvious, but, in our experience,some newcomers to network data collection make this mistake. For more information about datacollection and measurement, see Wasserman and Faust (1994, Chapter 2).
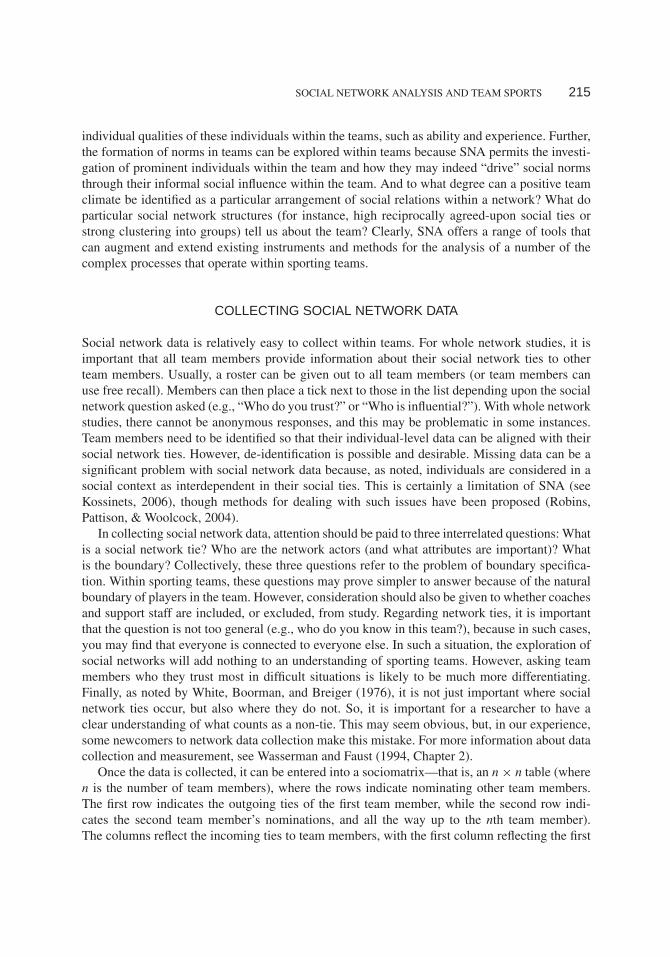
Once the data is collected, it can be entered into a sociomatrix—that is, an n × n table (wheren is the number of team members), where the rows indicate nominating other team members.The first row indicates the outgoing ties of the first team member, while the second row indi-cates the second team member’s nominations, and all the way up to the nth team member).The columns reflect the incoming ties to team members, with the first column reflecting the first
216 LUSHER, ROBINS, AND KREMER
1 2 3 4 5
1 - 1 0 1 0
2 0 - 0 1 0
3 0 1 - 0 0
4 0 1 1 - 0
5 0 0 1 0 -
Panel A Panel B
1
2
3
4
5
FIGURE 1 Panel A is a 5 × 5 sociomatrix of “advice seeking,” andPanel B is a social network visualization (graph showing the same socialrelations as the sociomatrix).
team member’s incoming ties, all the way up to the nth team member. Sociomatrices can be con-verted into network graphs or visualizations. Figure 1 demonstrates the correspondence betweena sociomatrix and a network graph, while in the next section, relevant software for this and otherspurposes is introduced.
SOFTWARE AND RESOURCES FOR SNA
There are a number of programs for SNA, including visualization of social networks (Pajek,Netdraw), general data analysis and some statistical analysis (UCINET), and also statistical mod-eling (StocNET, Statnet, PNet). Most of these programs are freely available or cost a nominalfee, thereby allowing researchers easy access to state of the art methodological tools for socialnetwork research. Links to these and many other resources are available from the InternationalNetwork for Social Network Analysis (INSNA) website, http://www.insna.org/. The edited workby Wasserman and Faust (1994) and Scott (2000) are recommended as comprehensive intro-ductions to SNA, though many other papers (e.g., Freeman, 1979) and books (e.g., Monge &Contractor, 2003) provide specialist information about particular SNA issues.
SOME SOCIAL NETWORK CONCEPTS
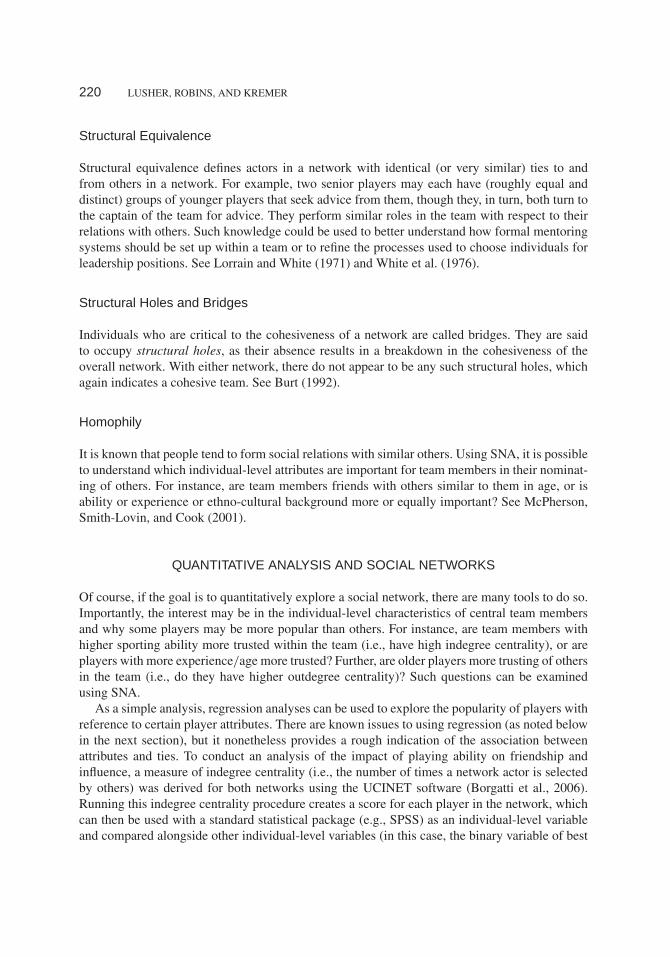
In a social network, the presence of a relation (or tie) between two people (e.g., actors i andj) is indicated as xij = 1, and its absence as xij = 0. (For the purposes of this article, ties areconsidered as binary—that is, as either present or absent—though valued ties, which signify thestrength of a relationship, are also possible and can be important). It is, of course, possible tovisualize social networks, as demonstrated in Figure 1. Figures 2 and 3 are network diagrams ofsocial relations of the same sporting team that were produced using the Pajek software (Batagelj& Mrvar, 2008). Figure 2 represents friendship nominations within the team. Figure 3 represents
SOCIAL NETWORK ANALYSIS AND TEAM SPORTS 217
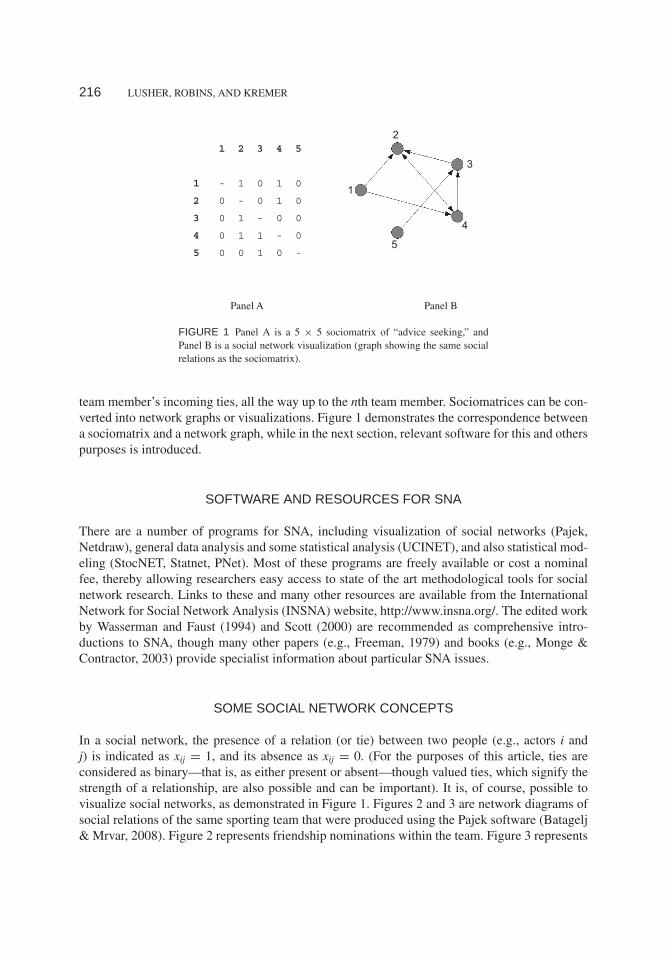
FIGURE 2 The team friendship network (n = 35). Black nodes representbest players; white nodes represent other players.
relations of influence. This data was collected as part of a larger study examining player socializ-ing and attitudes toward women in professional football in Australia (Lusher, Robins, & Kremer,2005). The friendship and influence networks were collected by asking all players to nominatethose players in the team whom they considered friends with a separate question on whom theyconsidered influential. A measure of playing ability (i.e., “best players”) was derived from athird social network question asking players to nominate the best players in the team. To keepthe analysis simple in the current illustrations, these nominations were converted to individual-level scores for each player in the team, so that best player is a binary attribute of a player (i.e.,best player information is transformed into individual-level attribute data and is not used here asnetwork data). Any player with more than five nominations was considered one of the best play-ers, which was determined using the indegree centrality analysis tool of UCINET (see belowfor further details). The best player measure is a binary attribute, where best player = 1, other-wise = 0. Best player status is indicated by the black-colored nodes in the network diagrams ofthe figures. All other players have white-colored nodes. So, in summary, the illustration is of twosocial networks (friendship, influence) and one individual-level attribute (playing ability).
Note that Figures 2 and 3 present directed networks; that is, the ties between network actorshave arrowheads, indicating the selection of one player by another via the arrowhead that pointsto the person who is selected. This differs from non-directed ties, where the direction of a tie isunimportant or does not make sense (e.g., marriage). The arrangement of the actor nodes in thenetwork into the positions in the visualization can be manually manipulated so that researchers
218 LUSHER, ROBINS, AND KREMER
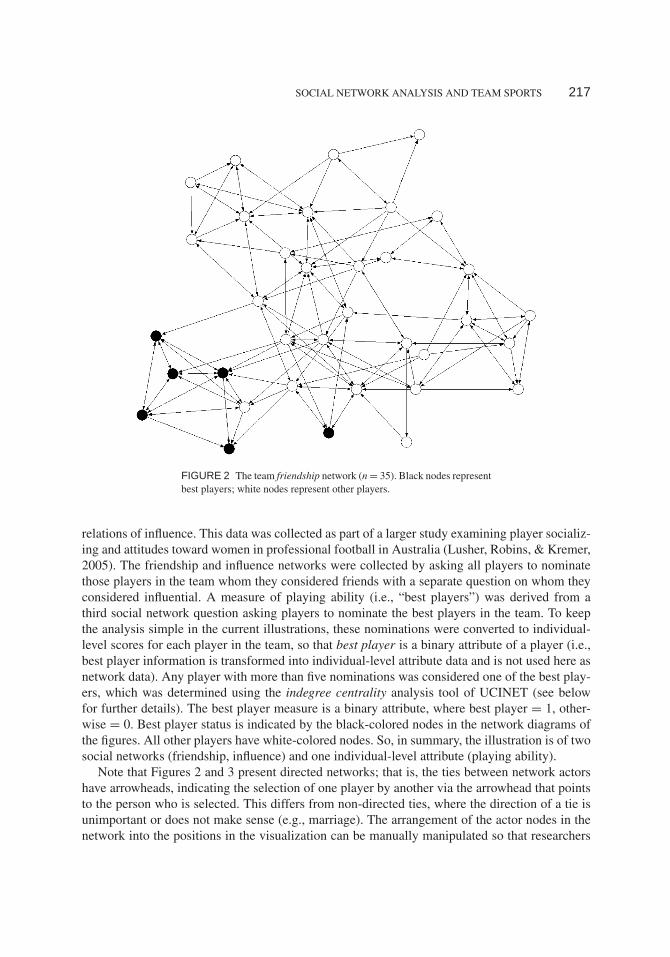
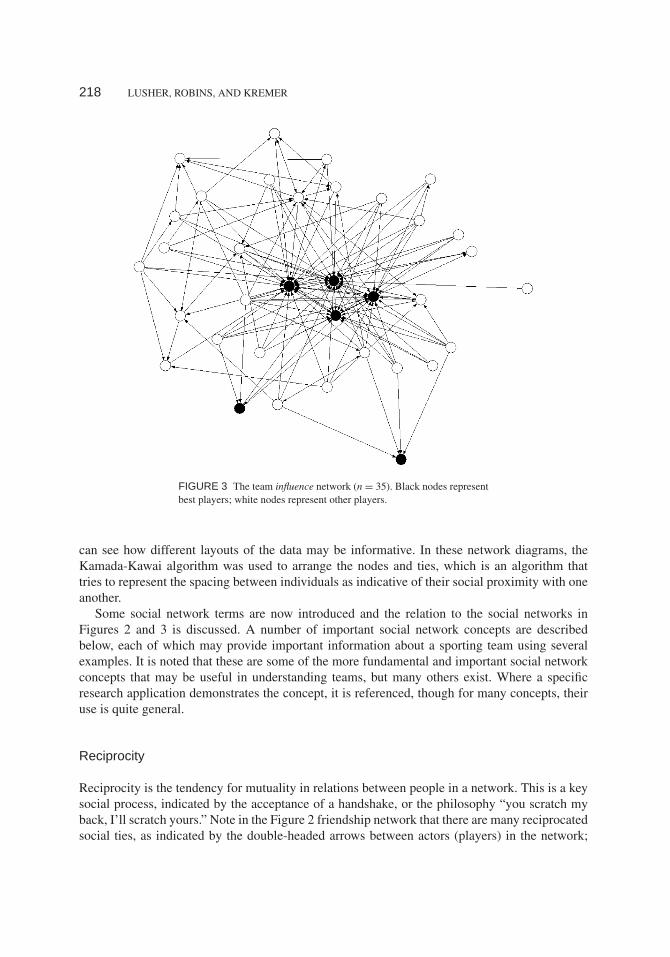
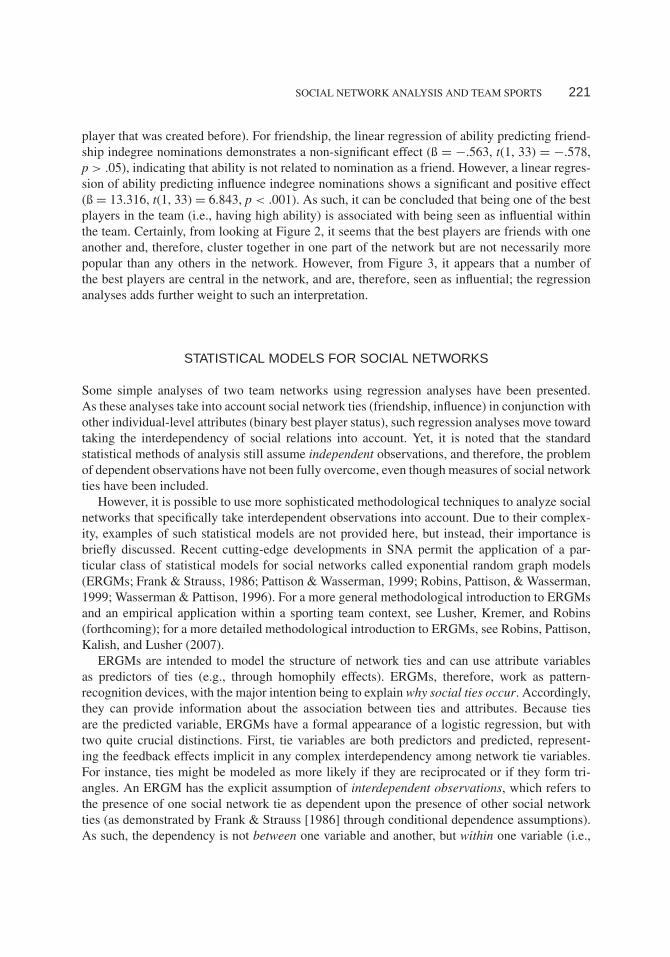
FIGURE 3 The team influence network (n = 35). Black nodes representbest players; white nodes represent other players.
can see how different layouts of the data may be informative. In these network diagrams, theKamada-Kawai algorithm was used to arrange the nodes and ties, which is an algorithm thattries to represent the spacing between individuals as indicative of their social proximity with oneanother.
Some social network terms are now introduced and the relation to the social networks inFigures 2 and 3 is discussed. A number of important social network concepts are describedbelow, each of which may provide important information about a sporting team using severalexamples. It is noted that these are some of the more fundamental and important social networkconcepts that may be useful in understanding teams, but many others exist. Where a specificresearch application demonstrates the concept, it is referenced, though for many concepts, theiruse is quite general.
Reciprocity
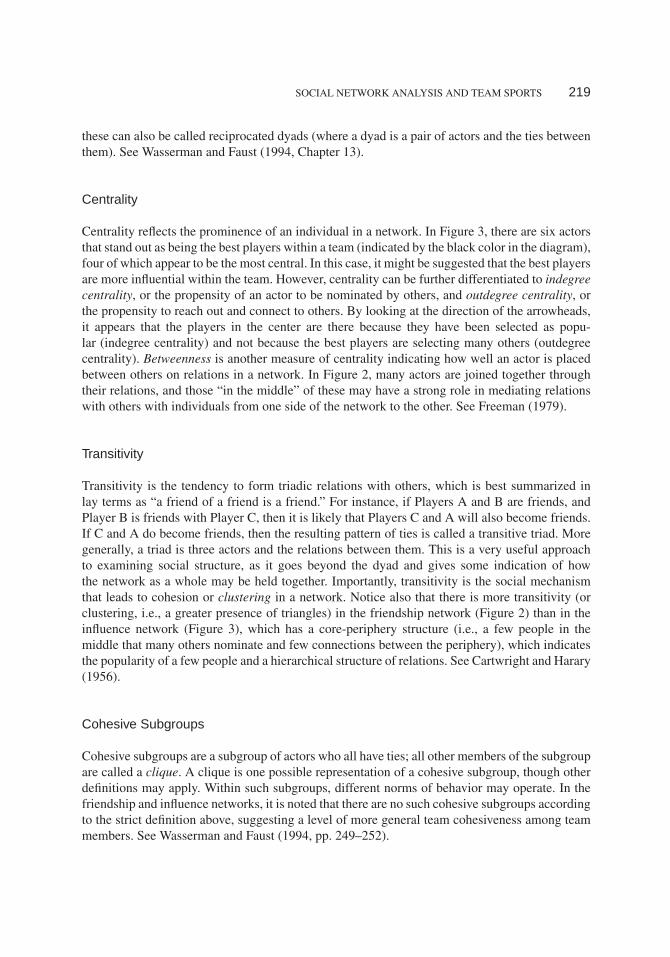
Reciprocity is the tendency for mutuality in relations between people in a network. This is a keysocial process, indicated by the acceptance of a handshake, or the philosophy “you scratch myback, I’ll scratch yours.” Note in the Figure 2 friendship network that there are many reciprocatedsocial ties, as indicated by the double-headed arrows between actors (players) in the network;
SOCIAL NETWORK ANALYSIS AND TEAM SPORTS 219
these can also be called reciprocated dyads (where a dyad is a pair of actors and the ties betweenthem). See Wasserman and Faust (1994, Chapter 13).
Centrality
Centrality reflects the prominence of an individual in a network. In Figure 3, there are six actorsthat stand out as being the best players within a team (indicated by the black color in the diagram),four of which appear to be the most central. In this case, it might be suggested that the best playersare more influential within the team. However, centrality can be further differentiated to indegreecentrality, or the propensity of an actor to be nominated by others, and outdegree centrality, orthe propensity to reach out and connect to others. By looking at the direction of the arrowheads,it appears that the players in the center are there because they have been selected as popu-lar (indegree centrality) and not because the best players are selecting many others (outdegreecentrality). Betweenness is another measure of centrality indicating how well an actor is placedbetween others on relations in a network. In Figure 2, many actors are joined together throughtheir relations, and those “in the middle” of these may have a strong role in mediating relationswith others with individuals from one side of the network to the other. See Freeman (1979).
Transitivity
Transitivity is the tendency to form triadic relations with others, which is best summarized inlay terms as “a friend of a friend is a friend.” For instance, if Players A and B are friends, andPlayer B is friends with Player C, then it is likely that Players C and A will also become friends.If C and A do become friends, then the resulting pattern of ties is called a transitive triad. Moregenerally, a triad is three actors and the relations between them. This is a very useful approachto examining social structure, as it goes beyond the dyad and gives some indication of howthe network as a whole may be held together. Importantly, transitivity is the social mechanismthat leads to cohesion or clustering in a network. Notice also that there is more transitivity (orclustering, i.e., a greater presence of triangles) in the friendship network (Figure 2) than in theinfluence network (Figure 3), which has a core-periphery structure (i.e., a few people in themiddle that many others nominate and few connections between the periphery), which indicatesthe popularity of a few people and a hierarchical structure of relations. See Cartwright and Harary(1956).
Cohesive Subgroups
Cohesive subgroups are a subgroup of actors who all have ties; all other members of the subgroupare called a clique. A clique is one possible representation of a cohesive subgroup, though otherdefinitions may apply. Within such subgroups, different norms of behavior may operate. In thefriendship and influence networks, it is noted that there are no such cohesive subgroups accordingto the strict definition above, suggesting a level of more general team cohesiveness among teammembers. See Wasserman and Faust (1994, pp. 249–252).
220 LUSHER, ROBINS, AND KREMER
Structural Equivalence
Structural equivalence defines actors in a network with identical (or very similar) ties to andfrom others in a network. For example, two senior players may each have (roughly equal anddistinct) groups of younger players that seek advice from them, though they, in turn, both turn tothe captain of the team for advice. They perform similar roles in the team with respect to theirrelations with others. Such knowledge could be used to better understand how formal mentoringsystems should be set up within a team or to refine the processes used to choose individuals forleadership positions. See Lorrain and White (1971) and White et al. (1976).
Structural Holes and Bridges
Individuals who are critical to the cohesiveness of a network are called bridges. They are saidto occupy structural holes, as their absence results in a breakdown in the cohesiveness of theoverall network. With either network, there do not appear to be any such structural holes, whichagain indicates a cohesive team. See Burt (1992).
Homophily
It is known that people tend to form social relations with similar others. Using SNA, it is possibleto understand which individual-level attributes are important for team members in their nominat-ing of others. For instance, are team members friends with others similar to them in age, or isability or experience or ethno-cultural background more or equally important? See McPherson,Smith-Lovin, and Cook (2001).
QUANTITATIVE ANALYSIS AND SOCIAL NETWORKS
Of course, if the goal is to quantitatively explore a social network, there are many tools to do so.Importantly, the interest may be in the individual-level characteristics of central team membersand why some players may be more popular than others. For instance, are team members withhigher sporting ability more trusted within the team (i.e., have high indegree centrality), or areplayers with more experience/age more trusted? Further, are older players more trusting of othersin the team (i.e., do they have higher outdegree centrality)? Such questions can be examinedusing SNA.
As a simple analysis, regression analyses can be used to explore the popularity of players withreference to certain player attributes. There are known issues to using regression (as noted belowin the next section), but it nonetheless provides a rough indication of the association betweenattributes and ties. To conduct an analysis of the impact of playing ability on friendship andinfluence, a measure of indegree centrality (i.e., the number of times a network actor is selectedby others) was derived for both networks using the UCINET software (Borgatti et al., 2006).Running this indegree centrality procedure creates a score for each player in the network, whichcan then be used with a standard statistical package (e.g., SPSS) as an individual-level variableand compared alongside other individual-level variables (in this case, the binary variable of best
SOCIAL NETWORK ANALYSIS AND TEAM SPORTS 221
player that was created before). For friendship, the linear regression of ability predicting friend-ship indegree nominations demonstrates a non-significant effect (ß = −.563, t(1, 33) = −.578,p > .05), indicating that ability is not related to nomination as a friend. However, a linear regres-sion of ability predicting influence indegree nominations shows a significant and positive effect(ß = 13.316, t(1, 33) = 6.843, p < .001). As such, it can be concluded that being one of the bestplayers in the team (i.e., having high ability) is associated with being seen as influential withinthe team. Certainly, from looking at Figure 2, it seems that the best players are friends with oneanother and, therefore, cluster together in one part of the network but are not necessarily morepopular than any others in the network. However, from Figure 3, it appears that a number ofthe best players are central in the network, and are, therefore, seen as influential; the regressionanalyses adds further weight to such an interpretation.
STATISTICAL MODELS FOR SOCIAL NETWORKS
Some simple analyses of two team networks using regression analyses have been presented.As these analyses take into account social network ties (friendship, influence) in conjunction withother individual-level attributes (binary best player status), such regression analyses move towardtaking the interdependency of social relations into account. Yet, it is noted that the standardstatistical methods of analysis still assume independent observations, and therefore, the problemof dependent observations have not been fully overcome, even though measures of social networkties have been included.
However, it is possible to use more sophisticated methodological techniques to analyze socialnetworks that specifically take interdependent observations into account. Due to their complex-ity, examples of such statistical models are not provided here, but instead, their importance isbriefly discussed. Recent cutting-edge developments in SNA permit the application of a par-ticular class of statistical models for social networks called exponential random graph models(ERGMs; Frank & Strauss, 1986; Pattison & Wasserman, 1999; Robins, Pattison, & Wasserman,1999; Wasserman & Pattison, 1996). For a more general methodological introduction to ERGMsand an empirical application within a sporting team context, see Lusher, Kremer, and Robins(forthcoming); for a more detailed methodological introduction to ERGMs, see Robins, Pattison,Kalish, and Lusher (2007).
ERGMs are intended to model the structure of network ties and can use attribute variablesas predictors of ties (e.g., through homophily effects). ERGMs, therefore, work as pattern-recognition devices, with the major intention being to explain why social ties occur. Accordingly,they can provide information about the association between ties and attributes. Because tiesare the predicted variable, ERGMs have a formal appearance of a logistic regression, but withtwo quite crucial distinctions. First, tie variables are both predictors and predicted, represent-ing the feedback effects implicit in any complex interdependency among network tie variables.For instance, ties might be modeled as more likely if they are reciprocated or if they form tri-angles. An ERGM has the explicit assumption of interdependent observations, which refers tothe presence of one social network tie as dependent upon the presence of other social networkties (as demonstrated by Frank & Strauss [1986] through conditional dependence assumptions).As such, the dependency is not between one variable and another, but within one variable (i.e.,
222 LUSHER, ROBINS, AND KREMER
social ties). Second, to cater properly for the interdependency, computationally intensive sim-ulation methods are required to produce principled maximum likelihood estimates. A softwareimplementing ERGM is available to model interdependent observations (for example, using thePNet program; Wang, Robins, & Pattison, 2005) and permits the researcher to include differ-ent variables to understand if they are implicated in the formation of social ties, in much thesame way that different variables may be entered into a regression model and compared againstone another as competing hypotheses or explanatory factors of the dependent variable. Withinthe ERGM, one can explore the presence of reciprocity, clustering, centrality, homophily, andmany other effects—all in one analysis. It is noted that analyses that are focused on actors’ socialties (i.e., social selection models) lead to a large n, even for a relatively small number of actorsbecause the number of possible ties is not n but n(n – 1). This permits an analysis of a relativelysmall number of participants without sacrificing statistical power.
An ERGM can be a complex methodology, but it is mentioned here with the intention of mak-ing the reader aware that sophisticated statistical tools are available for the analysis of social net-works in sporting teams. It has been noted that linear regression methods can be used with socialnetwork data, but precisely, linear regression can be used either to predict the attributes of peoplein networks or to predict the presence of social network ties. The use of linear regression as usedin this article has been for the former—the prediction of attributes using network indegree (a mea-sure of network centrality). This is often done in organizational studies (e.g., Brass & Burkhardt,1993). Although this approach is also inconsistent with the assumption of independence, it is tol-erable as, at best, a simple exploratory and approximate technique that may be helpful. However,the use of linear regression to predict social network ties, such as logistic regression, is consideredto be unacceptable, and an ERGM is strongly recommended as the preferred method. The distinc-tion in the use of linear regression in these two ways for SNA is that the former regression tech-nique focuses on attributes, where it is conceivable that the dependencies may not be so strong.On the other hand, it is known that dependencies among social network ties are typically quitestrong, and so the use of linear regression for the prediction of network relations is inappropriate.
CONCLUSIONS
SNA allows for the simultaneous examination of social relations and individual-level qualitiesamong members in a sporting team. This methodology, therefore, is able to incorporate a rangeof attitudes, behaviors, or other individual-level attributes and to examine how these may affectand be affected by team structures. Statistical models for social networks permit a quantitativeanalysis that can take into account complex interdependencies and also be applicable to rela-tively small teams. In summary, SNA offers the ability to shift the focus from measurements onindividuals to the team as a systemic unit of analysis, while still taking into consideration thequalities of individuals in the team.
ACKNOWLEDGMENT
The authors gratefully acknowledge the financial support of the Australian Football League(AFL) to assist with this project.
SOCIAL NETWORK ANALYSIS AND TEAM SPORTS 223
REFERENCES
Abbott, A. (1997). Of time and space: The contemporary relevance of the Chicago School. Social Forces, 75, 1149–1182.Barnes, J. A. (1954). Class and committees in a Norwegian island parish. Human Relations, 7, 39–58.Batagelj, V., & Mrvar, A. (2008). Pajek software (Version 1.23). University of Ljubljana, Slovenia.Borgatti, S., Everett, M., & Freeman, L. (2006). UCINET 6 for Windows: Software for social network analysis. Harvard,
MA: Analytic Technologies.Borgatti, S. P., & Foster, P. C. (2003). The network paradigm in organizational research: A review and typology. Journal
of Management, 29, 991–1013.Brass, D. J., & Burkhardt, M. E. (1993). Potential power and power use: An investigation of structure and behavior.
Academy of Management Journal, 36, 441–470.Burt, R. S. (1992). Structural holes. Cambridge: Harvard University Press.Carron, A. V., Colman, M. M., Wheeler, J., & Stevens, D. (2002). Cohesion and performance in sport: A meta analysis.
Journal of Sport & Exercise Psychology, 24, 168–188.Carron, A. V., & Dennis, P. W. (1998). The sport team as an effective group. In J. M. Williams (Ed.), Applied sport
psychology: Personal growth to peak performance (pp. 127–141). Mountain View, CA: Mayfield.Carron, A. V., Prapavessis, H., & Estabrooks, P. (1999). Team norm questionnaire. Unpublished manuscript, University
of Western Ontario, School of Kinesiology, London, Canada.Carron, A. V., Shapcott, K. M., & Burke, S. M. (2007). Group cohesion in sport and exercise: Past, present and future.
In M. R. Beauchamp & M. A. Eys (Eds.), Group dynamics in exercise and sport psychology (pp. 117–140). MiltonPark, Oxon: Routledge.
Carron, A. V., Widmeyer, W. N., & Brawley, L. R. (1985). The development of an instrument to assess cohesion in sportteams—the Group Environment Questionnaire. Journal of Sport Psychology, 7, 244–266.
Cartwright, D., & Harary, F. (1956). Structural balance—a generalization of Heider’s theory. Psychological Review, 63,277–293.
Colman, M. M., & Carron, A. V. (2001). The nature of norms in individual sport teams. Small Group Research, 32,206–222.
Emirbayer, M. (1997). Manifesto for a relational sociology. American Journal of Sociology, 103, 281–317.Frank, O., & Strauss, D. (1986). Markov graphs. Journal of the American Statistical Association, 81, 832–842.Freeman, L. C. (1979). Centrality in social networks conceptual clarification. Social Networks, 1, 215–239.Gammage, K. L., Carron, A. V., & Estabrooks, P. A. (2001). Team cohesion and individual productivity—The influence
of the norm for productivity and the identifiability of individual effort. Small Group Research, 32, 3–18.Gorgenyi, I. (1998). Hunting territory: The structure of team life—part 1. Sports Coach, 20, 18–21.Gould, P., & Gatrell, A. (1980). A structural-analysis of a game—the Liverpool v Manchester United Cup Final of 1977.
Social Networks, 2, 253–273.Kossinets, G. (2006). Effects of missing data in social networks. Social Networks, 28, 247.Leifer, E. M. (1990). Enacting networks—the feasibility of fairness. Social Networks, 12, 1–25.Lorrain, F., & White, H. C. (1971). Structural equivalence of individuals in social networks. Journal of Mathematical
Sociology, 1, 49–80.Lucius, R. H., & Kuhnert, K. W. (1997). Using sociometry to predict team performance in the work place. The Journal
of Psychology, 131, 21–32.Lusher, D., Kremer, P., & Robins, G. (forthcoming). Investigating trust relations in sporting teams using social analysis.Lusher, D., Robins, G., & Kremer, P. (2005). Masculine behaviour and social networks in team structures. Melbourne,
Australia: A Report for the Australian Football League (AFL).McPherson, M., Smith-Lovin, L., & Cook, J. M. (2001). Birds of a feather: Homophily in social networks. Annual Review
of Sociology, 27, 415–444.Monge, P. R., & Contractor, N. S. (2003). Theories of communication networks. New York: Oxford University Press.Nixon, III, H. L. (1993). Social network analysis of sport: Emphasizing social structure in sport sociology. Sociology of
Sport Journal, 10, 315–321.Patterson, M., Carron, A. V., & Loughead, T. (2005). The influence of team norms on the cohesion-self-reported
performance relationship: A multi-level analysis. Psychology of Sport and Exercise, 6, 479–493.Pattison, P., & Wasserman, S. (1999). Logit models and logistic regressions for social networks: II. Multivariate relations.
British Journal of Mathematical & Statistical Psychology, 52, 169–193.
224 LUSHER, ROBINS, AND KREMER
Robins, G., & Kashima, Y. (2008). Social psychology and social networks: Individuals and social systems. Asian Journalof Social Psychology, 11, 1–12.
Robins, G., Pattison, P., Kalish, Y., & Lusher, D. (2007). An introduction to exponential random graph (p∗) models forsocial networks. Social Networks, 29, 173–191.
Robins, G., Pattison, P., & Woolcock, J. (2004). Missing data in networks: Exponential random graph (p∗) models fornetworks with non-respondents. Social Networks, 26, 257–283.
Robins, G., Pattison, P., & Wasserman, S. (1999). Logit models and logistic regressions for social networks: III. Valuedrelations. Psychometrika, 64, 371–394.
Scott, J. (2000). Social network analysis: A handbook (2nd ed.). Thousand Oaks, CA: Sage Publications.Wang, P., Robins, G., & Pattison, P. (2005). PNet: A program for the simulation and estimation of exponential random
graph models. University of Melbourne.Wasserman, S., & Faust, K. (1994). Social network analysis: Methods and applications. Cambridge: Cambridge
University Press.Wasserman, S., & Pattison, P. (1996). Logit models and logistic regressions for social networks. 1. An introduction to
Markov graphs and p. Psychometrika, 61, 401–425.White, H. C., Boorman, S. A., & Breiger, R. L. (1976). Social structure from multiple networks. I. Blockmodels of roles
and positions. American Journal of Sociology, 81, 730–780.