Embed Size (px)
Citation preview

WILLIAM D. NORDHAUS
Yale University
The Allocation
of Energy Resources
ABUNDANT ENERGY AT LOW COST iS fundamental to a highly industri- alized economy like the United States. The American way of life is hard to visualize without commuters, television, overheated houses, aluminum cans, and jet setters; yet it is equally difficult to conceive of substitutes for these hallmarks of American society if cheap energy were no longer available.
Given the dependence on energy, there has been perennial anxiety over the adequacy of the nation's resources for meeting its apparently insatiable appetite for energy. More recently, the concern for adequacy of energy has been embedded in a more general pessimism about the viability of eco- nomic growth on a finite world.' This new and pessimistic view about economic growth holds that growth is limited by a finite amount of essen- tial, depletable natural resources. In the process of consuming finite re- sources, the world standard of living descends inexorably toward that of Neanderthal man.
Note: The research underlying this paper was supported by the National Science Foundation. I am grateful for helpful comments by Gary Haller, Tjalling C. Koopmans, Alan S. Manne, and members of the Brookings panel. In addition, Paul Krugman provided research assistance extraordinary. Remaining errors are, of course, my re- sponsibility.
1. See Paul R. Ehrlich and Anne H. Ehrlich, Population, Resources, Environment: Issues in Human Ecology (W. H. Freeman, 1970); Jay W. Forrester, World Dynamics (Wright-Allen, 1971); Donella H. Meadows and others, The Limits to Growth: A Report for the Club of Rome's Project on the Predicament of Mankind (Universe Books, 1972); "A Blueprint for Survival," The Ecologist, Vol. 2 (January 1972), pp. 1-22.
529

530 Brookings Papers on Economic Activity, 3:1973
If such a scenario is plausible, the crunch probably will be felt first in energy resources. For one thing, energy is an essential input in many processes, required by the laws of physics. Although more efficient use might save energy, it simply is not possible to heat houses, produce alumi- num, run transportation systems, or generate electricity without it. With the exception of food, no other single commodity is so essential. Second, energy resources are nonrenewable. Aside from hydro, no significant use is now made of renewable sources (such as solar, geothermal, or gravi- tational energy, or wood) in the United States. Third, energy resources cannot be recycled. Once coal or petroleum is burned its energy dissipates beyond economical recapture. Finally, the enormous current and prospec- tive energy consumption raises difficult environmental problems. No cur- rently used fuel is completely clean, economical, and abundant.
Energy resources, then, are a likely test case for examining resource scarcity. In what follows, I will first explore the use of markets to allocate scarce resources over time, and then turn explicitly to an empirical estimate of the efficient allocation of energy resources.
The Role of Markets for Resources
In the United States, the prices of appropriable resources have for the most part been determined by market forces.2 Why has public policy ac- cepted a laissez-faire approach to resource pricing?
The intellectual basis for allowing market determination of prices lies in the theory of general economic equilibrium. This theory assumes that there are consumers with initial resources and given preferences, and producers operating with well-defined technical relations. The theory can embrace many time periods and uncertainty about the exact demand or supply con- ditions; but it assumes convex production and preference sets, and that markets exist for all goods, services, and contingencies. This means that there must be futures markets for, say, petroleum and coal in the year 2000; and there must be insurance markets for such contingencies as the failure of breeder processes to become economically viable. Also, all the costs and benefits of a particular process of production must be internalized to the
2. An appropriable resource is one for which all rewards or penalties from services or uses accrue to the owner.

William D. Nordhaus 531
decision maker. Under the above conditions a market system will have a general equilibrium of prices and quantities. There is nothing in such a market system that will ensure an equitable distribution of consumption over space or time. But the equilibrium will be efficient in the sense that there is no way of improving the lot of one consumer without worsening the lot of another. Expressed differently, the prices are appropriate indicators of social scarcity given the preferences and initial endowments of the society.
The application of the results of market equilibrium analysis to depleta- ble natural resources is straightforward. In considering these I distinguish between extraction costs, the vector z(t), or the marginal cost per unit of output excluding rents and royalties; and royalties, the vector y(t),3 which are a reflection of the presumed scarcity of a particular resource. The t refers to the time period.
Consider a world of certainty and a time horizon of T years.4 There are R(t) units of the resource remaining at any point of time, and extraction costs are zero up to the resource limit. If alternative assets yield a rate of return, r(t), the equilibrium condition for some owners to hold and others to sell the resource is equality between the rate of capital gains on the re- source and the interest rate:
(1) Ay(t) =r(t) y(t)
where Ay is the change in y. Thus the resource price rises exponentially at the interest rate.
There is a family of solutions to equation (1), each having different levels of y. The unique solution depends on the terminal condition that all re- sources are used up at the end of the last period (T): (2) y(t), such that R(T) = 0.
There generally will be a unique set of prices satisfying (1) and (2).
3. I use "royalty" to denote the difference between price and marginal extraction cost, a concept similar to rents on land. Royalties have many other meanings in re- source economics.
4. The terminal point can be a sticky issue. If there exists what I later call a "back- stop technology" (roughly, a substitute process with infinite resource base), then T is the time at which transition to it is completed; if resources are finite and essential, and no backstop technology exists, T is the time of extinction. For an analysis of the second case, see Tjalling C. Koopmans, "Some Observations on 'Optimal' Economic Growth and Exhaustible Resources," Cowles Foundation Discussion Paper 356 (Cowles Foun- dation, March 1973; processed).

532 Brookings Papers on Economic Activity, 3:1973
More interesting is the case where extraction costs are positive. Price, p(t), is the sum of current extraction cost and royalty:
(3) p(t) = z(t) + y(t) .
In efficient allocations, resources are extracted when their present value is maximized. The present value of the profit from selling a unit of the resource at time t when extraction cost is zo is [p(t) - zo] exp(- rt), and this is maximized if t is chosen so that Ap(t) = r[p(t) - zo], or when
(4) AP r=(r - ZO) = ap (P-0 = Y
If production of a resource with cost zo occurs for all t, then (4) must hold for all t. Moreover, for all periods when sales occur, (p - zo)exp(-rt) is constant-this being a solution to (4). During periods when sales are oc- curring, Ay/y = r, so (1) is satisfied. Since y = p - zo is the royalty at time of extraction, the new condition for recovering a resource is that the ex- pected rate of increase of the price of the resource be less than or equal to the interest rate times the share of royalties in the total resource price. This rate will always be less than the interest rate. If extraction costs are con- stant, royalties will again satisfy the exponential relation shown in (1); since the share of the royalty increases to unity, the resource price will ac- celerate toward a rate of increase of r.
In the analysis of programs developed below, the path of prices can be made considerably more explicit. Today's energy technology is highly de- pendent on resources that are very cheap to extract but relatively scarce when viewed over a very long time horizon. In this technology royalties to scarce low-cost resources may be relatively important in today's price. Over the next century or so, many low-cost energy resources will be largely de- pleted, leaving more abundant but also more expensive resources. Ulti- mately, if and when the transition is completed to an economy based on plentiful nuclear resources (either through breeder or fusion reactors), the economic importance of scarcity of resources will disappear, and capital and labor costs alone will determine prices. This ultimate technology- resting on a very abundant resource base-is the "backstop technology" and is crucial to the allocation of scarce energy resources.
An oversimplified example will show how the backstop technology en- ters. Consider two processes for generating electricity. One process uses one unit of petroleum per unit of output; petroleum resources are finite in
William D. Nordhaus 533
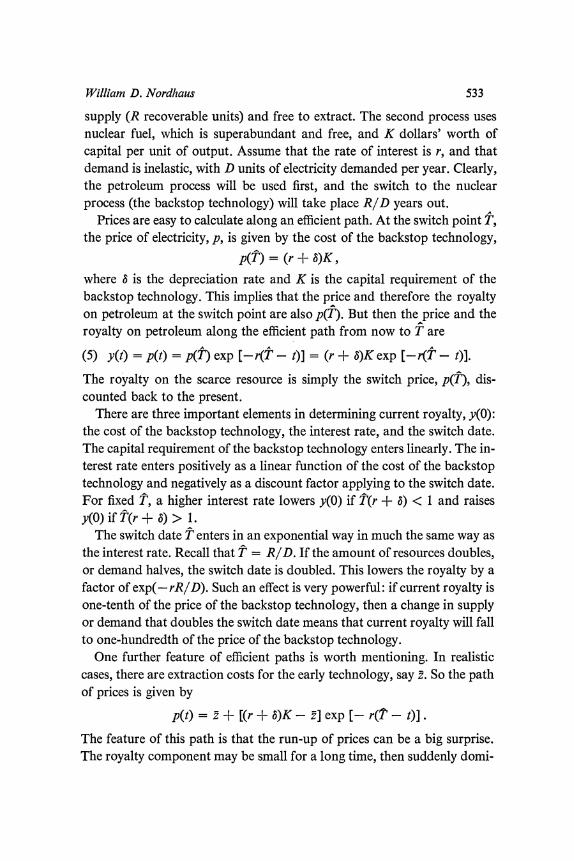
supply (R recoverable units) and free to extract. The second process uses nuclear fuel, which is superabundant and free, and K dollars' worth of capital per unit of output. Assume that the rate of interest is r, and that demand is inelastic, with D units of electricity demanded per year. Clearly, the petroleum process will be used first, and the switch to the nuclear process (the backstop technology) will take place R/D years out.
Prices are easy to calculate along an efficient path. At the switch point T, the price of electricity, p, is given by the cost of the backstop technology,
p(T) = (r + 3)K, where 8 is the depreciation rate and K is the capital requirement of the backstop technology. This implies that the price and therefore the royalty on petroleum at the switch point are also p(T). But then the price and the royalty on petroleum along the efficient path from now to T are
A A A
(5) y(t) = p(t) = p(T) exp [-r(T - t)] = (r + S)K exp [-r(T - t)].
The royalty on the scarce resource is simply the switch price, p(T), dis- counted back to the present.
There are three important elements in determining current royalty, y(O): the cost of the backstop technology, the interest rate, and the switch date. The capital requirement of the backstop technology enters linearly. The in- terest rate enters positively as a linear function of the cost of the backstop technology and negatively as a discount factor applying to the switch date. For fixed T, a higher interest rate lowers y(O) if T(r + 6) < 1 and raises y(O) if T(r + 6) > 1.
The switch date T enters in an exponential way in much the same way as the interest rate. Recall that T = R/D. If the amount of resources doubles, or demand halves, the switch date is doubled. This lowers the royalty by a factor of exp(- rR/D). Such an effect is very powerful: if current royalty is one-tenth of the price of the backstop technology, then a change in supply or demand that doubles the switch date means that current royalty will fall to one-hundredth of the price of the backstop technology.
One further feature of efficient paths is worth mentioning. In realistic cases, there are extraction costs for the early technology, say z. So the path of prices is given by
p(t) = z + [(r + 6)K - f] exp [-r(T - t)].
The feature of this path is that the run-up of prices can be a big surprise. The royalty component may be small for a long time, then suddenly domi-

534 Brookings Papers on Economic Activity, 3:1973
nate. Thus, for a 10 percent interest rate, if royalty is 5 percent of price, prices in successive decades rise at rates of 8 percent, 19 percent, 41 percent, 76 percent, 112 percent, and up to a maximum of 159 percent. A high interest rate keeps royalties low initially, but when they rise they really take off. This acceleration can wreak havoc for producers who are locked into capital goods and have extrapolative expectations.
This simplified example illustrates the technique for estimating efficient energy prices in the next section. As equation (5) indicates, if the price of the backstop technology is low, if the switch date is far off, or if the interest rate is high, then the royalty on energy resources is relatively low. Conversely, if these conditions are reversed, the royalty on energy resources is high. The question explored in the next section is whether the current market-determined royalty on energy resources is close to that associated with an efficient path for the allocation of energy resources. Unfortunately, the calculation required to get the answer is extremely complex. Since there are many sources and grades of energy resources, many uses, and many demand categories, each with peculiar specifications, calculation of the optimal path and the switch points for different resources is cumbersome.
A further extension of the model considers the functioning of resource markets under uncertainty. The complete general equilibrium analysis dis- cussed above requires not only a complete set of futures markets, but also a complete set of insurance markets or contingent commodities markets. The insurance markets would span all economically relevant events, such as whether and when breeder reactors become available; what the future course of population growth will be; what happens in Mideast politics; whether very large oil reserves in Alaska will be recoverable; whether en- vironmental policy will be tough or lenient. In each case, a contingent com- modity would be sold: for example, one barrel of crude in January 1984, if the trans-Alaska pipeline is not built. It can be shown that the price system is ex ante efficient as long as a complete set of futures markets exists.
An important difference between the model and the real world is that a full set of futures and insurance markets is not available. Although long- term contracts are often made-these being rough substitutes for futures markets-they are relatively rare; and I am unaware of any insurance mar- kets for selling resources contingent on the state of the world.5
5. The sale, option, or leasehold arrangements currently employed for oil-, gas-, and ore-bearing lands are not good substitutes for futures markets (1) because they repre- sent sale of rights to recover to producers (for example, coal companies) rather than

William D. Nordhaus 535
What are the possible consequences of the absence of a complete set of futures and insurance markets? Three problems might be serious.
The first complication concerns the appropriate discount rate to use in resource decisions. Recall from equation (1) that the equilibrium condition for the resource market is that prices rise at the same rate as the interest rate. In an uncertain world, this means that prices rise at the discount rate appropriate for the owners of the resource. It has often been argued that the discount rate used in the United States for private investment is generally too high. The sources of the positive differential between private and social discount rates are risk and taxes.
In the absence of perfect risk and insurance markets, the owners of re- sources will bear risks associated with price volatility, the incursion of com- peting resources into established markets, the advent of new technologies, and so forth. Many economists have argued that such risks are not always social risks because they can be widely spread over the population, or more precisely, because the effects of risk on output are very small relative to av- erage income.6 If this is the case, then the private discount rate will be above the appropriate social discount rate. A second force that points in the same direction is the existence of taxes on capital income. An investment in resources that has an annual rate of capital gain of rb has an after-tax rate of return ra = rb(l - T) (r is the tax on capital income). Again, if the pretax interest rate is the social discount rate, then the presence of capital taxes will make the equilibrium rate of capital gain too high. Tax rates vary greatly, of course, from virtually zero for petroleum extraction to more than 50 percent for capital gains on land or for royalties accruing to corpora- tions; but the existence of general capital taxes causes a distortion in the required rate of return.
The distortion of the interest rate is a particularly serious problem in natural resources. As can be seen in equations (1) to (4), too high an interest rate casts a long shadow over the future. When royalties dominate the price, too high an interest rate tilts the entire price path in favor of the present, with the result that resources are consumed too quickly.
sales to ultimate consumers (say, utility companies); and (2) because they are spot mar- kets or very short-run futures markets. In the cosmic framework of the ultimate ex- haustion of fossil fuels or energy sources or phosphorus, these transactions cover a very short span.
6. Prominent in this discussion has been the work of Kenneth J. Arrow. See his Es- says in the Thzeory of Risk-Bearing (Markham, 1971), especially Chap. 11.
536 Brookings Papers on Economic Activity, 3:1973
The second possible complication involves myopic decisions. In the present context, "myopia" means that the planning horizons of economic agents are relatively short.
Myopic decisions are a possibility because of the absence of futures markets. Recall that expected capital gains play a crucial role in resource decisions. Take two polar strategies toward investment in resources-an in-and-out strategy (buying on the speculation of short-term gain) or a buy- and-hold strategy (buying with the intention of selling the ultimate com- modity under the soil rather than the land). Up to now the buy-and-hold strategy was assumed to dominate. Say that investors have an in-and-out strategy, buying titles to resources with an eye to capital gains rather than to selling the resources directly, and, for simplicity, that all investors plan to sell after one period. This leads to the equilibrium condition outlined in equation (1) or (4) above: the market is in equilibrium when investors ex- pect that the (one-period) capital gain on the asset is equal to the (risk- corrected) one-period interest rate. The most important point is that this condition has no unique solution; rather, the path depends on expectations. Indeed, a path with zero royalties will satisfy the myopic equilibrium-for a while.
The missing element in this system is the "global planner" (or speculator) who calculates the quantities demanded along a price path to see whether they are consistent with overall availabilities (the calculation implicit in equation 2). The reason why pricing of resources might be myopic is that very few planners have the ability, or perhaps even the desire, to check con- sistency for several decades.
The third complication that may arise in resource markets is price insta- bility. Recall that the price includes a recovery cost and a royalty. At a given moment, the recovery cost is well determined by the current tech- nology and factor costs, but the royalty is not; rather, it depends on future conditions of supply and demand. More precisely, the royalty calculation derives from knowledge about the paths of output and input prices over the indefinite future.
Given the structure of markets, the royalty may exhibit considerable in- stability. The instability results from the role price changes play in affecting both demand and expectations in spot markets. A supplier of a resource can observe only current and past resource prices. In line with earlier dis- cussion, it seems reasonable to assume that, without information from futures markets, the quantity supplied will be positively related to the dif-

William D. Nordhaus 537
ference between the interest rate and the expected rate of price increase of the resource. Thus if prices are expected to rise more rapidly than the interest rate, suppliers will cut down on production in anticipation of future capital gains. The response of consumers, however, accelerates this process. As production is cut back, prices rise more rapidly, and as they do, pro- ducers expect even more rapid rises, leading to further production de- creases. And so on. The same sort of instability can be seen for price reductions as well.
The result of this interaction of supply and demand response is that the royalty component of resource price may behave in an unstable manner. In the case described above, royalty determination in spot markets leads either to a dynamically unstable or to an inefficient path.
It can be argued on the basis of this discussion that the market mech- anism now existing in the United States is an unreliable means of pricing and allocating exhaustible appropriable natural resources. The absence of futures and insurance markets rules out the theorems usually drawn from general equilibrium theory. The possibility of instability in resource mar- kets is a further complication. The most serious potential obstacle to the market's (or anybody's) finding the correct price lies in determining the appropriate royalty, or scarcity rent, on exhaustible resources. The differ- ence between exhaustible resources and other commodities is that the share of royalties is relatively small for these others. Unfortunately, an estimate of whether current usage is too fast or too slow cannot be made a priori; it can emerge only from a carefully constructed econometric and engineer- ing model of the economy.
Efficient Allocation of Energy Resources
The upshot of the foregoing discussion is that markets, in their current form, may be unreliable ways to allocate exhaustible resources. Energy re- sources are perhaps the best example of this problem. They are essential, and perforce their consumption stretches over a very long period. They, and their products, have no futures markets. Because the availability of re- sources and future technologies are uncertain, so is the path of energy con- sumption. As if the basic economic problems were not sufficiently compli- cated, recently there has been considerable political interference, expressed through the operation of the petroleum market by exporting countries, the
538 Irookings Papers on Economic Activity, 3:1973
regulation of prices of natural gas and petroleum products by the U.S. gov- ernment, and the setting of environmental standards by virtually everybody. It takes an act of faith to believe that "the market" can somehow see the proper allocation through this tangle of complexity, uncertainty, and politics.
What alternative exists to relying on an incomplete set of markets? In the face of this uncertainty, two basic approaches are open to finding the ap- propriate allocation.7 The most appropriate strategy-called "indicative planning" by Meade-is to match up future supplies and demands in a simulated market: the government summons all the citizens to a meeting in Yankee Stadium, gives them a set of questionnaires (listing trial prices), and asks for their demands and supplies. The process continues until it yields a balanced set of supplies and demands.8
While this approach is intriguing, all the current and future citizens can hardly gather in Yankee Stadium. Meade considers a second technique- econometric forecasting:
If one knows all the technological and behavioural relationships in the economy- that is to say, what outputs can be produced with what inputs and how citizens as entrepreneurs, workers, savers, consumers, etc., re-act to changes in prices, costs, incomes, interest rates, etc.-if one knows the starting point of the economy, that is to say the existing capital equipment and so on-and finally if one knows how the future exogenous variables will behave, and we are in fact assuming that there are no environmental uncertainties-then theoretically ... one should be able to forecast the future course of all prices and quantities in all markets.9
What I propose to do is to find a middle ground between the two ap- proaches. On the one hand, there are considerable data on the supply side of the energy market-enough to allow an intelligent guess as to how a profit-maximizing firm would behave when faced with a set of current and future prices for energy resources and products. On the other hand, there is considerable uncertainty about the demand relations. To determine the efficient allocation of energy resources then requires calculating how a com- plete set of spot and futures markets would allocate resources, given the best data available at the present time.
7. This line of thought was suggested by J. E. Meade in The Theory of Indicative Planning (Manchester University Press, 1970), and further spelled out in his The Con- trolled Economy (State University of New York Press, 1972).
8. See Meade, Theory of Indicative Planning, Chap. 4. 9. Ibid., p. 12.

William D. Nordhaus 539
The general procedure calls for calculating the allocation of different re- sources over time that minimizes the cost of meeting the demands, using the data on the time path of demand for various energy products, on the finite stocks of energy resources, and on the costs of alternative processes for transforming them into energy products.
MODELING DETAILS
Given the immense trade in energy products it is impossible to treat the allocation of energy resources as a problem for the United States alone. The purview is therefore the non-Communist world, which is broken into five regions: the United States, Western Europe, Japan, the Persian Gulf and North Africa, and the rest of the world (ROW). The problem is, fur- thermore, of a very long-run nature; in principle-as described below-it has an infinite time horizon. In practice, the analysis covers two hundred years, embedded in a longer-run model as described below.
At present there are four important energy resources: petroleum, coal, natural gas, and uranium-235. In the future oil shale and uranium-238 will probably join this list. On the demand side, the model specifies five demand categories: electricity, industrial heat, residential heat, and two transport categories.
Once this framework is determined, there remains little room for maneuver. The problem already strains reasonable computational budgets. In particular, the analysis cannot take elastic demand curves or exchange rate adjustments into account, although these are important problems.
DEMAND
The five demand categories for energy products have been broken down as follows:
1. Electricity. 2. Industrial nonelectric energy uses: process and space heating, rail,
subway, and ship. There are virtually no constraints on how these demands are satisfied (except imposed environmental standards) and thus the cost of fuel is the major consideration.
3. Residential nonelectric uses: space and other heating. This use is

540 Brookings Papers on Economic Activity, 3:1973
limited to fuels that are relatively easy and clean to process in small quantities.
4. Substitutable transportation: truck, bus, and 75 percent of automo- bile use. These uses are those for which fuels other than gasoline, particu- larly electricity, can be substituted relatively easily.
5. Nonsubstitutable transportation: air traffic and 25 percent of auto- motive. These are the long-distance uses that electricity cannot easily satisfy.
Table 1 shows an estimate of the energy consumption pattern by fuel and
Table 1. Per Capita Energy Consumption in the United States, by Type of Fuel and Demand, 1929 and 1968 Millions of Btua
Demand category
Transportationb Heat
Non- Elec- Indus- Resi- Substi- substi- Total
Fuel Year tricity trial dential tutable tutable demand
Petroleum 1929 0.5 12.7 17.8 12.1 4.0 47.2 1968 7.8 22.2 27.6 45.9 19.7 123.3
Natural gas 1929 1.0 3.5 3.1 0.0 0.0 7.5 1968 17.6 41.0 33.0 0.0 0.0 91.6
Nuclear 1929 0 e a e e e
1968 0.7 0 0 0 0 0.7
Coal 1929 9.7 76.5 36.2 0 0 122.4 1968 36.3 24.9 2.5 0 0 63.7
Hydro 1929 6.6 0 0 0 0 6.6 1968 13.5 0 0 0 0 13.5
Total 1929 17.8 92.7 57.1 12.1 4.0 183.8 1968 75.9 88.0 63.1 45.9 19.7 292.6
Sources: William H. Lyon and D. S. Colby, "Production, Consumption, and Use of Fuels and Electric Energy in the United States in 1929, 1939, and 1947," Report of Investigations 4805 (U.S. Bureau of Mines, 1951; processed); and Associated Universities, Inc., Reference Energy Systems and Resource Data for Use in the Assessment of Energy Technologies (AU, April 1972). Figures may not add to totals because of round- ing.
a. The common measure of energy used in the present paper is the British thermal unit (Btu). Conversion factors are 5.8 million Btu per barrel of petroleum; 25.8 million Btu per ton of bituminous coal; 1,000 But per cubic foot of natural gas; and 3,413 Btu per kilowatt-hour.
b. Substitutable uses are those for which fuels other than gasoline can be substituted relatively easily: trucks and buses and 75 percent of automotive uses; nonsubstitutable uses are for aviation and 25 percent of automotive uses.
c. Technology unknown in 1929.

William D. Nordhaus 541
by demand category for 1929 and 1968.10 A glance indicates the pervasive changes over the past forty years. They have taken two forms: (1) within specific categories of consumption there have been dramatic shifts in fuel composition (for example, the wholesale shift from coal to natural gas and petroleum, and the expanded use of both for industrial heat and elec- tricity generation); and (2) the differential growth of demand categories (such as the shift from rail and water to automobile and jet trans- port, the rapid growth of electricity, and the decline in industrial heating uses)."'
In face of the impossibility of detailing every conceivable kind of change, it seems reasonable in projecting future trends to focus on these two general kinds of structural change.
Unfortunately, it has not been possible to introduce the more general substitution by ultimate consumers of other products for energy products. Thus the demand for each specific category is a fixed path over time. To have it otherwise involves nonlinearities that are computationally very difficult. Most studies of the final demand categories indicate that price elasticities are quite low, lying mostly between zero and unity. On the other hand, studies that introduce interfuel substitution not surprisingly indicate considerably higher cross-elasticities of demand. The framework set out here is more pessimistic in one sense since it assumes no responsiveness of final demand to price. But it is undoubtedly more optimistic in its assump- tion that fuels are perfectly substitutable for meeting demand requirements. It would be desirable to test the sensitivity of the results to some price elas- ticity of final demand.
SUPPLY
The supply side is much more complicated, but fortunately the data are much better. Supply for each product involves three stages:
10. The common measure of energy used in this paper is the British thermal unit (Btu). Conversion factors are 5.8 million Btu per barrel of petroleum; 25.8 million Btu per ton of bituminous coal; 1,000 Btu per cubic foot of natural gas; and 3,413 Btu per kilowatt-hour.
11. Two nonenergy uses for energy inputs that have been omitted are needs for petrochemical feedstocks and for direct conversion of hydrocarbons into food. I have assumed that 10 percent of all natural and synthetic oil is reserved for nonenergy uses, which seems adequate for at least 150 years. After that period, inputs for these uses must come from even lower-grade resources, which are very abundant but relatively expensive.

542 Brookings Papers on Economic Activity, 3:1973
Extraction is the crucial part of the model, for the resource availabilities are the basic constraining factor. Table 2 shows the distribution of each of the five major kinds of producible resources, by region. Given resource availabilities, the capital and labor requirements of resource extraction are taken into account.
Transportation costs in the model are based on estimated capital and current costs and distances involved.
The last step is processing the fuels to meet final demand. This is the most difficult question in that it involves some processes that are yet unproven. In Table 3, which is a schematic presentation of the different technologies, two things are especially interesting. First, it reveals a considerable range of interfuel competition, especially for electricity and heat. Second, it designates processes according to their state of technical development, starting with A, the current technology whose properties are relatively well known, and progressing to D, which is speculative and whose properties are little known.
Table 2. Recoverable Energy Resources, by Type of Fuel and Regions of the World, 1970a Quadrillions (1015) of Btu
Persian Gulf and Rest
United Western North of the Fuel States Europe Africa world Total
Fossil Petroleum
Proven reserves 213 70 2,543 756 3,582 Unproven but recoverable 350 34 1,755 2,103 4,242
Coal 33,588 8,626 0 17,915 60,129 Shale oil 11,362 1,090 0 12,328 24,780 Natural gas 447 83 3,409 2,268 6,207
Total fossil 45,960 9,903 7,707 35,370 98,940
Nuclear U-235 ... ... ... ... 1,504,100 U-238 ... ... ... ... 206,970,000
Total nuclear ... ... ... ... 208,474,100
Total recoverable energy resources ... ... ... ... 208,573,040
Addendum: World energy consumption, 1965 ... ... ... ... 154
Sources: Given in an appendix available upon request from author. a. All fuels are calculated at their theoretical energy content. Nuclear fuels are not allocated by region.
All quantities apply a conventional recovery rate to original resources in place.

William D. Nordhaus 543
Table 3. Technologies Used in Processing Energy Resources, by Type of Fuel and Demand
Technology, by demand category,a
Heat Transportationb
Substi- Nonsub- Fuel Electricity Industrial Residential tutable stitutable
Petroleum Refine for Refine for standard oil or gasoline power (A) use in standard oil-fired plant (A)
Shale Mine and retort shale (B) and oil Refine for use as petroleum (A)
Coal Use in standard coal-fired Gasification Production of synthetic plant (A) with: into crude (C) and
Sulphur scrubbing (B) or either Refine for use as gasoline Low-sulphur coal (A) or pipeline- or aviation fuel (A) Gasified coal (B) quality
high-Btu gas, or into low- Btu gas (B)
Nuclear Light-water Resistance heating or heat Medium- Hydrogen- reactor pump (A) range fueled au- (A) or electric tomobile
Breeder re- automo- and air- actor (B) bile (C) craft (D)
Natural gas Use in standard gas-fired equipment (A) Ruled out as uneconomical
Sources: Developed by author. Underlying process data are given in an appendix available on request from author.
a. Technologies are designated according to their state of development: A = current widespread use; B = pilot plants operating currently; C = in development; D = speculative.
b. See Table 1, note b, for definitions.
Several potentially important technologies are not included. One is solar energy, indubitably an attractive resource but one whose current capital cost for, say, electricity generation is perhaps a hundred times that of con- ventional equipment.12 Another is the production of alcohol from grain
12. Hoyt C. Hottel and Jack B. Howard, New Entergy Technology: Some Facts and Assessments (MIT Press, 1971), p. 343.

544 Brookings Papers on Economic Activity, 3:1973
crops, but this method would not become competitive until wheat, for ex- ample, fell to 50 cents a bushel (from the late 1973 price of $5). It seems a safe bet that no exotic new technologies will become dominant within the next decade.
Table 4 gives a rough idea of the resource costs exclusive of royalties of
Table 4. Cost of Intermediate Energy Products Exclusive of Royalties, by Sourcea
Cost in 1970 dollars Cost in 1970 dollars Energy source (per million Btu) (per cotnventional unit)b
CRUDE PETROLEUM0
United States Category 1 Drilled reserves 0.05 0.29 Category 2 Undrilled reserves 0.42 2.41 Category 3 Undrilled reserves 0.52 3.02 Category 4 Undrilled reserves 0.81 4.70 Category 5 Undrilled reserves 1.15 6.17 Category 6 Undrilled reserves 3.35 19.45 Persian Gulf and Northl Africa Category 1 Drilled reserves 0.01 0.06 Category 2 Undrilled reserves 0.05 0.29 CRUDE OIL FROM SHALE
United States 25 gallons per ton of shale 0.96 5.58 10 gallons per ton of shale 2.00 11.59 COAL
United States Liquefied 1.31 7.62 Gasified 1.19 1.19 Strip mined 0.29 6.07 Deep mined 0.47 9.69 ELECTRICITY GENERATION
Petroleum 2.03 7.5 mills Natural gas 1.62 5.5 mills Coal 3.17 10.8 mills Light water reactor 2.51 8.6 mills Breeder reactor 3.12 10.6 mills HYDROGEN (BY ELECTROLYSIS) 5.46 ...
Sources: The underlying data for these estimates are in an appendix, available upon request from author. a. All cost figures (except electricity) are at minehead or wellhead. Electricity costs are busbar. Costs
include direct costs (capital and current costs), but exclude any shadow prices or royalties. b. Per barrel for crude petroleum, crude oil from shale, and liquefied coal; per thousand cubic feet
for gasified coal; per ton for strip-mined and deep-mined coal; per kilowatt-hour for electricity generation. c. Petroleum was separated into six different cost categories for the United States and two categories for
all other regions. Category 1, the lowest cost, is drilled reserves, while categories 2 through 6, the highest cost, are undrilled.
William D. Nordhaus 545
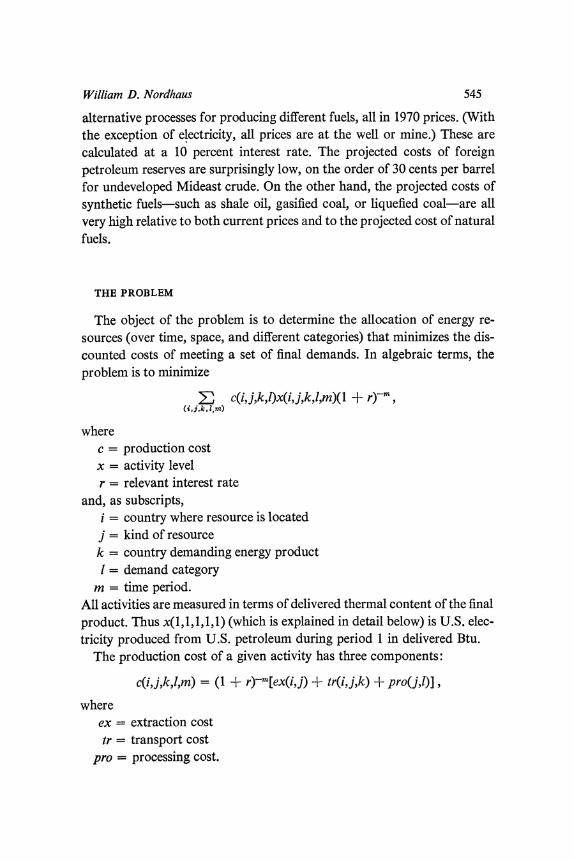
alternative processes for producing different fuels, all in 1970 prices. (With the exception of electricity, all prices are at the well or mine.) These are calculated at a 10 percent interest rate. The projected costs of foreign petroleum reserves are surprisingly low, on the order of 30 cents per barrel for undeveloped Mideast crude. On the other hand, the projected costs of synthetic fuels-such as shale oil, gasified coal, or liquefied coal-are all very high relative to both current prices and to the projected cost of natural fuels.
THE PROBLEM
The object of the problem is to determine the allocation of energy re- sources (over time, space, and different categories) that minimizes the dis- counted costs of meeting a set of final demands. In algebraic terms, the problem is to minimize
E c(i,j,k,lx(i,j,k,l,m)(1 + r)', (i, j,k, ,m)
where c = production cost x = activity level r = relevant interest rate
and, as subscripts, i = country where resource is located j = kind of resource k = country demanding energy product 1 = demand category
m = time period. All activities are measured in terms of delivered thermal content of the final product. Thus x(l,1,1,1,1) (which is explained in detail below) is U.S. elec- tricity produced from U.S. petroleum during period 1 in delivered Btu.
The production cost of a given activity has three components:
c(i,j,k,l,m) = (1 + r)-m[ex(i,j) + tr(i,j,k) + pro(j,J)],
where ex = extraction cost tr = transport cost
pro processing cost.

546 Brookings Papers on Economic Activity, 3:1973
These in turn are
ex(i,j) = [r + be(j, j)] Ke(i,j) + Le(i,j)
tr(i,j,k) = [r + at]Kt(i,j,k) + Lt(ij,jk)
pro(j,l) = [r + 81]KP(j,l) + LP(jj,} /eff(j,T), where
Si = depreciation rate, i = ex, tr, pro Ki = investment requirement, i = ex, tr, pro Li = current inputs, i = ex, tr, pro eff = thermal efficiency of process,
and the superscript e refers to the extraction sector, t to the transportation sector, and p to the processing sector.
The activities are
x(i,j,k,l,m) - flow of resource j from area i to demand category I in country k and time period m,
where i = 1, ..., 4 (the United States, Western Europe, Persian Gulf and
North Africa, ROW) j = 1, . . ., 17 (six petroleum categories for the United States, two for
other countries; two shale oil categories; stripping coal; deep coal; natural gas; four nuclear categories)
k = 1, .. ., 4 (the United States, Western Europe, Japan, ROW) I = 1, . . ., 5 (electricity, industrial heat, residential heat, substitutable
transport, nonsubstitutable transport) m = 1, 2,... (1970, 1980, 1990, ..
The constraints are:
Supply: E x(i,j,k,l,m)/eff(j,l) < R(i,j) k , l ,m
Demand: E x(i,j,k,l,m) > D(k,l,m), j
where R(i,j) is resource availability of resource j in country i, and D(k,l,m) is demand for product I in country k and period m.
THE REST OF THE ECONOMY
Although I am investigating only the energy sector, some thought must be given to the rest of the economy. This nonenergy sector is assumed to be unconstrained by resources. It produces nonenergy output from capital,

William D. Nordhaus 547
labor, and energy according to a constant-returns-to-scale production func- tion. To simplify matters I assume that the social saving is completely elastic with respect to the interest rate, so that the rate of return on capital is constant at rate r. In addition, whatever secular productivity increase occurs is assumed to be purely labor augmenting and proceeds at the same rate in both the energy and nonenergy sectors; so labor and other current inputs are always in efficiency units and the production function is unchanging. Thus, any increase in labor efficiency will raise output per worker accordingly.
The only other important simplification I make is to ignore the effect of energy prices on capital goods prices-which in turn affect energy prices. This is not serious, for the share of energy costs in the capital goods used in the energy sectors is quite small.13 Only if energy prices rose by a factor of ten would this assumption need revision, but, as noted below, the pro- jected rise in intermediate energy prices is much more modest than this.
In what follows, per capita income is assumed to grow as a result of labor-augmenting technological progress at 2 percent per annum for the United States, and at higher rates for other countries. As a result, the general price level in the United States will be falling 2 percent annually with respect to wage rates and per capita incomes. All calculations are presented in 1970 prices. Strictly speaking, this means that the price of capital goods or efficiency (productivity-adjusted) labor is considered to be a numeraire.
TERMINAL CONDITIONS AND DISCOUNT RATES
Because of the very long-run nature of the problem under consideration, particular attention must be paid to the terminal conditions. In principle, the planning period for essential exhaustible resources must cover the duration of man's habitation on the planet. It would be myopic, to say the least, to devise a rational plan for fifty years, only to find that consump- tion must be drastically reduced because the rest of the future had been ignored.
The concept that is relevant to this problem is the backstop technology, a set of processes that (1) is capable of meeting the demand requirements,
13. In 1963, the total direct and indirect energy-type inputs (energy mining, petro- leum refining, and public utilities) were about 5 percent of the total for engines and turbines and for construction, mining, and oil field machinery.
548 Brookings Papers on Economic Activity, 3:1973
and (2) has a virtually infinite resource base. The backstop technology may well be extremely expensive relative to current technology; neverthe- less, if it exists, it assures that the planning problem at least has a feasible solution.
For example, consider a backstop technology for the automobile. With current output rates, available technology, and resources that are currently economical to recover, the resources for automobile transport will last perhaps seventy years. Resources for automobiles operating on electricity generated by breeder reactors will last approximately 100 million years. In some sense, the current stage of history is a transitory phase between dependence on cheap but scarce resources and dependence on more costly but abundant resources.
Thus the first question is whether the system is feasible over some in- definite period of time-say, a thousand years. If not, the problem of de- termining an efficient solution does not make any sense: in a programming framework, if the problem is infeasible prices are infinite.
Next, if the problem is feasible, the backstop technology is identified. Given the foregoing assumptions, the property of the model is that once transition to the backstop technology is reached, all prices will remain constant. An efficient program extending beyond T, the time at which all energy is produced with the backstop technology, will have exactly the same solution in the transition phase, independent of the planning horizon. Once T' is identified, the period beyond it can be ignored in the compu- tations.
The existence of a backstop technology is relevant for the proper dis- count rate to use in calculations of the efficient program. In most situations this is 10 percent. It is supposed to be an index of the supply price for capital and of the opportunity cost of capital, not of the social rate of time preference.14 There is sometimes confusion on this question, particularly in evaluating allocation of exhaustible resources. Recall from the discus- sion above that a high interest rate means low initial prices and high initial consumption. In a sense this pattern favors the present over the future,
14. The 10 percent figure used as the appropriate interest rate approximates the aver- age pretax return on reproducible tangible capital, and as such is a reasonable estimate of the social productivity of investment. In 1968 the ratio of profit-type income (profits, interest, rents, and one-half of entrepreneurial income) to the replacement cost of private reproducible capital (all tangibles, including land, consumer durables, and institutional structures) was 10.6 percent.

William D. Nordhaus 549
but if the opportunity cost of investment is also high, investment in repro- ducible capital is a relatively more efficient way of increasing future con- sumption than holding sterile resources in the ground. Thus a high interest rate may encourage rapid depletion of petroleum and natural gas; but the resources saved by using these cheap resources can be put in the bank to grow at 10 percent annually, and then can be used to build coal liquefaction and gasification plants and breeder reactors in twenty or thirty years.
When no backstop technology exists, however, a high interest rate is definitely inappropriate. If no feasible solution exists-that is, if no back- stop technology can be identified-the basic allocation has no solution. Strictly speaking, this leads to infinite prices for energy resources. It would then be very misleading to use the kind of analysis presented here since resource exhaustion implies extinction.
To summarize, the interest rate is an index of capital's productivity in an economy with an indefinitely feasible consumption plan. To use a lower rate to reflect the social rate of time preference is inappropriate unless there is evidence that the productivity of capital will be lower in the future.
The technique for calculating the efficient path grows naturally out of this discussion. In a program with four fifty-year periods, the backstop technology was reached in the fourth period. Thus, within the technologi- cal specification, an all electric-hydrogen basis for the linear programming model was reached in the fourth of these intervals, 2120-70. The expensive shale oil and the most expensive category of U.S. oil are saved for the period after 2070. The cheap shale oil and about 90 percent of the coal is saved for the period 2020-70. According to the efficient solution, during the next fifty years, 1970B2020, the economy will utilize a small fraction of the world coal resources, the low-cost U-235 to be used in conventional nuclear reactors, and all but the high-cost petroleum resources.
ENVIRONMENTAL CONSTRAINTS
The major shortcoming of the model outlined so far is the omission of environmental constraints. It has been argued, in fact, that environmental policies have played a major role in the current energy crisis by removing certain fuels (notably high-sulphur coal) from the resource base. Over the longer run, waste heat, carbon dioxide, and nuclear wastes may be con- straints on overall energy consumption.

550 Brookings Papers on Economic Activity, 3:1973
Stringent environmental constraints coupled with the inability to find technological solutions to them might very well mean drastically different results or even infeasibility of the basic problem. The approach followed in this paper is to specify a set of environmental standards that must be met by the various processes. By and large, these standards are at least as strict as existing laws. The following specific assumptions are made: (1) pe- troleum refineries can process crudes containing up to 2.5 percent sulphur, and produce clean gasoline and fuel oil with a sulphur range of 0.2 to 1.0 percent; (2) electricity generated with coal employs expensive equipment- either sulphur dioxide scrubbing or low-Btu gasification-which brings sulphur emissions down to current standards; (3) nuclear power production meets the current Atomic Energy Commission standards; and (4) the cost of all surface mining includes $5,000 per acre for reclamation. It should be emphasized that the estimated costs for meeting these standards are very high. For example, the reclamation for surface mining is probably ten times what is required by current law.
Perhaps either the costs are too low or the standards too lenient. But judging from the history of automobile emission standards, the problem of imposing standards is more a matter of time than of cost. The National Academy of Sciences estimates that the stratified charge engine can meet the 1975-76 standards at an annual average cost of about $70 per vehicle. This means a reduction in emissions of at least 90 percent compared with the 1970 level (and perhaps 95 percent for uncontrolled vehicles) for only 2 to 4 percent of the vehicle's total cost.15 If these figures are at all repre- sentative of what can be done to improve environmental performance with sufficient money and time, then the provisions for environmental protection made here should be adequate. There are good economic reasons to expect that (with current technology) prices of energy resources will rise. On the other hand, there is no reason to rule out much cheaper long-run solutions to the brand new environmental constraints. After all, environmental re- sources have been free goods-and have been treated as such. The radical shift in relative prices, making environmental resources very costly goods, will promote technological change aimed at saving these resources, al- though this may take time.
15. "Report by the Committee on Motor Vehicle Emissions" (National Academy of Sciences, February 1973; processed), pp. 101, 116. For standards and uncontrolled performance, see Hottel and Howard, New Eniergy Technology, p. 297.
William D. Nordhaus 551
Results of the Basic Case
The basic case describes the efficient allocation of energy resources for two hundred years (five ten-year periods followed by two twenty-five-year periods and two fifty-year periods). It is calculated with an interest rate of 10 percent, and assumes that sufficient resources have been reserved to meet energy needs efficiently forever (see pp. 547 ff.).
PROCESSES
The first detail of the optimal solution is the set of least-cost technologi- cal processes. Table 5 shows the time path of U.S. processes over the planning horizon. The discounted cost incurred in using new technologies is low at the left and bottom (as in using nuclear fuel for electricity genera- tion in the distant future), and high at the top right (as in using electric cars right away).
The first resources used are petroleum and natural gas reserves. These are already drilled and are almost costless, leading to the virtual exhaustion of domestic petroleum resources in the first decade. Proved reserves are the cheapest fuel simply because extraction is almost free and transport costs are low.
The set of processes for the next two decades relies exclusively on im- ported petroleum and imported liquefied natural gas, both low-cost re- sources. An efficient program for the period 1980 to 2000 does indeed involve heavy dependence on foreign supply, and the implications of this dependence for the U.S. balance of payments are discussed below.
The fourth and fifth decades are a transitional period. The first market that imported petroleum and gas lose is electricity generation and process heat. Shale oil and liquefied coal take over the bulk of the transport mar- ket at the end of the fifth decade.
The first part of the twenty-first century sees the world energy market progressively dominated by U.S. coal and shale oil. After 2020, virtually all energy processes outside of electricity generation are run on raw or processed coal and shale oil, and the U.S. resources are about half the known reserves in these categories.
The final stage is transition to the breeder technology, which starts about

552 Brookings Papers on Economic Activity, 3:1973
Table 5. Time Path of Optimal U.S. Technological Processes in Solving the Energy Problem, by Demand Categories, 1970-2120 and Beyond
Fuel, by demand category
Heat Transportationa
Substi- Nonsub- Period Electricity Industrial Residential tutable stitutable
Domestic
1970-80 Domestic petroleum Imported oil Domestic and imported oil natural gas and natural gas
1980-90 Imported Imported petroleum liquefied
1990-2000 natural gas Imported liquefied
2000-10 natural gas
Light-water Domestic High-cost domestic and 2010-20 reactor high-cost
natural gas imported petroleum
Domestic Domestic Domestic and imported low-
2020-45 deep coal gasified cost shale oil and domestic deep coal and liquefied coal natural gas
2045-70 Light-water Domestic liquefied reactor deep coal
Domestic liquefied
2070-2120 deep coal and high-cost shale oil
Breeder reactor 2120 to
indefinite future
Source: Developed by author. The underlying data are given in an appendix available upon request from author.
a. See Table 1, note b, for definitions.

William D. Nordhaus 553
2020. The use of shale oil and liquefied coal for transportation persists through 2120. But by 2120 all the fossil fuels have been exhausted and the economy is run completely on an electric-hydrogen technology with a resource base that is virtually infinite.
The pattern of interfuel substitution and the way in which processes un- fold over time are sensitive to changes in parameters. The linearity of the objective function leads to extreme solutions. For these reasons the de- scription in Table 5 should be regarded as suggestive rather than exact. It is somewhat surprising, for example, that nuclear generation of electricity is delayed until 2000. Partly this tardiness results because petroleum prices are much lower in the optimal solution than in the real world; partly be- cause the actual level of prices reflects the substantial federal subsidy of the nuclear power industry; partly because of the rapid and unexpected run-up in prices of nuclear generating equipment reflected in the techno- logical assumptions.16
But, while its details should not be taken literally, Table 5 spells out the inevitable transition from exhaustible fossil fuels to nuclear fuels; and this basic pattern is all but invariant to such things as modifications in cost.
PRICES
Perhaps the most important policy problem that is addressed by the re- sults concerns the prices of scarce resources. The programming problem described on pages 545-46 above yields a set of shadow prices associated with the solution. The shadow prices, shown in Table 6, can be inter- preted as the appropriate rent or royalty that a competitive market, operat- ing with the same information applied here, would impute to scarce low- cost resources.
The striking thing about the basic results is that the royalties on almost all energy resources are very low. The highest in 1970 is 42 cents per barrel on U.S. drilled petroleum, corresponding roughly to costs for proved re- serves. This figure is misleading since much of it represents simply quasi- rents on drilling equipment and past exploratory costs.
For Mideast oil, which must be transported to markets, the royalty is 18 cents per barrel, amounting to about one-half cent per gallon of gasoline
16. See Federal Power Commission, The 1970 National Power Survey (1971), Pt. 1, pp. 1-6-13 to 1-6-15, for a discussion of the recent rise in prices of nuclear generating equipment.

554 Brookings Papers on Economic Activity, 3:1973
Table 6. Royalties (Shadow Prices) on Energy Resources, 1970, 1980, and 2000a 1970 dollars
Resource 1970 1980 2000
Petroleum (per barrel) Drilled
United States 0.42 1.50b 17.93b Persian Gulf and North Africa 0.18 0.46 1 .94b
Undrilled United States 0.00 0.00 0.63 Persian Gulf and North Africa 0.17 0.44 1.77
Coal, United States (per ton) Eastern deep mined 0.07 0.18 1.23 Western strip mined 0.01 0.03 0.21
Shale oil, United States (per barrel) 25 gallons per ton 0.02 0.06 0.37 10 gallons per ton 0.00 0.01 0.07
Natural gas (per thousand cubic feet) United States 0.16 0.32 0.59 Persian Gulf and North Africa 0.00 0.00 0.25
Nuclear fuel Inexpensive uranium (per million Btu) 0.01 0.02 0.17
Source: Derived from the program described in the text. a. The royalties are the values of the dual variables on resources in the optimal solution. They exclude
any future direct cost but include quasi-rents on past direct costs for drilled petroleum. b. The resource is exhausted by this date and the royalties are therefore nominal.
(about 1 percent of the current retail price in the United States). For coal, the shadow price is even smaller-approximately 7 cents a ton for Eastern U.S. deep coal. In fact, the only relatively high shadow price is that on natural gas in the United States and Western Europe, which reflects the fact that it is a very cheap fuel-it needs no further refining and no ex- pensive equipment to make it environmentally acceptable. As a result, it has a scarcity rent of 16 cents per thousand cubic feet for 1970 in the United States.
The fuel prices that emerge from the efficient solution are also of in- terest. They are the sum of shadow prices and the costs of extraction. Tables 7 and 8 show the time path for prices for the United States to 2010 and comparisons with actual prices since 1950. The miraculous outcome of this procedure is that the calculated prices seem to be much the same as the market prices (except for petroleum products and coal). This finding

William D. Nordlhaus 555
is particularly surprising given the many disparate sources for the techno- logical data and the enormous aggregation needed to obtain resource categories.
Divergent trends in calculated prices appear among the different fuels. The path for calculated electricity prices shows a very gentle increase (1.1 percent annually over the next forty years) as full adaptation to a nuclear technology takes place. The calculated price of coal is almost constant, rising only 0.7 percent annually for forty years. The time path for petro- leum prices is much steeper with calculated prices of crude oil and gasoline rising at around 4.6 and 3.5 percent annually. Natural gas also increases rapidly-3.9 percent annually-rising from a 1970 level of 21 cents per million Btu to a 2010 level of 97 cents. The major reason behind the projected rise of petroleum and natural gas prices is that, with the ex- haustion of petroleum resources, the economy must turn to considerably
Table 7. Intermediate Prices for Energy Other Than Petroleum Produced in the United States, Actual 1950-70, and Projections to 2010
Electricity Natural gas Bituminous coal (before trans- (cents per thou- and lignite (fo.b. mission; cents sand cubic feet; at mine; average per kilowatt- average at dollar value
Period hour) welihead) per ton)
Prices (1970 dollars) Actual 1950 1.16 11.0 8.16 1960 0.98 18.3 6.14 1970 0.77a 17.1 6.26
Calculated 1970 0.68 21.0 11.91 1980 0.76 37.6 12.07 1990 0.85 45.7 12.42 2000 1.03 64.1 13.34 2010 1.06 97.1 15.77
Annual percentage chanige 2010 from 1970 calculated 1.1 3.9 0.7 2010 from 1970 actual 0.8 4.4 2.3
Sources: Calculated values are derived from the program described in the text. The electricity price for 1970 is from U.S. Federal Power Commission, The 1970 National Power Survey (1971), Pt. 1, pp. I-1-3; earlier years assume a constant ratio of production to transmission and distribution costs and use the figures for the total from U.S. Federal Power Commission, Typical Electric Bills: Typical Net Monthly Bills as of January 1, 1970, for Residential, Commercial, and Industrial Services (1970). Natural gas prices and coal are from U.S. Bureau of Mines, Minerals Yearbook, 1951 (1954), and issues for 1961 (1962) and 1971 (1973). Prices include direct costs and royalties.
a. 1968.

556 Brookings Papers on Economic Activity, 3:1973
Table 8. U.S. and European Prices of Petroleum Products, Actual 1950-73, and Projections to 2010
Crude oila Gasolineb (per barrel) (per gallon)
Uniited Western United Western Period States Europe States Europe
Prices (1970 dollars) Actual 1950 4.34 n.a. 0.169 n.a. 1960 3.89 2.76 0.152 0.092 1970 3.23 2.38 0.126 0.059 Winter 1973-74 4.50-9.99c 12.27-22.80 0.166 0.43-0.67
Calculated 1970 1.20 0.052 1980 1.70 0.065 1990 2.13 0.077 2000 3.19 0.105 2010 7.12 0.209
Annual percentage chanige 2010 from 1970 calculated 4.6 4.6 3.5 3.5 2010 from 1.2 to -1.3 to -1.8to
winter 1973-74 actual -0.9 -3.0 0.6 -3.0
Sources: Calculated values are derived from the program described in the text. United States: Crude oil prices for 1950-70 are price of crude petroleum at wells (Oklahoma) reported in U.S. Bureau of Economic Analysis, 1971 Business Statistics, Supplement to Survey of Current Businiess, p. 166. Winter 1973-74 crude oil figures are from the New York Times, December 25, 1973. Gasoline prices for 1950 and 1960 are from American Petroleum Institute, Petroleum Facts and Figures, 1971 edition, p. 458. Figures for 1970 and 1973-74 are derived from an adjustment of the most recent API gasoline price. Western Europe: 1960 and 1970 are derived from M. A. Adelman, The World Petroleum Market (Johns Hopkins University Press for Resources for the Future, 1972), pp. 365-66, 377. For crude oil, Adelman's realization less his calculated refinery margin is used. The figure for crude oil for 1973-74, from the New York Times, January. 29, 1974.
a. For the United States, average annual price of mid-continent crude oil, except 1973-74, which is explained in note c. For Western Europe, the prices are monthly averages.
b. For the United States, average price for regular-grade gasoline at the refinery in Boston; for Western Europe, average of monthly Rotterdam prices of regular-grade gasoline.
c. $4.50 is the mid- to late December price for "old" oil produced in the United States. A comparable figure for domestically produced "new" oil is about $7.49. $9.99 is the posted price for Persian Gulf light crude oil effective January 1, 1974. As quoted in the New York Times, December 25, 1973, these prices in current dollars are, respectively, $5.25, $8.73, and $11.65.
n.a. Not available.
costlier processes-either shale oil or coal gasification and liquefaction. Thus in the efficient solution, refined oil can be delivered in the United States at $2.18 in 1970 while shale oil costs $5.58 a barrel and liquefied coal $7.62 (all exclusive of royalties). Before the technological transfer from natural oil to synthetic oil is made, the price of petroleum products must rise very significantly.

William D. Nordhaus 557
The solution for natural gas indicates that the actual 1970 price is below its efficient level. In fact, natural gas appears to be the only fuel that is underpriced relative to future availability. But natural gas prices have been controlled for two decades, and sporadic indications of shortages appeared in the early seventies. In the solution for the basic case, natural gas is underpriced by about 20 percent; in other solutions by much more. For example, in a solution of the model without free trade, calculated 1970 gas prices are 45 cents per thousand cubic feet-almost three times 1970 levels. Thus it appears that for natural gas, efficiency prices are substantially above their actual levels.
PETROLEUM PRICES
The major discrepancy between calculated and actual prices comes in crude petroleum and petroleum products. Because the winter 1973-74 prices in Table 8 are seriously distorted by the Mideast war and the cur- rent run-up of commodity prices, it is probably best to examine the price structure for 1970. For the United States, petroleum prices were far above the calculated long-run competitive supply price. The price of crude oil was $3.23 a barrel, as against a calculated efficiency price of $1.20-a markup of 169 percent over cost. For gasoline the price differential was of a similar magnitude-12.6 cents per gallon for the actual price against 5.2 cents for the calculated.
A good hint as to the source of the difference comes from the price for Western European petroleum products. Here the unregulated price-that is, without the import quotas, prorationing, and other impediments to mar- ket determination found in the United States-was quite a bit closer to the calculated long-run supply price. The price of crude in Western Europe was $2.38 a barrel for 1970, about twice the calculated price.
What explains the discrepancy between the actual and calculated prices of petroleum in the United States-$3.23 against $1.20 for 1970? The first source of the discrepancy is the considerable interference with the free flow of petroleum into the United States. Until 1973 quotas were imposed on imports, so domestic prices were effectively determined by the domestic supply price. The next section reports a calculation that estimates the com- petitive supply price for domestic petroleum in a world without inter- national trade in energy products at $2.33 per barrel, about 90 cents below the actual price. The 90 cents is probably due to prorationing to suppliers.

558 Brookings Papers on Economic Activity, 3:1973
Estimates of the benefit of efficient production are about $0.85 to $1.00 per barrel. In sum, it appears that the domestic price can be explained by import restrictions and prorationing.
While the discrepancy of the 1970 price is relatively easy to explain for the protected United States market, the discrepancy for the free market (Western European) price is more puzzling. As Table 8 shows, the 1970 Western European price was $2.38 a barrel versus $1.20 in the calculated path. Most of the differential of $1.18 can be reduced to payments to exporting countries. According to Adelman, the average payment per bar- rel in 1970 to the seven major exporting countries ranged from $0.81 to $1.09 per barrel, averaging $0.93.17 In the efficient solution, royalties are $0.17 per barrel (see Table 6). Thus approximately $0.76 of the excessive $1.18 per barrel can be attributed to excessive royalties to producer coun- tries. The remainder accrues in the form of additional profits-either excess transportation charges or rates of return to companies greater than 10 percent.
In the period since 1970, the royalty component has risen dramatically. At January 1974 posted prices, the royalties for most Mideast countries are about $7.00 per barrel-seven times the 1970 levels. These are almost twenty-five times the efficiency royalties shown in Table 6. As the dis- cussion of the efficient path for royalties suggested, the difficulty with market allocation of resources indeed lies in proper determination of the royalty element! What lies behind the excessive royalties?
Three prominent sources of the very high royalties on petroleum are technology, monopoly, and instability. The first possibility is that partici- pants in the energy market may be more pessimistic about the develop- ment of future technologies than I am. To test this possibility, I ran a few cases that rule out some of the technologies shown in Table 3. Within the basic model of free trade, anything but the most drastic pessimism did not seem to matter much. Thus I first assumed that all speculative technologies in Table 3 (D technologies) were one hundred times more expensive than assumed; then that all C and D technologies (thus including those now in development) were one hundred times more expensive. In both cases prices rose, but the price of refined petroleum rose by less than 10 percent even in the more pessimistic case.
Suppose that even the technologies currently in pilot plant or small-scale
17. Adelman, World Petroleum Market, p. 208.
William D. Nordhaus 559
operation (those designated B) will also be a hundred times more expensive than the current estimates. As a measure of the depth of this pessimism, this assumption implies that shale oil will cost at least $700 a barrel; that running a breeder reactor will cost almost a dollar a kilowatt-hour; and that coal cannot be economically used for electricity generation because the sulphur emission standards cannot be easily met. Even in this drastic case, prices on petroleum products do not reach current levels. Gasoline rises to 231 percent of the basic level-to 12 cents a gallon-and the price of crude petroleum rises about $2.50 over the basic solution. Natural gas, on the other hand, does have a much higher price-up to almost 80 cents per thousand cubic feet as against 21 cents in the basic solution. If tech- nological pessimism lies behind the inflated level of petroleum prices, it must be a very deep pessimism indeed: it implies not only that engineers will be unable to solve the very difficult problems (like economical fusion, solar, or hydrogen power) but also that technologies that have actually operated in the past (like liquefaction of coal by the Germans in the Second World War) will be impracticable. This pessimism seems to plumb un- reasonable depths, and so it is an unlikely explanation for the inflated level of petroleum prices.
A second possible reason is the presence of monopolistic restrictions. From the quantitative evidence presented here, most of the divergence of market price from the long-run competitive supply price appears attribut- able to government restrictions (oil import quotas and prorationing) and to excessive payments to producing countries. While oil companies ob- viously are not disinterested parties, little of the excessive price of crude petroleum seems to go directly to them. In 1970, only $0.25 of the excessive $2.03 is left unexplained by the government restrictions and country pay- ments.
The other source of monopoly restriction is the control of price by oil- exporting countries. For the last few years, royalties to producing coun- tries have been determined in bilateral negotiations between them and major oil companies in an arrangement that has led many observers- notably Adelman-to conclude that the inflated price was the outcome of monopolistic pricing by sellers.
Until recently, it was difficult to point to specific practices that were pe- culiarly monopolistic. While the pricing was "administered," until 1973 few significant quantitative restrictions were imposed and most countries were expanding production extremely rapidly. Moreover, many of the in-

560 Brookings Papers on Economic Activity, 3:1973
creases in posted price-especially those in 1973-merely brought the ac- counting price of crude oil up to the market price and transferred the wind- fall gains from company coffers to national coffers.
Thus monopolistic intent until 1973 (and behavior since October 1973) on the part of oil-exporting countries seems plausible. It is extremely difficult, on the other hand, to determine ex post whether observed prices result from monopolistic behavior or one of the other causes discussed here. Needless to say, the 1973 embargo is prima facie evidence of monop- olistic restrictions on the part of some Arab producers; but this is quite different from earlier behavior.
A third possibility is that the discrepancy of the petroleum price arises because spot markets do not assess the royalty properly. I have argued above that resource markets might well exhibit incorrect-perhaps even unstable-pricing of scarce appropriable resources, because resource own- ers hold back on sales of petroleum resources in anticipation of a con- tinuation of the very rapid rise in petroleum prices. If the basic calculation put forth here is correct, some of these owners will be unpleasantly sur- prised when they cannot realize the anticipated rate of return.
The wellhead price of Mideast crude for January 1974 is about $7.00 per barrel. If the market is misassessing royalties, some producers must think it worthwhile to curtail production and wait for higher prices. Given the extraction costs and a 10 percent discount rate, it would pay them to hold petroleum in the ground until 1980 if they thought that prices would rise at least to $13.50 a barrel; until 1990, if they thought the price would rise to $35 a barrel. If the estimates for the costs of synthetic fuels shown in Table 4 are close to accurate, it appears unlikely that any country will realize the implicit 1990 price for its petroleum exports.
Although the presence of an incorrectly assessed royalty is hard to prove, this possibility seems entirely consistent with the calculated and actual pattern of resource prices. If royalties were incorrectly assessed, how was the price of petroleum talked up so high? And how can it be talked back down to where it belongs?
The 1970 price of coal also seems a bit out of line, but this situation con- ceals important changes since 1970. The dramatic rise in the wholesale price of coal-from $7.64 per short ton in 1970 to $12.13 in October 197318-is
18. The prices are for bituminous screenings for industrial use from Survey of Current Business, Vol. 53 (February and November 1973), p. S-35. The discrepancy be- tween the 1970 figures here and in Table 7 is due to the fact that the series on average value used in Table 7 is not as up to date as the Survey figures for industrial screenings.
William D. Nordhaus 561
probably associated with sulphur restrictions and mine safety legislation. The data in Table 7 are based on estimates of capital and current costs un- der current standards, so the predicted price is not far off.
FINAL USE PRICES
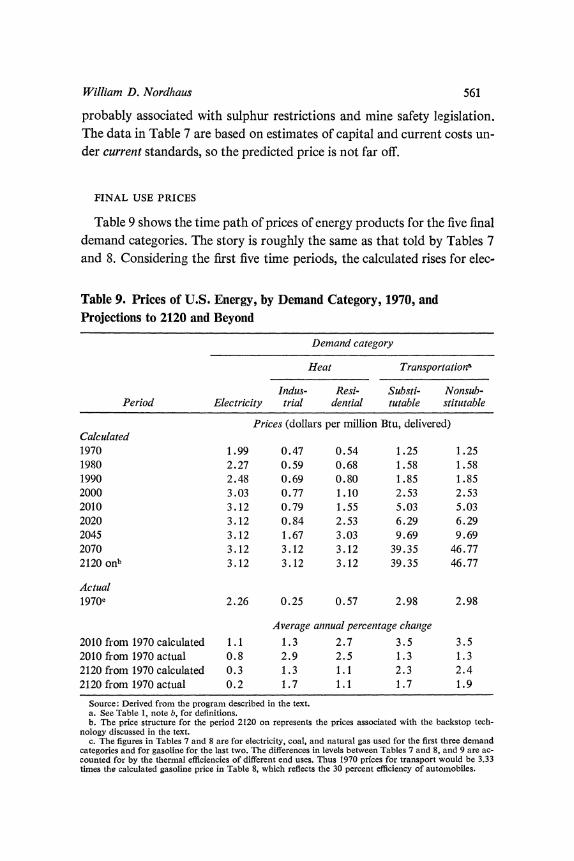
Table 9 shows the time path of prices of energy products for the five final demand categories. The story is roughly the same as that told by Tables 7 and 8. Considering the first five time periods, the calculated rises for elec-
Table 9. Prices of U.S. Energy, by Demand Category, 1970, and Projections to 2120 and Beyond
Demand category
Heat Transportation"
Indus- Resi- Substi- Nonsub- Period Electricity trial dential tutable stitutable
Prices (dollars per million Btu, delivered) Calculated 1970 1.99 0.47 0.54 1.25 1.25 1980 2.27 0.59 0.68 1.58 1.58 1990 2.48 0.69 0.80 1.85 1.85 2000 3.03 0.77 1.10 2.53 2.53 2010 3.12 0.79 1.55 5.03 5.03 2020 3.12 0.84 2.53 6.29 6.29 2045 3.12 1.67 3.03 9.69 9.69 2070 3.12 3.12 3.12 39.35 46.77 2120 onb 3.12 3.12 3.12 39.35 46.77
Actual 1970c 2.26 0.25 0.57 2.98 2.98
Average annual percentage chanige 2010 from 1970 calculated 1.1 1.3 2.7 3.5 3.5 2010 from 1970 actual 0.8 2.9 2.5 1.3 1.3 2120 from 1970 calculated 0.3 1.3 1.1 2.3 2.4 2120 from 1970 actual 0.2 1.7 1.1 1.7 1.9
Source: Derived from the program described in the text. a. See Table 1, note b, for definitions. b. The price structure for the period 2120 on represents the prices associated with the backstop tech-
nology discussed in the text. c. The figures in Tables 7 and 8 are for electricity, coal, and natural gas used for the first three demand
categories and for gasoline for the last two. The differences in levels between Tables 7 and 8, and 9 are ac- counted for by the thermal efficiencies of different end uses. Thus 1970 prices for transport would be 3.33 timnes the calculated gasoline price in Table 8, which reflects the 30 percent efficiency of automobiles.

562 Brookings Papers on Economic Activity, 3:1973
tricity and industrial heating are rather gentle, slightly more than 1 percent annually. For residential heating and the transportation categories, the calculated rises are rather larger-2.7 percent and 3.5 percent annually. The average rise of energy prices for the five categories using 1970-80 weights is 2.4 percent annually for calculated prices and 1.3 percent annually using the actual 1970 prices as a base.
ALTERNATIVE INTEREST RATES
On the basis of the technological data and a 10 percent interest rate, cur- rent energy prices seem about right for electricity, coal, and natural gas. But the current prices of petroleum products-especially gasoline-seem far higher than is consistent with the long-run scarcity of energy resources.
Surprisingly, the shadow prices in the optimal solution were extremely insensitive to different specifications. Moderate changes in the assumptions about resource availabilities, growth rates for demand and for population, and capital or current costs always left the shadow prices surprisingly low.
One natural question concerns the importance of the interest rate in the outcome, for the 10 percent interest rate is perhaps debatable. Some might argue that the social rate of time preference should be used and might be lower than 10 percent (perhaps even zero). Others, accepting the return on investment as the appropriate criterion, might point out that the pretax return on corporate capital is closer to 20 percent.
It therefore seemed worthwhile to test the sensitivity of the optimal solu- tion to rates of zero, 1, 5, 10, 20, and 30 percent. Royalties showed little sensitivity with higher interest rates because they were so small to begin with. At lower interest rates, however, they shifted significantly. The cur- rent royalty on undrilled U.S. petroleum rose from zero for 10 percent, to about 80 cents a barrel for 5 percent, then shot up to $12 a barrel for 1 per- cent, finally reaching $20 a barrel for zero percent.
The prices of final products formed a different pattern. As the discussion above (pp. 532-33) noted, the interest rate has an ambiguous effect on final demand prices, with a higher rate first lowering and then raising them over the period in which a resource is used. As it turns out, current prices of final energy products (except electricity) are minimized at a 10 percent interest rate; they rise roughly in proportion with the interest rate above that level. Below it, prices rise slightly as the royalty becomes larger, but only for transportation are the effects very large.
William D. Nordhaus 563
THE ROLE OF FOREIGN TRADE
This paper has described a pattern of resource utilization marked by close interdependence and vast trade flows among the regions of the world. In the optimal case depicted in Table 5, the United States relies heavily on foreign energy sources for much of the period from 1970 to 2020. In this allocation U.S. imports of petroleum are projected to rise from an average of 3.1 billion barrels per year in 1970-80 to 7.1 billion barrels in 1980-90, to fall sharply to 4.2 billion barrels in 1990-2000, to peak at 8.7 billion barrels in 2000-10, then to disappear after 2010. These figures compare with 1.2 billion barrels of crude and refined products imported in 1970, 1.7 billion barrels in 1972, and an import rate in mid-1973 of about 2.4 billion barrels. Western Europe and Japan show a similar dependency.
But all is flux, and the winter of dependency passes as quickly as it ar- rived. By 2020, the quantity of imported fuels in the calculated solutions drops to almost nothing, and American coal and shale oil come to domi- nate trade in fuels. U.S. coal exports are projected to start in the fourth decade (2000-10), then increase very rapidly to $44 billion annually in the next decade. American coal and shale oil exports dominate the final two periods before their exhaustion (2020-2070).
It is possible to calculate the balance of payments on energy account from the optimal program. To do this, I simply record the flows into and out of each region in the optimal solution. The results I present in Table 10 calculate the cost of the fuel at the port of export, thus excluding transport costs and any further processing (such as refining or electricity generation) that occurs at the point of consumption.
The results foreshadow a period of very large deficits on energy account, peaking in the 1990-2000 decade at almost $20 billion (or almost 1 percent of projected GNP, both in 1970 prices). The fourth decade embodies the transition to a coal technology, with the value of imports almost constant, the fifth a very large expansion of exports. In the final periods, covering the fifty years 2020 to 2070, the world's oceans will swarm with U.S. coal and shale oil in transit, with the value of exports exceeding $300 billion annually to 2045, and over $800 billion thereafter. Lest it appear that the United States would be turning into a new version of a banana republic, note that at their peak, energy exports total about 7 percent of projected GNP.
Again, the numbers are not to be taken too literally; yet they tell an im- portant story. The United States may well become dependent for a time on

564 Brookings Papers on Economic Activity, 3:1973
Table 10. Annual U.S. Trade Flows in Energy in the Optimal Solution, 1970-2070a Billions of 1970 dollars at annual rates
Energy payments surplus (+) or deficit (-)
Percent of Period Exports Imports Amount potential GNP
1970-80 0 1.6 -1.6 -0.14 1980-90 0 8.8 -8.8 -0.57 1990-2000 0 19.2 -19.2 -0.94 2000-10 3.7 19.4 -15.6 -0.58 2010-20 44.2 49.9 -5.7 -0.16 2020-45 320.3 24.2 296.1 5.9 2045-70 836.0 0 836.0 7.3
Source: Derived from the program described in the text. a. All values are calculated at port of export. Per capita potential GNP is projected to grow at 2 percent
annually.
foreign petroleum and gas; but this period will not last forever. Sooner (be- cause oil-exporting countries raise their prices above the competitively de- termined price) or later (as the oil is exhausted), the world must turn to the next fuel up the cost curve. By most reckonings this is likely to be coal or nuclear processes for stationary uses and liquefied coal or shale oil for mo- bile uses. The United States has these resources in abundance.
These optimistic remarks do not deny that until coal and shale oil become competitive, the United States dollar could have a rough time on foreign exchange markets; for that matter, Japan and Western Europe will have an even stormier time if balance on energy account is all that matters. But there are fairly clear limits to the U.S. dependence on foreign sources; and there is a clear point at which the rise in petroleum prices will force exten- sive substitution of domestic fuels, as the following section shows.
SELF-SUFFICIENCY?
A good question is whether the benefits of trade are worth the problems. The past months have demonstrated vividly that oil mixed with politics is a volatile brew. One way of calculating the gains from trade is to estimate the cost of self-sufficiency, or autarky-that is, of meeting all U.S. energy needs from domestic resources and all foreign energy needs from foreign sources.
This calculation calls for solving the basic problem without allowing any
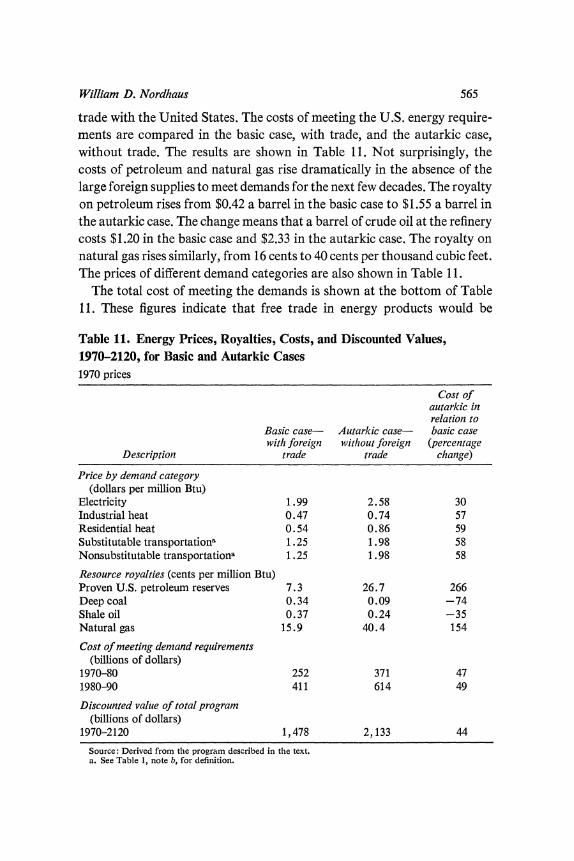
William D. Nordhaus 565
trade with the United States. The costs of meeting the U.S. energy require- ments are compared in the basic case, with trade, and the autarkic case, without trade. The results are shown in Table 11. Not surprisingly, the costs of petroleum and natural gas rise dramatically in the absence of the large foreign supplies to meet demands for the next few decades. The royalty on petroleum rises from $0.42 a barrel in the basic case to $1.55 a barrel in the autarkic case. The change means that a barrel of crude oil at the refinery costs $1.20 in the basic case and $2.33 in the autarkic case. The royalty on natural gas rises similarly, from 16 cents to 40 cents per thousand cubic feet. The prices of different demand categories are also shown in Table 11.
The total cost of meeting the demands is shown at the bottom of Table 11. These figures indicate that free trade in energy products would be
Table 11. Energy Prices, Royalties, Costs, and Discounted Values, 1970-2120, for Basic and Autarkic Cases 1970 prices
Cost of autarkic in relation to
Basic case- Autarkic case- basic case with foreign without foreign (percentage
Description trade trade change)
Price by demand category (dollars per million Btu)
Electricity 1.99 2.58 30 Industrial heat 0.47 0.74 57 Residential heat 0.54 0.86 59 Substitutable transportationa 1.25 1.98 58 Nonsubstitutable transportationa 1.25 1.98 58
Resource royalties (cents per million Btu) Proven U.S. petroleum reserves 7.3 26.7 266 Deep coal 0.34 0.09 -74 Shale oil 0.37 0.24 -35 Natural gas 15.9 40.4 154
Cost of meeting demand requirements (billions of dollars)
1970-80 252 371 47 1980-90 411 614 49
Discounted value of total program (billions of dollars)
1970-2120 1,478 2,133 44
Source: Derived from the program described in the text. a. See Table 1, note b, for definition.

566 Brookings Papers on Economic Activity, 3:1973
moderately beneficial to the United States. Over the next twenty years, the total cost of meeting energy demand is $663 billion under free trade and $985 billion under self-sufficiency. Thus free trade costs one-third less than a regime of self-sufficiency. Free trade in energy products is worth $16 billion a year on the average. It should be stressed that this calculation of the cost of autarky assumes that foreign sources are competitively priced. The calculation obviously would be different in a real world of short-run disturbances or monopolistic pricing.
The autarkic case presents one significant modification of the basic case. If free trade does not prevail over the next few decades, the outlook for energy prices is clouded except for electricity. If foreign supplies dry up for any reason, the long-run supply price of crude petroleum at the refinery is projected to be twice as high ($2.33 a barrel against $1.20 a barrel), and the refinery price of gasoline 63 percent higher (8.5 cents per gallon against 5.2 cents per gallon), all for 1970 in 1970 prices. Still, the autarky prices are well below the current prices found for petroleum products (see Table 8). Thus, while prices might be higher under a regime of self-sufficiency, the current structure cannot be rationalized by the belief that trade will collapse for an indefinite period.
Implications for Energy Policy
To summarize the findings, this analysis has investigated the efficient al- location of energy resources over time by determining the cheapest way of meeting a growth path of final demands for energy products with a given stock of energy resources and a given set of processes for converting re- sources into products. After ensuring that the program was feasible for a very long time period, the procedure was to find the optimal path for con- suming scarce resources and the prices associated with this path.
The basic case allows free trade in energy resources and assumes an in- terest rate of 10 percent. In this case, the scarcity rents or royalties on energy resources are quite modest, never more than 16 cents per million Btu (equivalent to about one dollar per barrel of petroleum). With 1970 as a basis of comparison, the final-demand prices associated with the optimal solution are not far from actual market prices, with one exception. The exception is petroleum prices, which were about 240 percent of the price calculated in the optimal program.
William D. Nordhaus 567
Subject to reservations discussed below, these results are quite suggestive for energy policy. As a long-run policy it would be unwise to jack up the prices of energy products in the interests of artificially preserving energy resources. Nor does a more drastic policy of permanent rationing of energy resources make sense. As long as investment yields around 10 percent, it seems best to use the cheap resources now and to put the real resources thereby saved to work on producing synthetic fuels later. Of course, any worthwhile effort aimed at reducing wasted energy should be applauded; but judging by their long-run scarcity prices, a dollar's worth of energy re- sources saved is no more deserving than a dollar's worth of idle labor or wasted capital saved.
For petroleum prices the lesson is, if anything, the opposite of the con- ventional story. Subject to the usual qualifications, the optimal solution in- dicates that the current price of crude oil is inflated considerably above its long-run competitive supply price. Before the 1973 Mideast war, crude oil was selling at about $4 per barrel and refined petroleum products were selling at about $6 a barrel; in current prices, the optimal solution indicates that the 1973 U.S. east coast price should be around $1.70 per barrel. I have not determined the precise source of this discrepancy, but it probably arises partly from excessive royalties to producing countries, partly from restrictions on imports into the United States, and partly from inefficient regulation. If this description is correct, then a policy that aims at further increases in the long-run price of gasoline would be pushing in the wrong direction.
Some dark spots mar this generally cheery landscape. The proviso about free trade is of considerable importance. The optimal program depicts a world economy with vast trade flows from energy-rich to energy-poor countries. In particular, in the last couple of decades of this century, the United States has a projected deficit on energy account of around $20 bil- lion annually. This large a deficit must strain even an economy with roughly double the real GNP of the United States in 1970.
But if the calculations presented here are correct, free trade offers con- siderable gains. The optimal program costs the United States $16 billion less annually over the next twenty years than does a program without trade. In light of current shortages (especially in Western Europe and Japan), are the gains from trade for a highly exposed economy worth the risks? While self-sufficiency seems a laudable goal, many other policies are much cheaper. For example, if the gains from trade are $16 billion annually, half

568 Brookings Papers on Economic Activity, 3:1973
this amount will certainly finance an oil storage program that covers four years' imports at $6 a barrel. There are many ways to cover contingencies besides self-sufficiency. Dependence on foreign energy sources may impose costs in the sacrifice of minor political objectives or strain on foreign ex- change, but it is hard to see how, short of outright war, these costs could outweigh the benefits of trade.
A second proviso is that the optimal solution depends to a certain extent on unproven technologies. The system simply cannot run very long without development of a breeder reactor, fusion technology, or some other process that rests on a virtually inexhaustible resource base. But time is not partic- ularly pressing, and the economy can wait at least 100 years for this ultimate technology. The need for other sorts of technology is more pressing. In par- ticular, some form of synthetic liquid fuel must be developed quite rapidly to replace petroleum when the latter is exhausted. Such processes are in de- velopment-shale oil and coal liquefaction being the most significant-but they have not yet proved their economic and environmental acceptability. On a pessimistic view about the viability of these technologies, the prices of petroleum products would be much higher than in the basic case.
The optimistic picture painted here contrasts vividly with the pervasive concerns about the "energy crisis." The results presented above, however, are relevant to the long-run availability of energy resources; they are not particularly helpful for managing short-run shortages such as the nation is currently experiencing. Recall that the model assumes very smooth func- tioning of markets, with perfect foresight about underlying forces such as demands, resources, prices, technologies, and government policies. In par- ticular, in the optimal solution the capacity expansion is tailored precisely to the demand path, so that none of the important variables presents any surprises.
It seems likely, however, that the current energy crisis is the result of just such unforeseen shifts in underlying forces. The most obvious was the 1973 embargo on petroleum exports. World production in November 1973 was about 5 million barrels a day, or 10 percent, below the pre-embargo levels. A shortfall of this magnitude in such a crucial product obviously can induce serious short-run disruptions.
But these events have merely compounded problems brought about by earlier policies. For one thing, industrialized countries are locked into heavy dependence on imported petroleum by past decisions about capital equipment and insufficient attention to alternative sources. For another,

William D. Nordhaus 569
the U.S. oil import quotas posed a quandary for oil companies in planning to meet future demands. As long as they were in effect, and as long as U.S. crude petroleum production was stagnant, refinery building in the United States made no sense. As a result, when the quotas were lifted in early 1973, refining capacity was insufficient to meet domestic demands. Moreover, the world boom of 1973 has spurred a very rapid expansion in petroleum demands that worldwide capacity could not meet at prevailing prices.
Petroleum did not stand alone as a scarce, expensive, raw material during 1973. In fact, before the cutbacks due to the embargo, most other com- modity prices had risen even more. The wholesale cash prices of gasoline and fuel oil in the United States were up 10 and 20 percent, respectively, over a year earlier. while the Dow-Jones commodity index rose 94 per- cent.19 It seems clear that the "energy crisis' is in part simply a reflection of the current "commodity crisis."
Another major disturbance was the 1967 and 1970 amendments to the Clean Air Act. Emission standards for automobiles and air quality stan- dards suddenly changed the rules of the game. The standards for automo- biles have resulted in a fuel penalty of 7 to 10 percent, increasing gasoline demand in an unforeseen way. The sulphur restrictions have been even more disruptive in that they simply removed high-sulphur coal and high-sulphur petroleum products from the eligible technology.
Direct interference with price has also been mentioned as a distorting influence. Wholesale producers' prices for natural gas have been regulated since 1954; and more recently, since August 1971, prices for refined petro- leum products have been subject to a changing array of price controls. The price increases imposed by oil-exporting countries have been cited as an example of exercise of market power.
Nevertheless, while these disturbances may seriously impair the function- ing of the industrialized economies over the next few years, a long-run policy based on the premise that energy resources are the nation's most precious resource would be a mistake. Many have proposed policies that treat energy as the only scarce resource-a kind of "Btu theory of value." If the results presented above are valid, they suggest that the current crisis should be viewed as the temporary effect of critical bottlenecks. They fur- ther suggest that stress should be laid on expansion of capacity in those
19. These comparisons are for September 28, 1972 and 1973; Wall Street Journal, October 1, 1973.

570 Brookings Papers on Economic Activity, 3:1973
areas where resources are abundant-intensified drilling for oil and gas and heavier use of coal; and that greater attention should be paid to perfecting processes for producing clean synthetic fuels-particularly shale oil and liquefied coal.
If these conclusions are right, then the current "energy crisis" will blow over eventually. Real enough problems remain. Until supplies are ex- panded, the United States may experience very serious shortages or very high prices. In any case rising prices are likely over the long haul, especially for transportation; adaptation to new, potentially difficult, technologies will present a problem; and several lean years on foreign exchange markets loom ahead. But we should not be haunted by the specter of the affluent society grinding to a halt for lack of energy resources.

Comments and Discussion
Hendrik Houthakker: Bill Nordhaus is to be congratulated for blazing a new trail of analysis in this paper. He has taken a sophisticated approach to some of the policy issues surrounding the use of energy resources. Al- though his paper does not deal with current problems, it has important implications for energy policy for the longer run.
I would like to take issue with Nordhaus' contention that free markets cannot ensure an efficient pattern of resource allocation. This position is based on Debreu's view that a fully competitive economy must include conditional futures markets that cover all possible outcomes. But condi- tional futures markets do not exist for any commodity; the futures markets that are available operate on very different principles. Conditional futures markets involve a sharing of the general risks associated with future output. It is far-fetched to assume that conditional contracts could be devised to cover all contingencies, and partial coverage would result in frequent de- faulting on contracts. Debreu's theory is not a realistic guide to the prob- lems involved in allocating output and consumption through time. Further- more, as Arrow has shown, security and asset markets can serve to cover the gaps in the risk coverage of existing futures markets.
Nordhaus appears to underestimate the importance of trade in existing assets. If price rises are anticipated for certain resources, the value of these assets will appreciate. Purchases of oil in the ground, long-term contracts, and similar transactions help to ensure that prices will not diverge markedly from the short-run efficient price. Admittedly, these asset markets function imperfectly but they serve to reduce large deviations between market prices and efficient prices and thus to eliminate the instability of the spot market emphasized by Nordhaus.
Many of the current energy problems stem from interference with the operation of the free market. The market mechanism has been severely re- stricted by federal regulation of electric power and natural gas. Rather than
571
572 Brookings Papers on Economic Activity, 3:1973
attribute energy problems to the failure of the market mechanism, I would put the blame on federal policies that have impeded the market.
A serious practical problem is Nordhaus' assumption that all demand elasticities are zero. He allows for substitution within fuel demand groups but not between energy products and other objects of consumption. He mentions that most studies of the final demand categories indicate that price elasticities range between zero and unity; but even within this range different values for the price elasticity of demand can have a substantial effect on the overall balance between supply and demand and on the calcu- lation of the trend of supply. Allowing for some demand elasticity would not seem to make the computational problem insuperably difficult.
The origin of the reserve estimates underlying Nordhaus' calculations is important to the analysis. They are based on geologists' estimates of the amount of reserves that will be recoverable at a given price, and are derived from knowledge of the quantity of a resource that has been recovered from similar formations in the past. The assumed price may be the current price or some other price, and is rarely defined. These estimates are rough at best, and they should not be taken literally. However, Nordhaus' conclu- sions seem reasonable and I do not think that he's to be faulted for his use of the data.
I agree with Nordhaus' timetable, according to which nuclear energy technology is not relevant until the turn of the century. The nation has de- veloped nuclear technology prematurely in an effort to promote science, and because regulatory policies on power are biased in favor of capital- intensive processes. I doubt that many nuclear power plants would have been built in a completely free market.
The events of late 1973 have demonstrated that efficiency, in the limited sense used here, is not the only dimension of the U.S. policy problem. Low- cost foreign supplies of energy can become suddenly expensive if there are monopoly elements in the market. And they can be interrupted, causing severe dislocations in the economy. So the actual calculations that Nord- haus makes are only indirectly relevant to the formation of policy. How- ever, some of these political factors could be built into a more elaborate model of the kind he has pioneered.
Robert Solow: This is a fascinating paper. Details aside, it is clearly right in concept. The most striking result is the finding that the efficiency price of oil is low compared with the current market price. This does not mean that delivered oil is plentiful today; tightness in refining capacity and the recent
William D. Nordhaus 573
cut-off of Arab oil have curtailed supplies. The immediate reduction in the supply of oil has to be met on its own terms and that problem is really beyond the scope of this paper. The current situation should be used to spur research on intermediate technologies, which have been bypassed in the rush to nuclear technology.
Nordhaus' discussion of the instability of the market mechanism over- states the issue somewhat. Monopoly aside, he covers the point formally by saying that he is illustrating a situation in which instability might arise with only a spot market for oil or without a global long-term planner. The ra- tionale underlying this argument runs as follows: In order for a competitive market to be in flow equilibrium, the price of oil must be rising at the cur- rent rate of interest, since that is the means by which owners realize a return on their reserves. If the price of oil is rising more slowly than the rate of in- terest, then oil in the ground is a poor investment since it brings a lower rate of return than various kinds of reproducible capital. If there is only a spot market for oil, owners will produce and sell in an effort to get rid of their oil as quickly as possible. But since the demand curve for oil is nega- tively sloped, the increase in the quantity supplied will further depress its price. Because expectations about the rate of change of oil prices are gen- erated by an adaptive expectations mechanism, reductions in the price will lead to even more pessimistic expectations about future prices. Thus, the ad- justment process that takes place through the spot markets would result in a worsening of the initial disequilibrium.
But this kind of market disequilibrium is not restricted to exhaustible re- sources. It would also apply to the cheesiest kind of growth stock, like a security that does not pay dividends and never will, and whose only value in a portfolio is its current rate of appreciation. The real difference between the growth stock and oil is that oil has definite uses and its owners have in mind some longer-term rendezvous with a future price; to use an old terminology, the price of oil would be anchored by its value in use, as distinguished from its value in exchange.
As a result, if the price of oil now is expected to rise too slowly for equilibrium, petroleum owners will take a short-term capital loss on the value of their reserves, after which the price will rise at a rate approximately equal to the interest rate. While this version may be a bit overdrawn, it is no more so than the pure spot market story that leads Nordhaus to worry about extreme instabilities in price.
The 10 percent discount rate underlying Nordhaus' linear programming calculations is used as an estimate of the rate of return on reproducible

574 Brookings Papers on Economic Activity, 3:1973
capital. The basic issue here is similar to the one involved in public expendi- ture decisions. If resources for marginal public investment come from con- sumption, then the consumption rate of discount would be appropriate; alternatively, if resources are diverted from investment, then that discount rate should be applied. A weighted average of discount rates for consump- tion and investment would be appropriate when resources for public invest- ment have been diverted from both activities. I might point out that even with a utility discount rate of zero, the consumption rate of discount would be positive if per capita incomes are expected to be higher in the future, be- cause of the diminishing marginal utility of income. I do not know if 10 percent is exactly the right rate of discount; but I would not use a very different number.
Nordhaus has excluded from his model the really exotic energy tech- nologies, such as fusion or solar power, that cannot be priced or dated ac- curately. The omission of such potential power sources gives a conservative bias to the paper which strengthens its conclusions. On the other hand, he also omits the use of oil as feedstocks to petrochemical industries, in which it is likely to have a very high value for a long time.
Environmental constraints could embody a significant cost and their ex- clusion from the model is unfortunate. I am particularly concerned here about the disposal of plutonium wastes; little is known about these costs but they could significantly affect the feasibility of breeder technology.
Nordhaus tested the validity of his results by increasing the current esti- mates of costs for intermediate technologies by a factor of 100; and he found that his conclusions were affected very little. Another kind of test would be to delay the introduction of intermediate technologies by a sig- nificant period of time, say, 100 years. Postponing a technology by 100 years would be equivalent to increasing its cost by a factor of 100 squared, or 10,000, and that might have a significant effect on the conclusions. If a new technology is totally unavailable until a distant date, the shadow price of oil might rise above the rendezvous price in the interim and dip down to its prescribed level when the alternative technology becomes available.
General Discussion
Franco Modigliani seconded Solow's statement that the most striking result of the paper was the sizable difference between the actual and opti- mal petroleum prices. He noted two aspects of the model that would make

William D. Nordhlaus 575
it tend to overestimate optimal petroleum prices. Both the price-inelastic demand function for oil and Nordhaus' cost assumptions for substitute energy technologies-which some observers would regard as high-would bias upward the estimated petroleum price paths. He also cited three fac- tors that explain why actual petroleum prices are so high: the very high future price of oil as a petrochemical feedstock; the fact that with a differ- ential tax on capital gains, price might have to rise less rapidly to keep producers in equilibrium between present and future sales; and the monop- olistic element in oil sales. Several other discussants suspected that mo- nopoly pricing was important, citing as evidence the existence of the Texas Railroad Commission and the small number of international oil companies.
Nordhaus remarked that the influence of monopoly on petroleum prices would vary depending on the definition of the monopolist group. In his model, if the rest of the world is assumed to constitute the monopoly, then the predicted price rises to midway between the optimal competitive price and the actual price. However, if all producers of crude petroleum were to constitute the monopoly, then the price of petroleum would rise to about $5.50 per barrel, which is the price of shale oil.
William Poole observed that, despite opinions to the contrary, energy use in the United States did not appear profligate; per capita energy consump- tion did not even double over the period 1929-68. He also questioned the reliability of predictive models such as Nordhaus' in light of the uncer- tainty surrounding technological change. Today's energy technology was not envisioned fifty years ago; and the Nordhaus model would have pre- dicted badly-it would have been far too pessimistic-if applied in 1929. Poole noted that pricing patterns in securities markets behave like a random walk with drift. Similar behavior by prices for oil-producing land would signify that prices were being determined by a process fundamentally different from the one modeled by Nordhaus.
In response to Poole, Nordhaus stated that the most a predictive model could offer was a "careful look around the corner." He noted that the his- tory of technology forecasting was spotty and that many of the break- throughs in the postwar period had not been foreseen. He added, however, that the scope of change might have been narrowed in the postwar period as nuclear processes came to dominate experimental technology.
James Duesenberry noted that oil producers will use a short time horizon in their planning efforts since technological change makes longer-term planning ineffective. The presence of important monopoly elements would

576 Brookings Papers on Economic Activity, 3:1973
encourage the industry to get high prices for oil products in the current period since the future path of prices for these products would be uncertain. A system of rational pricing would differ from the current situation in two important aspects. First, oil products would be cheaper. Second, the pattern of substitution among energy products would be different; for example, nuclear power would not have been introduced until it was economically viable. Arnold Packer added that uncertainty had a different impact on ideal resource allocation from the point of view of society than from that of the resource holder. If the emergence of a competitive resource is uncertain, because the stock of resources is not adequately known or because the feasibility of a backstop terminology is in doubt, society and the resource owner are motivated to opposite courses of action. The owner is moved to sell his resource now to avoid the risk of competition, while society is moved to husband the resource rather than risk shortages in the event that the competitor does not materialize.
Charles Holt expressed concern about the environmental implications of continued economic growth. Energy products impinge on the environment in a variety of ways and Holt questioned whether the model had attempted to account for these differential impacts.
Nordhaus answered that he had incorporated into his model the costs of meeting existing legal restrictions on environmental disruption-for exam- ple, the costs of reclamation, as much as $5,000 an acre, associated with strip mining. He noted that one kind of absolute environmental constraint that man might face would be a limit to the earth's tolerance for energy derived from nonhydro or nonsolar sources. It would be easy to incorpo- rate this kind of a constraint into a linear programming model; this con- straint would result in an initial reduction in prices for energy resources and a rise in final demand prices, since energy resources would have to be used up more slowly. Concerning petrochemical feedstocks, he noted that 10 percent of hydrocarbon fuels has been set aside for non- energy uses; this should be adequate for at least 150 years. After that time, there are immense quantities of low-grade hydrocarbons, which were omitted from the resource estimates. Finally, he agreed that the problem of nuclear waste disposal was an unsolved issue. The problem, however, was not cost, but the "Faustian bargain" with future generations of be- queathing a low-probability risk of disaster. Unfortunately, we cannot even judge this probability until well after the bargain is made.