Embed Size (px)
Citation preview

Risk Management Practices of the Hong Kong
Insurance Industry Survey 2011
The Actuarial Society of Hong Kong
Investment & Risk Management Committee, ASHK
26 June 2012

2
1st industry wide survey conducted in 2008 during the crisis, covering
a comprehensive scope. Companies demonstrated an increasing
importance towards risk management concept while were still finding
their ways through new approaches.
2 years since then with SII introduced and August 2011 US
downgrade plus European debt issues have aroused another new
situation which is often said to be worse than 2008. 2nd survey to be
conducted on similar questions and more specific scopes.
Let’s see where the industry is at now……
Background

3
Part 1: Risk Management Overview
Part 2 : Regulatory Impact
Part 4 : Interest Rate and Equity Risk, the latest “crisis”
Part 5 : Currency Risk
Part 6 : Stress testing and overall Wrap Up
Part 3 : Capital Risk
Table of Content
4
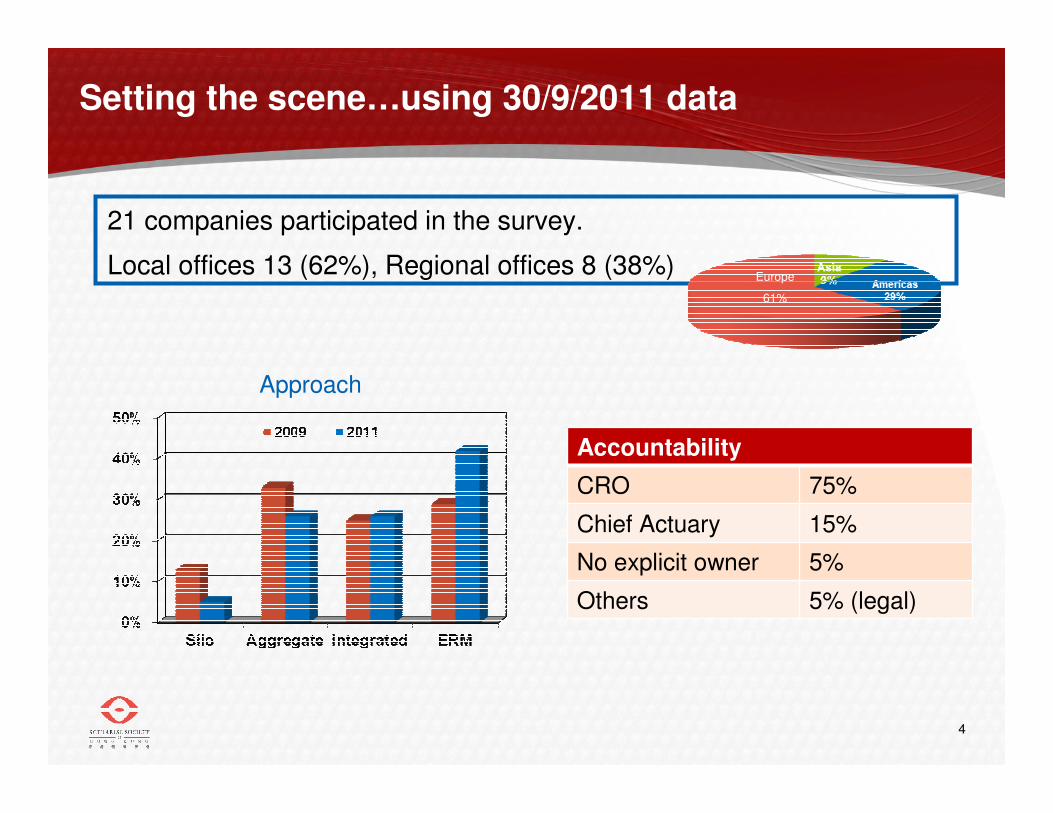
Setting the scene…using 30/9/2011 data
21 companies participated in the survey.
Local offices 13 (62%), Regional offices 8 (38%)
Approach
Accountability
CRO 75%
Chief Actuary 15%
No explicit owner 5%
Others 5% (legal)
Europe
61%

5
Asset and liability positions (local offices only)
(rounded to the nearest %) 2011 2009
Corporate bond 49% 62%
Government bond 23% 11%
Equities (and fund) 10% 11%
Cash / money market 14% 9%
Mortgage / ABS 2% 2%
Policy loans 1% 2%
Real estate 0% 1%
Hedge funds 0% 0%
Others * 1% 2%
Asset class holding Product portfolio
* Other loans and account receivables

6
Key risks to company
Respondents asked to rank 1st to 3rd (1st scores 3, 2nd scores 2, 3rd scores 1)
0
5
10
15
20
25
30
35
40
45
50
Interest rate Equity Credit Liquidity Operational Reputation Capital vol /
level
Regulatory Others
One year ago
Current
Currency, insurance risks

7
Risk management program - Drivers
Respondents asked to rank 1st to 3rd (1st scores 3, 2nd scores 2, 3rd scores 1)
0
5
10
15
20
25
30
35
40
45
50
Head office
requirements
Good business
practice
Regulations GFC impact Shareholders'
need
Rating agency Manage
complex risk
exposures
Competitive
advantage
One year ago Current
8
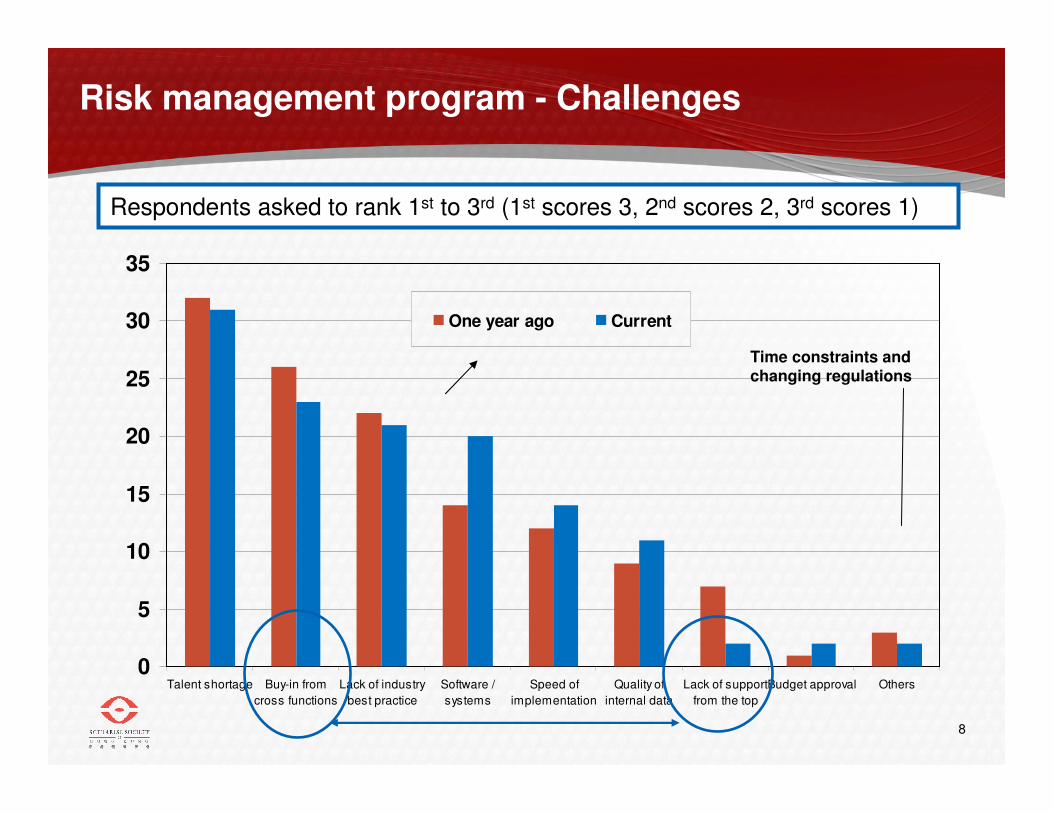
Risk management program - Challenges
Respondents asked to rank 1st to 3rd (1st scores 3, 2nd scores 2, 3rd scores 1)
0
5
10
15
20
25
30
35
Talent shortage Buy-in from
cross functions
Lack of industry
best practice
Software /
systems
Speed of
implementation
Quality of
internal data
Lack of support
from the top
Budget approval Others
One year ago Current
Time constraints and changing regulations

9
Satisfactory level to internal capabilities
Risk management components: Most Least
Framework and governance structure ☺☺☺☺ ☺☺☺☺ ☺☺☺☺
Definition of risk appetites and risk limits ☺☺☺☺ ���� ����
Risk indicators and identification
Risk measurement and quantification ☺☺☺☺ ☺☺☺☺
Internal / external risk reporting and disclosure ���� ���� ����
Internal education and communication of risk policies
Linking senior management remuneration to risk performance ����

10
Alignment of Risk to Strategy
No explicit alignment
1. ERM forms part of strategic planning
2. Integration of risk appetite into business decision process
Closely integrated

11
Part 1: Risk Management Overview
Part 2 : Regulatory Impact
Part 4 : Interest Rate and Equity Risk, the latest “crisis”
Part 5 : Currency Risk
Part 6 : Stress testing and overall Wrap Up
Part 3 : Capital Risk
Table of Content

12
Concerns over regulatory risks
Move up in risk priority No change Less important
60% 35% 5%
Areas of regulatory changes in concern, in order (tick all apply): Most important
1. Local country regulations – capital requirements43%
2. Local country regulations – reserving methodology
3. Local regulators communication / transparency / structure
4. Capital – volatility imposed by economic balance sheet50%
5. Capital – level required by Solvency II
6. Overall tighter scrutiny on distribution, marketing, disclosure 7%
7. Treatment of residual margin and discount rate with IFRS

13
What are the concerns over regulatory risks?
0
2
4
6
8
10
12
14
16
18
20
Inhouse talent
shortage
Uncertainty makes
planning difficult
Pace of change is
distracting
Model risks related to
new rules
Impact on profitability
and competitiveness
Heavy costs of
implementation
One year ago Current
Tick all that apply – sum of responses

14
Views on Solvency II…
European Companies Non Solvency II Practitioners
Top 3 challenges to Solvency II implementation to date
1. Build capacity and flexibility to cope with potential surprises from further guidance
2. Devise detail action plans to define key stakeholders’ role, work flow and procedures
3. Develop adequate subject matter resources

15
Part 1: Risk Management Overview
Part 2 : Regulatory Impact
Part 4 : Interest Rate and Equity Risk, the latest “crisis”
Part 5 : Currency Risk
Part 6 : Stress testing and overall Wrap Up
Part 3 : Capital Risk
Table of Content

16
Capital measures – what is everyone using now?
Others include Local, ICA, S&P
� Majority using at least 2 capital measures.
� Most popular combination -Solvency I & RBC/EC.

17
Capital measures – what is everyone thinking now?
Rank importance (1-3)

18
Capital measures – what is everyone thinking in 5 years time?
Rank importance (1-3)

19
Capital calculation – RBC / EC / Solvency II SCR
Measures Key survey results
Implementation 50% with “5+ years”
Frequency 73% with “Quarterly”
Time horizon 86% with “1 year”
VaR or CTE 75% with “VaR alone”
Satisfaction level (1 = “Not at all” and 5 = “Very”)
53% with “3”; 33% with either “4” or “5”

20
Capital calculation – Benefits
Provides uniform, clear, comparableand transparentquantification and presentation of different type of risks
Allows risk management to be embedded in the
business decision process
Risk-based and under economic basis regardless of accounting rules
Allows easier communication with senior management
Transparency of risks as the measures set out explicitly the capital requirement for the various risks considered. This provides management with a better view of the key risks.
RBC / EC / Solvency II SCR
RBC / EC / Solvency II SCR

21
Capital calculation – Weakness
Lack full understanding and adoption of the measure
RBC / EC / Solvency II SCR
RBC / EC / Solvency II SCR
Resource constraint
May contradict the result under accounting basis
Lacking credible calibration of the required shocks to use (due to lack of
data, various possible calibration approaches, etc)
Reliance on historical data to estimate parameters for probability distributions, and
that the model distribution may not fit reality
Large risk charge on equities, and overly complicatedmethodology which makes it difficult to understand changes and extremely difficult to communicate and explain to management
Correlation is subjective

22
Capital regime and reserving basis
Q1: Do you consider a need to review the reserving basis if HK is to move to RBC
regime?
Q2: What is your view on when, if ever, Hong Kong should move to a RBC regime?
75%

23
Capital requirement volatility
Q3: Should volatility of capital requirement (the risk thereof) be a consideration
when designing a regulatory capital base? 1 to 5 with 1 = “Not at all” and 5 =
“Very agree”.

24
Capital regime uncertainties
The greatest hurdles when moving towards RBC regime
� Long-term products require long-maturity assets to reduce asset and liability mismatch risk, butmarket lack credible HK yield curve.
� Acceptance of industry to penalise current accepted practices (e.g. ALM mismatch) is difficult.
� Equity (subject to higher risk charge) would be less attractive to invest thus par products would be penalised.
� Lack of resources and skills to build and implement RBC for both regulator and insurance players.
� Subject to capital availability in the market.
� Multiple solvency requirements for international insurance companies.
� Only change capital requirement but keep the reserving basis unchanged� Should consider both under RBC-type capital regime.
� Require stochastic modelling capability, calibration of shocks, consistent methodology and transparent reporting.
� Lack of historical data to set management action and dynamic policyholder behavior.

25
Part 1: Risk Management Overview
Part 2 : Regulatory Impact
Part 4 : Interest Rate and Equity Risk, the latest “crisis”
Part 5 : Currency Risk
Part 6 : Stress testing and overall Wrap Up
Part 3 : Capital Risk
Table of Content

26
Liability Management: Existing Portfolio
Responses on Product Management
• Unprofitable products likely to be closed as of last survey• Resort to dividend mechanisms• More inclined to develop new products
68%
87%
69%
54%
66%
20%
32%
13%
31%
46%
34%
80%
0% 25% 50% 75% 100%
2010
Adj Dividend rates 2011
2010
Develop new products 2011
2010
Closing certain products 2011
Yes No
200920092009201120112011

27
Liability Management: New Products
Relative change to / intention to change the product mix of new business sales
Decrease No change Increase
Pure risk / health 0% 35% 65%
Participating products 28% 56% 17%
Non-participating products 24% 59% 18%
Investment linked (with guarantees) 40% 60% 0%
Investment linked (without guarantees) 12% 41% 47%
Non-life / Others 0% 94% 6%
• Move away from guaranteed products• Move more towards risk products• Move more towards investment linked products

28
Management of assets
CashGov’t bond
Corp bond
EquitiesReal
EstatePolicy Loan
Hedge funds
MBS/ ABS
Increased 30% 33% 30% 0% 30% 6% 12% 0%
No change 70% 62% 55% 67% 65% 88% 82% 82%
Decreased 0% 5% 15% 33% 5% 6% 6% 18%
Responses to the sovereign crisis
Yes:79% No:21%
Asset management arrangement
10%
Shift to In-house
No Change : 85%
More dynamic asset allocation
Shift to Outsource
5%

29
Actions for Unforeseeable Future Events
Non-Guaranteed
Products
Unit-linked
Products
Dynamic allocation in
the investment process
Intention to increase
78% 83% 50%
No change 22% 17% 50%
30
Part 1: Risk Management Overview
Part 2 : Regulatory Impact
Part 4 : Interest Rate and Equity Risk, the latest “crisis”
Part 5 : Currency Risk
Part 6 : Stress testing and overall Wrap Up
Part 3 : Capital Risk
Table of Content

31
Currency Mismatch Risk
No
80.0%
Materiality of HKD Currency Mismatch
Do your company use separate duration measurement for different currency?
Immaterial 64%
Somewhat sizeable
23%
Significant and should be dealt with
14%

32
Level of Currency Mismatch Reserve

33
Changes since 2008 financial crisis
No
80.0%
No
46.3%
No 13.3%

34
Instruments use to manage currency exposures
No
80.0%
No
46.3%
No 13.3%
• Participants can select more than one instrument in the survey

35
Managing and taking currency risks
No
80.0% No
46.3%
No 13.3%
Number of instruments used for managing currency risks
Do your company use asset managers to profit from taking currency risks explicitly?
Use Four Types7%
Use One Type43%
Using Two Types36%
Using Three Types14%
No95%
Yes5%

36
Part 1: Risk Management Overview
Part 2 : Regulatory Impact
Part 4 : Interest Rate and Equity Risk, the latest “crisis”
Part 5 : Currency Risk
Part 6 : Stress testing and overall Wrap Up
Part 3 : Capital Risk
Table of Content

37
Purpose of Stress Testing
What type of risks are covered?
20 out of 21 companies perform stress testing / 12 local and 8 regional offices
• Other risks covered in stress testing are: implied volatility risk, credit spread risk and expense risk

38
Purpose of Stress Testing (cont’d)
Importance of risks vs. risks covered in stress testing
80%
40%
15%20%
5%
100% 95%
80%
60%
40%
0%
20%
40%
60%
80%
100%
Interest rate risk Equity risk Credit risk Operational risk Liquidity risk
Risk typesThe 3 most important risks seen by companies Covered in stress testing

39
Drivers of Stress Testing
70% 75%90%
30% 25%10%
0%
20%
40%
60%
80%
100%
Regulator - local Regulator - group Internal risk
management
Yes No

40
Frequency of Stress Testing
6% 5%
12% 28%
55%6%
5%82%
66%
20%
15%
0%
20%
40%
60%
80%
100%
Regulator - local Regulator - group Internal risk management
One-off
Irregular
Annually
Bi-annually
Quarterly
Monthly

41
Frequency of Stress Testing (cont’d)
How often do we perform stress testing for internal risk
management in relation to asset portfolio size?
25%
45%
75%33%
22%
0%
20%
40%
60%
80%
100%
<$50 billion >=$50 billion
Asset portfolio size
Irregular
Annually
Quarterly
Monthly

42
Measurements/ Risk Metrics used
Other risk metrics that we have used are: MCEV(EEV), Embedded Value, new business strain, experience variance, liquidity cover
80%
65% 60%
30%
20%
35% 40%
70%
0%
20%
40%
60%
80%
100%
Statutory
Solvency ratio &
Capital
Economic
Capital
IFRS profit Statutory profit
No
Yes

43
Time horizon of stress testing performed
Snapshot on
current position
only
30%
Projected 1 year
15%Projected 3-4 years
30%
Projected 5 years
20%
Not
provided
5%
40%
20%
67%
20%
33%
20%
0%
10%
20%
30%
40%
50%
60%
70%
80%
90%
100%
<$50 billion >=$50 billion
Asset portfolio size
Snapshot on current position only Projected 1 year
Projected 3-4 years Projected 5 years
Time Horizon used in Stress Testing

44
Types of modelling used
50%
20%
85%
15%
30%
0%
10%
20%
30%
40%
50%
60%
70%
80%
90%
100%
Deterministic Stochastic
With dynamic policyholder behaviour Without dynamic policyholder behaviour Yes No

45
Types of modelling used (cont’d)
Choice of model type in relation to location of head office
Deterministic
25%
Stochastic
17%
Deterministic +
Stochastic
58%
Deterministic
38%
Stochastic
12%
Deterministic +
Stochastic
50%
European Companies Non Solvency II Practitioners

46
Key takeaways (1)…
• Regulatory
– General concern over regulatory capital, and how regulators react to current (still) volatile market
– Seem overall agreement that RBC is the way to go but not all companies are prepared for the requirements
– A portion of non-European based insurers to catch up on sophisticated modeling?
– Believe in implementation of SII?
• Product strategy
– Moving towards risk products and less guarantees, health an apparent trend
– At current economic condition, illustrated yields set PRE? Affordable level? How to manage going forward given the smaller room….
– Dilemma: competition reactions drive behavior and strategy?

47
Key takeaways (2)…
• ALM and profit enhancement
– Cautious and gone / going through significant de-risking
– Variations in currency risk management – 1/3 said mismatch sizable!
– Are we still relying on the peg?
• Industry attitude and mindset to ERM
– Multiple perspectives and acquainted with process, more buy-in from the top
– Still uncertainty around internal and external disclosures
– Overall a good sign to industry

Risk Management Practices of the Hong Kong
Insurance Industry Survey 2011
The Actuarial Society of Hong Kong
Presenters:
Ms. Ka-Man Wong / Mr. Peter Fang / Mr. Steve Tong / Mr. Andrew Siu
26 June 2012
Thank you – Q&A