Embed Size (px)
Citation preview

The Astrophysical Journal, 724:1030–1043, 2010 December 1 doi:10.1088/0004-637X/724/2/1030C© 2010. The American Astronomical Society. All rights reserved. Printed in the U.S.A.
THE ACS NEARBY GALAXY SURVEY TREASURY. IX. CONSTRAINING ASYMPTOTIC GIANT BRANCHEVOLUTION WITH OLD METAL-POOR GALAXIES
Leo Girardi1, Benjamin F. Williams
2, Karoline M. Gilbert
2, Philip Rosenfield
2, Julianne J. Dalcanton
2,
Paola Marigo3, Martha L. Boyer
4, Andrew Dolphin
5, Daniel R. Weisz
6, Jason Melbourne
7, Knut A. G. Olsen
8,
Anil C. Seth9, and Evan Skillman
61 Osservatorio Astronomico di Padova-INAF, Vicolo dell’Osservatorio 5, I-35122 Padova, Italy2 Department of Astronomy, University of Washington, Box 351580, Seattle, WA 98195, USA
3 Dipartimento di Astronomia, Universita di Padova, Vicolo dell’Osservatorio 2, I-35122 Padova, Italy4 Space Telescope Science Institute, 3700 San Martin Drive, Baltimore, MD 21218, USA
5 Raytheon Company, 1151 East Hermans Road, Tucson, AZ 85756, USA6 Department of Astronomy, University of Minnesota, 116 Church Street SE, Minneapolis, MN 55455, USA
7 Caltech Optical Observatories, Division of Physics, Mathematics and Astronomy, Mail Stop 301-17, California Institute of Technology, Pasadena, CA 91125, USA8 National Optical Astronomy Observatory, 950 North Cherry Avenue, Tucson, AZ 85719, USA9 Harvard-Smithsonian Center for Astrophysics, 60 Garden Street, Cambridge, MA 02138, USA
Received 2010 July 26; accepted 2010 September 23; published 2010 November 10
ABSTRACT
In an attempt to constrain evolutionary models of the asymptotic giant branch (AGB) phase at the limit oflow masses and low metallicities, we have examined the luminosity functions and number ratios between AGBand red giant branch (RGB) stars from a sample of resolved galaxies from the ACS Nearby Galaxy SurveyTreasury. This database provides Hubble Space Telescope optical photometry together with maps of completeness,photometric errors, and star formation histories for dozens of galaxies within 4 Mpc. We select 12 galaxiescharacterized by predominantly metal-poor populations as indicated by a very steep and blue RGB, and whichdo not present any indication of recent star formation in their color–magnitude diagrams. Thousands of AGBstars brighter than the tip of the RGB (TRGB) are present in the sample (between 60 and 400 per galaxy),hence, the Poisson noise has little impact in our measurements of the AGB/RGB ratio. We model the photometricdata with a few sets of thermally pulsing AGB (TP-AGB) evolutionary models with different prescriptions forthe mass loss. This technique allows us to set stringent constraints on the TP-AGB models of low-mass, metal-poor stars (with M < 1.5 M�, [Fe/H] � −1.0). Indeed, those which satisfactorily reproduce the observedAGB/RGB ratios have TP-AGB lifetimes between 1.2 and 1.8 Myr, and finish their nuclear burning lives withmasses between 0.51 and 0.55 M�. This is also in good agreement with recent observations of white dwarfmasses in the M4 old globular cluster. These constraints can be added to those already derived from MagellanicCloud star clusters as important mileposts in the arduous process of calibrating AGB evolutionary models.
Key words: stars: general
Online-only material: color figures
1. INTRODUCTION
The thermally pulsing asymptotic giant branch phase (TP-AGB) is both one of the most important and one of the more un-certain phases of stellar evolution. Its importance resides mainlyin its sizeable contribution to the integrated light and chemicalyields of stellar populations, which are essential for the under-standing of galaxy evolution and the interpretation of the lightfrom distant galaxies (e.g., Maraston et al. 2006; Eminian et al.2008; Conroy et al. 2009; Conroy & Gunn 2010). Its uncer-tainties derive from a series of circumstances including theircomplex internal structure; the critical role of difficult-to-modelprocesses such as convective dredge-up, mass-loss, circumstel-lar dust formation, and long-period variability; and the scarcityof clear-cut and unequivocal observational constraints on theirevolution in the most immediate universe.
Gigantic steps are being made in all of these subjects, but thepresent situation is that the evolutionary timescales of stars inthe TP-AGB phase are far from being settled. Uncertainties bya factor of a few still exist at the extremes of the age–metallicityregion allowed for AGB stars. This contrasts sharply with otherevolutionary phases like the main-sequence and red giant branch(RGB), for which the evolutionary times are known with errors
smaller than a few tenths, as demonstrated by a large variety ofobservations (see Gallart et al. 2005 and references therein).
Present-day constraints on the TP-AGB evolution are largelybased on observations of stars in the Magellanic Clouds andof the Milky Way (MW). The lifetimes as a function of stellarmass, for slightly subsolar metallicities, can be derived for starcounts in Magellanic Cloud clusters (Frogel et al. 1990; vanLoon et al. 2005; Girardi & Marigo 2007a). The same can bedone for low-mass stars in MW globular clusters. Even for themost populous star clusters, however, AGB stars are few andtheir counts are affected by large Poisson fluctuations; in thecase of MW globular clusters, AGB stars brighter than the tipof the red giant branch (TRGB), and long period variables,practically disappear from observed samples at [Fe/H] � −1.0(Frogel & Elias 1988; Frogel & Whitelock 1998).
Thus, to obtain useful constraints on the AGB lifetime fromstar clusters, it is necessary to either sum the star counts in manyclusters into age and metallicity bins (e.g., Girardi & Marigo2007a), or embark on a more detailed study of the dust, chemical,and pulsational properties of individual cluster stars (see, e.g.,Lebzelter & Wood 2007; Lebzelter et al. 2008; Kamath et al.2010 for Magellanic Cloud clusters, and Lebzelter et al. 2006;van Loon et al. 2006; McDonald et al. 2009, 2010; Boyer et al.
1030
No. 2, 2010 THE ACS NEARBY GALAXY SURVEY TREASURY. IX. 1031
2009b, 2010 for MW globular clusters). Less direct constraintson AGB evolution come from integrated cluster properties,such as their colors and surface brightness fluctuations (see,e.g., Maraston 2005; Pessev et al. 2008; Raimondo 2009;Conroy et al. 2009; Conroy & Gunn 2010), which by theirvery nature cannot disentangle different evolutionary propertiessuch as stellar luminosities, lifetimes, and chemical types, andhence often provide somewhat ambiguous constraints on thenumbers of stars at different evolutionary stages. It may happen,for instance, that TP-AGB models which do not consider thethird dredge-up and the formation of carbon stars (such asthe BaSTI ones; Cordier et al. 2007), or models in whichcarbon stars are shifted to the high effective temperature (Teff)range of 4000–3100 K (Conroy et al. 2009; Conroy & Gunn2010, with their log Teff shift of ∼+0.1 dex for TP-AGB starsat Magellanic Cloud metallicities), provide acceptable (butspurious) fits to integrated colors of Magellanic Cloud clusters.Unfortunately, the properties of these models are inconsistentwith the most basic observations of over 10,000 C-type AGBstars in the Magellanic Clouds (see Nikolaev & Weinberg 2000;Cioni & Habing 2003) with a significant fraction being at3100 > Teff(K) > 2650 (Groenewegen et al. 2009). Such highdiscrepancies and gaps in the models remain hidden when onlythe integrated properties are examined.
The problem of low number counts in star clusters could, inprinciple, be circumvented by using AGB star counts in entiregalaxies, but, in practice, this implies meeting a series of dif-ficulties. For galaxies with moderate-to-high metallicities, theAGB develops at low effective temperatures, and consequentlynear-infrared photometry is required to unveil them, as dra-matically demonstrated by the Magellanic Clouds (Frogel et al.1990; Cioni et al. 2000; Weinberg & Nikolaev 2001). Moreover,since a non-negligible fraction of the AGB population becomesdust-enshrouded, mid-infrared data are necessary for a completecensus of the AGB population (e.g., Blum et al. 2006; Bolattoet al. 2007; Boyer et al. 2009a).
At the limit of very low metallicities, the nearest low surfacebrightness dwarf spheroidal galaxies (dSph) seem to be partic-ularly useful for the study of their AGB populations becausethey appear uncrowded at magnitudes accessible with present-day 4 m class telescopes equipped with near-infrared cameras.Indeed, Gullieuszik et al. (2008) and Held et al. (2010) are ableto derive important indications from ground-based data of theLeo II and Leo I dSphs (see also Lagadec et al. 2008 for Fornaxand Sagittarius). The main uncertainties in these works derivefrom the small numbers of AGB stars, from the high MW fore-ground contamination, and the uncertainties in the dSphs starformation histories (SFHs). Also, Boyer et al. (2009a) call at-tention to the large fraction (30%–40%) of AGB stars in dwarfirregulars (dIrr) which are bright in mid-infrared light, but areeither missing or misclassified in optical studies because theyare enshrouded in thick dust shells. It is still not clear whetherthis fraction is also representative of dSphs.
The possibilities for a better calibration of AGB luminositiesand lifetimes become much wider when milliarcsecond reso-lution imaging is available. A good example is provided byMelbourne et al. (2010), who use images taken with the Ad-vanced Camera for Surveys (HST/ACS) in the I band (F814W )together with Keck Adaptive Optics (AO) in K to study the AGBpopulation of the dIrr KKH 98 at a distance of 2.5 Mpc. Thiswork clearly demonstrates the utility of moving toward moredistant resolved dwarf galaxies, for which (1) more stars can beobserved in a single pointing, even considering the small field of
view available for ACS and AO, and (2) the MW foreground be-comes dramatically smaller. On the other hand, some potentialdisadvantages of these targets are also evident: (1) they presentSFHs that are somewhat more uncertain than the nearest dSphs;(2) there is no spectroscopic information to allow a clear-cutseparation between the hottest C- and O-rich stars (cooler stars,instead, are well separated by their infrared colors), which limitsthe analysis of aspects related to the third dredge-up events in theAGB; (3) the mid-infrared photometry is also not available, dueto the limited resolution of Spitzer and AKARI, hence limitingthe analysis to non-obscured AGB stars; and (4) the chance ofcrowding/blending of AGB and RGB stars also increases withdistance.
A result common to the low-metallicity dwarf galaxies stud-ied by Gullieuszik et al. (2008), Held et al. (2010), andMelbourne et al. (2010) is that the TP-AGB lifetimes fromMarigo & Girardi (2007, hereafter MG07) and Marigo et al.(2008) models are, apparently, largely overestimated. The rea-son for this is still not clear, but is possibly due to the under-estimation of the mass-loss rates at low metallicities. As a con-curring factor, the circumstellar extinction presently assumedin the models may be somewhat underestimated, as suggestedby the Spitzer observations of nearby dwarf irregulars by Jack-son et al. (2007a, 2007b) and Boyer et al. (2009a). Regard-less, it is likely that the problem is limited to low metallicities,since the MG07 TP-AGB models have been calibrated in theintermediate-metallicity Magellanic Clouds. Their evolutionarybehavior at very low metallicities can be considered as eithereducated guesses, or extrapolations of the behavior met at in-termediate metallicities, since they are a result of the straightapplication of theoretically uncertain metallicity dependences.
In this paper, we use Hubble Space Telescope (HST) opticaldata from the ACS Nearby Galaxy Survey Treasury (ANGST)survey to derive constraints on the AGB evolution for a set ofmetal-poor galaxies in which the recent star formation activityis generally very low, if not absent. Our target is to deriveconstraints on the optically visible TP-AGB lifetimes of low-mass, metal-poor stars. The advantage of using a set of Mpc-distant galaxies is clear: we will have thousands of AGB starsin our samples, reducing Poisson noise to a minimum. Theprice to pay, as in the case of Melbourne et al. (2010), is thatour analysis can be affected by uncertainties in the SFHs ofindividual galaxies. The hope however is that these SFH errorsbecome less relevant when averaged over a large sample ofgalaxies.
In Section 2, we describe the data used in this work. InSection 3, we model the data using two different sets of TP-AGB models, deriving clear quantitative constraints on them.We then provide a revised set of TP-AGB tracks that bringsmodels and observations into better agreement.
2. THE DATA
2.1. The ANGST/ANGRRR Photometry Database
We used data from the ANGST10 (Dalcanton et al. 2009)and from the “Archive of Nearby Galaxies: Reduce, Reuse,Recycle” (ANGRRR)11 databases. These two programs havearchived stellar photometry for tens of millions of stars innearby galaxies outside the Local Group, based on imagestaken with the ACS and the Wide Field Planetary Camera
10 http://www.nearbygalaxies.org, http://archive.stsci.edu/prepds/angst/11 http://archive.stsci.edu/prepds/angrrr

1032 GIRARDI ET AL. Vol. 724
2 (WFPC2) on the HST. The imaging primarily used blueobservations in the F475W, F555W , or F606W filters, andF814W for the red filter. The photometry was performedusing DOLPHOT12 and HSTPHOT13 (for ACS and WFPC2imaging, respectively; Dolphin 2000), as described fully inDalcanton et al. (2009) and Williams et al. (2009). The depth ofthe resulting color–magnitude diagrams (CMDs) varies withdistance, crowding, and exposure time, but reaches severalmagnitudes below the TRGB in all cases, and below the redclump (MI ∼ −0.5 mag) in all but two of the cases we analyzehere.
For this paper, the photometry from the first data release forANGST and ANGRRR has been supplemented with extensiveartificial star tests. For each of the fields studied, a minimumof 100,000 artificial star experiments were performed to deter-mine the completeness and errors as a function of color andmagnitude. In each test, one star of known color and magni-tude was added to the data, and the photometry routine wasre-executed to determine the difference between the input andoutput magnitudes if the star was recovered.
SFHs were determined by fitting the observed CMDs withthe MATCH fitting package (Dolphin 2002). The parameters ofMATCH were set to match those used by Williams et al. (2009).In brief, a Salpeter (1955) IMF was used to generate a base set ofHess diagrams using the isochrones of Girardi et al. (2002; withupdates in Marigo et al. 2008) and the error and completenessfrom our artificial star tests. The best-fit combination of thisbase set of diagrams was then determined using the statisticsdescribed in Dolphin (2002). First, the fit was performed onthe full data set brightward of the 50% completeness limit asdetermined by our artificial star tests. Then, the fit was repeatedexcluding all data brightward of the TRGB. This second fitallowed us to quantify the effects of the bright AGB stars on theresulting SFH (as discussed in Section 3.2).
We further analyzed the CMDs to estimate extinctions AV ,distance moduli (m−M)0, and the magnitude of the TRGB. Thetotal extinction and distance moduli are determined automati-cally by MATCH, based on the optimal reddening and distanceneeded to reproduce the observed CMD (see the full discus-sion in Williams et al. 2009), assuming RV = 3.1 at opticalwavelengths. Uncertainties are determined by identifying therange over which AV and (m−M)0 can vary without producinga statistically significant reduction in the quality of the fit to theobserved CMD.
2.2. The Galaxy Sample and Their SFHs
We chose galaxies for our sample based on two primarycriteria—metallicity and mean stellar age. The first restrictionresults from our desire to analyze only the galaxies in whichthe ANGST/ANGRRR optical data contain a nearly completecensus of the AGB population. This requirement naturallylimits our work to galaxies with metal-poor populations (say[Fe/H] � −1.2). At these metallicities, the upper AGB developsat Teff > 4000 K and colors F475W–F814W < 2.4, orF606W–F814W < 1.2, and still falls at the plateau of theBC–Teff relations (Figure 1). Bolometric corrections for low-metallicity AGB stars are thus close to their minimum values,ensuring that the brighter stars really do appear at the smallermagnitudes. In contrast, for redder, high-metallicity AGB stars,bolometric corrections become significant and increase steadily
12 http://purcell.as.arizona.edu/dolphot13 http://purcell.as.arizona.edu/hstphot
Figure 1. Top panel: F814W -band bolometric corrections as a function of Teff ,for both [Fe/H] = 0 (continuous line) and [Fe/H] = −2 (dashed line). Bottompanel: the Teff–color relations for both F475W–F814W and F606W–F814W ,for the same metallicities. These relations are described in Girardi et al. (2008).The small kinks at Teff ∼ 3800 K correspond to the transition between Castelli& Kurucz (2003, for log g = 2) and Fluks et al. (1994) model atmospheres.
with color. Redder AGB stars thus become progressively lessaccessible in the optical, and instead require near-infraredphotometry to extend the complete AGB counts toward theregion of lower Teff , which corresponds to more metal-richgalaxies.
We further restrict the galaxy sample to regions that havea simple-to-interpret SFH, with AGB stars limited to a well-defined region of the age–metallicity plane. This request limitsus to galaxies dominated by old stars, for which there is nosign of recent or intermediate-age star formation. Thanks tothe steep mass–main-sequence lifetime relation, the absence ofpopulations younger than 3 Gyr ensures that the evolved starshave initial masses confined to a narrow interval, of roughly0.8–1.4 M�. The AGB star counts in these galaxies should thenprovide clear constraints on the evolution of low-mass stars.
Based on these two conditions, we have selected a sample ofgalaxies for which a visual inspection of the CMD revealed:(1) an almost vertical RGB, with the TRGB at F475W–F814W � 2, or F606W–F814W � 1 so as to indicate lowmetallicity and BCF814W � 0.5 (Figure 1), and low foregroundextinction, and (2) no evidence for recent and intermediate-age star formation, as indicated by an absence of any youngermain sequence and helium burning sequence above the redclump/HB. This latter restriction eliminates galaxies with starformation in the most recent 0.5 Gyr, but may admit galaxieswith some amount of star formation at intermediate ages. A fullanalysis of the SFHs can be found in D. R. Weisz et al. (2011,in preparation).
Although our selection considered both ACS and WFPC2data, it turns out that the final sample contains ACS data only.
The left panels in Figure 2 illustrate the CMDs for all theselected galaxies and galaxy regions. Their basic properties andparameters are listed in Table 1.
No. 2, 2010 THE ACS NEARBY GALAXY SURVEY TREASURY. IX. 1033
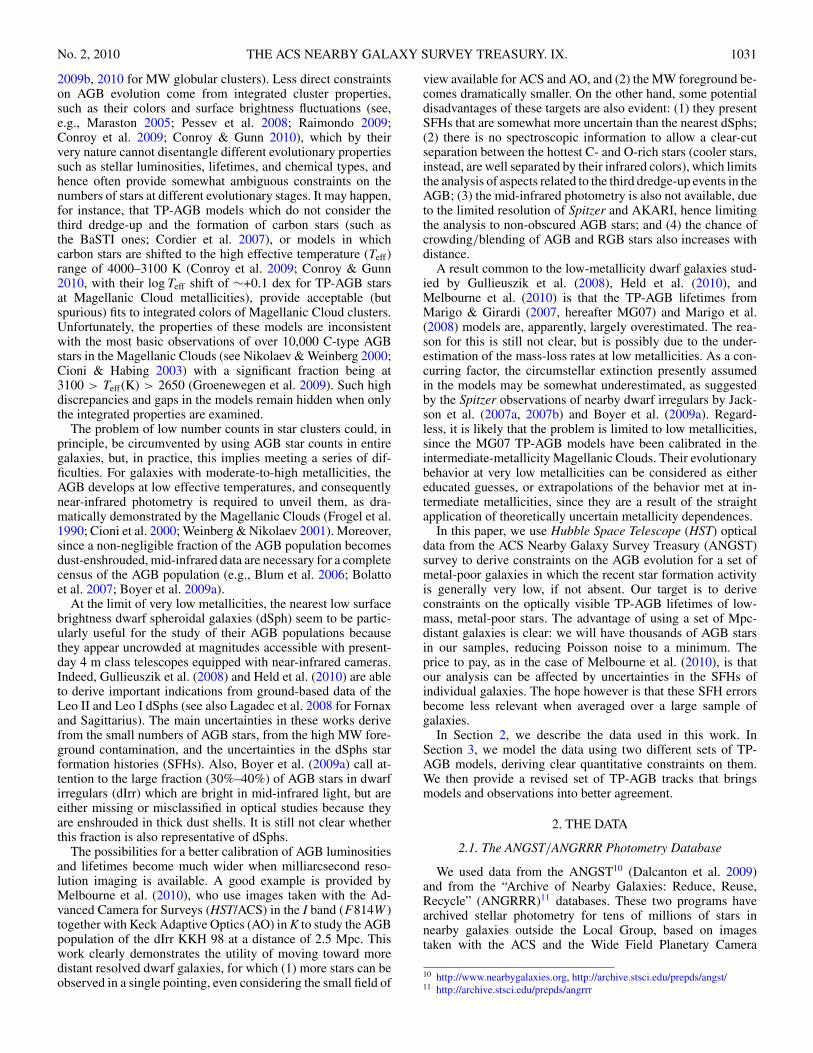
Figure 2. Data and models used in this work, for all galaxies and galaxy regions in our sample. Left panels: the observed CMD from ANGST/ANGRRR. Thehorizontal lines mark the TRGB and upper and lower magnitude limits of the stars considered to be in the upper RGB and AGB. Their total numbers are marked insidethe boxes. Middle panels: the same as in the left panel, but for the model CMD from TRILEGAL, with the default set of TP-AGB models (Marigo et al. 2008) andscaled to present the same number of upper RGB stars. Right panels: a comparison between the observed (black) and model (red or gray) luminosity functions.
(A color version of this figure is available in the online journal.)
1034 GIRARDI ET AL. Vol. 724
Table 1Basic Parameters of Our Galaxy Sample
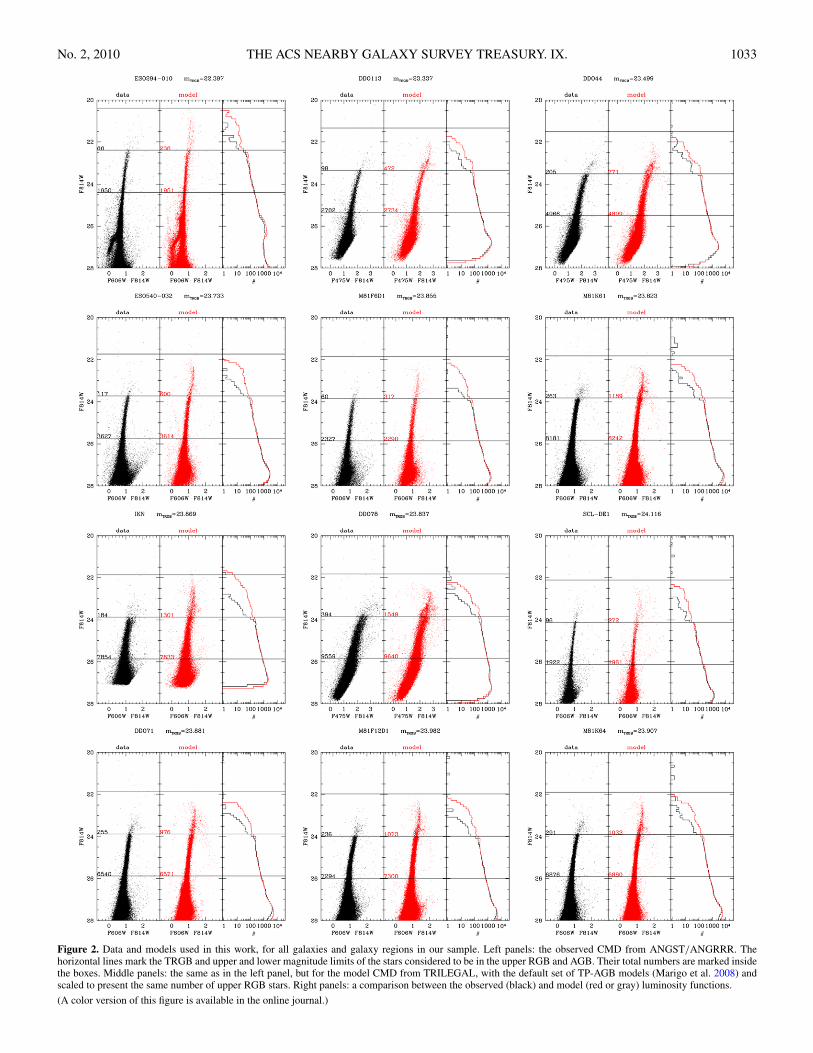
Target/Name Filters AV mTRGB m50%complete (m − M)0 NRGB NAGBNAGBNRGB
ESO294-010 F606W,F814W 0.018 22.397 ± 0.008 28.25 26.434 1950 66 0.034 ± 0.004DDO113 F475W,F814W 0.063 23.337 ± 0.026 27.43 27.349 2702 98 0.036 ± 0.004DDO44 F475W,F814W 0.129 23.499 ± 0.015 27.61 27.454 4966 205 0.041 ± 0.003ESO540-032 F606W,F814W 0.064 23.733 ± 0.020 27.83 27.743 3627 117 0.032 ± 0.003M81F6D1 F606W,F814W 0.241 23.855 ± 0.010 27.85 27.737 2326 60 0.026 ± 0.003M81K61 F606W,F814W 0.226 23.823 ± 0.042 28.05 27.716 8181 263 0.032 ± 0.002IKN F606W,F814W 0.181 23.869 ± 0.019 26.97 27.786 7854 184 0.023 ± 0.002DDO78 F475W,F814W 0.066 23.837 ± 0.017 27.55 27.818 9559 394 0.041 ± 0.002SCL-DE1 F606W,F814W 0.046 24.116 ± 0.023 28.41 28.110 1922 96 0.050 ± 0.005DDO71 F606W,F814W 0.303 23.881 ± 0.019 28.05 27.740 6540 255 0.039 ± 0.002M81F12D1 F606W,F814W 0.442 23.982 ± 0.013 28.03 27.749 7294 236 0.032 ± 0.002M81K64 F606W,F814W 0.165 23.907 ± 0.009 28.42 27.852 6876 291 0.042 ± 0.003Total 65771 2265 0.0344 ± 0.0007
Note. AV and (m − M)0 come from the best MATCH solution.
2.3. Selecting AGB and RGB Stars
To identify the location of RGB stars, we adopted themagnitude of the TRGB (mTRGB) from Dalcanton et al. (2009),who identified the TRGB in uncrowded low extinction regionsof each galaxy using the edge-detection method of Mendezet al. (2002). The TRGB magnitude can also be converted intoa distance modulus, using the foreground extinction derivedby Schlegel et al. (1998), and the absolute magnitude of theTRGB in the isochrones of Marigo et al. (2008) at the observedcolor of the RGB stars used to derive the TRGB. The TRGB-based distance modulus does not necessarily agree with the onereported by MATCH, since the latter can be biased toward largerdistances in an attempt to better fit the magnitude of the well-populated red clump, which is known to be faint in the Marigoet al. (2008) isochrones currently used in MATCH. In whatfollows, we use the (m−M)0 and AV derived from MATCH forgenerating artificial CMDs. However, for isolating AGB stars,we use the empirically determined value of mTRGB, as given inTable 1.
An interval of two magnitudes above the TRGB defines the“AGB sample.” In all cases, it includes the bulk of (if not all)stars brighter than the TRGB. Their number, NAGB, is typicallybetween 60 and 400 per galaxy.
The RGB sample, instead, is defined over 2 mag below theTRGB. This sample has, typically, a completeness above 95%,and about 30 times more stars than in the AGB sample.
The number ratios between AGB and RGB stars,NAGB/NRGB, are presented in Table 1, together with the 1σrandom errors.
The AGB sample as above defined is contaminated by afew RGB stars at its faintest magnitude bins because of thescattering of stars to brighter magnitudes by photometric errorsand binaries. For the galaxies with the smallest NAGB/NRGB,the effect is such that this ratio can be increased by up to20% with respect to its true value. As we will see below, thisis a marginal effect considering the large discrepancies—ofa few times—between present models and the observations.Moreover, the scattering of RGB stars to brighter magnitudes isfully taken into account in our simulations (Section 3), so thatno inconsistency results from counting a few RGB stars in theAGB sample. On the other hand, the RGB sample contains boththe initial sub-luminous section of the TP-AGB phase and theexcursions to low-luminosities driven by thermal pulses, as wellas stars leaving the early-AGB phase. Based on evolutionary
models, we estimate that this contamination, in the worst cases,is just a few percent. Moreover, the numbers of early-AGB starsare expected to be quite insensitive to the uncertainties in themass-loss prescriptions, which instead plague the TP-AGB starsabove the TRGB.
2.4. Uncertainties in the SFH and AGB/RGB Ratio
The measured NAGB/NRGB ratios have values comprisedbetween 0.023 and 0.050. Random errors are, in all cases,smaller than 20%. The mean value derived by adding all stars inthe sample is 0.0344 ± 0.0007. Clearly, the random noise in therelative number of AGB stars is less of a concern in our data set.The main point of concern instead is in the correctness of theSFHs for the host galaxies, which is crucial for the interpretationof the NAGB/NRGB ratios.
As we show below, the current isochrones overpopulatethe AGB sequences, potentially biasing our SFHs to low starformation rates and intermediate ages when these stars areincluded in the fit of the CMD. We therefore re-derive the SFHsexcluding AGB stars, taking care to keep all other aspects of thefitting identical. Specifically, we exclude CMD regions abovethe TRGB, and those with either F606W–F814W > 3.5 orF475W–F814W > 4.5 (depending on the filters used in theobservations) from our fitting. The resulting SFHs correspond tothe “no-AGB” cases in Table 2. They differ little from the default“with-AGB” cases, indicating that the structure of the red clumphas far more influence on the inferred SFH at intermediate ageswith the weighting scheme currently employed by MATCH.
We also have applied the “Z-inc” option to derive SFH. Itconsists of limiting the number of free parameters in our fits byforcing the fit to only attempt solutions where the metallicityremains constant or increases with time. The history returningthe best fit to the CMD is then selected. This process is importantin some cases where the photometry depth or the number of starsis insufficient to reliably separate the effects of age from thoseof metallicity.
The initial columns in Table 2 summarize the results in termsof SFH, presenting the fraction of the SFH in the age intervalsfrom 0 to 1 Gyr, and from 1 to 3 Gyr, for all cases of SFHrecovery that were tested. It turns out, as expected, that allgalaxies but SCL-DE1 present a very small amount of theirSFH at ages <1 Gyr, and roughly 10% at 1–3 Gyr. The SFHsfor the different cases (with and without AGB stars, default orZ-inc) do agree well considering the typical error bars in this
No. 2, 2010 THE ACS NEARBY GALAXY SURVEY TREASURY. IX. 1035
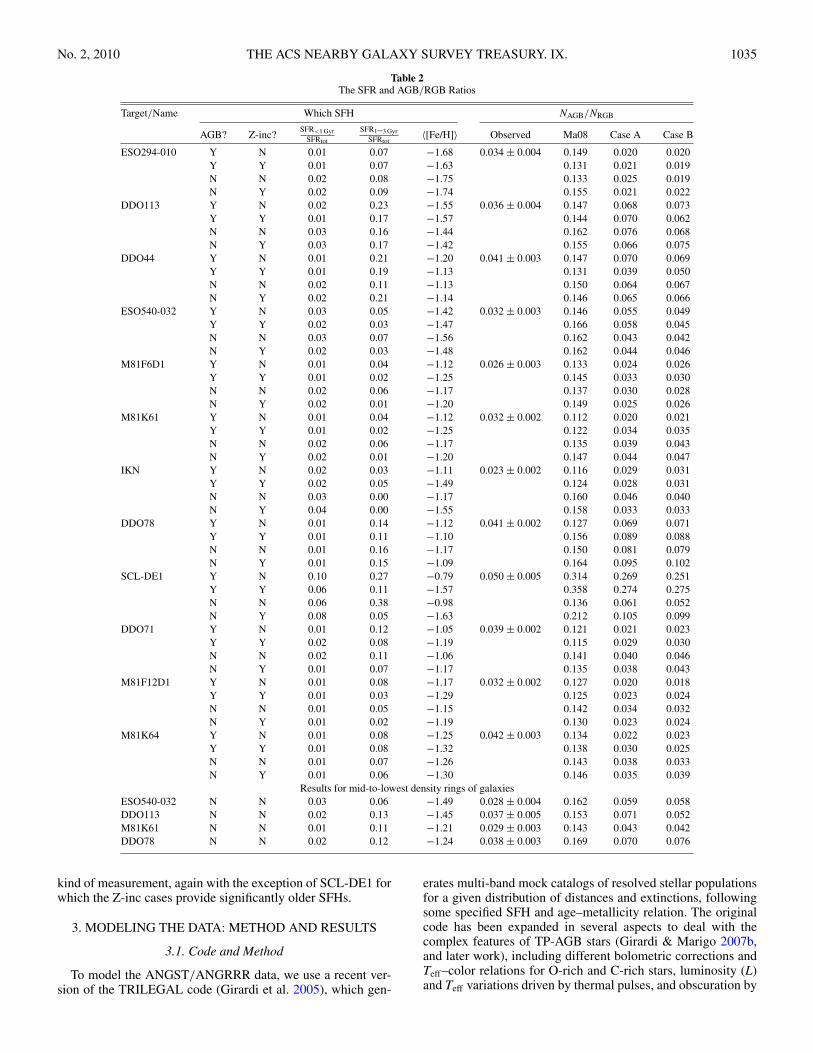
Table 2The SFR and AGB/RGB Ratios
Target/Name Which SFH NAGB/NRGB
AGB? Z-inc?SFR<1 Gyr
SFRtot
SFR1–3 GyrSFRtot
〈[Fe/H]〉 Observed Ma08 Case A Case B
ESO294-010 Y N 0.01 0.07 −1.68 0.034 ± 0.004 0.149 0.020 0.020Y Y 0.01 0.07 −1.63 0.131 0.021 0.019N N 0.02 0.08 −1.75 0.133 0.025 0.019N Y 0.02 0.09 −1.74 0.155 0.021 0.022
DDO113 Y N 0.02 0.23 −1.55 0.036 ± 0.004 0.147 0.068 0.073Y Y 0.01 0.17 −1.57 0.144 0.070 0.062N N 0.03 0.16 −1.44 0.162 0.076 0.068N Y 0.03 0.17 −1.42 0.155 0.066 0.075
DDO44 Y N 0.01 0.21 −1.20 0.041 ± 0.003 0.147 0.070 0.069Y Y 0.01 0.19 −1.13 0.131 0.039 0.050N N 0.02 0.11 −1.13 0.150 0.064 0.067N Y 0.02 0.21 −1.14 0.146 0.065 0.066
ESO540-032 Y N 0.03 0.05 −1.42 0.032 ± 0.003 0.146 0.055 0.049Y Y 0.02 0.03 −1.47 0.166 0.058 0.045N N 0.03 0.07 −1.56 0.162 0.043 0.042N Y 0.02 0.03 −1.48 0.162 0.044 0.046
M81F6D1 Y N 0.01 0.04 −1.12 0.026 ± 0.003 0.133 0.024 0.026Y Y 0.01 0.02 −1.25 0.145 0.033 0.030N N 0.02 0.06 −1.17 0.137 0.030 0.028N Y 0.02 0.01 −1.20 0.149 0.025 0.026
M81K61 Y N 0.01 0.04 −1.12 0.032 ± 0.002 0.112 0.020 0.021Y Y 0.01 0.02 −1.25 0.122 0.034 0.035N N 0.02 0.06 −1.17 0.135 0.039 0.043N Y 0.02 0.01 −1.20 0.147 0.044 0.047
IKN Y N 0.02 0.03 −1.11 0.023 ± 0.002 0.116 0.029 0.031Y Y 0.02 0.05 −1.49 0.124 0.028 0.031N N 0.03 0.00 −1.17 0.160 0.046 0.040N Y 0.04 0.00 −1.55 0.158 0.033 0.033
DDO78 Y N 0.01 0.14 −1.12 0.041 ± 0.002 0.127 0.069 0.071Y Y 0.01 0.11 −1.10 0.156 0.089 0.088N N 0.01 0.16 −1.17 0.150 0.081 0.079N Y 0.01 0.15 −1.09 0.164 0.095 0.102
SCL-DE1 Y N 0.10 0.27 −0.79 0.050 ± 0.005 0.314 0.269 0.251Y Y 0.06 0.11 −1.57 0.358 0.274 0.275N N 0.06 0.38 −0.98 0.136 0.061 0.052N Y 0.08 0.05 −1.63 0.212 0.105 0.099
DDO71 Y N 0.01 0.12 −1.05 0.039 ± 0.002 0.121 0.021 0.023Y Y 0.02 0.08 −1.19 0.115 0.029 0.030N N 0.02 0.11 −1.06 0.141 0.040 0.046N Y 0.01 0.07 −1.17 0.135 0.038 0.043
M81F12D1 Y N 0.01 0.08 −1.17 0.032 ± 0.002 0.127 0.020 0.018Y Y 0.01 0.03 −1.29 0.125 0.023 0.024N N 0.01 0.05 −1.15 0.142 0.034 0.032N Y 0.01 0.02 −1.19 0.130 0.023 0.024
M81K64 Y N 0.01 0.08 −1.25 0.042 ± 0.003 0.134 0.022 0.023Y Y 0.01 0.08 −1.32 0.138 0.030 0.025N N 0.01 0.07 −1.26 0.143 0.038 0.033N Y 0.01 0.06 −1.30 0.146 0.035 0.039
Results for mid-to-lowest density rings of galaxiesESO540-032 N N 0.03 0.06 −1.49 0.028 ± 0.004 0.162 0.059 0.058DDO113 N N 0.02 0.13 −1.45 0.037 ± 0.005 0.153 0.071 0.052M81K61 N N 0.01 0.11 −1.21 0.029 ± 0.003 0.143 0.043 0.042DDO78 N N 0.02 0.12 −1.24 0.038 ± 0.003 0.169 0.070 0.076
kind of measurement, again with the exception of SCL-DE1 forwhich the Z-inc cases provide significantly older SFHs.
3. MODELING THE DATA: METHOD AND RESULTS
3.1. Code and Method
To model the ANGST/ANGRRR data, we use a recent ver-sion of the TRILEGAL code (Girardi et al. 2005), which gen-
erates multi-band mock catalogs of resolved stellar populationsfor a given distribution of distances and extinctions, followingsome specified SFH and age–metallicity relation. The originalcode has been expanded in several aspects to deal with thecomplex features of TP-AGB stars (Girardi & Marigo 2007b,and later work), including different bolometric corrections andTeff–color relations for O-rich and C-rich stars, luminosity (L)and Teff variations driven by thermal pulses, and obscuration by
1036 GIRARDI ET AL. Vol. 724
circumstellar dust. In order to take these effects onto account,the code keeps track of a series of stellar parameters, such asthe surface chemical composition, mass loss, and the period andmode of the long-period variability. The dust composition hasbeen assumed to be 60% silicate plus 40% AlOx for O-richstars, and 85% amorphous carbon plus 15% SiC for C-rich starsfrom Groenewegen (2006).
The stellar evolutionary tracks are the same ones containedin the Marigo et al. (2008) isochrones and used by MATCH toderive the SFH of our galaxy sample. The transformations fromL and Teff to the HST photometry are described in Girardi et al.(2008); however, we have updated it to use the latest transfor-mations for C-type stars from Aringer et al. (2009), and the totalACS/WFC throughput curves and zero points appropriate forpost-July 2006 observations (Mack et al. 2007; Bohlin 2007).14
Alternative sets of TP-AGB tracks have been specificallycalculated for this work, as described below in Section 3.4.TRILEGAL allows these tracks to be replaced quickly and withminimal human effort.
We first start modeling the data for the complete sample ofgalaxies in Table 1, using the same stellar models which werealready used to derive the SFH, but using TRILEGAL instead ofMATCH. TRILEGAL simulates the photometry starting fromthe SFH file and shifts the data to the right distance modulusand extinction. The simulations include stars up to 2 mag fainterthan the faintest observed one.
In order to properly account for the real completeness andphotometric errors in our simulations, we proceed as follows.For each simulated star, an artificial star of similar color andmagnitude is randomly extracted from the existing catalog ofartificial stars from HSTPHOT/DOLPHOT. If that artificial starhas been detected by the photometry software, the differencesbetween the input colors and magnitudes and the output onesare applied to the simulated star; otherwise, the same object isthrown away.
3.2. Results Using MG07 TP-AGB Tracks
Results from this exercise are shown in Figure 2. Note thatthe simulations are forced to have a number of bright RGBstars (within 2 mag of the TRGB) consistent with the observedone within 1σ . One can note that these simulations resemblevery much the observations, except for the TP-AGB regime, forwhich there is a clear excess of simulated stars, by factors thatcan be as large as 6 or 7. The numerical results are tabulated inTable 2. It is also evident that the simulated AGB stars reachmuch brighter magnitudes than the observed ones. The excess ofAGB stars is probably related to what has been already detectedby Gullieuszik et al. (2008), Held et al. (2010), and Melbourneet al. (2010).
We have checked that these results depend little on the useof AGB stars by MATCH. Indeed, as shown in Table 2, theSFH derived when one hides the AGB stars in MATCH are verysimilar to those in which they are included and do not producegreat changes in the predicted AGB/RGB ratios. Moreover, thecomparison with models in which the metallicity is forced to notdecrease with the galaxy age (the Z-inc option in MATCH) alsoproduces similar results. We can only conclude that the problemresides in the AGB stellar models, and not in the observedsamples or process of SFH recovery.
The observed galaxies always present, overall, a small frac-tion of intermediate-age stars (Table 2), or some moderately
14 http://www.stsci.edu/hst/acs/analysis/zeropoints
high metallicities, so that one might think that the results donot actually correspond to old metal-poor populations as it wasintended to be. We know however that in dwarf galaxies theyoungest (and more metal-rich) star formation is, as a rule, con-centrated in the galaxy centers (e.g., Weisz et al. 2008; Stinsonet al. 2009, and references therein; also K. M. Gilbert et al.2011, in preparation). Therefore, for a subsample of our dwarfgalaxies, we have selected the external rings for which the SFHis expected to be older than for the overall galaxy. The resultsare amended at the end of Table 2, for the no-AGB no-Z-incoption only. Although these outer regions are indeed slightlyolder than the entire galaxies, they show essentially identicalNAGB/NRGB ratios as the inner regions, suggesting that old pop-ulations dominate the CMDs at all radii. Therefore, the basicresult for the excess of predicted AGB stars, by a factor of about4, still remains in these data.
3.3. What is the Problem with Current TP-AGB Models?
The above-mentioned results were obtained with the use ofMG07 TP-AGB evolutionary tracks, which constitute a quitenon-standard grid of such models. They have considered, for thefirst time, features such as the changes in molecular opacitiesand mass-loss rates as the surface composition of TP-AGB starspasses from O- to C-rich, and the increase in the mass-loss ratesas the long-period pulsation switches from the first overtone tothe fundamental mode. Added to these improved prescriptions,there were attempts to calibrate the poorly known parameters ofthe models via the fitting of observational data. To be explicitlyconsidered in the fitting were (1) the lifetimes of AGB stars as afunction of stellar mass as derived from star counts in MagellanicCloud clusters and (2) the C-star luminosity functions in bothClouds. After this calibration, other quantities were checked, asfor instance the integrated colors of Magellanic Cloud clusters,and the initial–final mass relation derived from white dwarfsin the solar neighborhood. All these comparisons revealed anoverall improvement in fits to data, even if there remained someproblems, like for instance the integrated V−K and J−K colorsbeing apparently too red as compared to the cluster data in theage interval from 108 to 4×10⁸ yr (see the Appendix in Marigoet al. 2008).
One can separate the prescriptions used to build MG07models into two broad groups: those which depend on thecomposition of stellar atmospheres—and especially on the C/Oratio—and those which do not. The first set of prescriptions isprobably of secondary relevance for the present work, since weare dealing with stars in metal-poor and old stellar systems,most of which do not suffer convective dredge-up on theTP-AGB and hence are expected to be predominantly O-rich (ofspectral types K and M). For the stars we are considering here,the TP-AGB lifetime and termination luminosity are cruciallydetermined by the process of mass loss.
For O-rich stars, MG07 adopted a mass-loss prescriptionheavily based on Bowen & Willson (1991) dynamical modelatmospheres for fundamental-mode pulsators, and with a de-pendence on metallicity as derived from Willson (2000). Theinitial period of TP-AGB mass loss as first-overtone pulsatorswas based on a set of relations derived from very few ex-ploratory models by Bowen (1988). The procedure howeverwas not straightforward, involving a large number of assump-tions and fitting relations, caused by the different assump-tions and ranges of parameters (e.g., the different underlyingradius–luminosity–mass relation) between the original modelsfrom Bowen and Willson, and the synthetic TP-AGB models.
No. 2, 2010 THE ACS NEARBY GALAXY SURVEY TREASURY. IX. 1037
A detailed review of the literature, together with the results ofFigure 2, suggests a complete revision of this scheme, as wenow describe.
3.4. New TP-AGB Tracks
Our main problem is to reduce the lifetimes of TP-AGB trackswhich, due to their low mass and metallicity, present relativelylow luminosities and hot temperatures. Under such conditions,the classical dust-driven winds typically found in more luminousand cool AGB stars might be less efficient. In any case, we needto introduce some description for the “pre-dusty” winds (withrates Mpre-dust), i.e., before radiation pressure on dust grainsbecomes the main driving agent of mass loss (Elitzur & Ivezic2001). Among the few such formulae which have been proposedin the literature, we decided to test the semi-empirical one bySchroder & Cuntz (2005)
Mpre-dust = ηLR
M
(Teff
4000 K
)3.5 (1 +
g�4300 g
)[M� yr−1],
(1)
where R, M, and L are the stellar radius, mass, and luminosityexpressed in solar units and g and g� indicate the stellar andsolar surface gravity, respectively. This formula is a kind ofReimers (1975) law and was originally derived to describe themass loss suffered by red giants under the assumption that thestellar wind originates from magneto-acoustic waves operatingbelow the stellar chromosphere. The fitting parameter η is setto 0.8 × 10⁻¹³, a value calibrated by Schroder & Cuntz (2005)to reproduce the morphology of horizontal branches in globularclusters.
The Schroder & Cuntz (2005) relation is employed from thebeginning of the TP-AGB phase until a critical stage is met, i.e.,the attainment of the minimum mass-loss rate, Mmin
dust, requiredfor the development of a dust-driven wind. At each time stepMmin
dust is evaluated numerically following the analysis by Gail &Sedlmayr (1987), from the condition
α = Lκ
4πcGM= 1 , (2)
which expresses the balance between the outward force causedby radiation pressure on dust and the inward gravitational pullof the star. Here c is the light speed, G is the gravitationalconstant, and κ is the flux-averaged mass extinction coefficientof the gas–dust mixture. Following Ferrarotti & Gail (2006), itis reasonable to assume that in the dust-driven outflow
κ = κgas +∑
i
fiκdust,i , (3)
where the opacity contributions from the gas, κgas, and dustspecies, κdust,i , are expressed as Rosseland means, while firepresents the condensation degree of the ith dust species underconsideration.
In our calculations, we consider different dust types depend-ing on the star chemical type: silicates (pyroxene, olivine, andquartz) and iron in the case of M-stars (C/O < 1), iron in thecase of S-stars (C/O ∼1), and carbon, silicon carbide, and ironin the case of C-stars (C/O > 1). The dust opacities are evalu-ated through the relations provided by Gail & Sedlmayr (1999)and Ferrarotti & Gail (2001, 2002), and the corresponding con-densation degrees are estimated with the analytic fits proposedby Ferrarotti (2003).
These latter depend on the current M , so that the minimummass-loss rate of a dust-driven wind, Mmin
dust, is found iterativelythrough Equation (2).
As soon as Mpre-dust � Mmindust, the star enters the dust-driven
wind regime, which is treated according to two formalisms:
1. Case A: based on Bowen & Willson (1991), but relaxingthe metallicity dependence suggested by Willson (2000);and
2. Case B: based on Bedijn (1988), but with a somewhatdifferent calibration of the parameters.
Case A for dust-driven winds is the same as in MG07,but for the correction factor describing the explicit metallicitydependence, which is left out in the new TP-AGB models.Nonetheless, an intrinsic metallicity effect still remains in thecomputed mass-loss rates, via the stellar surface parameters Rand Teff . In fact at lower metallicities the atmospheres of AGBstars tend to be hotter and more compact. In practice, case A ismeant to explore the hypothesis that the dust-driven winds maydepend only mildly on the initial metal content.
Case B closely resembles the approach developed by Bedijn(1988), to which the reader is referred for all details. Briefly,assuming that the wind mechanism is the combined effect oftwo processes, i.e., radial pulsation and radiation pressure onthe dust grains in the outermost atmospheric layers, Bedijn(1988) derived a formalism for the mass-loss rate as a functionof basic stellar parameters, M, R, Teff , and the photosphericdensity ρph. Similarly to Bedijn (1988, see his Figure 1 andAppendix B) the free parameters have been calibrated on asample of Galactic long-period variables with known mass-loss rate, pulsation period, stellar mass, radius, and effectivetemperature. More details about the fit procedure will be givenelsewhere (P. Marigo et al. 2011, in preparation).
It should be noted that, in our calculations, R, Teff , and ρphare derived from numerical integrations of complete envelopemodels extending from the photosphere down to the degenerateC–O core (see Marigo et al. 1999 for details). A key prerogativeof our TP-AGB code is that at each time step, low-temperatureopacities are computed, for the first time, on-the-fly with theÆSOPUS tool (Marigo & Aringer 2009), thus assuring a fullconsistency with the surface chemical composition. In this way,we avoid the loss in accuracy that otherwise must be paidwhen interpolating on pre-computed opacity tables (the standardapproach in stellar evolution models). This is important sincelow-temperature opacities are crucial in determining the positionof a giant in the Hertszprung–Russell diagram. The opacities ofcarbon-rich stars (C/O > 1), for instance, may be significantlyhigher, on average, than in oxygen-rich stars (C/O < 1), so thatthe atmospheres of carbon-rich stars are usually less dense (andmore extended) than those of oxygen-rich stars (Marigo 2002).
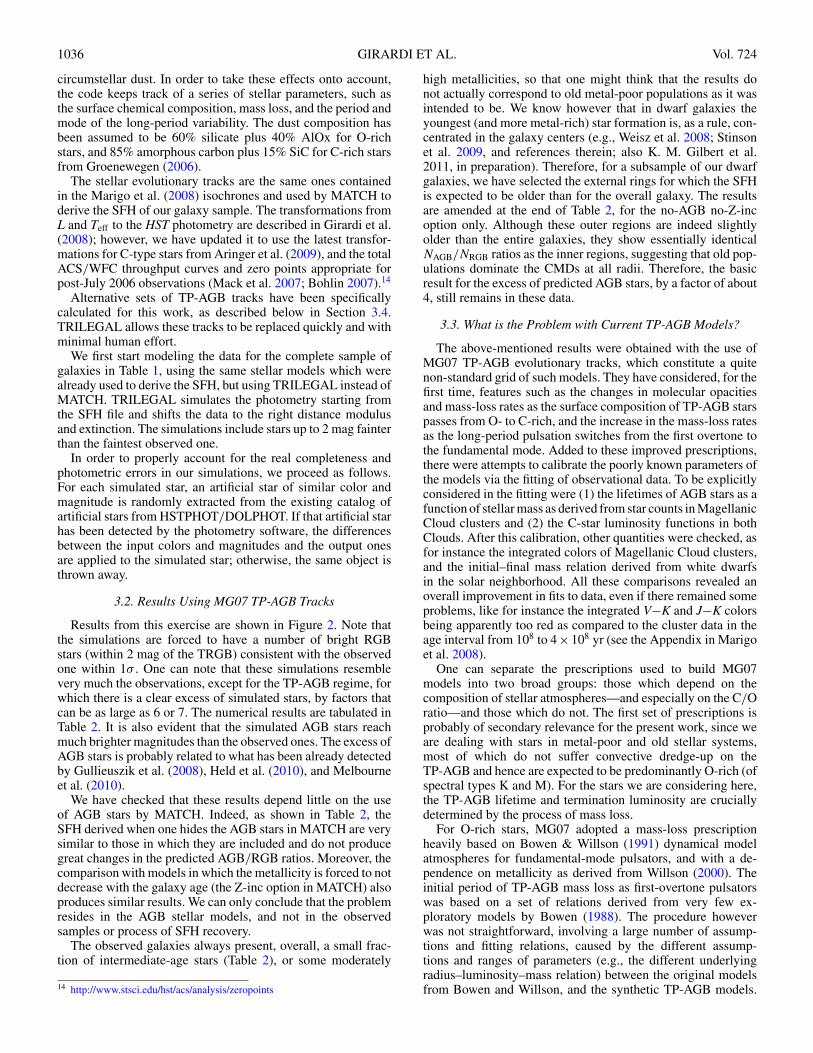
Figure 3 compares the MG07 results with the new ones,in terms of the (1) duration of the TP-AGB phase and (2)initial–final mass relation. It is evident that the significantreduction (by a typical factor of 3–4) of the TP-AGB lifetimesfor initial masses Minitial � 0.9 M�, as a consequence of the newprescriptions for the mass-loss rates. The shortening of theTP-AGB lifetimes derives from two concurring factors, i.e.:the non-negligible mass-loss rates already prior the onset of thedust-driven wind, and the higher efficiency during the dustyregime compared to MG07.
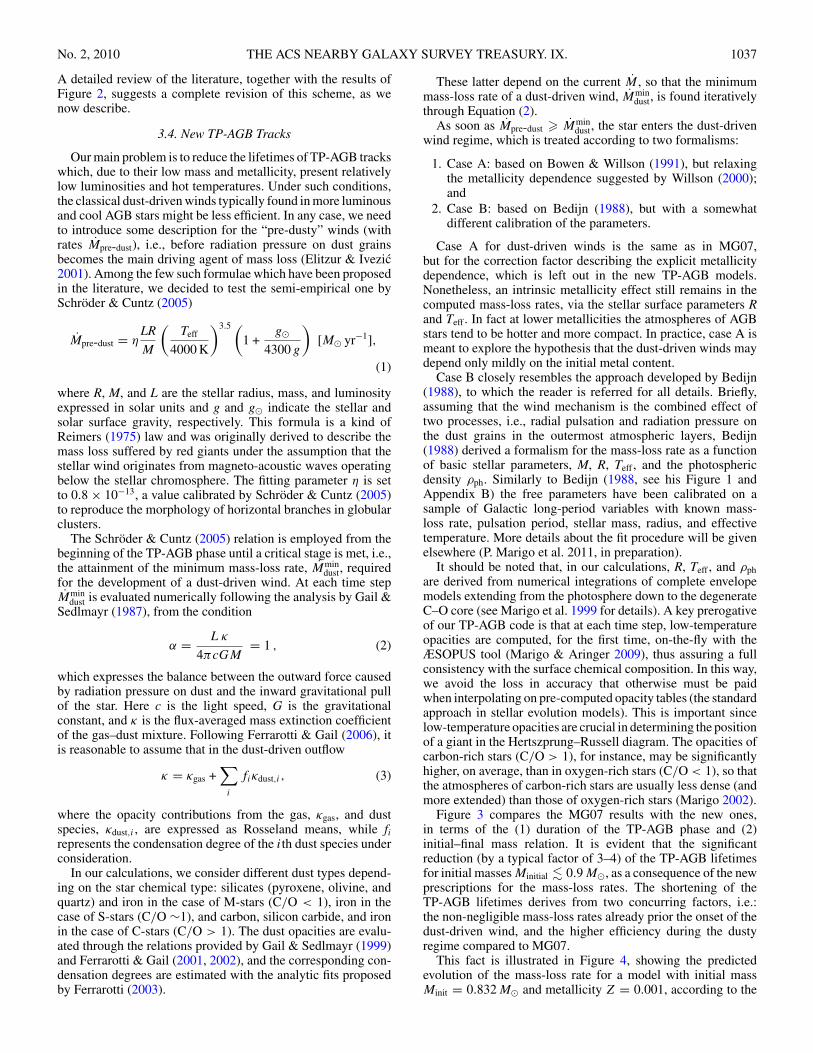
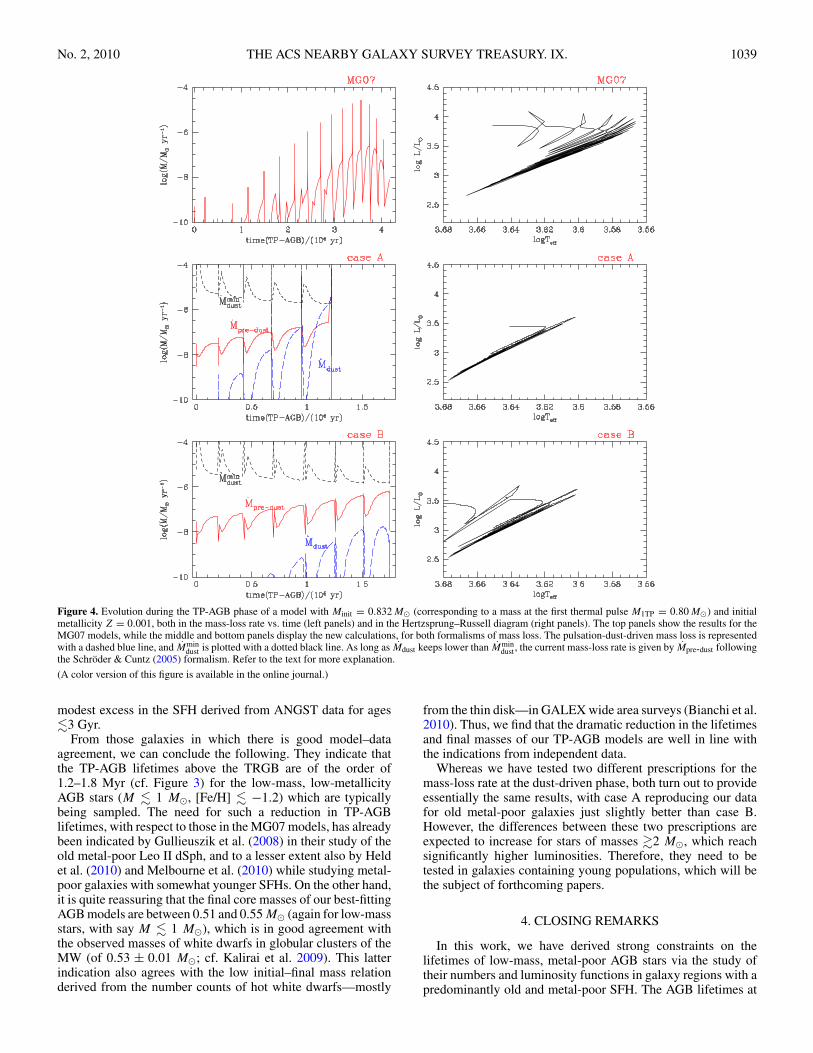
This fact is illustrated in Figure 4, showing the predictedevolution of the mass-loss rate for a model with initial massMinit = 0.832 M� and metallicity Z = 0.001, according to the

1038 GIRARDI ET AL. Vol. 724
Figure 3. Comparison of AGB models with initial metallicity Z = 0.001 andfor three different mass-loss prescriptions, as described in the text. Top panel:TP-AGB lifetimes as a function of the initial stellar mass. Bottom panel: finalcore masses left after the ejection of the envelope as a function of the initialstellar mass. The hatched rectangle shows the initial-final mass relation for theGalactic globular cluster M4, according to the recent white dwarf measurementsby Kalirai et al. (2009).
(A color version of this figure is available in the online journal.)
three different choices of mass-loss formalisms discussed here.The evolutionary time is counted since the first thermal pulseup to the ejection of almost the entire envelope (calculationsare stopped as soon as the envelope mass falls below 0.01 M�).One critical feature common to cases A and B is that despitethe low metallicity, the mass-loss rate Mpre-dust predicted by theSchroder & Cuntz (2005) relation is already efficient, quicklyincreasing from ≈10−8 to ≈5 × 10⁻⁷ M� yr−1 in a few thermalpulses. These rates are high enough to determine the ejectionof the entire stellar mantle even before the development of thedust-driven wind (case B; bottom panel), or to favor its earlieronset (case A; middle panel). In general, the use of mass-lossprescription A leads to somewhat shorter TP-AGB lifetimesthan case B.
Consequently, compared to MG07, the models with thenew mass-loss descriptions predict a sizable reduction of thefinal masses, that are now mostly comprised in the interval0.51 � (Mfinal/M�) � 0.55 for 0.70 � (Minitial/M�) � 0.90(bottom panel of Figure 3). The most important result is that withno attempt to tune the mass loss, the new TP-AGB models areable to naturally recover the empirical initial–final mass relationof population II stars (bottom panel of Figure 3) as derived byKalirai et al. (2009) from the first direct mass measurements ofindividual white dwarfs in the Galactic globular cluster M4.We have also verified that all metallicity sets in the range0.0001 � Z � 0.001 intersect the empirical data.
At larger initial masses, 0.9 � Minitial/M� � 1.5, instead,there is a general agreement between the three sets of models,which are all predicted to make the transition to the C-richdomain (C/O > 1), given the higher efficiency of the thirddredge-up at the low metallicities here considered. In this case,the short TP-AGB lifetimes are controlled by the higher mass-loss rates for C-stars (following the reduction of Teff as soonas C/O exceeds unity), while the flattening of the initial–final
mass relation is mainly shaped by the deep dredge-up events.Interestingly, the three mass-loss prescriptions adopted hereconverge to similar results.
A general finding is that low-mass, low-metallicity models(Minitial � 1.0 M�) would remain O-rich for all their TP-AGBevolution, experiencing non-negligible mass loss already beforereaching the conditions to activate a dust-driven wind (notexcluding that some passive dust could actually be present),so that the mass-loss mechanism on the TP-AGB should beascribed to a different (unknown) driver, e.g., magneto-acousticwaves within the chromosphere (as discussed in Schroder &Cuntz 2005). In contrast, models with larger stellar masses,at roughly M � 1.0 M�, would quickly become C-rich as aconsequence of the third dredge-up; under these conditions,the long-period pulsation and dust condensation would becomeefficient enough to trigger a radiative wind, with consequentstrong enhancement of the mass loss and quick termination ofthe AGB phase. This prediction is in agreement with the resultsof detailed models of dust formation (Ferrarotti & Gail 2006).
Finally, we remark that we apply the above-described mass-loss formulae solely during the TP-AGB. We recognize thatit would be important to explore the effect they also havefor the RGB and early-AGB phases, but this is difficult inpractice. It would require the calculation of more extendedgrids of evolutionary tracks, properly evaluating the massloss during the evolution on the early-AGB, and includingadditional sets of horizontal branch models of smaller massesthan presently available. This is very time consuming. Moreover,the evolutionary effects expected would be much smaller thanthose described above.
3.5. Results with the New TP-AGB Tracks
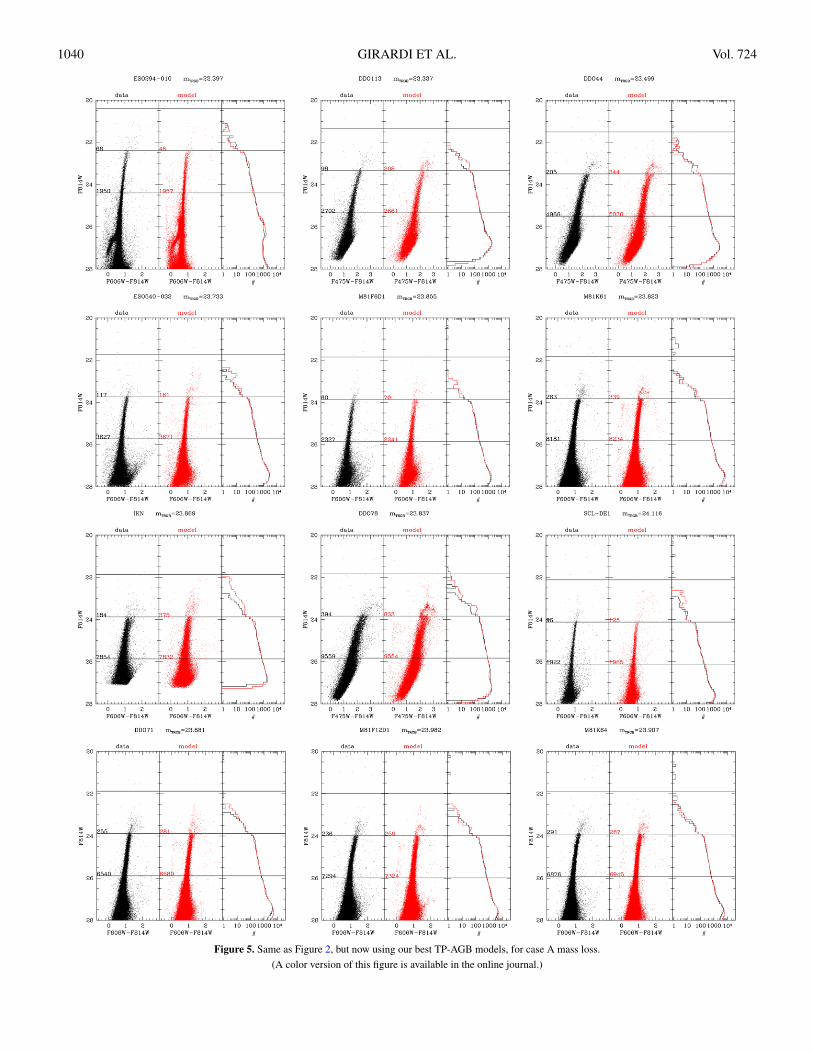
Figures 5 and 6 show the final result of using the new TP-AGBtracks in the simulation of ANGST galaxies, for cases A and B,respectively. It is evident that the reduction of TP-AGB lifetimes,and consequently of the TP-AGB termination luminosity, leadsto a much better description of the data in both cases. Forsome galaxies such as ESO294-010, M81F6D1 and M81K64,the model-data agreement can be qualified as excellent, withsimulated AGB numbers within the 67% confidence level ofPoisson fluctuations in the data, and a good description of theluminosity function for AGB stars.
In a few other cases, however, the agreement is still notcompletely satisfactory, and the models tend to overestimate theAGB numbers by factors of up to 2, as for DDO113, DDO44,IKN, and DDO78. Note that in all these cases the observedAGB/RGB ratio is very small and close to its minimum value,which suggests that these galaxies are really dominated by veryold populations. Therefore, we consider that the mismatch inthe AGB/RGB ratios from the models might be attributable tothe errors in the SFHs and metallicities of these galaxies, addedof course to the residual mismatches in the stellar models ofhigher mass, and in the prescription for dust obscuration.
Finally, for the galaxies ESO0540-032, M81K61, SCL-DE1,DDO71, and M81F12D1, there is in general just a modest excess(smaller than ∼50%) in the predicted numbers of AGB stars. Itis remarkable that this excess is generally more evident for thebright section of the AGB sequence, whereas close to the TRGBthe numbers of predicted and observed AGB stars are in quitegood agreement. We interpret the mismatch for bright AGB starsas being likely attributable to the younger population in thesegalaxies—with the causes being either in a slight overestimationof the lifetimes of the more massive TP-AGB models or in a
No. 2, 2010 THE ACS NEARBY GALAXY SURVEY TREASURY. IX. 1039
Figure 4. Evolution during the TP-AGB phase of a model with Minit = 0.832 M� (corresponding to a mass at the first thermal pulse M1TP = 0.80 M�) and initialmetallicity Z = 0.001, both in the mass-loss rate vs. time (left panels) and in the Hertzsprung–Russell diagram (right panels). The top panels show the results for theMG07 models, while the middle and bottom panels display the new calculations, for both formalisms of mass loss. The pulsation-dust-driven mass loss is representedwith a dashed blue line, and Mmin
dust is plotted with a dotted black line. As long as Mdust keeps lower than Mmindust, the current mass-loss rate is given by Mpre-dust following
the Schroder & Cuntz (2005) formalism. Refer to the text for more explanation.
(A color version of this figure is available in the online journal.)
modest excess in the SFH derived from ANGST data for ages�3 Gyr.
From those galaxies in which there is good model–dataagreement, we can conclude the following. They indicate thatthe TP-AGB lifetimes above the TRGB are of the order of1.2–1.8 Myr (cf. Figure 3) for the low-mass, low-metallicityAGB stars (M � 1 M�, [Fe/H] � −1.2) which are typicallybeing sampled. The need for such a reduction in TP-AGBlifetimes, with respect to those in the MG07 models, has alreadybeen indicated by Gullieuszik et al. (2008) in their study of theold metal-poor Leo II dSph, and to a lesser extent also by Heldet al. (2010) and Melbourne et al. (2010) while studying metal-poor galaxies with somewhat younger SFHs. On the other hand,it is quite reassuring that the final core masses of our best-fittingAGB models are between 0.51 and 0.55 M� (again for low-massstars, with say M � 1 M�), which is in good agreement withthe observed masses of white dwarfs in globular clusters of theMW (of 0.53 ± 0.01 M�; cf. Kalirai et al. 2009). This latterindication also agrees with the low initial–final mass relationderived from the number counts of hot white dwarfs—mostly
from the thin disk—in GALEX wide area surveys (Bianchi et al.2010). Thus, we find that the dramatic reduction in the lifetimesand final masses of our TP-AGB models are well in line withthe indications from independent data.
Whereas we have tested two different prescriptions for themass-loss rate at the dust-driven phase, both turn out to provideessentially the same results, with case A reproducing our datafor old metal-poor galaxies just slightly better than case B.However, the differences between these two prescriptions areexpected to increase for stars of masses �2 M�, which reachsignificantly higher luminosities. Therefore, they need to betested in galaxies containing young populations, which will bethe subject of forthcoming papers.
4. CLOSING REMARKS
In this work, we have derived strong constraints on thelifetimes of low-mass, metal-poor AGB stars via the study oftheir numbers and luminosity functions in galaxy regions with apredominantly old and metal-poor SFH. The AGB lifetimes at
1040 GIRARDI ET AL. Vol. 724
Figure 5. Same as Figure 2, but now using our best TP-AGB models, for case A mass loss.
(A color version of this figure is available in the online journal.)
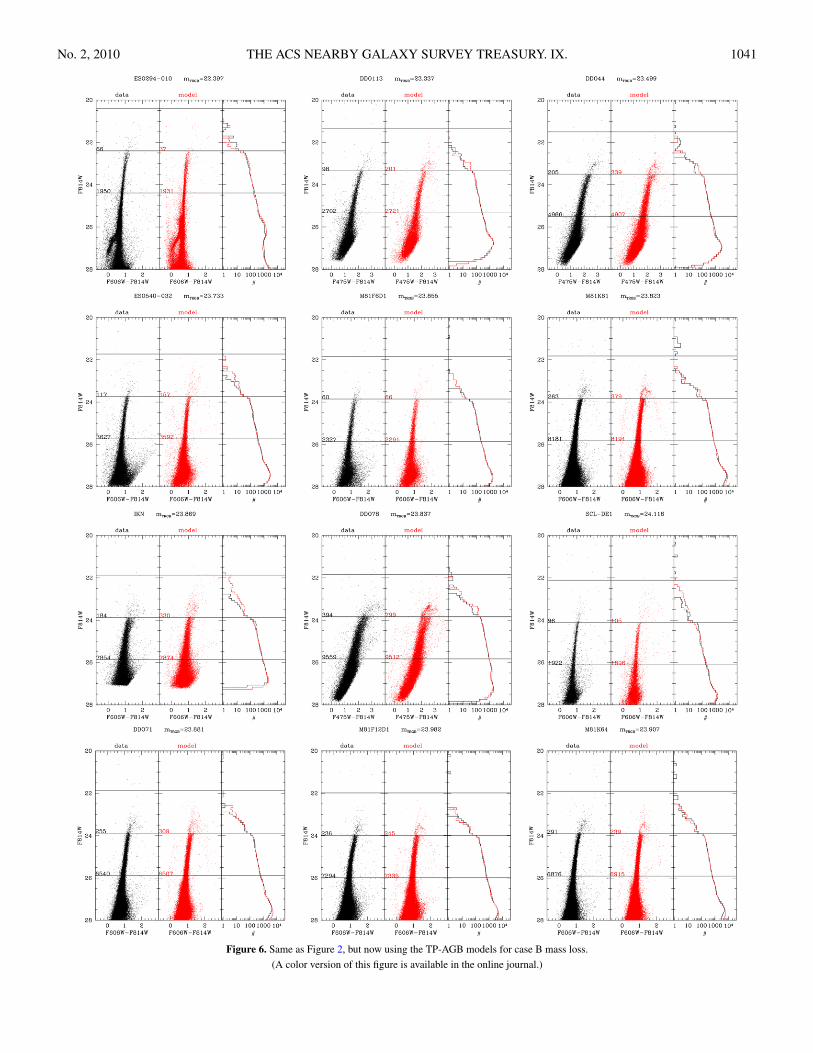
No. 2, 2010 THE ACS NEARBY GALAXY SURVEY TREASURY. IX. 1041
Figure 6. Same as Figure 2, but now using the TP-AGB models for case B mass loss.
(A color version of this figure is available in the online journal.)
1042 GIRARDI ET AL. Vol. 724
magnitudes brighter than the TRGB turn out to be between 1.2and 1.8 Myr for stellar masses of M � 1 M�, at metallicities[Fe/H] � −1.2. Indeed, TP-AGB evolutionary tracks with theselifetimes are able to reproduce quite well the low AGB/RGBnumber ratios in a subsample of these galaxies, as well as theirluminosity functions. In some other cases, the agreement is stillnot perfect, but the new models perform significantly betterthan the previous MG07 ones. Although we have tested justtwo possible alternative prescriptions for mass loss, they bothproduce a quite similar reduction in the AGB lifetimes, as wellas similar final masses for the resulting white dwarfs.
Whereas the constraints we derive may apply to quite a limitedrange of stellar masses and metallicities, they also represent animportant step toward a robust calibration of the lifetimes ofTP-AGB stars at all masses and metallicities. Indeed, with thissingle point in mass–metallicity space we can discard some ofthe already proposed formulae for the mass loss on the AGB,for instance the Bowen & Willson (1991) and Willson (2000)ones as implemented in MG07. Moreover, we can use this resultas a reference point to start a more thorough calibration of theAGB lifetimes at regimes of increasing masses and metallicities,making use of additional galaxies with the presence of youngerSFH and more metal-rich giant branches. Such an extension ofthe AGB calibration, however, cannot proceed via the analysisof optical data only, as performed in this paper. It requires atleast the use of near-infrared photometry in order to samplethe most massive and evolved AGB stars, as well as those ofhigher metallicities. Indeed, we are presently collecting near-infrared data with the new HST/WFC3 camera (IR channel), forsome dozens of ANGST galaxies with a well-measured SFH.Forthcoming papers will discuss the problem of improving AGBmodels in the light of these new data.
The present TP-AGB tracks surely represent an improvementin our sets of isochrones and tools to simulate stellar populations.For this reason they are being included as an alternative to theMG07 models, in the CMD15 and TRILEGAL16 Web interfaces,which provide isochrones and simulated photometry of resolvedstellar populations in a wide variety of filter systems.
L.G. and P.M. acknowledge financial support from contractASI-INAF I/016/07/0 and INAF/PRIN07 CRA 1.06.10.03.B.F.W., J.J.D., P.R., and D.R.W. acknowledge financial supportfrom HST GO-10915. K.M.G. acknowledges support from HSTGO-10945. P.R. acknowledges the Achievement Rewards forCollege Scientists (ARCS) Fellowship. J.J.D. and P.R. werepartially supported by AR-10945, GO-11718, and GO-11307.
This work is based on observations made with the NASA/ESA Hubble Space Telescope, obtained from the data archiveat the Space Telescope Science Institute. Support for this workwas provided by NASA through grant Nos. GO-10915 and GO-10945 from the Space Telescope Science Institute, which isoperated by AURA, Inc., under NASA contract NAS 5-26555.This research has made use of the NASA/IPAC Infrared ScienceArchive and the NASA/IPAC Extragalactic Database (NED),which are both operated by the Jet Propulsion Laboratory,California Institute of Technology, under contract with theNational Aeronautics and Space Administration. This researchhas made extensive use of NASA’s Astrophysics Data SystemBibliographic Services.
Facilities: HST (ACS, WFPC2)
15 http://stev.oapd.inaf.it/cmd16 http://stev.oapd.inaf.it/trilegal
REFERENCES
Aringer, B., Girardi, L., Nowotny, W., Marigo, P., & Lederer, M. T. 2009, A&A,503, 913
Bedijn, P. J. 1988, A&A, 205, 105Bianchi, L., et al. 2010, MNRAS, submittedBlum, R. D., et al. 2006, AJ, 132, 2034Bohlin, R. C. 2007, Photometric Calibration of the ACS CCD Cameras, Science
Report ACS 2007-06 (Baltimore, MD: STScI), http://www.stsci.edu/hst/acs/documents/isrs/isr0706.pdf
Bolatto, A. D., et al. 2007, ApJ, 655, 212Bowen, G. H. 1988, ApJ, 329, 299Bowen, G. H., & Willson, L. A. 1991, ApJ, 375, L53Boyer, M. L., Skillman, E. D., van Loon, J. T., Gehrz, R. D., & Woodward, C. E.
2009a, ApJ, 697, 1993Boyer, M. L., et al. 2009b, ApJ, 705, 746Boyer, M. L., et al. 2010, ApJ, 711, L99Castelli, F., & Kurucz, R. L. 2003, in IAU Symp. 210, Modelling of Stellar
Atmospheres, ed. N. Piskunov, W. W. Weiss, & D. F. Gray (Cambridge:Cambridge Univ. Press), 20
Cioni, M., & Habing, H. J. 2003, A&A, 402, 133Cioni, M., et al. 2000, A&AS, 144, 235Conroy, C., & Gunn, J. E. 2010, ApJ, 712, 833Conroy, C., Gunn, J. E., & White, M. 2009, ApJ, 699, 486Cordier, D., Pietrinferni, A., Cassisi, S., & Salaris, M. 2007, AJ, 133, 468Dalcanton, J. J., et al. 2009, ApJS, 183, 67Dolphin, A. E. 2000, PASP, 112, 1383Dolphin, A. E. 2002, MNRAS, 332, 91Elitzur, M., & Ivezic, Z. 2001, MNRAS, 327, 403Eminian, C., Kauffmann, G., Charlot, S., Wild, V., Bruzual, G., Rettura, A., &
Loveday, J. 2008, MNRAS, 384, 930Ferrarotti, A. S. 2003, PhD thesis, Naturwissenschaftlich-Mathematische
Gesamtfakultat der Universitat HeidelbergFerrarotti, A. S., & Gail, H. 2001, A&A, 371, 133Ferrarotti, A. S., & Gail, H. 2002, A&A, 382, 256Ferrarotti, A. S., & Gail, H. 2006, A&A, 447, 553Fluks, M. A., Plez, B., The, P. S., de Winter, D., Westerlund, B. E., & Steenman,
H. C. 1994, A&AS, 105, 311Frogel, J. A., & Elias, J. H. 1988, ApJ, 324, 823Frogel, J. A., Mould, J., & Blanco, V. M. 1990, ApJ, 352, 96Frogel, J. A., & Whitelock, P. A. 1998, AJ, 116, 754Gail, H., & Sedlmayr, E. 1987, A&A, 177, 186Gail, H., & Sedlmayr, E. 1999, A&A, 347, 594Gallart, C., Zoccali, M., & Aparicio, A. 2005, ARA&A, 43, 387Girardi, L., Bertelli, G., Bressan, A., Chiosi, C., Groenewegen, M. A. T., Marigo,
P., Salasnich, B., & Weiss, A. 2002, A&A, 391, 195Girardi, L., Groenewegen, M. A. T., Hatziminaoglou, E., & da Costa, L.
2005, A&A, 436, 895Girardi, L., & Marigo, P. 2007a, A&A, 462, 237Girardi, L., & Marigo, P. 2007b, in ASP Conf. Ser. 378, Why Galaxies
Care About AGB Stars: Their Importance as Actors and Probes, ed. F.Kerschbaum, C. Charbonnel, & R. F. Wing (San Francisco, CA: ASP), 20
Girardi, L., et al. 2008, PASP, 120, 583Groenewegen, M. A. T. 2006, A&A, 448, 181Groenewegen, M. A. T., Sloan, G. C., Soszynski, I., & Petersen, E. A.
2009, A&A, 506, 1277Gullieuszik, M., Held, E. V., Rizzi, L., Girardi, L., Marigo, P., & Momany, Y.
2008, MNRAS, 388, 1185Held, E. V., Gullieuszik, M., Rizzi, L., Girardi, L., Marigo, P., & Saviane, I.
2010, MNRAS, 404, 1475Jackson, D. C., Skillman, E. D., Gehrz, R. D., Polomski, E., & Woodward, C. E.
2007a, ApJ, 656, 818Jackson, D. C., Skillman, E. D., Gehrz, R. D., Polomski, E., & Woodward, C. E.
2007b, ApJ, 667, 891Kalirai, J. S., Saul Davis, D., Richer, H. B., Bergeron, P., Catelan, M., Hansen,
B. M. S., & Rich, R. M. 2009, ApJ, 705, 408Kamath, D., Wood, P. R., Soszynski, I., & Lebzelter, T. 2010, MNRAS, 1190Lagadec, E., Zijlstra, A. A., Matsuura, M., Menzies, J. W., van Loon, J. T., &
Whitelock, P. A. 2008, MNRAS, 383, 399Lebzelter, T., Lederer, M. T., Cristallo, S., Hinkle, K. H., Straniero, O., &
Aringer, B. 2008, A&A, 486, 511Lebzelter, T., Posch, T., Hinkle, K., Wood, P. R., & Bouwman, J. 2006, ApJ,
653, L145Lebzelter, T., & Wood, P. R. 2007, A&A, 475, 643Mack, J., Gilliland, R. L., Anderson, J., & Sirianni, M. 2007, WFC Zero-
points at −80◦C, Science Report ACS 2007-02 (Baltimore, MD: STScI),http://www.stsci.edu/hst/acs/documents/isrs/isr0702.pdf
No. 2, 2010 THE ACS NEARBY GALAXY SURVEY TREASURY. IX. 1043
Maraston, C. 2005, MNRAS, 362, 799Maraston, C., Daddi, E., Renzini, A., Cimatti, A., Dickinson, M., Papovich, C.,
Pasquali, A., & Pirzkal, N. 2006, ApJ, 652, 85Marigo, P. 2002, A&A, 387, 507Marigo, P., & Aringer, B. 2009, A&A, 508, 1539Marigo, P., & Girardi, L. 2007, A&A, 469, 239Marigo, P., Girardi, L., & Bressan, A. 1999, A&A, 344, 123Marigo, P., Girardi, L., Bressan, A., Groenewegen, M. A. T., Silva, L., &
Granato, G. L. 2008, A&A, 482, 883McDonald, I., van Loon, J. T., Decin, L., Boyer, M. L., Dupree, A. K., Evans,
A., Gehrz, R. D., & Woodward, C. E. 2009, MNRAS, 394, 831McDonald, I., van Loon, J. T., Dupree, A. K., & Boyer, M. L. 2010, MNRAS,
405, 1711Melbourne, J., Williams, B., Dalcanton, J., Ammons, S. M., Max, C., Koo, D.
C., Girardi, L., & Dolphin, A. 2010, ApJ, 712, 469Mendez, B., Davis, M., Moustakas, J., Newman, J., Madore, B. F., & Freedman,
W. L. 2002, AJ, 124, 213Nikolaev, S., & Weinberg, M. D. 2000, ApJ, 542, 804
Pessev, P. M., Goudfrooij, P., Puzia, T. H., & Chandar, R. 2008, MNRAS, 385,1535
Raimondo, G. 2009, ApJ, 700, 1247Reimers, D. 1975, Mem. Soc. R. Sci. Liege, 8, 369Salpeter, E. E. 1955, ApJ, 121, 161Schlegel, D. J., Finkbeiner, D. P., & Davis, M. 1998, ApJ, 500, 525Schroder, K., & Cuntz, M. 2005, ApJ, 630, L73Stinson, G. S., Dalcanton, J. J., Quinn, T., Gogarten, S. M., Kaufmann, T., &
Wadsley, J. 2009, MNRAS, 395, 1455van Loon, J. T., Marshall, J. R., & Zijlstra, A. A. 2005, A&A, 442,
597van Loon, J. T., McDonald, I., Oliveira, J. M., Evans, A., Boyer, M. L., Gehrz,
R. D., Polomski, E., & Woodward, C. E. 2006, A&A, 450, 339Weinberg, M. D., & Nikolaev, S. 2001, ApJ, 548, 712Weisz, D. R., Skillman, E. D., Cannon, J. M., Dolphin, A. E., Kennicutt, R. C.,
Jr., Lee, J., & Walter, F. 2008, ApJ, 689, 160Williams, B. F., et al. 2009, AJ, 137, 419Willson, L. A. 2000, ARA&A, 38, 573