Embed Size (px)
Citation preview
The Ability and Attainment of Short-Sighted PupilsAuthor(s): J. W. B. Douglas, J. M. Ross and H. R. SimpsonSource: Journal of the Royal Statistical Society. Series A (General), Vol. 130, No. 4 (1967), pp.479-504Published by: Wiley for the Royal Statistical SocietyStable URL: http://www.jstor.org/stable/2982520 .
Accessed: 25/06/2014 01:08
Your use of the JSTOR archive indicates your acceptance of the Terms & Conditions of Use, available at .http://www.jstor.org/page/info/about/policies/terms.jsp
.JSTOR is a not-for-profit service that helps scholars, researchers, and students discover, use, and build upon a wide range ofcontent in a trusted digital archive. We use information technology and tools to increase productivity and facilitate new formsof scholarship. For more information about JSTOR, please contact [email protected].
.
Wiley and Royal Statistical Society are collaborating with JSTOR to digitize, preserve and extend access toJournal of the Royal Statistical Society. Series A (General).
http://www.jstor.org
This content downloaded from 91.229.248.152 on Wed, 25 Jun 2014 01:08:20 AMAll use subject to JSTOR Terms and Conditions
1967] 479
The Ability and Attainment of Short-sighted Pupilst
By J. W. B. DOUGLAS, J. M. Ross Medical Research Council Unit for the Study of
Environmental Factors in Mental and Physical Illness, London School of Economics
and H. R. SIMPSON
Rothamsted Experimental Station, Harpenden
[Read before the ROYAL STATISTICAL SOCIETY on Wednesday, May 17th, 1967, the President, Professor M. S. BARTLETT, F.R.S., in the Chair]
SUMMARY
In a national study short-sighted children are found to be hard working and attentive in class, to have many academic hobbies and, take relatively little interest in sport: they are successful at school and have high ambitions for further education and employment. In non-verbal tests their scores are similar to those of children with perfect vision, but in attainment tests they have a considerable advantage. These findings are related to the age of onset of short sight and home circumstances. The hypothesis is put forward that families with a history of short sight have over the generations acquired academic interests and a high valuation of non-manual or professional employment that are passed on to the children.
THESE observations on the ability and attainment of pupils who are short-sighted were made during the course of a continuing study of the health, growth and development of a group of 5,362 children who were born in the first week of March 1946. These children are a sample of all those born in Great Britain during the chosen week: they come from all parts of the country and all types of home.
Some eight weeks after the confinements, health visitors interviewed 13,687 out of the 15,130 women whose children's births had been notified to the Survey Committee by 424 co-operating public health authorities. Of the early losses, 287 were mothers who refused to be interviewed, 1,109 were untraced, and the forms of a further 47 were spoiled (Joint Committee, 1948). Of the untraced mothers it is thought that probably more than half were unmarried. For the follow-up study all illegitimate children were excluded as well as the stillborn and twins. This left a total of 12,468 from which the follow-up sample was drawn. All births to non-manual workers and all births to agricultural workers were included but only one out of every four births to manual workers (Douglas, 1951, Appendix A). The final sample size was 5,362- 4,720 of whom were still living in Great Britain in 1962.
It is widely believed that university students, scholarship winners and those in jobs which require high standards of intellectual ability are more likely to be short- sighted than others in the general population. This belief is, however, based for the
t This paper is an expansion of a chapter on short-sighted children in a book on the secondary school progress of the National Survey Sample. It will be published in 1968 under the present three authors, with the title All Our Future.
This content downloaded from 91.229.248.152 on Wed, 25 Jun 2014 01:08:20 AMAll use subject to JSTOR Terms and Conditions
480 DOUGLAS et al. - Ability and Attainment of Short-sighted Pupils [Part 4,
most part on general impressions rather than on statistical observations, and the apparent association of short sight with high ability may do no more than reflect the fact that clever children have parents who, on the whole, are more intelligent and more educationally ambitious than the general run and so are not only more aware of the importance of correcting defective vision in their children but also have a stronger incentive to do so.
Short sight often develops during the school years, at a time when children are concentrating on near work. In the past, it was thought that the process of adapting the lens of the eye for near vision might be associated with the development of short sight, the clever pupils and those excessively addicted to reading overstraining their eyes and impairing their vision. There is no convincing evidence, however, that near work predisposes to short sight (Jevons, 1957), and there is no physiological reason why this should be. Many today believe that short-sighted pupils do well at school because they find reading and close work easy, and because, to a greater or lesser extent, their defective sight prevents them from taking a full and active part in games and other outside activities; in order to compensate for this they strive to succeed in school.
In the social context, it has been suggested that short sight is more commonly found in the upper social classes and, in succeeding generations, will become increasingly concentrated there (Jahoda, 1962). The argument runs that short- sighted parents tend to have short-sighted children and those who are short-sighted, being also on the average of superior ability, are likely to be attracted to academic or clerical work and so move up the social and educational ladders. This upward move- ment is reinforced in each succeeding generation. Here again statistical evidence is scanty and based on samples of school children that were not randomly selected, and were probably in many respects atypical.
The present study provides a unique opportunity to follow the educational progress of short-sighted children and to look at the distribution of short sight within the population. It also allows comparisons of a number of personal charac- teristics and interests to be made between short-sighted pupils and those with perfect vision; for example, behaviour in and out of class, games ability, types of hobbies and attendance at school. Lastly, it is possible to take children before they have developed short sight and link their ability and attitudes at this earlier age with those recorded after their vision has become defective.
1. AVAILABLE INFORMATION
1.1. Education Three sets or batteries of educational tests were given by their teachers to the boys
and girls enrolled in this study. At 8 the tests were of intelligence, reading, vocabulary and sentence completion; at l Ithe same reading and vocabulary tests were repeated, the sentence completion test was replaced by an arithmetic test and a mixed verbal and non-verbal intelligence test was substituted for the picture intelligence test given at the earlier age. At 15 they completed the AH4 verbal and non-verbal test, the Watts-Vernon reading test, and a mathematics test. These tests were selected for us by the National Foundation for Educational Research in England and Wales, who also scored them. They standardized the raw marks for us on the total survey popula- tion, i.e. after allowances had been made for the one in four sampling of manual working-class families. These standardized scores each have a population mean of 50 and a standard deviation of 10.
This content downloaded from 91.229.248.152 on Wed, 25 Jun 2014 01:08:20 AMAll use subject to JSTOR Terms and Conditions
1967] DOUGLAS et al. - Ability and Attainment of Short-sighted Pupils 481
In addition to the individual test results three aggregate scores are available-one for each age. These were obtained by adding the four standardized marks of each battery and then restandardizing these aggregate scores on the population of pupils who took all three test batteries; the resulting scores have also a population mean of 50 and a standard deviation of 10.
The age of leaving school is known for each pupil together with the results of the 11 + selection and the General Certificate of Education "O" level examinations. This school information is supplemented by other data obtained from the mothers. During home visits the health visitors asked questions about a wide variety of educational, social and occupational matters, ranging from the education of the parents to the hobbies of their children and job aspirations (Douglas, 1964).
1.2. Vision Special medical examinations were given by the school doctors to these children
when they were 6, 7, 11 and 15 years of age, and on each occasion visual acuity was tested using Snellen wall charts of letters of different size. (For a description of Snellen's test type see, for example, Best and Taylor, 1966.) The boys and girls were tested both with and without glasses. At the 15-year examinations the school doctors recorded, for those with defective vision, the qualifications of the person who pre- scribed the glasses and, in many instances, the correctiron factors. At the medical examinations at 6 and 7 it is known only whether children had brought glasses to school, while at both 11 and 15 the mothers were asked whether their children possessed glasses, even if they had come without them that day.
Short-sighted boys and girls as well as those with a variety of other defects were picked out at the medical examinations by their inability to read the lines of smaller letters on the Snellen wall chart. Long-sighted pupils, however, are likely to have escaped detection because they would have been able to read, at a distance, print that would have been difficult for them to decipher when held close to. The results of the Snellen test, as it was given to members of the sample, therefore provides no informa- tion about the nature of the visual defects, only the extent of the impairment of distant vision. It is likely, however, that all seriously short-sighted pupils were identified.
Further information on the nature and cause of the more serious defects was obtained in the following way. A list was made of all 15-year pupils who with their best eye and without glasses had vision of 6/12 or less, i.e. could read at no more than 6 metres away the size of print that a pupil with no visual defect could read at 12 metres or more. The names of the boys and girls on this list were sent to the appropriate medical officers of health with a request for further information, including the correction prescribed.
The information obtained from the medical officers of health and from the survey records was submitted to Dr Comer of the Royal Eye Hospital for assessment. Out of 3,775 boys and girls who were given the Snellen test at 15 years, 2,949 had perfect vision in both eyes (6/6), 461 had at least one eye with good or fair, but not perfect, vision (better than 6/12), 224 were short-sighted and 141 were identified as having other defects-these included some who were long-sighted and some with defects that cannot be diagnosed from the information available. (See definitions in Appendix A.)
Full educational information including the results of tests at 8, 11 and 15 years was available for 2,553 children with perfect vision and 171 who were short-sighted and had had their eyes tested at 7, 11 and 15 years. Tables 9-13, which show the educational progress of the children, are based on this reduced sample and the same
This content downloaded from 91.229.248.152 on Wed, 25 Jun 2014 01:08:20 AMAll use subject to JSTOR Terms and Conditions
482 DOUGLAS et al. - Ability and Attainment of Short-sighted Pupils [Part 4,
numbers are included in each table. Those that describe other characteristics are based on the total sample of 3,775 children whose eyes were tested at 15. Owing to the variable losses occurring at different points of the survey,t these numbers vary somewhat from table to table.
In the complete sample of 3,775 children 55 were very short-sighted (high myopia, see Appendix A) and 169 were moderately short-sighted. As there are no statistically significant differences in the educational progress of children in these two groups, they have been combined. The short-sighted children also included 102 who had added visual abnormalities, such as astigmatism, complete lack of vision in one eye or a difference of 2*5 D between the refractive errors of the two eyes. After close inspection it was decided to include them with the rest of the short-sighted children on the grounds of their similar progress and attainment.
2. THE CHARACTERISTICS OF SHORT-SIGHTED CHILDREN AND THEIR PARENTS There are no sex differences in the occurrence of severe short sight, but moderate
short sight is more common among the girls. This is a consistent finding within each social class. For the following discussion the two groups of short-sighted children are considered together as the numbers of severely short-sighted are too small to make a separate analysis worthwhile.
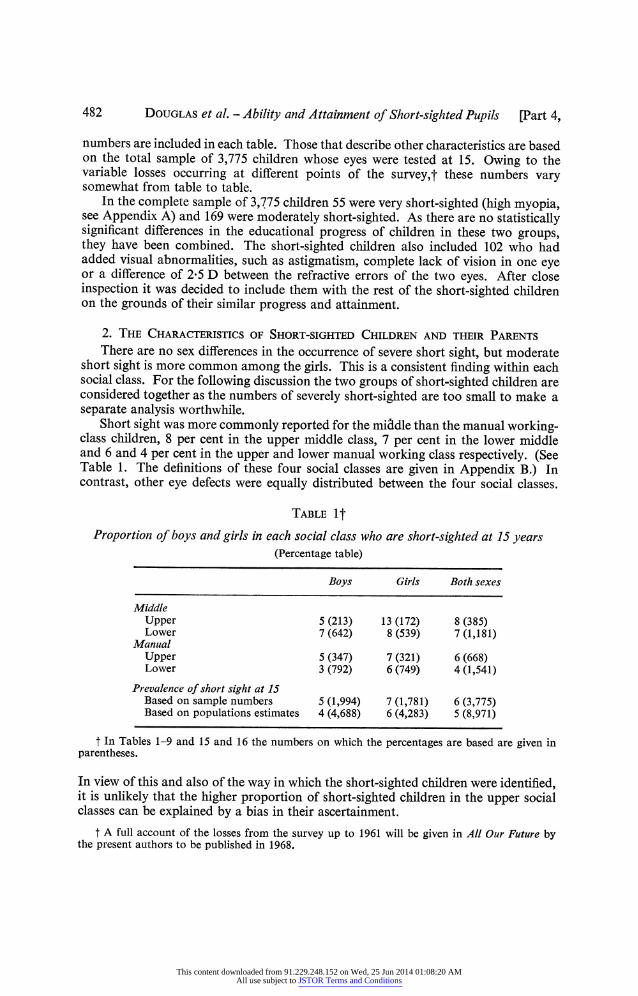
Short sight was more commonly reported for the miadle than the manual working- class children, 8 per cent in the upper middle class, 7 per cent in the lower middle and 6 and 4 per cent in the upper and lower manual working class respectively. (See Table 1. The definitions of these four social classes are given in Appendix B.) In contrast, other eye defects were equally distributed between the four social classes.
TABLE I t
Proportion of boys and girls in each social class who are short-sighted at 15 years (Percentage table)
Boys Girls Both sexes
Middle Upper 5 (213) 13 (172) 8 (385) Lower 7 (642) 8 (539) 7 (1,181)
Manual Upper 5 (347) 7 (321) 6 (668) Lower 3 (792) 6 (749) 4 (1,541)
Prevalence of short sight at 15 Based on sample numbers 5 (1,994) 7 (1,781) 6 (3,775) Based on populations estimates 4 (4,688) 6 (4,283) 5 (8,971)
t In Tables 1-9 and 15 and 16 the numbers on which the percentages are based are given in parentheses.
In view of this and also of the way in which the short-sighted children were identified, it is unlikely that the higher proportion of short-sighted children in the upper social classes can be explained by a bias in their ascertainment.
t A full account of the losses from the survey up to 1961 will be given in All Our Future by the present authors to be published in 1968.
This content downloaded from 91.229.248.152 on Wed, 25 Jun 2014 01:08:20 AMAll use subject to JSTOR Terms and Conditions
1967] DOUGLAS et al. - Ability and Attainment of Short-sighted Pupils 483
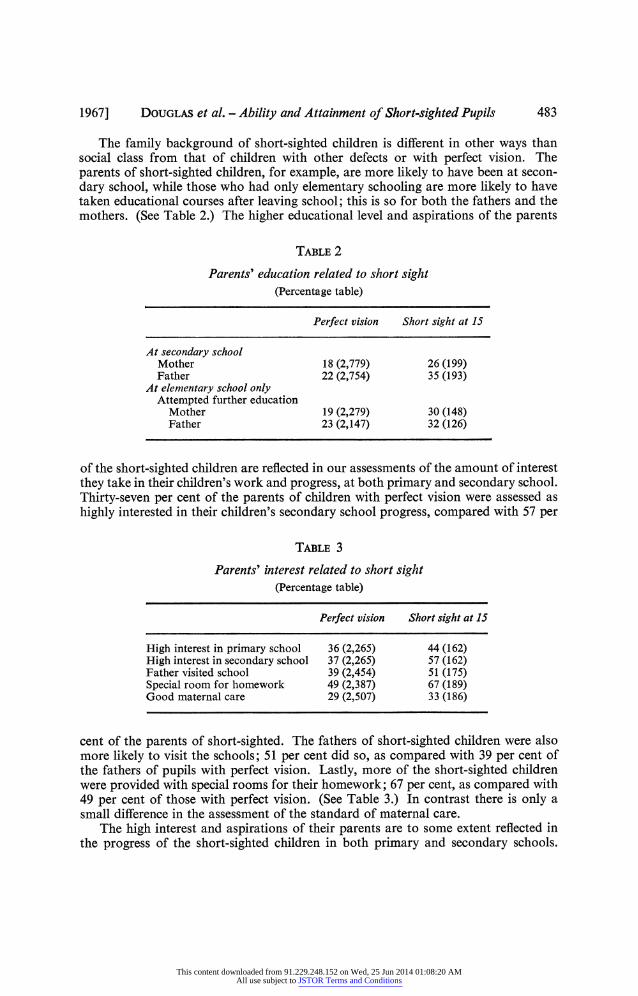
The family background of short-sighted children is different in other ways than social class from that of children with other defects or with perfect vision. The parents of short-sighted children, for example, are more likely to have been at secon- dary school, while those who had only elementary schooling are more likely to have taken educational courses after leaving school; this is so for both the fathers and the mothers. (See Table 2.) The higher educational level and aspirations of the parents
TABLE 2
Parents' education related to short sight (Percentage table)
Perfect vision Short sight at 15
At secondary school Mother 18 (2,779) 26 (199) Father 22 (2,754) 35 (193)
At elementary school only Attempted further education
Mother 19 (2,279) 30 (148) Father 23 (2,147) 32 (126)
of the short-sighted children are reflected in our assessments of the amount of interest they take in their children's work and progress, at both primary and secondary school. Thirty-seven per cent of the parents of children with perfect vision were assessed as highly interested in their children's secondary school progress, compared with 57 per
TABLE 3
Parents' interest related to short sight (Percentage table)
Perfect vision Short sight at 15
High interest in primary school 36 (2,265) 44 (162) High interest in secondary school 37 (2,265) 57 (162) Father visited school 39 (2,454) 51 (175) Special room for homework 49 (2,387) 67 (189) Good maternal care 29 (2,507) 33 (186)
cent of the parents of short-sighted. The fathers of short-sighted children were also more likely to visit the schools; 51 per cent did so, as compared with 39 per cent of the fathers of pupils with perfect vision. Lastly, more of the short-sighted children were provided with special rooms for their homework; 67 per cent, as compared with 49 per cent of those with perfect vision. (See Table 3.) In contrast there is only a small difference in the assessment of the standard of maternal care.
The high interest and aspirations of their parents are to some extent reflected in the progress of the short-sighted children in both primary and secondary schools.
This content downloaded from 91.229.248.152 on Wed, 25 Jun 2014 01:08:20 AMAll use subject to JSTOR Terms and Conditions
484 DOUGLAS et al. - Ability and Attainment of Short-sighted Pupils [Part 4,
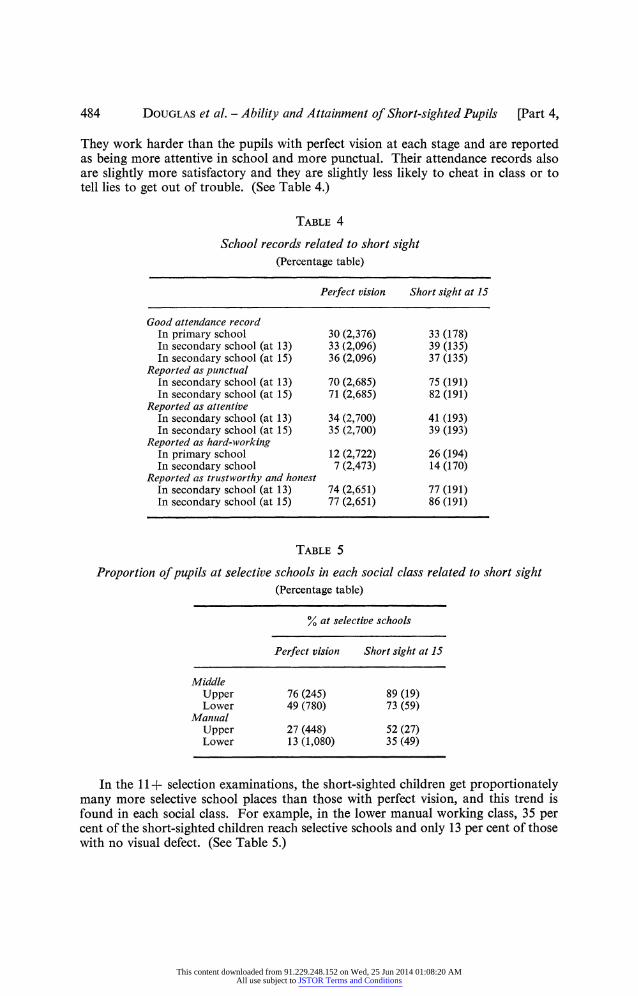
They work harder than the pupils with perfect vision at each stage and are reported as being more attentive in school and more punctual. Their attendance records also are slightly more satisfactory and they are slightly less likely to cheat in class or to tell lies to get out of trouble. (See Table 4.)
TABLE 4
School records related to short sight (Percentage table)
Perfect vision Short sight at 15
Good attendance record In primary school 30 (2,376) 33 (178) In secondary school (at 13) 33 (2,096) 39 (135) In secondary school (at 15) 36 (2,096) 37 (135)
Reported as punctual In secondary school (at 13) 70 (2,685) 75 (191) In secondary school (at 15) 71 (2,685) 82 (191)
Reported as attentive In secondary school (at 13) 34 (2,700) 41 (193) In secondary school (at 15) 35 (2,700) 39 (193)
Reported as hard-working In primary school 12 (2,722) 26 (194) In secondary school 7 (2,473) 14 (170)
Reported as trustworthy and honest In secondary school (at 13) 74 (2,651) 77 (191) In secondary school (at 15) 77 (2,651) 86 (191)
TABLE 5
Proportion of pupils at selective schools in each social class related to short sight (Percentage table)
%Y at selective schools
Perfect vision Short sight at 15
Middle Upper 76 (245) 89 (19) Lower 49 (780) 73 (59)
Manual Upper 27 (448) 52 (27) Lower 13 (1,080) 35 (49)
In the 11+ selection examinations, the short-sighted children get proportionately many more selective school places than those with perfect vision, and this trend is found in each social class. For example, in the lower manual working class, 35 per cent of the short-sighted children reach selective schools and only 13 per cent of those with no visual defect. (See Table 5.)
This content downloaded from 91.229.248.152 on Wed, 25 Jun 2014 01:08:20 AMAll use subject to JSTOR Terms and Conditions
1967] DOUGLAS et al. - Ability and Attainment of Short-sighted Pupils 485
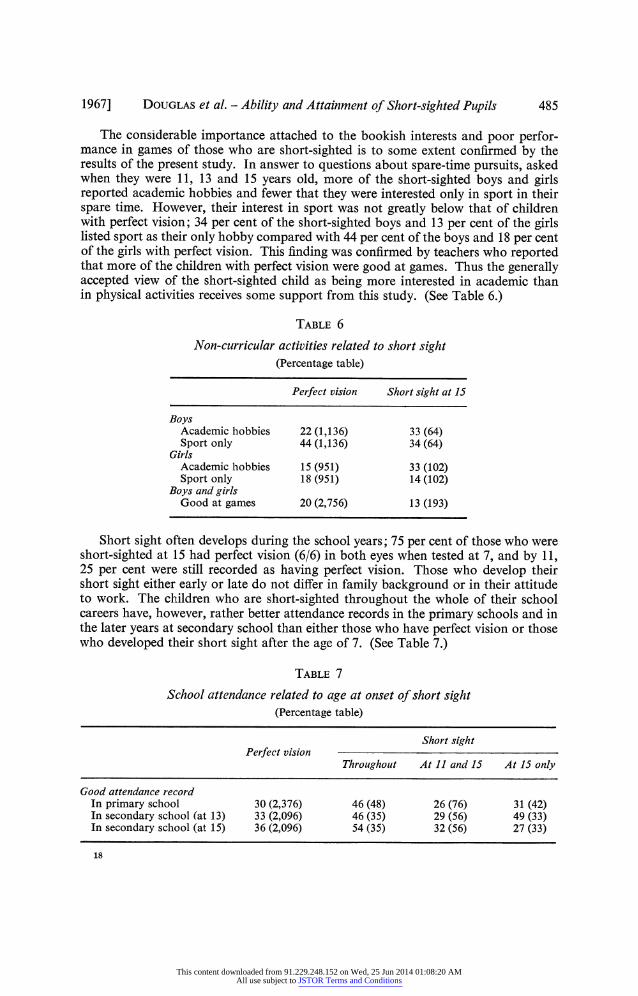
The considerable importance attached to the bookish interests and poor perfor- mance in games of those who are short-sighted is to some extent confirmed by the results of the present study. In answer to questions about spare-time pursuits, asked when they were 11, 13 and 15 years old, more of the short-sighted boys and girls reported academic hobbies and fewer that they were interested only in sport in their spare time. However, their interest in sport was not greatly below that of children with perfect vision; 34 per cent of the short-sighted boys and 13 per cent of the girls listed sport as their only hobby compared with 44 per cent of the boys and 18 per cent of the girls with perfect vision. This finding was confirmed by teachers who reported that more of the children with perfect vision were good at games. Thus the generally accepted view of the short-sighted child as being more interested in academic than in physical activities receives some support from this study. (See Table 6.)
TABLE 6
Non-curricular activities related to short sight (Percentage table)
Perfect vision Short sight at 15
Boys Academic hobbies 22 (1,136) 33 (64) Sport only 44 (1,136) 34 (64)
Girls Academic hobbies 15 (951) 33 (102) Sport only 18 (951) 14 (102)
Boys and girls Good at games 20 (2,756) 13 (193)
Short sight often develops during the school years; 75 per cent of those who were short-sighted at 15 had perfect vision (6/6) in both eyes when tested at 7, and by 11, 25 per cent were still recorded as having perfect vision. Those who develop their short sight either early or late do not differ in family background or in their attitude to work. The children who are short-sighted throughout the whole of their school careers have, however, rather better attendance records in the primary schools and in the later years at secondary school than either those who have perfect vision or those who developed their short sight after the age of 7. (See Table 7.)
TABLE 7
School attendance related to age at onset of short sight (Percentage table)
Short sight Perfect vision
Throughout At 11 and 15 At 15 only
Good attendance record In primary school 30 (2,376) 46 (48) 26 (76) 31 (42) In secondary school (at 13) 33 (2,096) 46 (35) 29 (56) 49 (33) In secondary school (at 15) 36 (2,096) 54 (35) 32 (56) 27 (33)
18
This content downloaded from 91.229.248.152 on Wed, 25 Jun 2014 01:08:20 AMAll use subject to JSTOR Terms and Conditions
486 DOUGLAS et al. - Ability and Attainment of Short-sighted Pupils [Part 4,
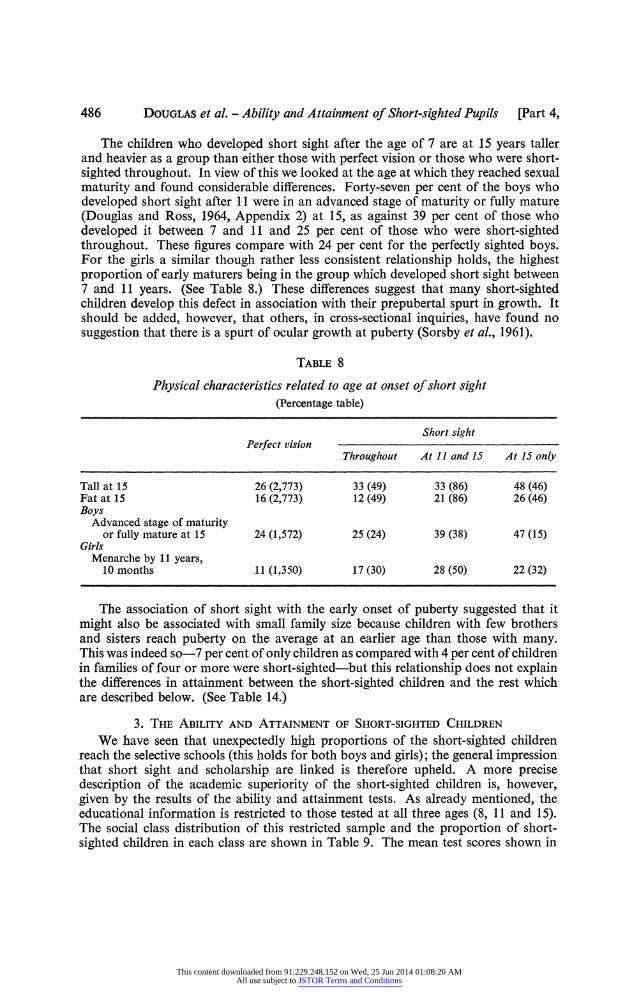
The children who developed short sight after the age of 7 are at 15 years taller and heavier as a group than either those with perfect vision or those who were short- sighted throughout. In view of this we looked at the age at which they reached sexual maturity and found considerable differences. Forty-seven per cent of the boys who developed short sight after 11 were in an advanced stage of maturity or fully mature (Douglas and Ross, 1964, Appendix 2) at 15, as against 39 per cent of those who developed it between 7 and 11 and 25 per cent of those who were short-sighted throughout. These figures compare with 24 per cent for the perfectly sighted boys. For the girls a similar though rather less consistent relationship holds, the highest proportion of early maturers being in the group which developed short sight between 7 and 11 years. (See Table 8.) These differences suggest that many short-sighted children develop this defect in association with their prepubertal spurt in growth. It should be added, however, that others, in cross-sectional inquiries, have found no suggestion that there is a spurt of ocular growth at puberty (Sorsby et al., 1961).
TABLE 8
Physical characteristics related to age at onset of short sight (Percentage table)
Short sight Perfect vision
Throughout At 11 and 15 At 15 only
Tall at 15 26 (2,773) 33 (49) 33 (86) 48 (46) Fat at 15 16 (2,773) 12 (49) 21 (86) 26 (46) Boys
Advanced stage of maturity or fully mature at 15 24 (1,572) 25 (24) 39 (38) 47 (15)
Girls Menarche by 11 years,
10 months 11 (1,350) 17 (30) 28 (50) 22 (32)
The association of short sight with the early onset of puberty suggested that it might also be associated with small family size because children with few brothers and sisters reach puberty on the average at an earlier age than those with many. This was indeed so-7 per cent of only children as compared with 4 per cent of children in families of four or more were short-sighted-but this relationship does not explain the differences in attainment between the short-sighted children and the rest which are described below. (See Table 14.)
3. THE ABILITY AND ATTAINMENT OF SHORT-SIGHTED CHILDREN We have seen that unexpectedly high proportions of the short-sighted children
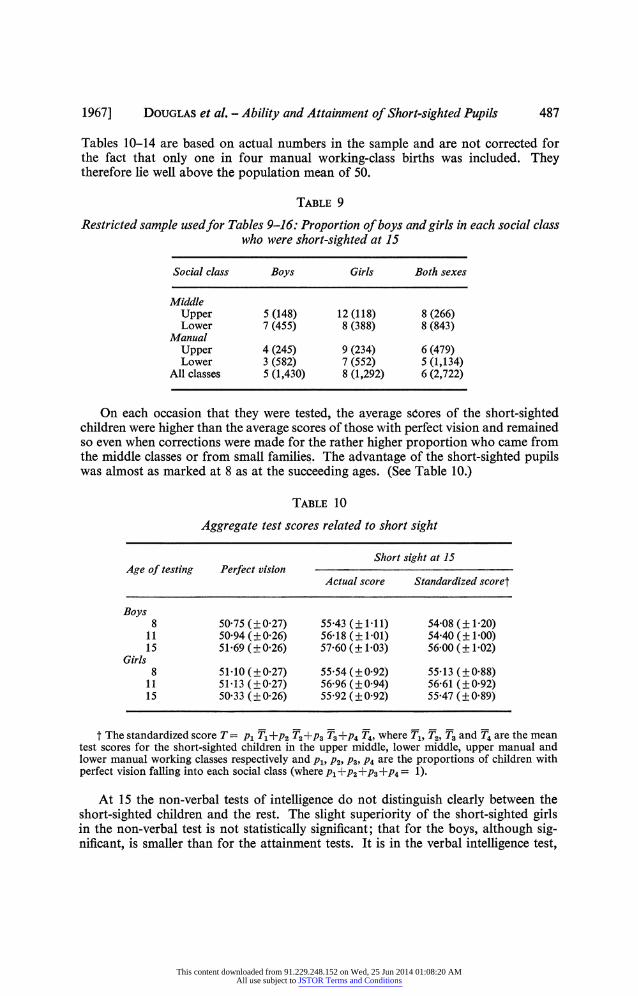
reach the selective schools (this holds for both boys and girls); the general impression that short sight and scholarship are linked is therefore upheld. A more precise description of the academic superiority of the short-sighted children is, however, given by the results of the ability and attainment tests. As already mentioned, the educational information is restricted to those tested at all three ages (8, 11 and 15). The social class distribution of this restricted sample and the proportion of short- sighted children in each class are shown in Table 9. The mean test scores shown in
This content downloaded from 91.229.248.152 on Wed, 25 Jun 2014 01:08:20 AMAll use subject to JSTOR Terms and Conditions
1967] DOUGLAS et al. - Ability and Attainment of Short-sighted Pupils 487
Tables 10-14 are based on actual numbers in the sample and are not corrected for the fact that only one in four manual working-class births was included. They therefore lie well above the population mean of 50.
TABLE 9
Restricted sample usedfor Tables 9-16: Proportion of boys and girls in each social class who were short-sighted at 15
Social class Boys Girls Both sexes
Middle Upper 5 (148) 12 (118) 8 (266) Lower 7 (455) 8 (388) 8 (843)
Manual Upper 4 (245) 9 (234) 6 (479) Lower 3 (582) 7 (552) 5 (1,134)
All classes 5 (1,430) 8 (1,292) 6 (2,722)
On each occasion that they were tested, the average scores of the short-sighted children were higher than the average scores of those with perfect vision and remained so even when corrections were made for the rather higher proportion who came from the middle classes or from small families. The advantage of the short-sighted pupils was almost as marked at 8 as at the succeeding ages. (See Table 10.)
TABLE 1 0
Aggregate test scores related to short sight
Short sight at 15 Age of testing Perfect vision
Actual score Standardized scoret
Boys 8 50 75 (?0 27) 55 43 (? 111) 54 08 (? 120)
11 5094 (?026) 56-18 (?1 01) 5440 (?1 00) 15 51P69 (?0 26) 57 60 (? 103) 56 00 (? 102)
Girls 8 5110 (?0 27) 55 54 (?0 92) 55-13 (?0 88)
11 51-13 (?027) 5696 (?094) 56-61 (?092) 15 50 33 (?0 26) 55 92 (?0 92) 55 47 (?0 89)
t The standardized score T= Pi T1 +P2 T2+p3 T3+p4 T4, where T1, T2, T77 and T4 are the mean test scores for the short-sighted children in the upper middle, lower middle, upper manual and lower manual working classes respectively and P1, P2, P3, P4 are the proportions of children with perfect vision falling into each social class (where P1+P2+P3+P4 = 1).
At 15 the non-verbal tests of intelligence do not distinguish clearly between the short-sighted children and the rest. The slight superiority of the short-sighted girls in the non-verbal test is not statistically significant; that for the boys, although sig- nificant, is smaller than for the attainment tests. It is in the verbal intelligence test,
This content downloaded from 91.229.248.152 on Wed, 25 Jun 2014 01:08:20 AMAll use subject to JSTOR Terms and Conditions
488 DOUGLAS et al. - Ability and Attainment of Short-sighted Pupils [Part 4,
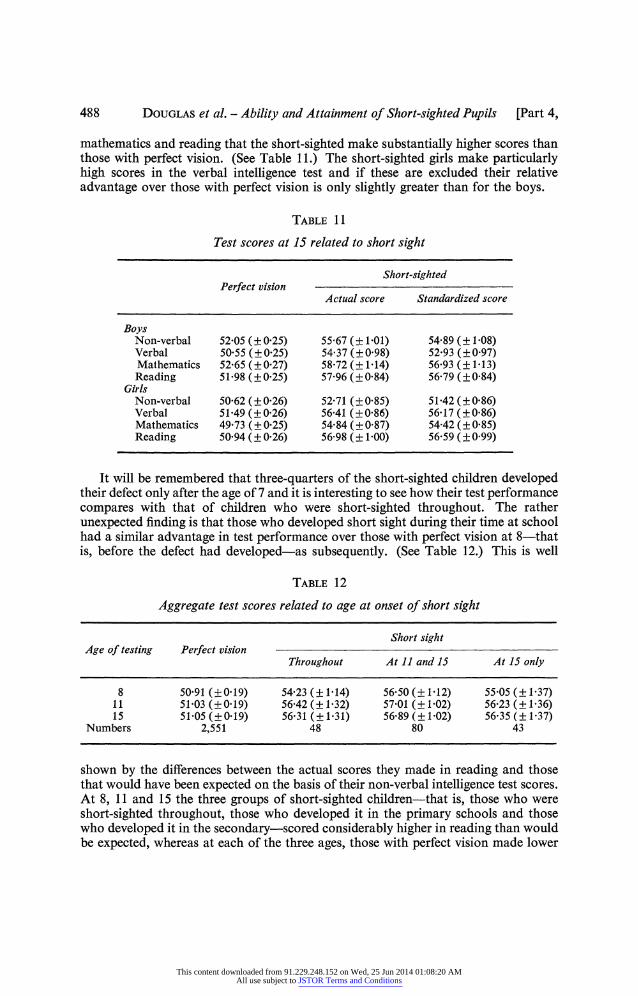
mathematics and reading that the short-sighted make substantially higher scores than those with perfect vision. (See Table 11.) The short-sighted girls make particularly high scores in the verbal intelligence test and if these are excluded their relative advantage over those with perfect vision is only slightly greater than for the boys.
TABLE 11
Test scores at 15 related to short sight
Short-sighted Perfect vision
Actual score Standardized score
Boys Non-verbal 52 05 (?025) 55 67 (? 101) 54 89 (? 108) Verbal 5055 (025) 5437 (?098) 5293 (?097) Mathematics 52 65 (?0 27) 58 72 (? 114) 56 93 (? 113) Reading 51-98 (?0 25) 57 96 (?0 84) 56 79 (?0 84)
Girls Non-verbal 5062 (?026) 52-71 (?085) 51P42 (?086) Verbal 51P49 (?026) 56-41 (?0 86) 56-17 (?0 86) Mathematics 49 73 (? 025) 54 84 (? 087) 54 42 (? 085) Reading 50 94 (?026) 56 98 (? 100) 56 59 (?099)
It will be remembered that three-quarters of the short-sighted children developed their defect only after the age of 7 and it is interesting to see how their test performance compares with that of children who were short-sighted throughout. The rather unexpected finding is that those who developed short sight during their time at school had a similar advantage in test performance over those with perfect vision at 8-that is, before the defect had developed-as subsequently. (See Table 12.) This is well
TABLE 12
Aggregate test scores related to age at onset of short sight
Short sight Age of testing Perfect vision
Throughout At 11 and 15 At 15 only
8 50 91 (019) 54 23 (? 1P14) 56 50 (?+112) 55-05 (?1-37) 11 51P03 (019) 56 42 (?+132) 57-01 (?+102) 56&23 (?+136) 15 51P05 (019) 56-31 (?1-31) 56&89 (?+102) 56&35 (?+137)
Numbers 2,551 48 80 43
shown by the differences between the actual scores they made in reading and those that would have been expected on the basis of their non-verbal intelligence test scores. At 8, 11 and 15 the three groups of short-sighted children-that is, those who were short-sighted throughout, those who developed it in the primary schools and those who developed it in the secondary-scored considerably higher in reading than would be expected, whereas at each of the three ages, those with perfect vision made lower
This content downloaded from 91.229.248.152 on Wed, 25 Jun 2014 01:08:20 AMAll use subject to JSTOR Terms and Conditions
1967] DOUGLAS et al. - Ability and Attainment of Short-sighted Pupils 489
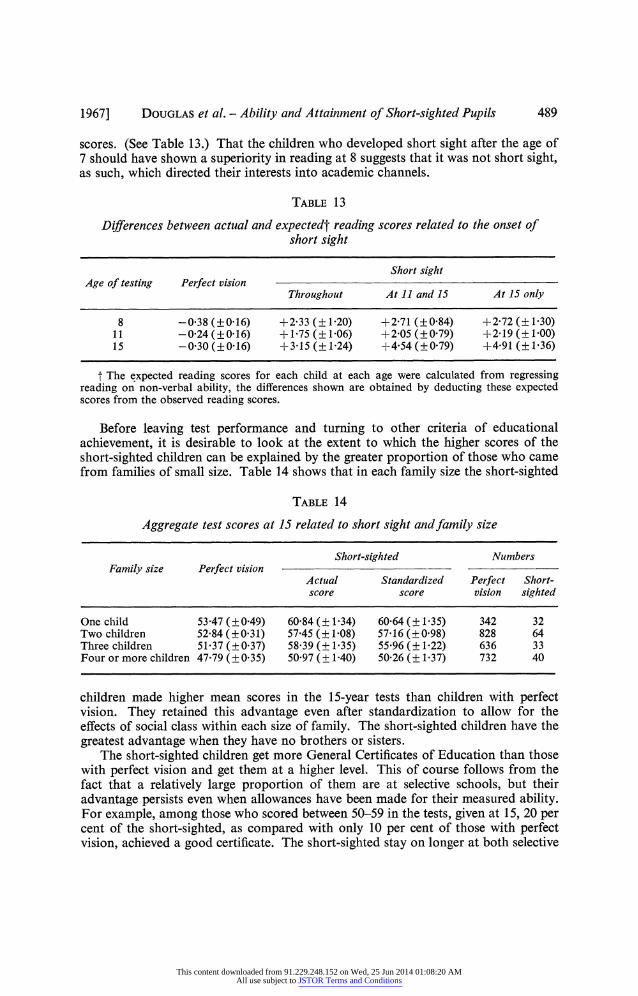
scores. (See Table 13.) That the children who developed short sight after the age of 7 should have shown a superiority in reading at 8 suggests that it was not short sight, as such, which directed their interests into academic channels.
TABLE 13
Differences between actual and expectedt reading scores related to the onset of short sight
Short sight Age of testing Perfect vision
Throughout At 11 and 15 At 15 only
8 -038 (?016) +2-33 (?1.20) +2-71 (?084) +2-72 (? 1-30) 11 -024 (?016) +1-75 (?1[06) +2O05 (?079) +2-19 (?1O00) 15 -030 (?0-16) +3-15 (? 1-24) +4-54 (?079) +4-91 (?1-36)
t The expected reading scores for each child at each age were calculated from regressing reading on non-verbal ability, the differences shown are obtained by deducting these expected scores from the observed reading scores.
Before leaving test performance and turning to other criteria of educational achievement, it is desirable to look at the extent to which the higher scores of the short-sighted children can be explained by the greater proportion of those who came from families of small size. Table 14 shows that in each family size the short-sighted
TABLE 14
Aggregate test scores at 15 related to short sight andfamily size
Short-sighted Numbers Family size Perfect vision
Actual Standardized Perfect Short- score score vision sighted
One child 53 47 (?0 49) 60-84 (? 1-34) 60-64 (? 1-35) 342 32 Two children 52 84 (?0-31) 57 45 (? 108) 57-16 (?0 98) 828 64 Three children 51-37 (?037) 58 39 (? 1.35) 55 96 (? 1-22) 636 33 Four or more children 47 79 (?0 35) 50 97 (? 140) 50 26 (? 1-37) 732 40
children made higher mean scores in the 15-year tests than children with perfect vision. They retained this advantage even after standardization to allow for the effects of social class within each size of family. The short-sighted children have the greatest advantage when they have no brothers or sisters.
The short-sighted children get more General Certificates of Education than those with perfect vision and get them at a higher level. This of course follows from the fact that a relatively large proportion of them are at selective schools, but their advantage persists even when allowances have been made for their measured ability. For example, among those who scored between 50-59 in the tests, given at 15, 20 per cent of the short-sighted, as compared with only 10 per cent of those with perfect vision, achieved a good certificate. The short-sighted stay on longer at both selective
This content downloaded from 91.229.248.152 on Wed, 25 Jun 2014 01:08:20 AMAll use subject to JSTOR Terms and Conditions
490 DOUGLAS et al. - Ability and Attainment of Short-sighted Pupils [Part 4,
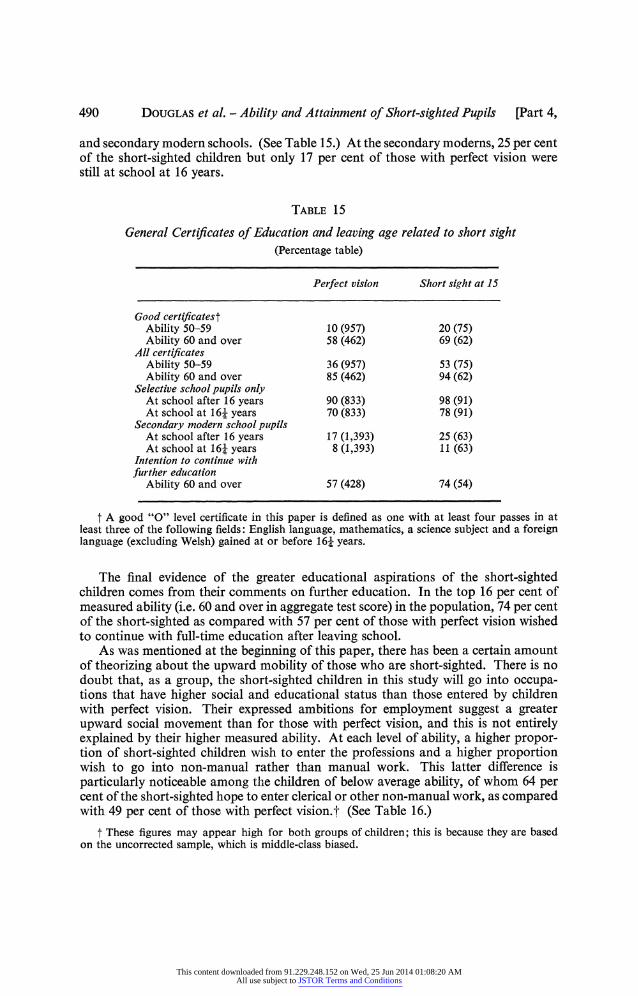
and secondary modern schools. (See Table 15.) At the secondary moderns, 25 per cent of the short-sighted children but only 17 per cent of those with perfect vision were still at school at 16 years.
TABLE 15
General Certificates of Education and leaving age related to short sight (Percentage table)
Perfect vision Short sight at 15
Good certificatest Ability 50-59 10 (957) 20 (75) Ability 60 and over 58 (462) 69 (62)
All certificates Ability 50-59 36 (957) 53 (75) Ability 60 and over 85 (462) 94 (62)
Selective school pupils only At school after 16 years 90 (833) 98 (91) At school at 161 years 70 (833) 78 (91)
Secondary modern school pupils At school after 16 years 17 (1,393) 25 (63) At school at 161 years 8 (1,393) 11 (63)
Intention to continue with further education
Ability 60 and over 57 (428) 74 (54)
t A good "O" level certificate in this paper is defined as one with at least four passes in at least three of the following fields: English language, mathematics, a science subject and a foreign language (excluding Welsh) gained at or before 161 years.
The final evidence of the greater educational aspirations of the short-sighted children comes from their comments on further education. In the top 16 per cent of measured ability (i.e. 60 and over in aggregate test score) in the population, 74 per cent of the short-sighted as compared with 57 per cent of those with perfect vision wished to continue with full-time education after leaving school.
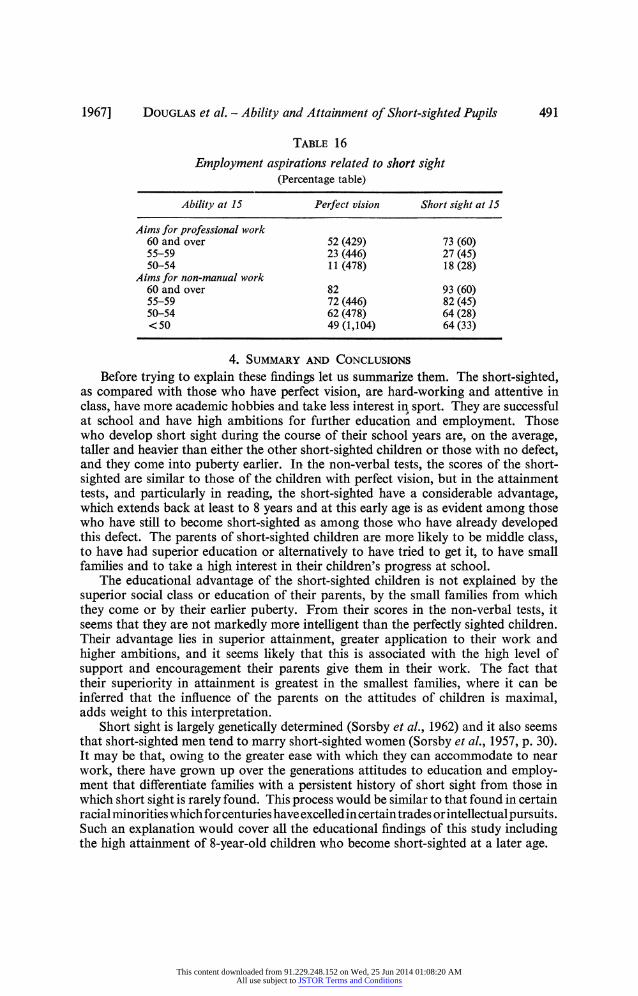
As was mentioned at the beginning of this paper, there has been a certain amount of theorizing about the upward mobility of those who are short-sighted. There is no doubt that, as a group, the short-sighted children in this study will go into occupa- tions that have higher social and educational status than those entered by children with perfect vision. Their expressed ambitions for employment suggest a greater upward social movement than for those with perfect vision, and this is not entirely explained by their higher measured ability. At each level of ability, a higher propor- tion of short-sighted children wish to enter the professions and a higher proportion wish to go into non-manual rather than manual work. This latter difference is particularly noticeable among the children of below average ability, of whom 64 per cent of the short-sighted hope to enter clerical or other non-manual work, as compared with 49 per cent of those with perfect vision.t (See Table 16.)
t These figures may appear high for both groups of children; this is because they are based on the uncorrected sample, which is middle-class biased.
This content downloaded from 91.229.248.152 on Wed, 25 Jun 2014 01:08:20 AMAll use subject to JSTOR Terms and Conditions
1967] DOUGLAS et al. - Ability and Attainment of Short-sighted Pupils 491
TABLE 16
Employment aspirations related to short sight (Percentage table)
Ability at 15 Perfect vision Short sight at 15
Aims for professional work 60 and over 52 (429) 73 (60) 55-59 23 (446) 27 (45) 50-54 11 (478) 18 (28)
Aims for non-manual work 60 and over 82 93 (60) 55-59 72 (446) 82 (45) 50-54 62 (478) 64 (28) <50 49 (1,104) 64 (33)
4. SUMMARY AND CONCLUSIONS Before trying to explain these findings let us summarize them. The short-sighted,
as compared with those who have perfect vision, are hard-working and attentive in class, have more academic hobbies and take less interest in sport. They are successful at school and have high ambitions for further education and employment. Those who develop short sight during the course of their school years are, on the average, taller and heavier than either the other short-sighted children or those with no defect, and they come into puberty earlier. In the non-verbal tests, the scores of the short- sighted are similar to those of the children with perfect vision, but in the attainment tests, and particularly in reading, the short-sighted have a considerable advantage, which extends back at least to 8 years and at this early age is as evident among those who have still to become short-sighted as among those who have already developed this defect. The parents of short-sighted children are more likely to be middle class, to have had superior education or alternatively to have tried to get it, to have small families and to take a high interest in their children's progress at school.
The educational advantage of the short-sighted children is not explained by the superior social class or education of their parents, by the small families from which they come or by their earlier puberty. From their scores in the non-verbal tests, it seems that they are not markedly more intelligent than the perfectly sighted children. Their advantage lies in superior attainment, greater application to their work and higher ambitions, and it seems likely that this is associated with the high level of support and encouragement their parents give them in their work. The fact that their superiority in attainment is greatest in the smallest families, where it can be inferred that the influence of the parents on the attitudes of children is maximal, adds weight to this interpretation.
Short sight is largely genetically determined (Sorsby et al., 1962) and it also seems that short-sighted men tend to marry short-sighted women (Sorsby et al., 1957, p. 30). It may be that, owing to the greater ease with which they can accommodate to near work, there have grown up over the generations attitudes to education and employ- ment that differentiate families with a persistent history of short sight from those in which short sight is rarely found. This process would be similar to that found in certain racial minorities which for centuries have excelled in certain trades or intellectual pursuits. Such an explanation would cover all the educational findings of this study including the high attainment of 8-year-old children who become short-sighted at a later age.
This content downloaded from 91.229.248.152 on Wed, 25 Jun 2014 01:08:20 AMAll use subject to JSTOR Terms and Conditions
492 DOUGLAS et al. - Ability and Attainment of Short-sighted Pupils [Part 4,
ACKNOWLEDGEMENTS
We should like to thank Professor Arnold Sorsby for his encouragement and advice, and Dr Comer for estimating the nature and extent of the refractive errors. Without their help this study would not have been possible. Mr I. W. Henry was largely responsible for the processing of the cards.
The National Survey of Health and Development was sponsored by a joint committee of the Institute of Child Health, the Society of Medical Officers of Health and the Population Investigation Committee. It is now being directed from the Medical Research Council Unit at the London School of Economics. In its early years the inquiry was financed by the Nuffield Foundation, and grants for continuing it through the school years have come from many sources, including the Ford Foundation and the Population Council, Inc.
We have received much assistance from the National Foundation for Educational Research in England and Wales-they supplied us with all the school tests and both checked the markings and standardized the scores. We wish to thank them for all their help.
A National Longitudinal Study such as this is possible only because of the generous cooperation we have had from many people and agencies: here we would especially like to thank the directors of education,, teachers, school doctors and health visitors in all parts of Great Britain, who have given us information about the boys and girls included in this survey. We should also like to thank the mothers who willingly answered numerous detailed questions, and the boys and girls themselves.
REFERENCES
BEST, C. H. and TAYLOR, N. B. (1966). The Physiological Basis of Medical Practice (8th ed.). Baltimore: Williams & Wilkins.
DOUGLAS, J. W. B. (1951). Social class differences in health and survival during the first two years of life. Population Stud., 5, 35-58.
(1964). The Home and the School. London: MacGibbon & Kee. DOUGLAS, J. W. B. and Ross, J. M. (1964). Age of puberty related to educational ability, attain-
ment and school leaving age. J. Child Psychol. Psychiat., 5, 185. JAHODA, G. (1962). Refraction errors, intelligence and social mobility. Brit. J. Soc. Clin. Psychol.,
1, 96-106. JEVONS, M. A. (1957). Ocular defects and intelligence. Medical Officer, 97, 53. JOINT COMMITTEE (1948). Maternity in Great Britain. (Joint Committee of the Royal College of
Obstetricians and Gynaecologists and the Population Investigation Committee.) Oxford: University Press.
SORSBY, A., BENJAMIN, B., DAVEY, J. B., SHERIDAN, M. and TANNER, J. M. (1957). Emmetropia and its Aberrations. (Medical Research Council Special Report Series, No. 293.) London: H.M.S.O.
SORSBY, A., BENJAMIN, B. and SHERIDAN, M. (1961). Refraction and its Components during the Growth of the Eye from the Age of Three. (Medical Research Council Special Report Series, No. 301.) London: H.M.S.O.
SORSBY, A., SHERIDAN, M. and LEARY, G. A. (1962). Refraction and its Components in Twins. (Medical Research Council Special Report Series, No. 303.) London: H.M.S.O.
This content downloaded from 91.229.248.152 on Wed, 25 Jun 2014 01:08:20 AMAll use subject to JSTOR Terms and Conditions
1967] Discussion on Paper by Douglas, Ross and Simpson 493
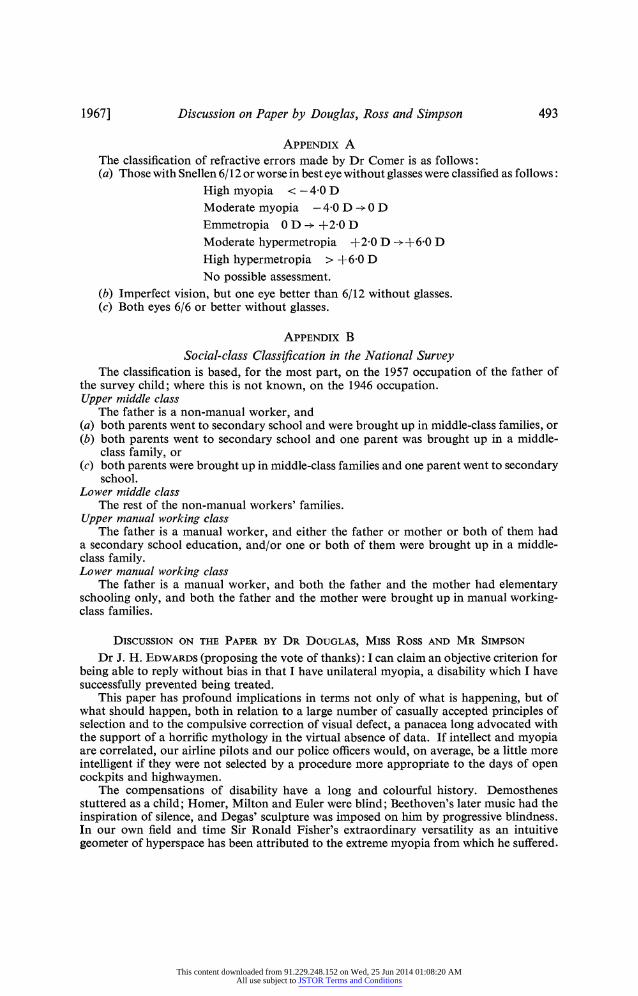
APPENDIX A The classification of refractive errors made by Dr Comer is as follows: (a) Those with Snellen 6/12 or worse in best eye without glasses were classified as follows:
High myopia <- 40 D Moderate myopia - 40 D -*0 D Emmetropia 0 D - +2-0 D Moderate hypermetropia +2-0 D --+6-0 D High hypermetropia > +6-0 D No possible assessment.
(b) Imperfect vision, but one eye better than 6/12 without glasses. (c) Both eyes 6/6 or better without glasses.
APPENDIX B
Social-class Classification in the National Survey The classification is based, for the most part, on the 1957 occupation of the father of
the survey child; where this is not known, on the 1946 occupation. Upper middle class
The father is a non-manual worker, and (a) both parents went to secondary school and were brought up in middle-class families, or (b) both parents went to secondary school and one parent was brought up in a middle-
class family, or (c) both parents were brought up in middle-class families and one parent went to secondary
school. Lower middle class
The rest of the non-manual workers' families. Upper manual working class
The father is a manual worker, and either the father or mother or both of them had a secondary school education, and/or one or both of them were brought up in a middle- class family. Lower manual working class
The father is a manual worker, and both the father and the mother had elementary schooling only, and both the father and the mother were brought up in manual working- class families.
DISCUSSION ON THE PAPER BY DR DOUGLAS, Miss Ross AND MR SIMPSON
Dr J. H. EDWARDS (proposing the vote of thanks): I can claim an objective criterion for being able to reply without bias in that I have unilateral myopia, a disability which I have successfully prevented being treated.
This paper has profound implications in terms not only of what is happening, but of what should happen, both in relation to a large number of casually accepted principles of selection and to the compulsive correction of visual defect, a panacea long advocated with the support of a horrific mythology in the virtual absence of data. If intellect and myopia are correlated, our airline pilots and our police officers would, on average, be a little more intelligent if they were not selected by a procedure more appropriate to the days of open cockpits and highwaymen.
The compensations of disability have a long and colourful history. Demosthenes stuttered as a child; Homer, Milton and Euler were blind; Beethoven's later music had the inspiration of silence, and Degas' sculpture was imposed on him by progressive blindness. In our own field and time Sir Ronald Fisher's extraordinary versatility as an intuitive geometer of hyperspace has been attributed to the extreme myopia from which he suffered.
This content downloaded from 91.229.248.152 on Wed, 25 Jun 2014 01:08:20 AMAll use subject to JSTOR Terms and Conditions
494 Discussion on Paper by Douglas, Ross and Simpson [Part 4,
A consideration of possible mechanisms involved opens up the complex issue of what we may call, in contemporary jargon, the balance between peripheral devices and central processing units. Our brain requires filtered stimuli from the senses which would otherwise flood it with irrelevance, and concept formation must involve filling in details beyond those provided. The normal mechanism appears to be that, at the level of the retina, bold lines are sifted from the mass of impulses, and the rest is suppressed. An extreme form of this is provided by the bug detectors of the eyes of amphibia, which reveal only moving objects. A myopic individual may have the distinction of possessing not the cartoonist's approach, but the impressionist's approach, to reality. It is possible that he may not always benefit if his imagination is frozen and the bold canvas of his retina replaced by the cold detail of a photograph, particularly if supported by the parental myth that glasses must always be worn.
It is also possible that myopia, rather than opening the mind's eye, blocks it and opens the mind's ear, which is perhaps a more conventional expectation. Galton worked on this and concluded that the blind heard no better than those who were sighted. Myopia might also release a large fragment of the brain normally used as an intermediary between eye and mind for duties which might be a little more appropriate to a predominantly "cortical" organism so that, in addition to stimulation of the visual imagination and stimulation of the auditory imagination, we have to consider the possibility of release of brain capacity. Fourthly, we have the possibility that myopia and cerebral activity are primarily uncor- related and are both due to faster growth, earlier puberty, social class, racial inhomogeneity and so on. Height and intellect are known to be sharply correlated.
I think the visual and auditory problems can to some extent be solved by splitting the intelligence test into verbal reasoning and the mathematical reasoning score, but I would welcome the opinions of the authors on this. As far as unrelated correlation of myopia and intelligence is concerned, it would seem that sibs form a good control, and it has been possible to use these on 50,000 births in Birmingham. It is possible to link the 11 + results into sibships using the address, surname, age and birth rank, and from this it is possible to use another sib as a control; for example, breech delivery may be compared with the results of normal deliveries and one can compare the intelligence of breech deliveries with that of other sibs who have had a vertex delivery. This could be done with prescriptions for glasses, which are available as non-confidential data, through the costing of glasses by the Executive Council. This is almost the only form of non-confidential medical data which I have come across.
So far as I understand the problem of inference, we have a three-dimensional universe of time, intellectual function as measured by some test, and eye defect as measured in dioptres. The development of most children can be represented by a line starting at birth with zero time, and near zero intellect and eye defect. As they grow up, this line should stay in the plane of zero dioptre defect while intellectual function increases with age. The authors have shown clearly that deviations from the plane of strong sight, in childhood, tend to be related to higher intelligence. Normally the vision of children as a whole can be represented by a large number of leashes and they will intersect this plane at a series of points. As far as I can see, the matter at issue is related to how this leash will intersect the planes of adult life. This is obviously exposed to the vagaries of puberty, and these are therefore biased inferences, but if represented from this bird's-eye view we would have the dioptres in one axis and intellectual function in another and we would have a large number of points where this leash cuts the plane common to these two axes. There may be a tendency for the distribution of these points to be elliptical, but if bad vision rather than myopia is the factor, it would be a U-shaped distribution, since the stronger sighted would send their sense data to the weaker brain but short-sighted and long-sighted eyes would have the same influence on cerebral activity as measured by the tests considered.
Unfortunately, for reasons explained in the text, the authors have been largely restricted to the use of data classified through arbitrary thresholds, and have been unable to work at the primary level of the variates. Not only is this intrinsically less informative, but the
This content downloaded from 91.229.248.152 on Wed, 25 Jun 2014 01:08:20 AMAll use subject to JSTOR Terms and Conditions
1967] Discussion on Paper by Douglas, Ross and Simpson 495
statistical procedures normally used in such cases, such as contingency table tests and more direct forms of variance splitting, do not seem to be either very helpful in practice, or very sound in theory, when applied to such observational data.
The point which seems to be of peculiar interest in this context, which is only soluble at the level of direct variate analysis, is "Is there really a minority which is distinct, or is this just one part of a big distribution?" Is there a distinct myopic elite which gropes its way up the social scale past the farseeing crowd?
Mr F. J. CREWS (seconding the vote of thanks): I wish to thank the Royal Statistical Society for giving eye surgeons the opportunity to hear the paper by Dr Douglas, Miss Ross and Mr Simpson. It is always stimulating to hear work by other people than ophthalmologists on matters of eye interest; there are only certain aspects of this paper on which I feel competent to comment.
The classification in Appendix A presents certain problems. The divisions of groups of myopia are different from the usual, also the definition of emmetropia; astigmatism is only mentioned briefly elsewhere in the paper. Degenerative myopia is not dealt with at all. In the Snellen test it would appear that only letters were used, whereas the E test is often more accurate at ages 5-7 years. It would be interesting to know if the racial incidence was analysed, as myopia has been suggested to be rarer in the Negro but common in Mongol races. There has been for a great many years an opinion that myopia is commoner in more civilized people, and in animals it is more frequent in domestic breeds.
With regard to parental care, one would like to find out if there was a connection between parental myopia-it would be expected that short-sighted parents would be more sympathetic.
The physical characteristics in this paper are rather against the nutritional theory which was in vogue in past years. It might be of interest to know further details about the early puberty, such as dates of closure of sutures or growth hormone studies. A variety of eye abnormalities (some of which include myopia) are associated with skeletal disorders; for example, arachnodactyly. Abnormal ocular mycopolysaccharides and collagen are found in myopia.
The authors do not appear to have established whether superiority of test performance comes before the onset of myopia as they are relying on subjective visual acuity examina- tions at infrequent intervals, and short sight comes on gradually. The fact that myopes tend to restrict their physical activities thus may be a natural protection as they are more liable to retinal detachment and other traumatic injuries, including those due to broken spectacles.
It would be interesting to see which professions are preferred by the myopic series: it used to be said it was advisable for eye surgeons to be short sighted. Finally, one wonders if the improvements in contact lenses will change the findings in this paper, as would be expected from theoretical considerations.
The vote of thanks was put to the meeting, and carried unanimously.
Dr PHILIP LEVY: I am sure that the final paragraph could well have been taken as the starting point of the paper. This says that short sight is largely genetically determined; that short-sighted men tend to marry short-sighted women; and that over the generations short-sighted families may have adapted their behaviour and attitudes towards education and towards employment in accordance with their defect. Now, the data may unquestion- ably support this summary, but the educational differences are not very large. If the typical mean score for those with perfect vision is taken as 50 points and the mean score for the short-sighted as 54, then with a standard deviation of about 10 score points the overlap of the distributions, and hence the close correspondence of the two groups, is perhaps the more remarkable finding in spite of the stereotypes concerning the "bookish" short-sighted pupils. To coin a rule: if the statistical reliability of a difference cannot be
This content downloaded from 91.229.248.152 on Wed, 25 Jun 2014 01:08:20 AMAll use subject to JSTOR Terms and Conditions
496 Discussion on Paper by Douglas, Ross and Simpson [Part 4,
demonstrated with sample sizes of about 30, then the difference probably has a low behavioural significance in the context of the total variability to be explained. What are the consequences of such a difference for social action or for a theory of development? There is an obvious danger, as always, of over-generalizing about the tendencies found. The danger is amply illustrated by some of Dr Edwards's contribution to this discussion.
The point is that the tables of data before us present only one or two variables at a time. In the process the essential "dynamics" of the short-sighted child are lost. What, for example, are the optimal conditions for educational progress in short-sighted children? We should ask, I suggest, some realistic compound or multivariate questions of Dr Douglas's records. For example: Do short-sighted children who are interested in sport do better or worse than others? Do the short-sighted children who are dull but said to be punctual and attentive make faster progress than their normally sighted intellectual equals at age eight, or their equals who are short-sighted but unpunctual and inattentive? These are just some of the simpler questions that I would like to ask in order to move closer to the way in which the short-sighted children actually operate with their defect. The "loose ends" referred to by Dr Douglas in his presentation of the paper do not appear to stretch this far.
I also note that what matching is done in some of the tables is done on the basis of social class rather than intelligence. It may be difficult to separate these variables in the educational process; but there may be advantages in using intelligence measures at age eight as the primary summary of early development since this would include the major effects of social class. Dr Douglas's attitude to intelligence measures is somewhat ambi- valent. Test scores of different kinds are accumulated as one for some tables, but non- verbal intelligence scores are used as predictors of reading scores in Table 13. The "psychologic" of this is not at all clear. In looking for other variables which might help to discount the overlap and thus demonstrate the importance of the difference in educa- tional progress, it would be useful to have information on a number of practical points. Which short-sighted children sit near the front of the class? Which of them actually wear their spectacles in school? Do some of them adopt special social roles in the classroom- monitor, whipping boy or swot-as a function of their defect?
Educational progress is clearly a multivariate problem. Only by studying combina- tions of factors chosen on the basis of well-formed models can we understand the effects of an isolated factor such as short-sightedness. I would have wished, therefore, for the general tendencies reported in this paper to have been relegated to an appendix, and for more information to be given about the interactions between short-sightedness and other variables.
Dr V. D. BARNETT: There are one or two general comments I should like to make on this paper. I found the paper most interesting in the impressive battery of evidence it presents of social, physical and educational differences between school children who are short sighted and those with perfect vision. The data analysed by the authors are certainly extremely detailed, extensive in their coverage and well prepared. They afford a unique opportunity to examine a whole variety of educational and sociological phenomena in this area. The basis of my comments concerns the extent to which the authors have exploited this opportunity. The presentation and discussion of their results are most clear and concise, but my feeling is that there is a certain lack of interpretative and explanatory comment on the effects they have observed: and also that rather more statistical detail in their work might have been of value.
Firstly, there is the question of sociological interpretation. The differences observed between the normal and short-sighted groups of school children are intriguing, but to me at least, with little experience of the social, medical or educational aspects of the problem, somewhat difficult to interpret. Personally I should have welcomed more discussion, by the authors, of this important question of interpretation. Indeed they often refer to inter- pretative discussion, by others, of medical or social aspects of the problem; only to dismiss
This content downloaded from 91.229.248.152 on Wed, 25 Jun 2014 01:08:20 AMAll use subject to JSTOR Terms and Conditions
1967] Discussion on Paper by Douglas, Ross and Simpson 497
this as discredited. It would be most useful to have a more detailed critique of earlier theories, as well as a more extended interpretation of the results of this paper by the authors. Their comments on this matter seem to be restricted to the somewhat fleeting remarks (in the final section) on possible hereditary effects. Possibly other speakers in the discussion may also have ideas on interpretation, and I look forward to hearing these.
Turning now to the statistical content of the paper, I have two particular comments to make.
There would appear to be very little specific exploitation of the basic longitudinal nature of the data, in the work presented in this paper. One of the important distinguishing features of the data lies in its continuity of observation of a common set of school children over many years. Perhaps the authors have made, or intend to make, more particular use of the time element in the data structure in other work; either on this immediate topic or on other matters of social or educational interest arising from the data. It would be interesting to have their comments on this.
The second point on statistical matters is a more specific one. The authors seldom refer to the precise statistical significance of any of the effects they are describing. Their narrative relating to individual tables consists in the main of a verbal summary of the contents of the tables, usually most concise and illuminating; but with no mention of statistical signifi- cance. I feel that the authors do themselves, and their results, a disservice in not referring to the weight of statistical evidence on which the observed effects are based. This is well illustrated, for instance, by Table 1 of Section 2. Here tie difference in proportionate incidence of short sight for girls and boys appears quite marked; but the evidence for differences between the social classes has to me, at least, far less intuitive appeal at first sight. Since so many of the later results in this section inevitably reflect (to greater or lesser extent) those of Table 1, it is important to know how statistically meaningful the effects in Table 1 really are. This is of course easily determined by an analysis of variance on the appropriately transformed entries in this table, or equivalently by x2 tests of association on the marginal totals. Both approaches reveal that in fact the sex and class effects are both highly significant: the former at the 0X1 per cent level, the latter at least at the 1 per cent level.
It is important that the class effect here is significant, since Table 1 might, in a sense, be regarded as the basic table for most of the discussion of social factors in Section 2. These other factors are highly confounded with social class and must reflect to some extent simply the results of Table 1. For instance, parents' education (Table 2), parental interest (Table 3), attendance of selective schools (Table 5) and school attendance records (Table 7) will all be highly correlated with social class. The implication of this is well illustrated (if somewhat exaggerated) by Table 2, where we might almost predict the results, from those of Table 1 together with the definition of social class given in Appendix B (the major feature in this definition being the parents' attendance of a selective(?) secondary school). A crude probability model suggested by Appendix B might be, for the fathers,
Class %Y Attending secondary school
Upper middle 90 Lower middle 50 Upper manual 10
Applying this to Table 1 we immediately estimate that 34 per cent of the fathers of short- sighted pupils attended secondary schools, whereas only 26 per cent of the fathers of normal-sighted children did so. This is very much what is presented in the second line of Table 2.
The small magnitude of the class effect in Table 1 and the correlation between the various social factors discussed throughout Section 2 raise two further points.
This content downloaded from 91.229.248.152 on Wed, 25 Jun 2014 01:08:20 AMAll use subject to JSTOR Terms and Conditions
498 Discussion on Paper by Douglas, Ross and Simpson [Part 4,
Firstly, it is important to know if Table 1 really says anything about short sight, or simply reflects some more basic difference between the social classes. The authors rule out one such possibility in their comment following Table 1. Are there others that might be explored? For instance, are the authors confident that the poorer communicability and intelligence of children from the lower social classes may not reflect on the assessment of their visual acuity based on Snellen wall charts? After all it is a rather small effect which is demonstrated by Table 1, and it would only need 40 or 50 such undetected cases of short sight out of the 3,775 children to explain it.
Secondly, the interrelationships of the social factors in Section 2 hamper any immediate assessment of their specific association with short-sightedness. Some study of partial correlations would be most informative here.
Mr H. M. FINUCAN: First, may I comment briefly on Dr Levy's remarks. If I under- stood correctly, he maintained that the differences demonstrated by the authors were unimportant, i.e. insignificant-in the non-statistical sense-and had no apparent practical consequences. In a way this is so but, on the other hand, knowledge of even small effects is worth acquiring, and only relatively extensive data can provide such knowledge; thus one should not appear to disparage the authors, who after all have demonstrated some statistically significant differences.
This leads to one of Dr Barnett's points on which I should like also to comment. As he said, the usual explicit statements of significance levels are absent from the authors' tables. This must reflect their conscious policy and can hardly be an oversight. In defence of such a policy it may be noted that in all cases various differences and effects are men- tioned in the text as a table is discussed and one assumes that such mention is reserved for effects which are significant. This produced (to my mind, at least) a very smooth and readable paper with all the major conclusions reported in prose.
The omission of these statements of significance did tempt me to apply some simple approximate methods to one or two aspects of the tabulated results. It was interesting to confirm that in Tables 1 and 7, certain effects which suggest themselves on a first inspection but are not mentioned by the authors are in fact not significant, and conversely that certain effects which they mention are indeed significant.
In Table 1 the large percentage (13) for upper middle class girls provokes the question "Is the sex difference more marked in this class ?" For a rapid test the other three classes were pooled, standard errors of each percentage taken as 100(pq/n)i, and the following differences with their standard errors, a2(X - y) = a2(X) + u2(y), computed:
Percentage short-sighted Boys Girls G minus B
Upper middle 5?1P5 13+2-5 8+2-9 Other 3 5+0 5 7+0-6 2?0-8
Difference 6? 3 0
The excitement at the occurrence of a difference equal to twice its standard error and the illusion of 0 05 significance is momentary only, for we have selected and tested the most extreme of four differences after inspection of the data and by a well-known rule the true significance level to be attached to the result is approximately 4 x 0 05, i.e. 0-2.
In a similar way in Table 7 the "15 only" column is anomalous by comparison with the other two short-sight columns in that it exhibits worst attendance at 15 while the other two are best at 15. A similar approximate treatment of the 3 x 3 table by the mechanics of analysis of variance and a test of the residuals against a theoretical variance of the form 1002 pq/n shows that this effect is not significant, after making a similar allowance for selec- tion of the largest residual. Details of the calculation will not be presented here and indeed these treatments of aspects of Tables 1 and 7 have no interest except to invite comparison with the true significance levels found by the authors, by applying more appropriate tests.
This content downloaded from 91.229.248.152 on Wed, 25 Jun 2014 01:08:20 AMAll use subject to JSTOR Terms and Conditions
1967] Discussion on Paper by Douglas, Ross and Simpson 499
In Table 6 a simple test based on this same pq/n approximation fails to confirm any significant difference due to short sight in the percentages of girls interested in sport only; that is to say the 14 per cent is not significantly different from the 18 per cent.
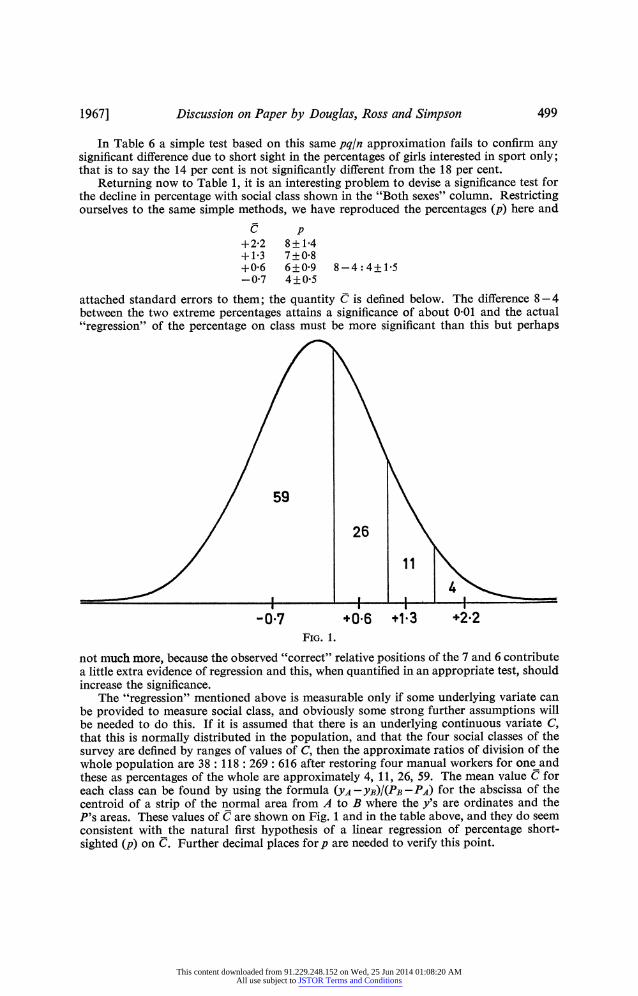
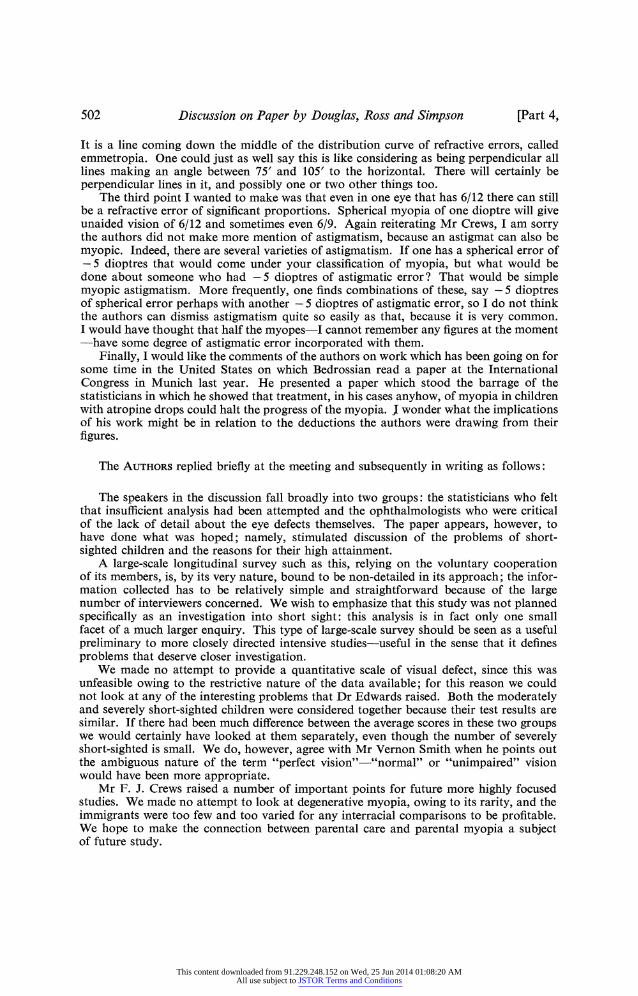
Returning now to Table 1, it is an interesting problem to devise a significance test for the decline in percentage with social class shown in the "Both sexes" column. Restricting ourselves to the same simple methods, we have reproduced the percentages (p) here and
C p +2-2 8?1P4 +1P3 7?0-8 +0-6 6?0-9 8-4:4+?15 -0 7 4?0 5
attached standard errors to them; the quantity C is defined below. The difference 8-4 between the two extreme percentages attains a significance of about 0 01 and the actual "regression" of the percentage on class must be more significant than this but perhaps
59
26
-0.7 +0.6 +1*3 +2*2 FIG. 1.
not much more, because the observed "correct" relative positions of the 7 and 6 contribute a little extra evidence of regression and this, when quantified in an appropriate test, should increase the significance.
The "regression" mentioned above is measurable only if some underlying variate can be provided to measure social class, and obviously some strong further assumptions will be needed to do this. If it is assumed that there is an underlying continuous variate C, that this is normally distributed in the population, and that the four social classes of the survey are defined by ranges of values of C, then the approximate ratios of division of the whole population are 38: 118: 269: 616 after restoring four manual workers for one and these as percentages of the whole are approximately 4, 11, 26, 59. The mean value C for each class can be found by using the formula (YA -YB)I(PB -PA) for the abscissa of the centroid of a strip of the normal area from A to B where the y's are ordinates and the P's areas. These values of C are shown on Fig. 1 and in the table above, and they do seem consistent with the natural first hypothesis of a linear regression of percentage short- sighted (p) on C. Further decimal places for p are needed to verify this point.
This content downloaded from 91.229.248.152 on Wed, 25 Jun 2014 01:08:20 AMAll use subject to JSTOR Terms and Conditions
500 Discussion on Paper by Douglas, Ross and Simpson [Part 4,
Mr T. LEWIS: This meeting in Birmingham is an enjoyable occasion, and the atmosphere most congenial. The Royal Statistical Society is to be congratulated on its enterprise in arranging it in a different centre from London; I hope there will be more such meetings.
I would like to thank the authors for their very stylishly presented paper. It is nice to get advance excerpts from books about to be published, just like reading the Sunday papers-I do hope, of course, that this one will get to be published, because there is Rule 1.4 of the R.S.S. which says: "Papers published in the Journal become the property of the Society."
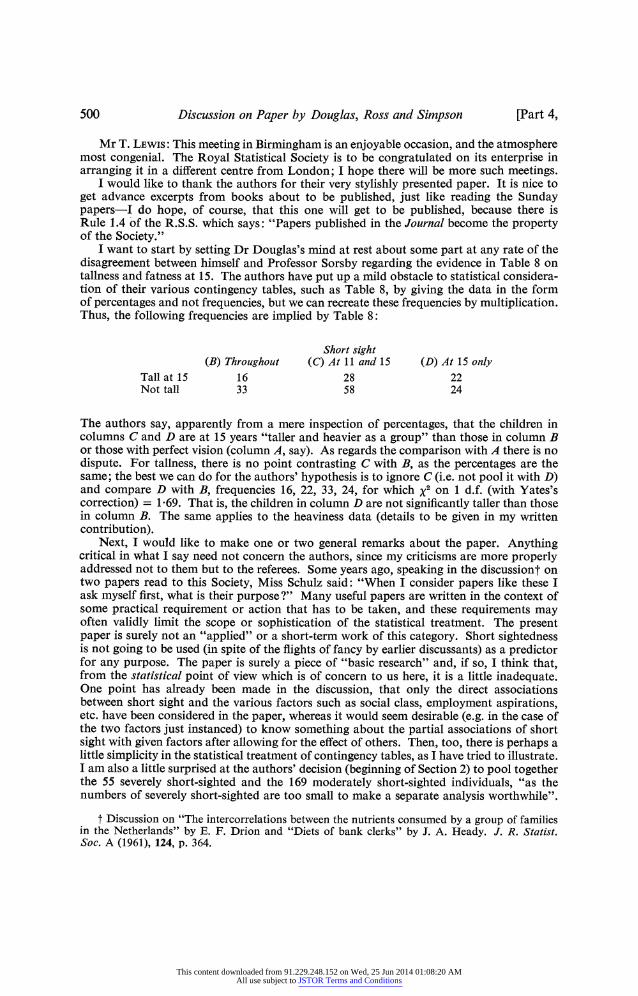
I want to start by setting Dr Douglas's mind at rest about some part at any rate of the disagreement between himself and Professor Sorsby regarding the evidence in Table 8 on tallness and fatness at 15. The authors have put up a mild obstacle to statistical considera- tion of their various contingency tables, such as Table 8, by giving the data in the form of percentages and not frequencies, but we can recreate these frequencies by multiplication. Thus, the following frequencies are implied by Table 8:
Short sight (B) Throughout (C) At 11 and 15 (D) At 15 only
Tall at 15 16 28 22 Not tall 33 58 24
The authors say, apparently from a mere inspection of percentages, that the children in columns C and D are at 15 years "taller and heavier as a group" than those in column B or those with perfect vision (column A, say). As regards the comparison with A there is no dispute. For tallness, there is no point contrasting C with B, as the percentages are the same; the best we can do for the authors' hypothesis is to ignore C (i.e. not pool it with D) and compare D with B, frequencies 16, 22, 33, 24, for which x2 on 1 d.f. (with Yates's correction) = 1X69. That is, the children in column D are not significantly taller than those in column B. The same applies to the heaviness data (details to be given in my written contribution).
Next, I would like to make one or two general remarks about the paper. Anything critical in what I say need not concern the authors, since my criticisms are more properly addressed not to them but to the referees. Some years ago, speaking in the discussiont on two papers read to this Society, Miss Schulz said: "When I consider papers like these I ask myself first, what is their purpose ?" Many useful papers are written in the context of some practical requirement or action that has to be taken, and these requirements may often validly limit the scope or sophistication of the statistical treatment. The present paper is surely not an "applied" or a short-term work of this category. Short sightedness is not going to be used (in spite of the flights of fancy by earlier discussants) as a predictor for any purpose. The paper is surely a piece of "basic research" and, if so, I think that, from the statistical point of view which is of concern to us here, it is a little inadequate. One point has already been made in the discussion, that only the direct associations between short sight and the various factors such as social class, employment aspirations, etc. have been considered in the paper, whereas it would seem desirable (e.g. in the case of the two factors just instanced) to know something about the partial associations of short sight with given factors after allowing for the effect of others. Then, too, there is perhaps a little simplicity in the statistical treatment of contingency tables, as I have tried to illustrate. I am also a little surprised at the authors' decision (beginning of Section 2) to pool together the 55 severely short-sighted and the 169 moderately short-sighted individuals, "as the numbers of severely short-sighted are too small to make a separate analysis worthwhile".
t Discussion on "The intercorrelations between the nutrients consumed by a group of families in the Netherlands" by E. F. Drion and "Diets of bank clerks" by J. A. Heady. J. R. Statist. Soc. A (1961), 124, p. 364.
This content downloaded from 91.229.248.152 on Wed, 25 Jun 2014 01:08:20 AMAll use subject to JSTOR Terms and Conditions
1967] Discussion on Paper by Douglas, Ross and Simpson 501
Since possible differences between the effects of severe and moderate short sight would appear to be of prime interest in the context of this study, and since the sizes of the samples are not necessarily small in relation to the familiar statistical techniques available to extract information from them, I feel this indicates a somewhat cavalier attitude towards the statistical requirements of the study. As time is short, I will leave the rest of my remarks for the written contribution.
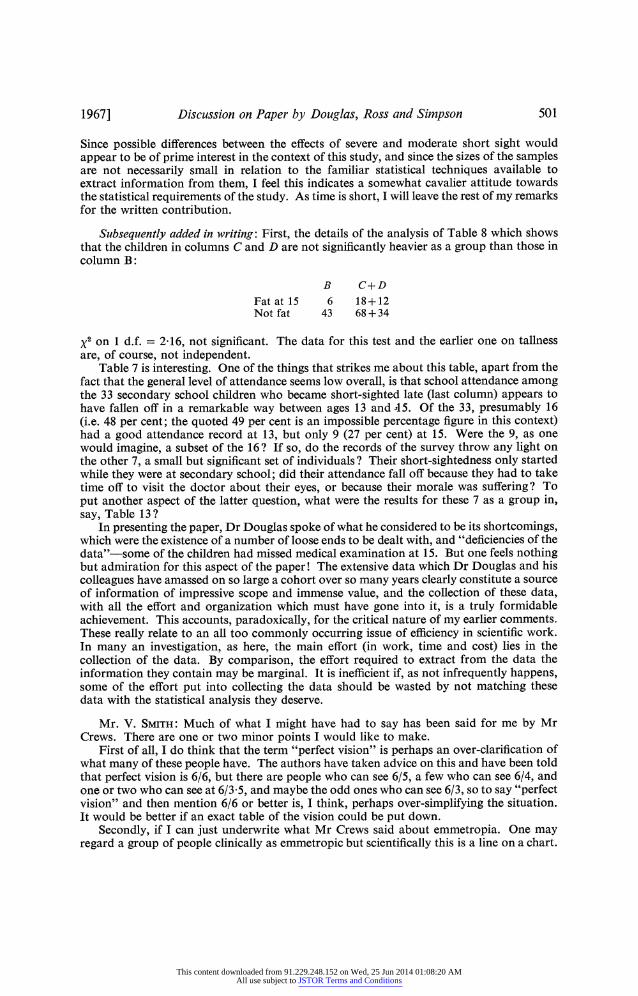
Subsequently added in writing: First, the details of the analysis of Table 8 which shows that the children in columns C and D are not significantly heavier as a group than those in column B:
B C+D
Fatatl5 6 18+12 Not fat 43 68 + 34
x2 on 1 d.f. = 2-16, not significant. The data for this test and the earlier one on tallness are, of course, not independent.
Table 7 is interesting. One of the things that strikes me about this table, apart from the fact that the general level of attendance seems low overall, is that school attendance among the 33 secondary school children who became short-sighted late (last column) appears to have fallen off in a remarkable way between ages 13 and 15. Of the 33, presumably 16 (i.e. 48 per cent; the quoted 49 per cent is an impossible percentage figure in this context) had a good attendance record at 13, but only 9 (27 per cent) at 15. Were the 9, as one would imagine, a subset of the 16? If so, do the records of the survey throw any light on the other 7, a small but significant set of individuals? Their short-sightedness only started while they were at secondary school; did their attendance fall off because they had to take time off to visit the doctor about their eyes, or because their morale was suffering? To put another aspect of the latter question, what were the results for these 7 as a group in, say, Table 13?
In presenting the paper, Dr Douglas spoke of what he considered to be its shortcomings, which were the existence of a number of loose ends to be dealt with, and "deficiencies of the data"-some of the children had missed medical examination at 15. But one feels nothing but admiration for this aspect of the paper! The extensive data which Dr Douglas and his colleagues have amassed on so large a cohort over so many years clearly constitute a source of information of impressive scope and immense value, and the collection of these data, with all the effort and organization which must have gone into it, is a truly formidable achievement. This accounts, paradoxically, for the critical nature of my earlier comments. These really relate to an all too commonly occurring issue of efficiency in scientific work. In many an investigation, as here, the main effort (in work, time and cost) lies in the collection of the data. By comparison, the effort required to extract from the data the information they contain may be marginal. It is inefficient if, as not infrequently happens, some of the effort put into collecting the data should be wasted by not matching these data with the statistical analysis they deserve.
Mr. V. SMITH: Much of what I might have had to say has been said for me by Mr Crews. There are one or two minor points I would like to make.
First of all, I do think that the term "perfect vision" is perhaps an over-clarification of what many of these people have. The authors have taken advice on this and have been told that perfect vision is 6/6, but there are people who can see 6/5, a few who can see 6/4, and one or two who can see at 6/3-5, and maybe the odd ones who can see 6/3, so to say "perfect vision" and then mention 6/6 or better is, I think, perhaps over-simplifying the situation. It would be better if an exact table of the vision could be put down.
Secondly, if I can just underwrite what Mr Crews said about emmetropia. One may regard a group of people clinically as emmetropic but scientifically this is a line on a chart.
This content downloaded from 91.229.248.152 on Wed, 25 Jun 2014 01:08:20 AMAll use subject to JSTOR Terms and Conditions
502 Discussion on Paper by Douglas, Ross and Simpson [Part 4,
It is a line coming down the middle of the distribution curve of refractive errors, called emmetropia. One could just as well say this is like considering as being perpendicular all lines making an angle between 75' and 105' to the horizontal. There will certainly be perpendicular lines in it, and possibly one or two other things too.
The third point I wanted to make was that even in one eye that has 6/12 there can still be a refractive error of significant proportions. Spherical myopia of one dioptre will give unaided vision of 6/12 and sometimes even 6/9. Again reiterating Mr Crews, I am sorry the authors did not make more mention of astigmatism, because an astigmat can also be myopic. Indeed, there are several varieties of astigmatism. If one has a spherical error of -5 dioptres that would come under your classification of myopia, but what would be done about someone who had -5 dioptres of astigmatic error? That would be simple myopic astigmatism. More frequently, one finds combinations of these, say -5 dioptres of spherical error perhaps with another -5 dioptres of astigmatic error, so I do not think the authors can dismiss astigmatism quite so easily as that, because it is very common. I would have thought that half the myopes-I cannot remember any figures at the moment -have some degree of astigmatic error incorporated with them.
Finally, I would like the comments of the authors on work which has been going on for some time in the United States on which Bedrossian read a paper at the International Congress in Munich last year. He presented a paper which stood the barrage of the statisticians in which he showed that treatment, in his cases anyhow, of myopia in children with atropine drops could halt the progress of the myopia. j wonder what the implications of his work might be in relation to the deductions the authors were drawing from their figures.
The AUTHORS replied briefly at the meeting and subsequently in writing as follows:
The speakers in the discussion fall broadly into two groups: the statisticians who felt that insufficient analysis had been attempted and the ophthalmologists who were critical of the lack of detail about the eye defects themselves. The paper appears, however, to have done what was hoped; namely, stimulated discussion of the problems of short- sighted children and the reasons for their high attainment.
A large-scale longitudinal survey such as this, relying on the voluntary cooperation of its members, is, by its very nature, bound to be non-detailed in its approach; the infor- mation collected has to be relatively simple and straightforward because of the large number of interviewers concerned. We wish to emphasize that this study was not planned specifically as an investigation into short sight: this analysis is in fact only one small facet of a much larger enquiry. This type of large-scale survey should be seen as a useful preliminary to more closely directed intensive studies-useful in the sense that it defines problems that deserve closer investigation.
We made no attempt to provide a quantitative scale of visual defect, since this was unfeasible owing to the restrictive nature of the data available; for this reason we could not look at any of the interesting problems that Dr Edwards raised. Both the moderately and severely short-sighted children were considered together because their test results are similar. If there had been much difference between the average scores in these two groups we would certainly have looked at them separately, even though the number of severely short-sighted is small. We do, however, agree with Mr Vernon Smith when he points out the ambiguous nature of the term "perfect vision" -"normal" or "unimpaired" vision would have been more appropriate.
Mr F. J. Crews raised a number of important points for future more highly focused studies. We made no attempt to look at degenerative myopia, owing to its rarity, and the immigrants were too few and too varied for any interracial comparisons to be profitable. We hope to make the connection between parental care and parental myopia a subject of future study.
This content downloaded from 91.229.248.152 on Wed, 25 Jun 2014 01:08:20 AMAll use subject to JSTOR Terms and Conditions
1967] Discussion on Paper by Douglas, Ross and Simpson 503
The E test was in fact used by some of the school doctors at the seven-year exami- nations. Our classification of myopia is based, however, only on the information obtained at the age of 15 years.
The nature of this enquiry precluded a physiological approach, and we were also unable to arrange for the frequent ophthalmological examinations which would have given us a clearer picture of the gradual onset of myopia.
Dr Philip Levy has pointed to the danger of over-generalization, and this we endorse. We do not, however, agree that 4 points of test score is a small difference. Similar dif- ferences between the performance of children from different sizes of family have, in the past, been the basis of much discussion and have even led to a national study of intelli- gence. In another context it should be noted that a 4-point superiority in attainment test score would have a considerable effect on streaming, selective school allocation and university entry.
Dr Levy criticizes our use of aggregate test scores. It might indeed have been clearer not to have shown these summarized scores in this paper; we use them routinely in the preliminary scanning of data, before embarking on detailed studies of the individual test scores.
Mr H. M. Finucan correctly observes that we consciously avoided detailed statements of statistical significance-this was partly to avoid bombarding the non-statistical (and even the statistical) reader with a galaxy of stars but we were also anxious to emphasize that it is the magnitude of an effect that is important. With a large number of children (at least normally sighted children) a difference of 0 5 may be statistically significant but the real question is whether it is of practical importance.
Dr V. D. Barnett's comments underline the difficulty of interpreting the results of a large-scale study. The consistent difference in each social class between the attainment and non-verbal test results of short-sighted children suggests, however, that visual acuity, even in the poorest families, is related to attainment rather than to intelligence. Dr Barnett seems to be asking for a time-series analysis, but of what? The educational scores, for example, were obtained at 8, 11 and 15 years and a time series is neither possible nor appropriate.
Mr T. Lewis may not expect a reply from us, as his remarks were addressed to the referees. We would hardly describe this paper as having the results of basic scientific research; it is rather observations on the natural history of short sight in a defined popu- lation of children. Other statistical techniques might perhaps have been usefully applied, but we still feel that our approach of cautious and necessarily tentative interpretation was right.
The reason for inserting figures on height in Table 8 was historical. These non-signifi- cant differences stimulated us to look at puberty where, as Mr Lewis implies, there is a statistically significant relationship between early maturation and the onset of short sight.
Mr Lewis's examination of the data on absence exemplifies the danger of trying to extract too much information from this type of study. If pushed too far, inconsistencies appear. (A good absence record incidentally was arbitrarily defined as being in the third of the survey population which had lost the least time from school.)
Mr Vernon Smith is sorry we did not make more mention of astigmatism. In about half the myopes astigmatic errors were recorded; we initially compared the test perfor- mance of the short-sighted pupils who had astigmatism with those who had no astigma- tism, and as we could find no differences between the two groups they were combined.
This content downloaded from 91.229.248.152 on Wed, 25 Jun 2014 01:08:20 AMAll use subject to JSTOR Terms and Conditions
504 Elections to Fellowship [Part 4,
As a result of the ballot taken during the meeting, the candidates named below were elected Fellows of the Society:
AL-ATRAQCHI, Mohammed Ali, Ph.D. GILLARD, Kenneth George, B.Sc. BAMFORD, John, B.Sc., D.A.E. KISH, Charles Laszlo, B.Sc. BRAMBILLA, Francesco, Doctor of MIDGLEY, Eric Arthur
Economics MORGAN, David Thomas Keith, M.Sc. BROEMELING, Lyle David, B.A., M.S., Ph.D. PARSONS, Lieselott DEMPSTER, Arthur Pentland, B.A., Ph.D. ROBINSON, Michael Douglas, B.A., F.I.A. DRAKATOS, Constantine, Ph.D. SAVEGE, Norma Jean, B.A.
Corporate Representatives
BASTENAIRE, Frangois Albert Guy representing Institut de Recherches de la Siderurgie Frangaise
BRIGHTLEY, Michael, B.Sc.Econ.(Lond.) representing The Institute of Electoral Research LOSHAK, Harry representing Department of Applied Economics, University of Cambridge VALDEMAR, Anna Christina, B.A., M.Sc. representing Ministry of Power, Headquarters
(London)
This content downloaded from 91.229.248.152 on Wed, 25 Jun 2014 01:08:20 AMAll use subject to JSTOR Terms and Conditions