Embed Size (px)
Citation preview

1
The 2012 Consumer Financial Literacy Survey
Prepared For:
The National Foundation for Credit Counseling and
The Network Branded Prepaid Card Association
Prepared By:
Harris Interactive Inc.
Public Relations Research

2
Survey Methodology The 2012 Financial Literacy survey was conducted by telephone within the United States by Harris Interactive on behalf of the NFCC (National Foundation for Credit Counseling) and the NBPCA (the Network Branded Prepaid Card Association) between March 16 and March 19, 2012 among 1,007 adults ages 18+. Results were weighted for age, sex, geographic region, and race where necessary to align them with their actual proportions in the population. All sample surveys and polls, whether or not they use probability sampling, are subject to multiple sources of error which are most often not possible to quantify or estimate, including sampling error, coverage error, error associated with nonresponse, error associated with question wording and response options, and post-survey weighting and adjustments. Therefore, Harris Interactive avoids the words “margin of error” as they are misleading. All that can be calculated are different possible sampling errors with different probabilities for pure, unweighted, random samples with 100% response rates. These are only theoretical because no published polls come close to this ideal.
Significance Testing When results from sub-groups of a sample appear in the detailed tabulations, an indicator of statistically significant differences is added to the tables run on our standard demographic banners. Significance testing is done to the 95% confidence level, and the test is performed on percentages as well as mean values. Each sub-sample is assigned a letter. When the percentage of one sub-sample is significantly different from the percentage of another sub-sample, the letter representing one of the two samples appears next to the percentage (or mean) of the other sample. For instance, the percentage of males answering yes to a particular question may be compared to the percentage of females answering yes to the same question. In the example below, the male sample is assigned the letter B, and the female sample is assigned the letter C. Here, respondents were asked whether a certain business practice is acceptable. 67% of women said that it was -- a proportion significantly greater than the 57% of males who believe that the practice is acceptable. To indicate that women are significantly more likely to find the practice acceptable than are men, the letter B -- the letter assigned to the male sub-sample -- appears next to the “67%” in the female column. Similarly, the 37% of men that find the practice unacceptable is significantly greater than the 29% of women who do so and, therefore, the letter C -- the letter assigned to the female sub-sample -- appears next to the “37%” in the male column.
Sex
Total
Male Fe-
male (A) (B) (C) Unweighted Total 977 488 489 Weighted Total 967 464 503 Acceptable 611 274 337 63% 57% 67%B Not Acceptable 319 171 148 33% 37%C 29% Don’t Know 37 18 19 4% 4% 4%
Region Breaks in the Data Tables The continental United States are divided into four (4) regions as follows: Northeast: ME, NH, VT, MA, RI, CT, NY, NJ, PA Midwest: OH, IN, IL, MI, WI, MN, IA, MO, ND, SD, NE, KS South: DE, MD, DC, VA, WV, NC, SC, GA, FL, KY, TN, AL, MS, AR, LA, OK, TX West
: MT, ID, WY, CO, NM, AZ, UT, NV, WA, OR, CA
“Metro” vs. “Non-metro” breakdown is across all 4 regions as follows: Metro: in center city of metropolitan area; outside center city, inside center city county; inside suburban county of
metropolitan area; in metropolitan area with no center city Non-metro
: in non-metropolitan area

3
Key Findings Budget As in previous years, in 2012, just over two in five U.S. adults (43%) report that they have a budget and keep close track of their expenditures. More than half (56%) admit they do not have a budget, including more than 1 in 5 (22%) who say they don’t have a good idea of how much they spend on housing, food, and entertainment. Bills Though the likelihood of having a budget has not changed over the past 5 years, the proportion of adults who do not pay all of their bills on time has increased from 28% in 2011 to 33% in 2012 – that is, fully one-third of U.S. adults, or more than 77 million Americans, do not pay all of their bills on time. Debt If they were facing financial problems related to debt, U.S. adults continue to say they would first turn to their friends and family for help (27%). This year, however, more than one in ten (13% 2012 vs. 8% in 2011) say they would reach out to the lender or credit card company to see what solutions they might be able to offer. Getting Money When they get paid by an employer or receive benefits from a government agency, the majority of U.S. adults (69%) receive an electronic check that is directly deposited into their bank account, and about one in three (32%) receive a paper check that they manually deposit into their account. About one in ten adults (11%) get direct deposit to a prepaid debit card, and 8% receive a paper check that they manually deposit to a prepaid card. Savings Two in five adults (40%) say they are now saving less than last year, and nearly the same proportion (39%) do not have any non-retirement savings. Though there had been an increase in the proportion of adults who have savings between 2008 (63%) and 2010 (67%), that proportion had begun (and now continues) to decline since 2010 (67% 2010, 64% 2011, 59% 2012). Spending As in 2011 – but contrary to 2010 and 2009, when half (or more) of adults were spending less – more than one in four U.S. adults (28%) say they are now spending more than last year. The proportion of adults indicating they are spending less compared to the previous year has steadily declined since 2009, when this question was first asked (57% 2009, 51% 2010, 42% 2011, 39% 2012). Credit Though the proportion of adults who have ordered or received their credit score in the past 12 months has increased significantly since last year (44% 2012 vs. 37% 2011), most adults have reviewed neither their credit score (55%) nor their credit report (62%). Credit Cards Nearly two in five Americans (39%) carry credit card debt from month to month – a proportion that has remained largely unchanged since 2010 (41% 2010, 40% 2011). Compared to 2011, however, U.S. adults are now more likely to have applied (15% 2012 vs. 10% 2011), and been rejected (7% 2012 vs. 4% 2011), for a new credit card. Mortgage Compared to 2010 and 2011, U.S. adults are now significantly more likely to feel there are circumstances which may justify defaulting on a mortgage (86% 2012 vs. 82% 2011 and 80% 2010). Specifically, Americans are now more likely to think it’s acceptable to default on a mortgage if the borrower can no longer afford the monthly payment (55% 2012 vs. 49% 2011 and 46% 2010) or needs to relocate (31% 2012 vs. 26% 2011 and 2010). Knowledge of Personal Finance Americans continue to learn about personal finance primarily from their parents or at home (44%), yet 4 in 5 adults (80%) – a greater proportion than last year (76% 2011) – admit they could benefit from additional advice and answers to everyday financial questions from a professional. In fact, like last year, many adults (42% 2012, 41% 2011) now give themselves a grade of C, D, or F on their knowledge of personal finance, marking a statistically significant change from 2010, when as many as nearly 2 in 3 adults (65%) gave themselves an A or B.

4
Key Findings (continued) Prepaid Debit Cards In the past 12 months, 15% of U.S. adults, or more than 35 million Americans, have used a prepaid debit card. And, 13%, or about 30.5 million Americans, typically use such cards to pay for everyday transactions such as groceries, gas, dining out, paying bills, and shopping online. Those who regularly use prepaid debit cards1
do so primarily because they are convenient (78%). Additionally, nearly three in four cite the inability to overspend (72%) and/or increased safety versus carrying cash (73%). Only one in four (25%) say they use prepaid debit cards because they have no other payment or banking options.
In fact, more than half of prepaid debit card users (53%) say they have other banking options but prefer to use a prepaid debit card for most of their everyday transactions, and more than one in three (36%) strongly agree. About three in four (74%) say their prepaid debit card is a better value than a credit card or debit card, and seven in ten (70%) say they feel more in control of their money with a prepaid debit card than a debit card connected to a bank or credit union checking account (nearly half – 46% – strongly agree). The vast majority of prepaid debit card users (89%) do not feel embarrassed when they pay with a prepaid debit card rather than a credit card or debit card from a bank or credit union, and as many as two in three (66%) strongly disagree.
1 Caution – small base (<100). Results should be interpreted as qualitative, or directional, in nature.

5
Posted Topline Data
Q1 (R1) Total 2012 %
Total 2011 %
Total 2010 %
Total 2009 %
Total 2008 %
Total 2007 %
Which of the following best describes how you manage your money?
Base: Adults 18+
(n= 1,007) (n= 1,010) (n= 2,028) (n= 1,000) (n= 1,001) (n= 1,003)
A B C D E F
You have a budget and keep close track of how much you spend on such things as food, housing and entertainment
43 43 43 F 42 42 39
Don’t have a budget (Net) 56 56 56 57 N/A N/A
You have a somewhat good idea about how much you spend on such things as food, housing and entertainment, but you don’t keep strict track of your spending on these things
34 34 37 39 AB 35 36
You don’t have a good idea how much you spend on such things as food, housing and entertainment, but you keep track of your overall spending and try to stay within certain limits that you’ve set for yourself
15 DE 15 DE 14 D 11 12 15 DE
You don’t have a good idea how much you spend on such things as food, housing and entertainment, and you often don’t keep track of your overall spending
7 C 7 C 5 7 C 7 C 7 C
Don’t know 1 1 1 1 2 C 2 C
Refused * * * * 2 ABCD 1

6
Q2 (R2) Total 2012 %
Total 2011 %
Total 2010 %
Total 2009 %
Total 2008 %
Which of the following best describes your financial situation?
Base: Adults 18+
(n= 1,007) (n= 1,010) (n= 2,028) (n= 1,000) (n= 1,001)
A B C D E
You pay all of your bills on time and have no debts in collection
64 68 69 A 70 A 69 A
Do not pay all bills on time (Net) 33 BCD 28 28 26 N/A
You sometimes miss a payment but have no debts in collection 15 DE 14 DE 13 D 10 11
You struggle to pay your bills every month but have no debts in collection
11 B 8 9 10 9
You are getting calls from collectors and struggle to pay your bills every month 4 4 4 4 5
You are seriously considering filing for bankruptcy or have filed for bankruptcy in the past three years
3 2 2 2 2
I am not involved at all in any financial decisions including how money is spent in our household (VOL)
1 1 2 ABD 1 2
Don’t know 2 C 2 C 1 1 2 C
Refused * 1 1 1 1
Special Net: No debts in collection 90 89 91 91 N/A
Special Net: Debts in collection 7 7 6 6 N/A

7
*Multiple responses were allowed.
Q3 (R2B) Total 2012 %
When you get paid – for example, by an employer or benefits from a government agency – how do you typically get the money? Do you receive…? *
Base: Adults 18+ (n= 1,007)
Any (Net) 96
Electronic check (Sub-net) 73
An electronic check that is directly deposited into your account at a bank or credit union 69
An electronic check that is directly deposited to a prepaid debit card, such as a non-credit Visa or MasterCard on which you can load your own funds or receive government payroll funds
11
Paper check (Sub-net) 38
A paper check that you then manually deposit into your account at a bank or credit union
32
A paper check that you then cash at a check cashing store 11
A paper check that you then manually deposit to a prepaid debit card, such as a non-credit Visa or MasterCard on which you can load your own funds or receive government payroll funds
8
Cash 12
Some other form of payment 4
None of these 3
Don’t know *
Refused 1
Special Net: Prepaid debit card 16

8
*Multiple responses were allowed.
Q4 (R3) Total 2012 %
Total 2011 %
Total 2010 %
Total 2009 %
Total 2008 %
Do you have any savings, excluding retirement savings?
Base: Adults 18+
(n= 1,007) (n= 1,010) (n= 2,028) (n= 1,000) (n= 1,001)
A B C D E
Yes 59 64 A 67 AE 65 A 63
No 39 BCD 33 30 32 36 C
Don’t know * 1 1 * *
Refused 2 2 2 E 2 1
Q5 (R4A/B) Total 2012 %
Where do you currently keep your non-retirement savings? / If you were to start saving, but not specifically for retirement, where do you think you would keep your savings? *
Base: Have any savings, excluding retirement savings
(n= 672)
Base: Do not have any savings, excluding retirement savings
(n= 313)
Any (Net) 98 97
Account at bank or credit union (Sub-net) 85 75
In a savings account at a bank or credit union 78 69
In a checking account at a bank or credit union 50 42
In a non-retirement investment account such as mutual funds or other brokerage platform
45 26
At home in cash 11 25
In a savings program for a prepaid debit card, such as a non-credit Visa or MasterCard on which you can load your own funds or receive government payroll funds
5 19
Somewhere else 17 17
None of these * 3
Don’t know * *
Refused 1 *

9
Q6 (R5) Total 2012 %
Total 2011 %
Total 2010 %
Total 2009 %
Total 2008 %
On average, what percentage of your household’s income do you save every year for retirement?
Base: Adults 18+
(n= 1,007) (n= 1,010) (n= 2,028) (n= 1,000) (n= 1,001)
A B C D E
0% or nothing 36 E 32 33 E 33 E 28
Any (Net) 59 61 D 59 56 N/A
1% to 10% 35 35 35 34 33
11% to 20% 16 17 17 16 16
More than 20% 8 9 D 7 6 8
Already retired (VOL) N/A N/A N/A N/A 8
Don’t know 4 4 5 8 ABC 6 AB
Refused 2 3 3 2 2
Q7 (R6) Total 2012 %
Total 2011 %
Total 2010 %
Total 2009 %
Total 2008 %
Do you currently have a home mortgage of any type?
Base: Adults 18+
(n= 1,007) (n= 1,010) (n= 2,028) (n= 1,000) (n= 1,001)
A B C D E
Yes 38 41 44 A 42 45 A
No 62 CDE 58 55 57 54
Paid off within the last 12 months (VOL) N/A N/A N/A N/A 1
Don’t know 0 1 * * *
Refused * 1 1 1 *
Q7 (R6) Total 2012 %
Total 2011 %
Total 2010 %
Total 2009 %
Total 2008 %
Total 2007 %
Do you currently have a home mortgage of any type? Base: Homeowners
(n= 735) (n= 782) (n= 1,547) (n= 753) (n= 752) (n= 753)
A B C D E F
Yes 58 E 58 EF 61 EF 59 EF 45 53 E
No 42 41 38 40 54 ABCDF 46 BCD
Paid off within the last 12 months
N/A N/A N/A N/A 1 -
Don’t know 0 * * * * *
Refused * 1 * 1 * 1

10
* Multiple responses were allowed.
Q8 (R9) Total 2012 %
Total 2011 %
Total 2010 %
Under what circumstances, if any, would you consider it justifiable for someone to default on a mortgage? *
Base: Adults 18+
(n= 1,007) (n= 1,010) (n= 2,028)
A B C
Any (Net) 86 BC 82 80
The borrower was misled about the terms of the loan
56 C 54 C 49
The borrower could no longer afford the monthly payment
55 BC 49 46
The lender would not work with the borrower to modify the mortgage
47 C 43 43
The emotional stress of trying to meet the payment each month is overwhelming
33 34 AC 30
The property is now worth less than what is owed on it
24 29 C 23
The borrower needs to relocate 31 BC 26 26
The property is not the borrower’s primary residence 16 17 16
The property is an investment property only 16 16 14
Other 30 BC 24 C 18
None 12 16 A 15 A
Don’t know 2 2 4 AB
Refused * * 1
11
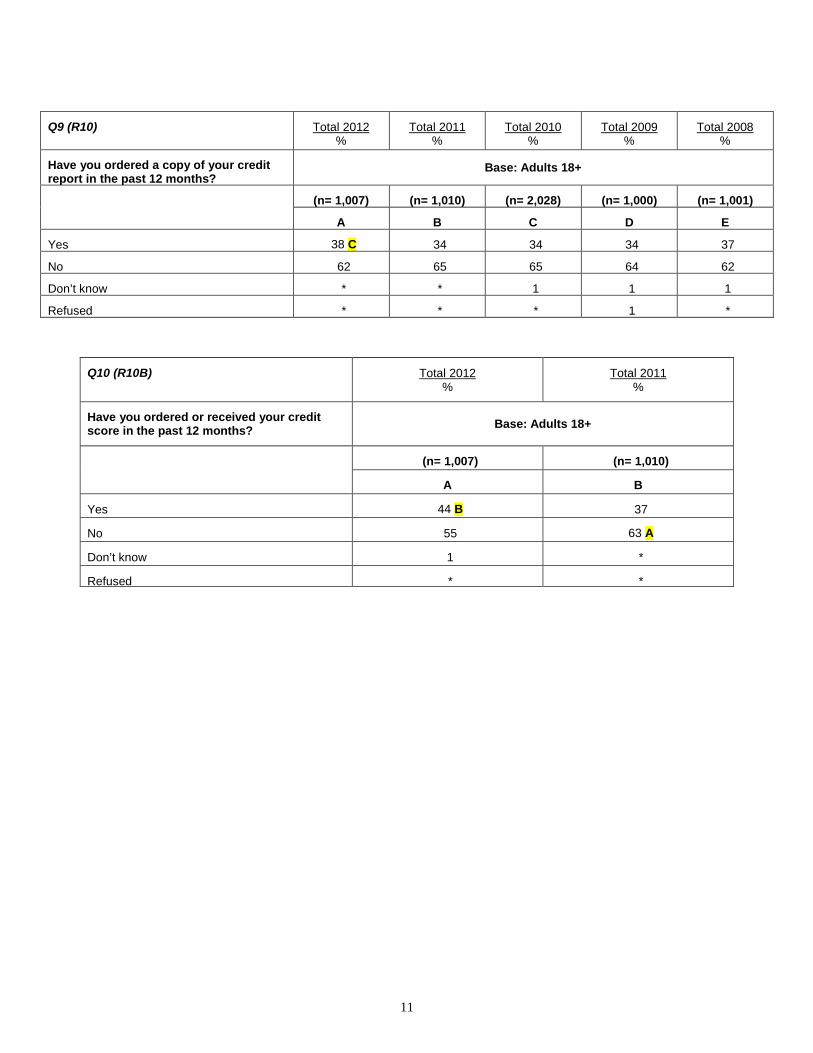
Q9 (R10) Total 2012 %
Total 2011 %
Total 2010 %
Total 2009 %
Total 2008 %
Have you ordered a copy of your credit report in the past 12 months?
Base: Adults 18+
(n= 1,007) (n= 1,010) (n= 2,028) (n= 1,000) (n= 1,001)
A B C D E
Yes 38 C 34 34 34 37
No 62 65 65 64 62
Don’t know * * 1 1 1
Refused * * * 1 *
Q10 (R10B) Total 2012 %
Total 2011 %
Have you ordered or received your credit score in the past 12 months? Base: Adults 18+
(n= 1,007) (n= 1,010)
A B
Yes 44 B 37
No 55 63 A
Don’t know 1 *
Refused * *

12
Q11 (R12) Total 2012 %
Total 2011 %
Total 2010 %
Total 2009 %
Roughly how much credit card debt, if any, does your household carry from month to month?
Base: Adults 18+
(n= 1,007) (n= 1,010) (n= 2,028) (n= 1,000)
A B C D
Any (Net) 39 40 41 44 A
Less than $2,500 (Subnet) 25 28 25 28
$1 to $499 10 14 AD 13 A 11
$500 to $999 6 6 5 7 C
$1,000 to $2,499 9 8 8 10
$2,500 or more (Subnet) 14 12 16 B 16 B
$2,500 to $4,999 5 4 5 5
$5,000 to $9,999 5 B 3 5 B 5 B
$10,000 or more 4 4 5 6 AB
None 53 CD 50 48 46
Don’t know 4 5 7 AB 6 A
Refused 4 6 ACD 4 4

13
Q12 (R13) Total 2012 %
Total 2011 %
Total 2010 %
Total 2009 %
In the last 12 months, have you…? * Base: Adults 18+
(n= 1,007) (n= 1,010) (n= 2,028) (n= 1,000)
A B C D
Any (Net) 38 B 30 40 B 40 B
Cancelled a credit card 13 12 17 AB 15 B
Been late making a credit card payment 11 9 12 B 15 ABC
Applied for a new credit card 15 BCD 10 12 11
Missed a credit card payment 8 B 5 8 B 8 B
Transferred the balance from one credit card to another 5 5 6 7
Been rejected for a new credit card 7 BC 4 5 6 B
Made a payment that was less than the minimum
4 4 5 7 ABC
Obtained a cash advance from your credit card company 3 4 4 4
Consolidated your credit card debt into a personal bill consolidation loan
1 2 2 A 2
None of these 61 69 ACD 59 58
Don’t know 0 * * *
Refused * 1 1 1 * Multiple responses were allowed.

14
* Multiple responses were allowed.
Q13 (R13AA) Total 2012 %
In the past 12 months, what financial services, if any, have you used? * Base: Adults 18+ (n= 1,007)
Any (Net) 90
Account at bank or credit union (Subnet) 77
Checking account at a bank or credit union 72
Savings account at a bank or credit union 53
Debit card/Prepaid debit card (Subnet) 64
Debit card connected to a checking account at a bank or credit union 58
Prepaid debit card, such as a non-credit Visa or Mastercard on which you can load your own funds or receive government or payroll funds
15
Credit card 48
Non-retirement investment account such as mutual funds or other brokerage platform 17
Overdraft from your checking account at a bank or credit union 16
Check cashing store 6
Payday or title lender 3
Some other type of financial service 8
None of these 10
Don’t know 0
Refused *

15
Q14 (R14) Total 2012 %
Total 2011 %
Total 2010 %
Total 2009 %
Compared to one year ago, how has the current economic climate affected your spending? Are you now spending…?
Base: Adults 18+
(n= 1,007) (n= 1,010) (n= 2,028) (n= 1,000)
A B C D
More (Net) 28 CD 26 CD 18 18
A lot more than last year 10 D 9 8 7
A little more than last year 18 CD 17 CD 10 10
The same as last year 32 D 31 D 31 D 24
Less (Net) 39 42 51 AB 57 ABC
A little less than last year 19 23 A 28 AB 30 AB
A lot less than last year 21 19 23 B 27 ABC
Don’t know * 1 1 *
Refused * * * 1
Q15 (R16) Total 2012 %
Total 2011 %
Total 2010 %
Total 2009 %
Compared to one year ago, how has the current economic climate affected your saving habits? Are you now saving…?
Base: Adults 18+
(n = 1,007) (n= 1,010) (n= 2,028) (n= 1,000)
A B C D
More (Net) 21 22 24 23
A lot more than last year 5 7 8 A 9 A
A little more than last year 16 14 17 B 15
The same as last year 38 41 38 39
Less (Net) 40 CD 36 36 35
A little less than last year 19 D 19 D 18 D 15
A lot less than last year 21 C 18 17 20 C
Don’t know 1 1 1 1
Refused 0 * 1 2 ABC

16
*Multiple responses were allowed.
*Multiple responses were allowed. ** Caution – small base.
Q16 (R17A) Total 2012 %
How do you typically pay for everyday transactions including, but not limited to, groceries, gas, dining out, paying bills and online shopping, etc.? Please answer yes to any of these that you ever use. Do you use…? *
Base: Adults 18+ (n= 1,007)
Cash 89
Debit card/Prepaid debit card (Net) 68
A debit card connected to a checking account at a bank or credit union 63
A prepaid debit card, such as a non-credit Visa or Mastercard on which you can load your own funds or receive government or payroll funds
13
Checks 55
Credit card 53
Some other form of payment 10
Don’t know 1
Refused *
Q17 (R18A) Total 2012 %
Why do you use prepaid debit cards? Is it because…? * Base: Typically pay for
transactions using a prepaid debit card
(n= 89**)
Any (Net) 97
They are convenient 78
They are safer than carrying cash 73
You are not able to overspend, or spend money you don’t have 72
They enable you to better manage your money 56
Your money would be replaced if the card is lost or stolen 53
There is no minimum balance requirement 52
They offer lower or fewer fees than your other payment or banking options 36
You have no other payment or banking options 25
Some other reason 28
None of these 1
Don’t know 2
Refused 0

17
** Caution – small base.
** Caution – small base.
Q18 (R19A-A) Total 2012 %
How strongly do you agree or disagree with the following statement?
You feel more in control of your money with a prepaid debit card than a debit card connected to a checking account at a bank or credit union.
Base: Typically pay for transactions using a prepaid debit card
(n= 89**)
Agree (Net) 70
Strongly agree 46
Somewhat agree 25
Disagree (Net) 30
Somewhat disagree 13
Strongly disagree 16
Don’t know 0
Q18 (R19A-B) Total 2012 %
How strongly do you agree or disagree with the following statement?
You have other banking options such as credit cards or a debit card from a bank or credit union, but you prefer to use a prepaid debit card for most of your everyday transactions.
Base: Typically pay for transactions using a prepaid debit card
(n= 89**)
Agree (Net) 53
Strongly agree 36
Somewhat agree 17
Disagree (Net) 46
Somewhat disagree 23
Strongly disagree 23
Don’t know 1

18
** Caution – small base.
** Caution – small base.
Q18 (R19A-C) Total 2012 %
How strongly do you agree or disagree with the following statement?
You have been surprised by a bank or credit union in the past, for example, with unexpected charges, holds on your money, or overdraft fees.
Base: Adults 18+ (n= 1,007)
Base: Typically pay for transactions using a prepaid debit card
(n= 89**)
Agree (Net) 39 53
Strongly agree 22 36
Somewhat agree 17 17
Disagree (Net) 56 45
Somewhat disagree 16 17
Strongly disagree 41 28
Don’t know 4 2
Q18 (R19A-D) Total 2012 %
How strongly do you agree or disagree with the following statement?
You have been surprised by a prepaid debit card in the past, for example, with unexpected charges, holds on your money, or overdraft fees.
Base: Typically pay for transactions using a prepaid debit card
(n= 89**)
Agree (Net) 26
Strongly agree 11
Somewhat agree 16
Disagree (Net) 71
Somewhat disagree 20
Strongly disagree 51
Don’t know 2

19
** Caution – small base.
** Caution – small base.
Q18 (R19A-E) Total 2012 %
How strongly do you agree or disagree with the following statement?
Your prepaid debit card is a better value, or costs you less, than using a credit card or a debit card connected to a checking account at a bank or credit union.
Base: Typically pay for transactions using a prepaid debit card
(n= 89**)
Agree (Net) 74
Strongly agree 43
Somewhat agree 31
Disagree (Net) 25
Somewhat disagree 14
Strongly disagree 11
Don’t know 1
Q18 (R19A-F) Total 2012 %
How strongly do you agree or disagree with the following statement?
You feel embarrassed when you pay with a prepaid debit card rather than a credit card or debit card from a bank or credit union.
Base: Typically pay for transactions using a prepaid debit card
(n= 89**)
Agree (Net) 11
Strongly agree 6
Somewhat agree 5
Disagree (Net) 89
Somewhat disagree 23
Strongly disagree 66
Don’t know 0

20
Q19 (R20) Total 2012 %
Total 2011 %
Total 2010 %
Total 2009 %
Total 2008 %
Thinking now about what you have learned about personal finance, where do you think that you learned the most?
Base: Adults 18+
(n= 1,007) (n= 1,010) (n= 2,028) (n= 1,000) (n= 1,001)
A B C D E
Any (Net) 90 BCD 84 86 86 N/A
From your parents or at home 44 D 42 D 41 D 37 40
From school 10 CE 9 C 6 9 C 7
From self-help books or media 8 8 15 ABE 15 ABE 9
From a financial professional 10 8 8 12 BC 10
At work 5 7 CD 5 4 6 D
From friends 7 6 6 6 5
From the Internet 6 BCD 4 4 4 N/A
Spouse or partner (VOL) N/A N/A N/A N/A 2
Learned on own/myself (VOL) N/A N/A N/A N/A 15
None of these 9 15 AD 13 A 12 A N/A
Don’t know * 1 1 1 4
Refused * * * 1 2
Q20 (R21) Total 2012 %
Total 2011 %
Total 2010 %
Total 2009 %
On a scale from A to F, what grade would you give yourself in terms of your knowledge about personal finance?
Base: Adults 18+
(n= 1,007) (n= 1,010) (n= 2,028) (n= 1,000)
A B C D
A/B (Net) 58 57 65 ABD 58
A 19 21 22 D 18
B 39 37 42 B 40
C 29 30 C 26 29
D/F (Net) 12 C 11 C 8 12 C
D 9 7 7 9
F 4 C 5 CD 2 3
Don’t know * 1 1 1
Refused * * * 1

21
Q21 (R21A) Total 2012 %
Total 2011 %
If you were having financial problems related to debt, which of the following, if any, would you turn to for help first? Base: Adults 18+
(n= 1,007) (n= 1,010)
A B
Any (Net) 95 B 92
Your friends and family 27 24
A financial professional such as a Certified Public Accountant (CPA) or financial planner
14 18 A
A do-it-yourself tool to help you pay down debt yourself 14 15
The lender or credit card company to see what solutions they could offer
13 B 8
The lender or credit card company specifically about settling the debt for less than the balance owed
6 7
A professional non-profit credit counseling agency 4 7 A
A debt settlement company to settle the debt for less than the balance owed
3 3
A bankruptcy attorney 2 2
Some other person or place 11 10
None of these 4 5
Don’t know 1 2
Refused 0 *
Q22 (R22) Total 2012 %
Total 2011 %
Total 2010 %
Total 2009 %
How strongly do you agree or disagree with the following statement?
Considering what you already know about personal finance, you could still benefit from some advice and answers to everyday financial questions from a professional.
Base: Adults 18+
(n= 1,007) (n= 1,010) (n= 2,028) (n= 1,000)
A B C D
Agree (Net) 80 B 76 78 80 B
Strongly agree 32 B 28 31 35 BC
Somewhat agree 48 48 46 45
Disagree (Net) 19 23 AD 21 19
Somewhat disagree 10 12 10 10
Strongly disagree 9 11 D 12 AD 8
Don’t know 1 1 1 1
Refused 0 * * *

22
Q23 (R23) Total 2012 %
Total 2011 %
Total 2010 %
Total 2009 %
Total 2008 %
Total 2007 %
How familiar, if at all, are you with the National Foundation for Credit Counseling, also known as NFCC?
Base: Adults 18+
(n= 1,007) (n= 1,010) (n= 2,028) (n= 1,000) (n= 1,001) (n= 1,003)
A B C D E F
Familiar (Net) 16 15 18 B 17 N/A N/A
Very familiar 2 2 2 2 2 3
Somewhat familiar 14 13 16 BF 15 F 15 F 12
Not familiar (Net) 83 85 C 82 82 N/A N/A
Not too familiar 17 20 EF 20 AEF 22 AEF 14 16
Not familiar at all 66 CD 65 D 62 60 65 D 68 CD
Don’t know * - * * 2 2
Refused 0 * * * 1 *