Embed Size (px)
DESCRIPTION
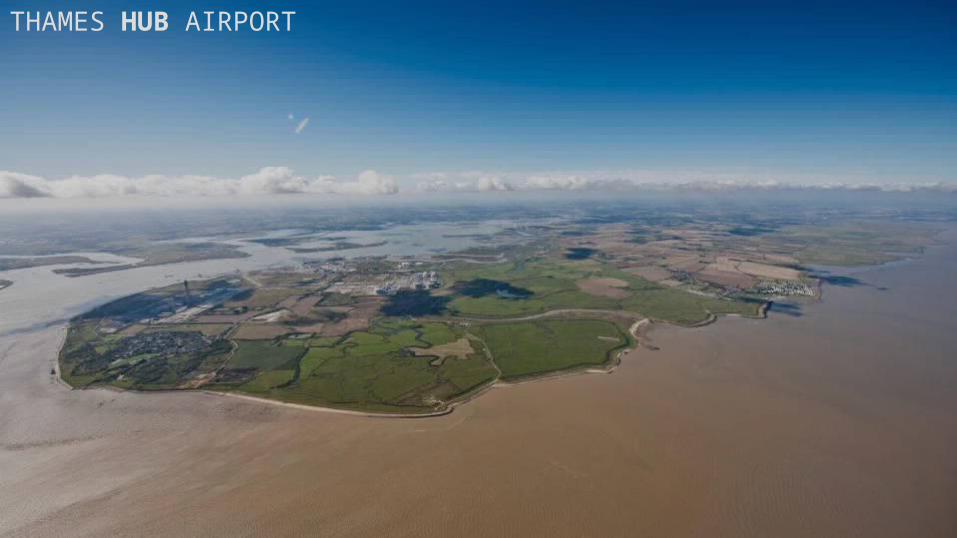
THAMES HUB AIRPORT. Global Context – City population 2012. Latitude. London. Istanbul. Beijing. New York. Tokyo. Dubai. Graph showing geographical distribution of population for the largest 2000 metro areas on the left, and summated by latitude on the right. - PowerPoint PPT Presentation
Citation preview
THAMES HUB AIRPORT
New York
LondonIstanbul
Sao Paulo
Dubai
Beijing
Tokyo
Sydney
Metro Popn 2012
0
36,500,000
LongituteGlobal Population %
LatitudeGlobal Context – City population 2012
Global Context

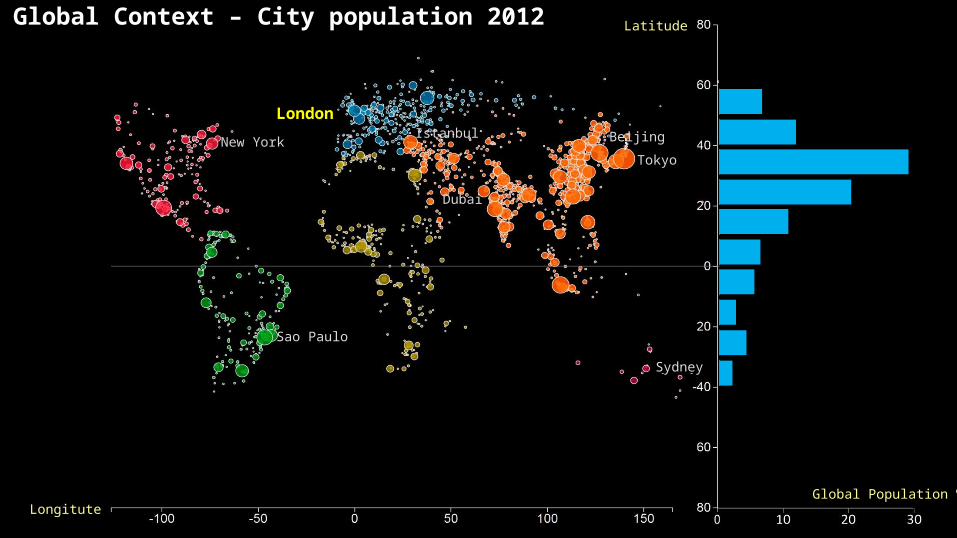
Global Context – London’s access to global GDP
Istanbul
London
Beijing
Tokyo
New YorkDubai
Sao Paulo
Sydney
Seats 2012
0
85,677,685
GDP% within 3 hours
GDP% within 13 hours
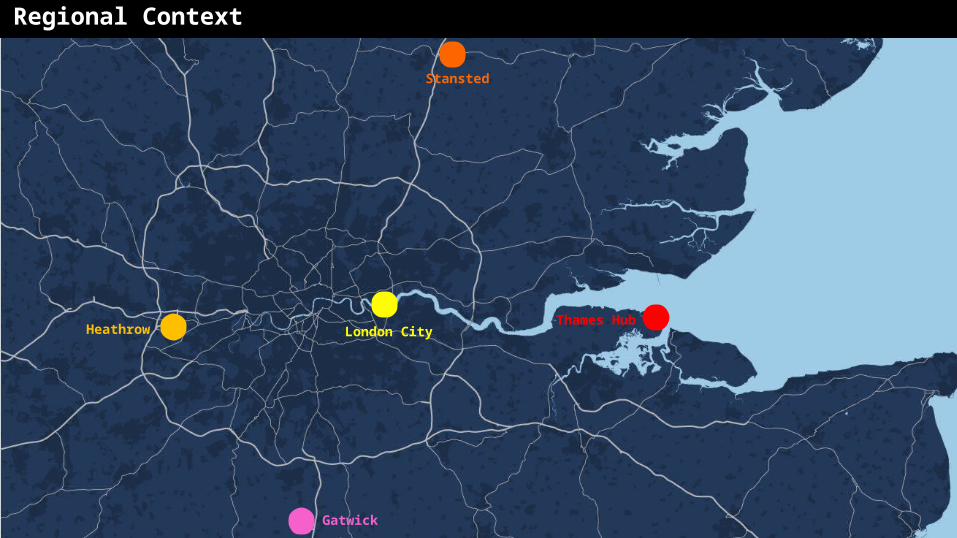
Regional Context
Thames Hub
Gatwick
Heathrow
Stansted
London City
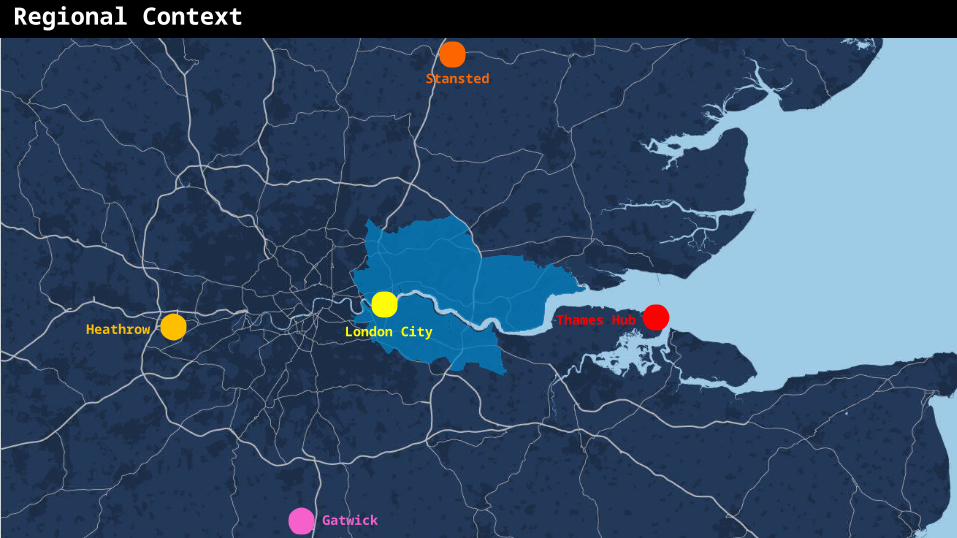
Regional Context
Thames Hub
Gatwick
Heathrow
Stansted
London City
400,000
An
nu
al M
ove
men
ts (
flig
hts
)
0
600,000
800,000
200,000
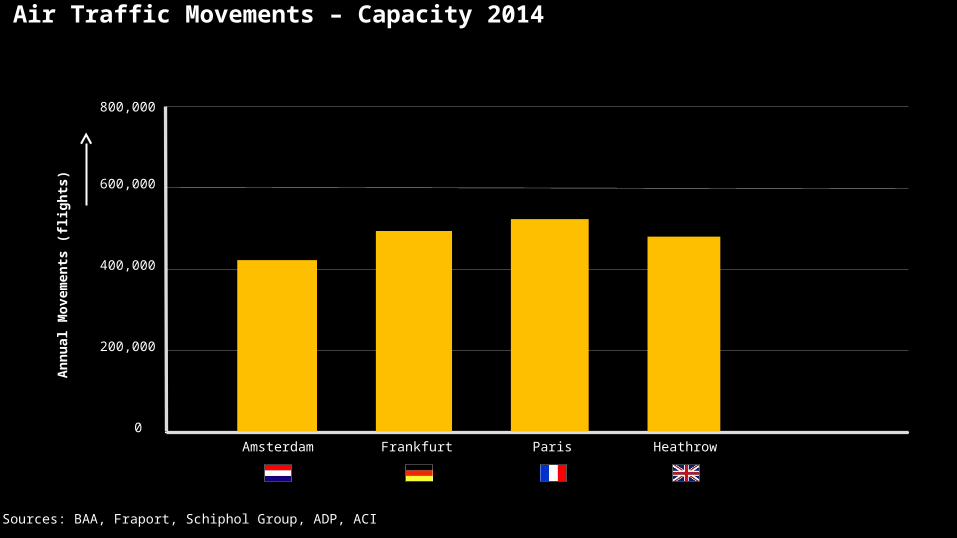
Sources: BAA, Fraport, Schiphol Group, ADP, ACI
ParisAmsterdam
Air Traffic Movements – Capacity 2014
HeathrowFrankfurt
400,000
An
nu
al M
ove
men
ts (
flig
hts
)
0
600,000
800,000
200,000
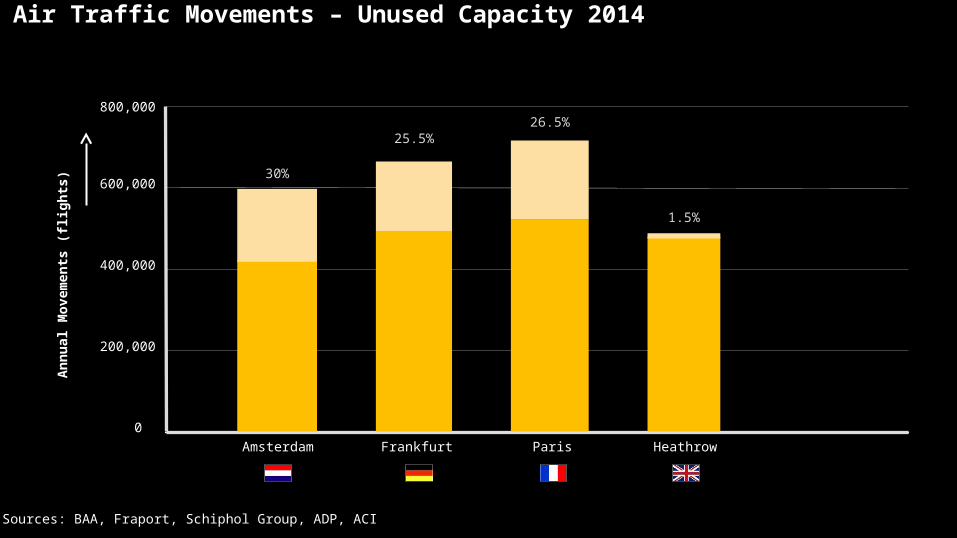
Sources: BAA, Fraport, Schiphol Group, ADP, ACI
ParisAmsterdam
Air Traffic Movements – Unused Capacity 2014
HeathrowFrankfurt
1.5%
26.5%25.5%
30%
400,000
An
nu
al M
ove
men
ts (
flig
hts
)
0
600,000
800,000
200,000
Sources: BAA, Fraport, Schiphol Group, ADP, ACI
ParisAmsterdam
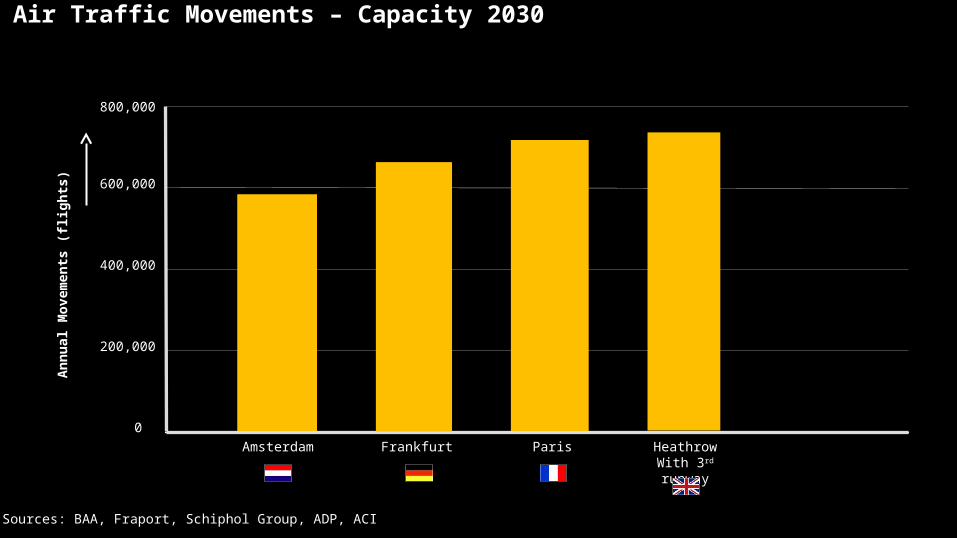
Air Traffic Movements – Capacity 2030
HeathrowWith 3rd runway
Frankfurt
400,000
An
nu
al M
ove
men
ts (
flig
hts
)
0
600,000
800,000
200,000
Sources: BAA, Fraport, Schiphol Group, ADP, ACI
ParisAmsterdam
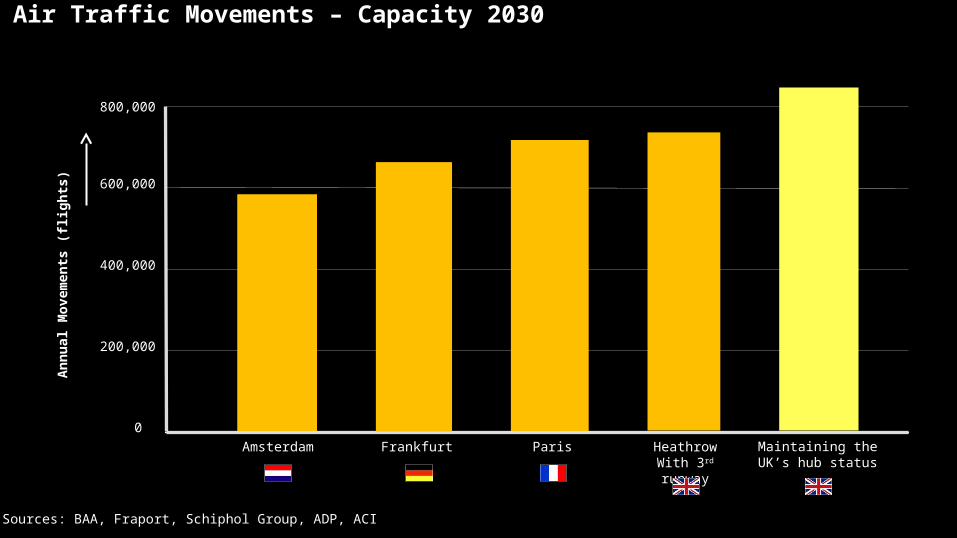
Air Traffic Movements – Capacity 2030
HeathrowWith 3rd runway
Frankfurt Maintaining the UK’s hub status
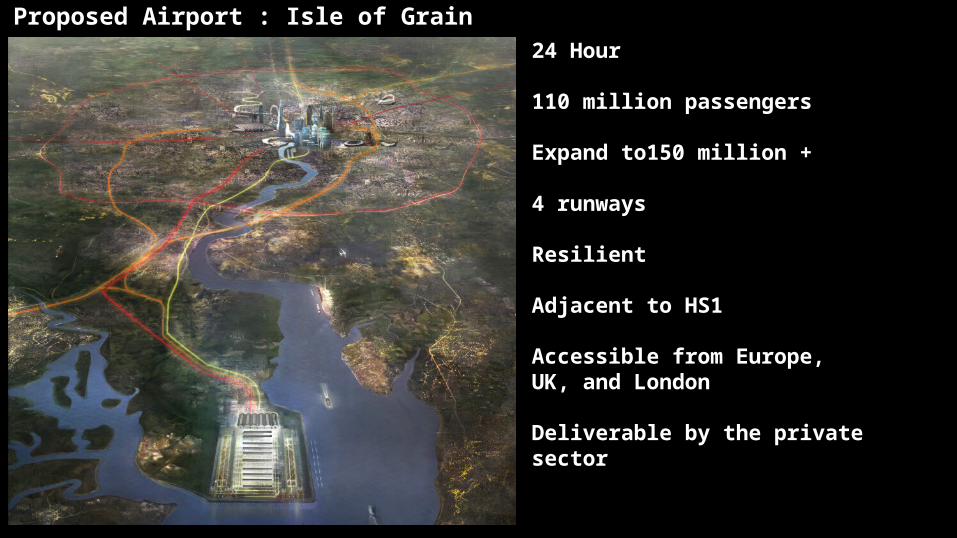
Proposed Airport : Isle of Grain24 Hour
110 million passengers
Expand to150 million +
4 runways
Resilient
Adjacent to HS1
Accessible from Europe, UK, and London
Deliverable by the private sector
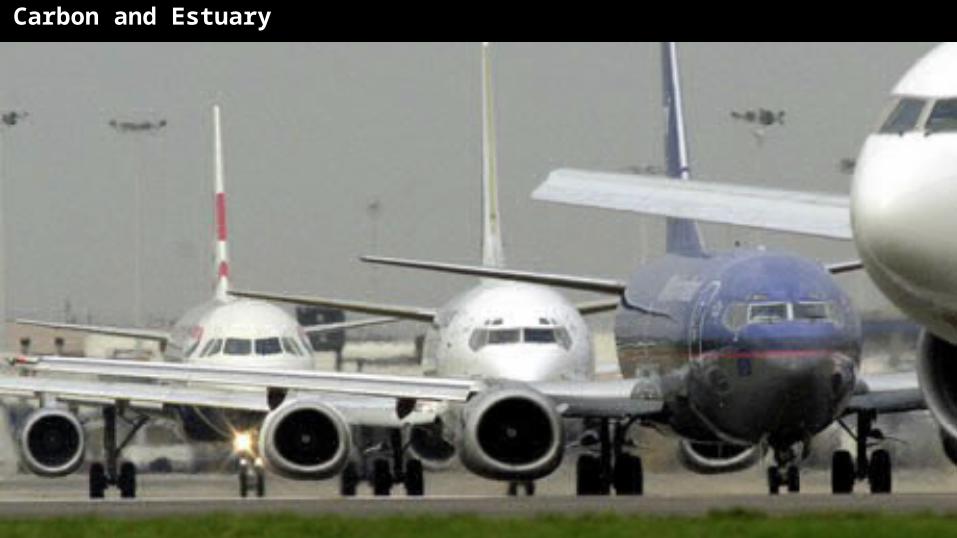
Carbon and Estuary
•Commission information on emissions and how we fit
•All solutions face same carbon emission limits. We can design something with lowest carbon access, most efficient ground
movement and efficient runway access
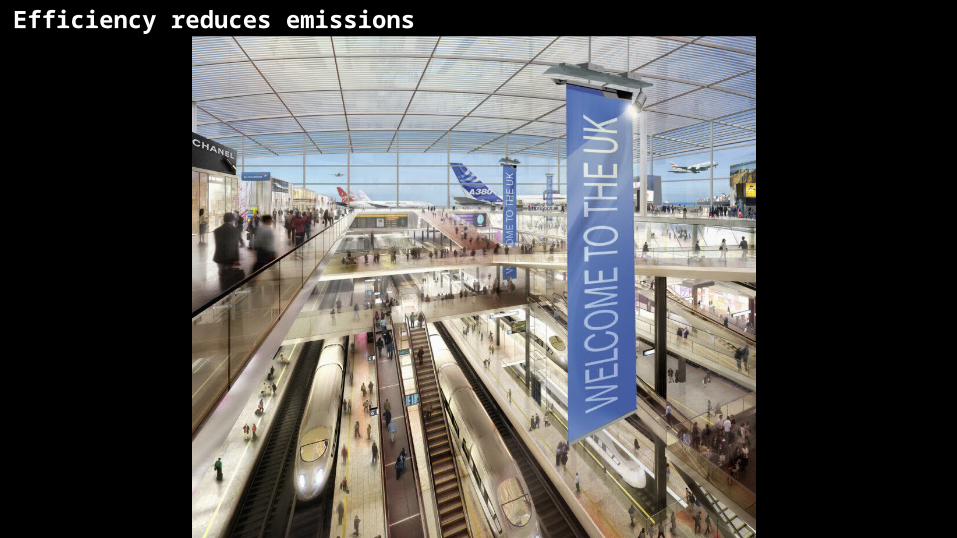
Efficiency reduces emissions

Surface Access
HS2
HS1
Crossrail
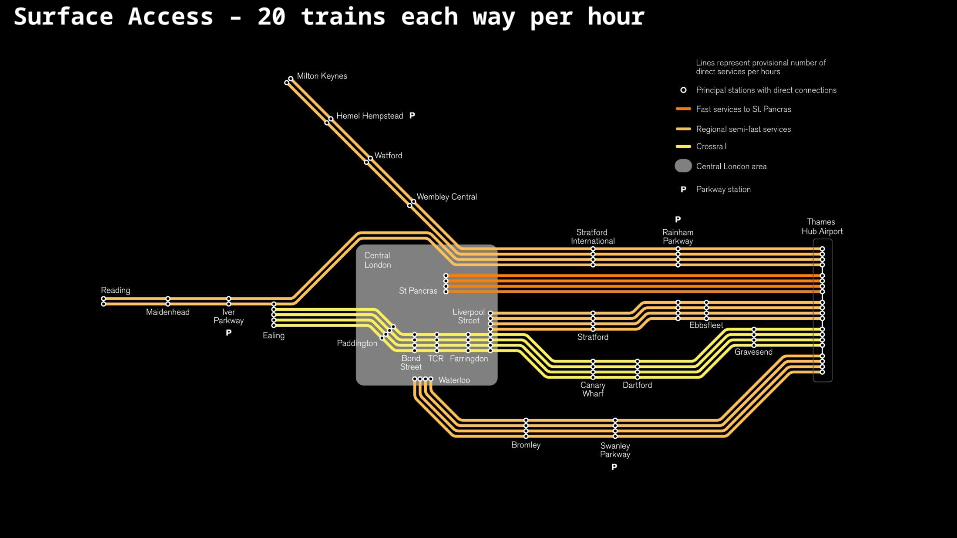
Surface Access – 20 trains each way per hour
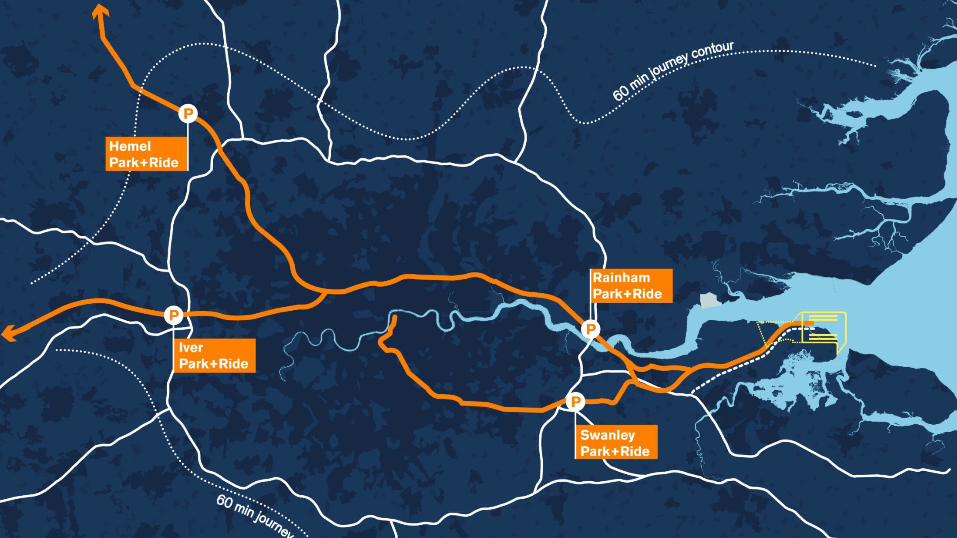
Surface Access
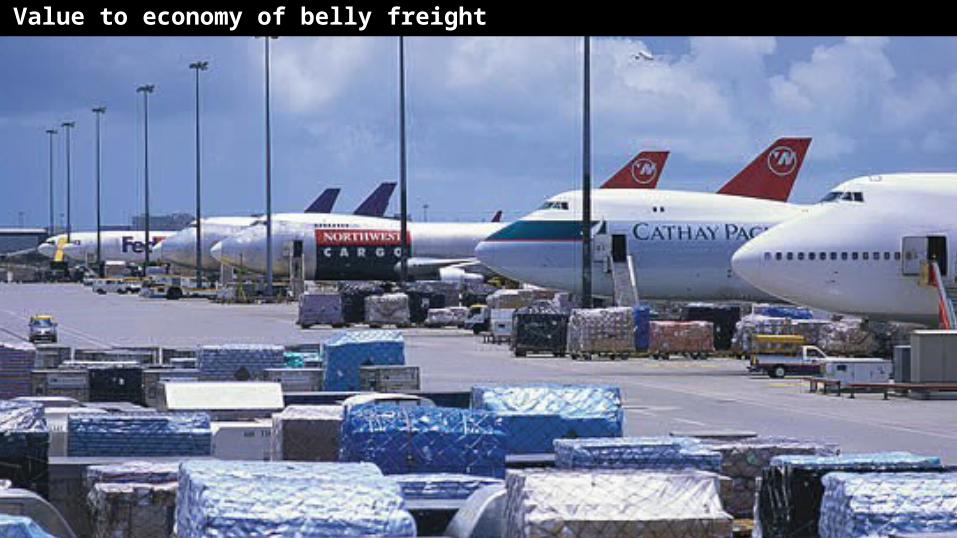
Value to economy of belly freight
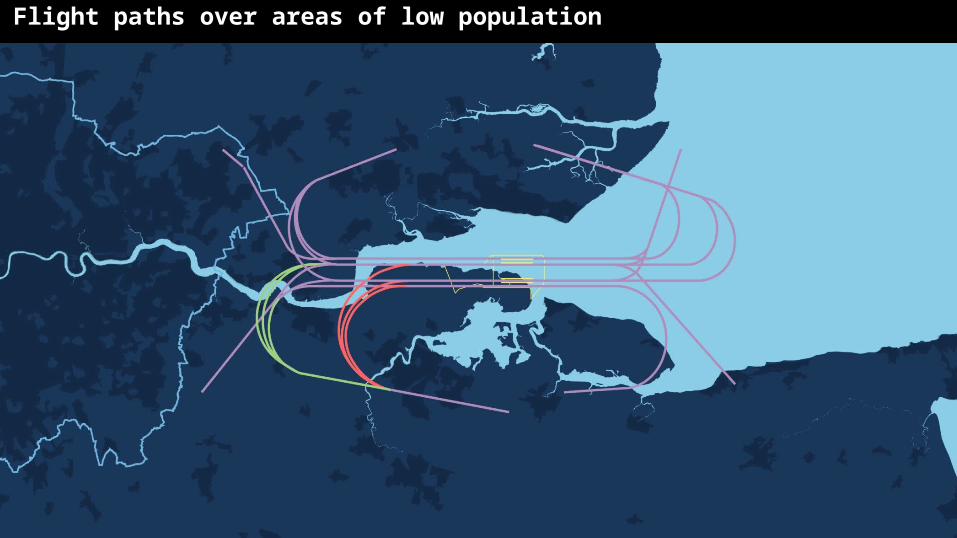
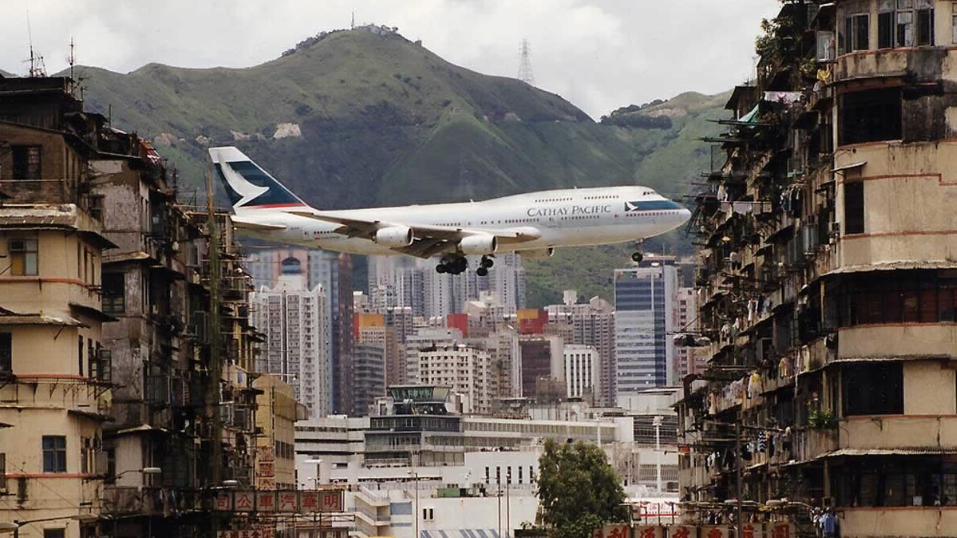
Flight paths over areas of low population
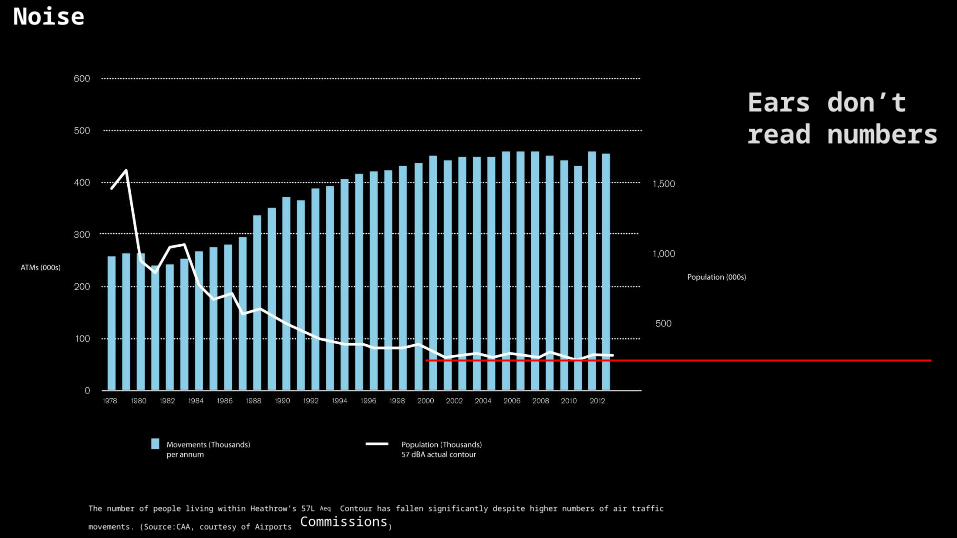
Noise
Ears don’t read numbers
The number of people living within Heathrow’s 57L Aeq Contour has fallen significantly despite higher numbers of air traffic movements. (Source:CAA, courtesy of
Airports Commissions)
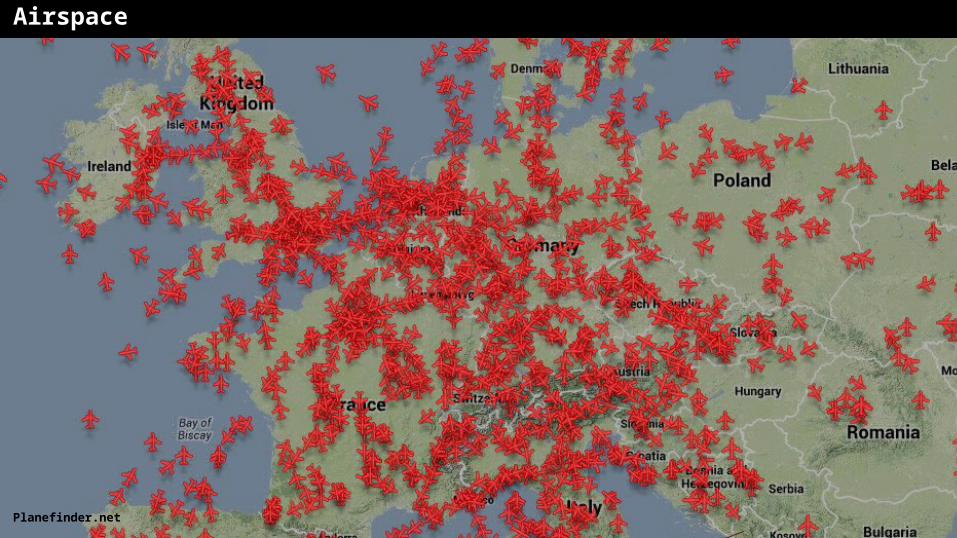
Airspace
•Quote from NATS in TFL report SESAR Statements and need to replan. •Question City impact. Means you close Heathrow,
Planefinder.net
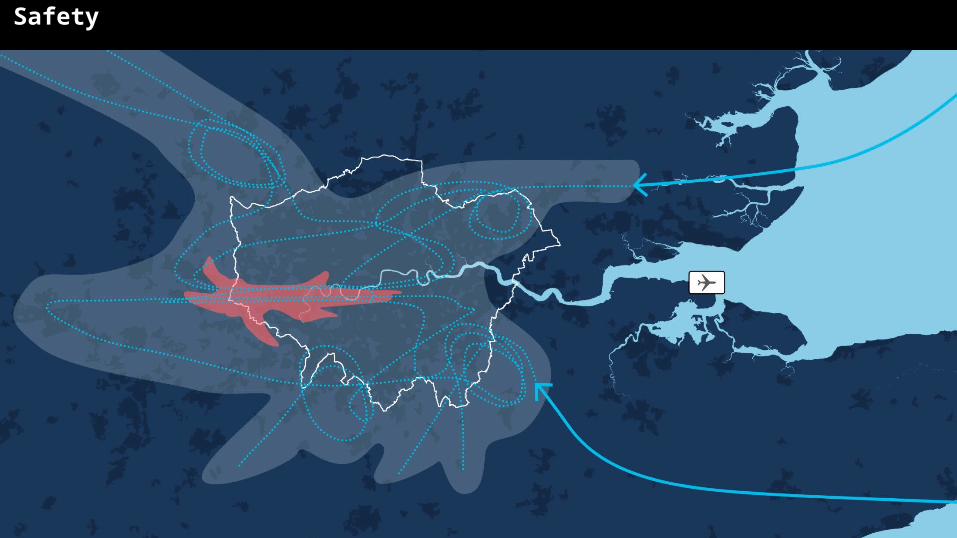
Safety
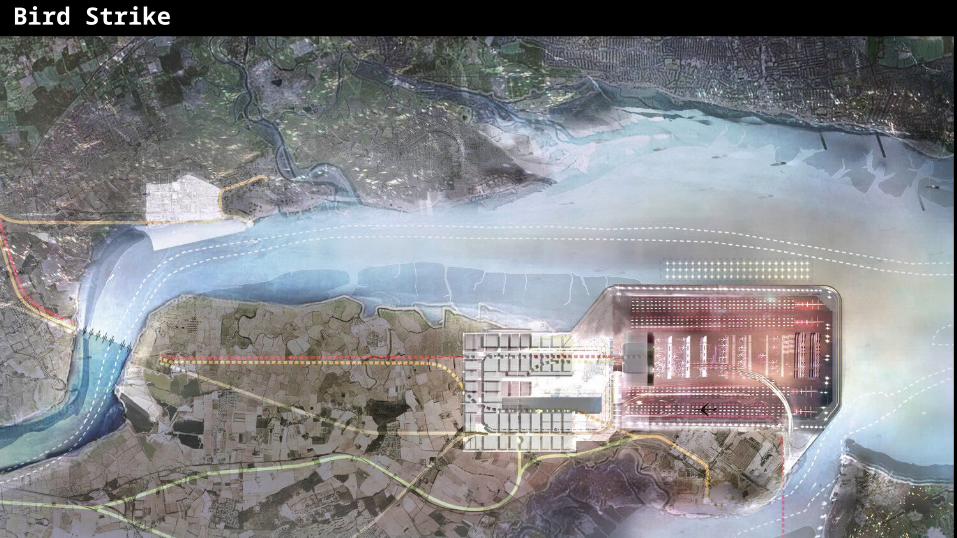
Bird Strike
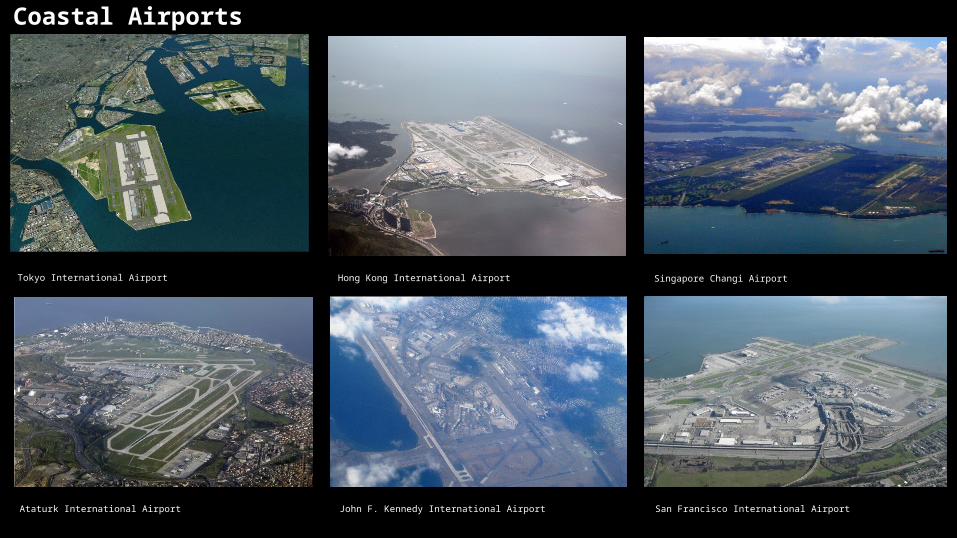
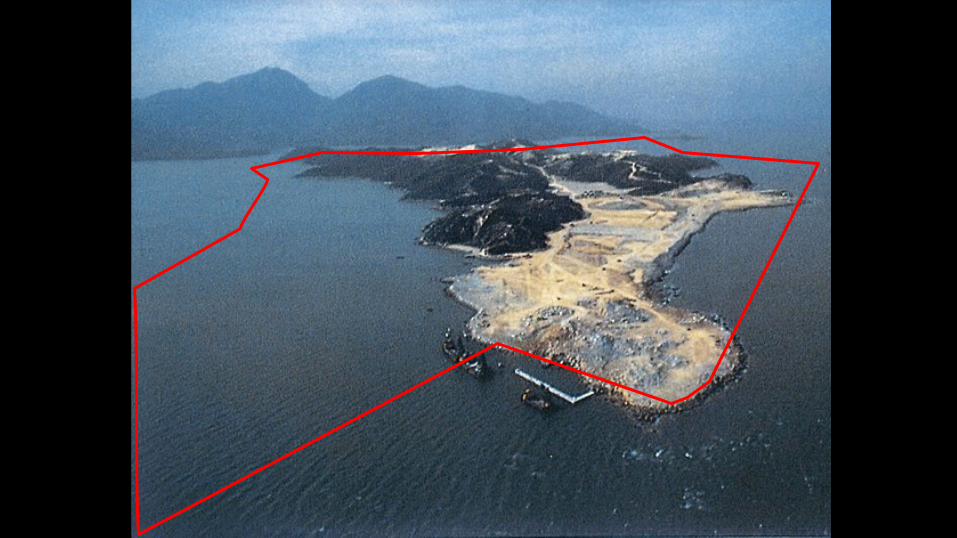
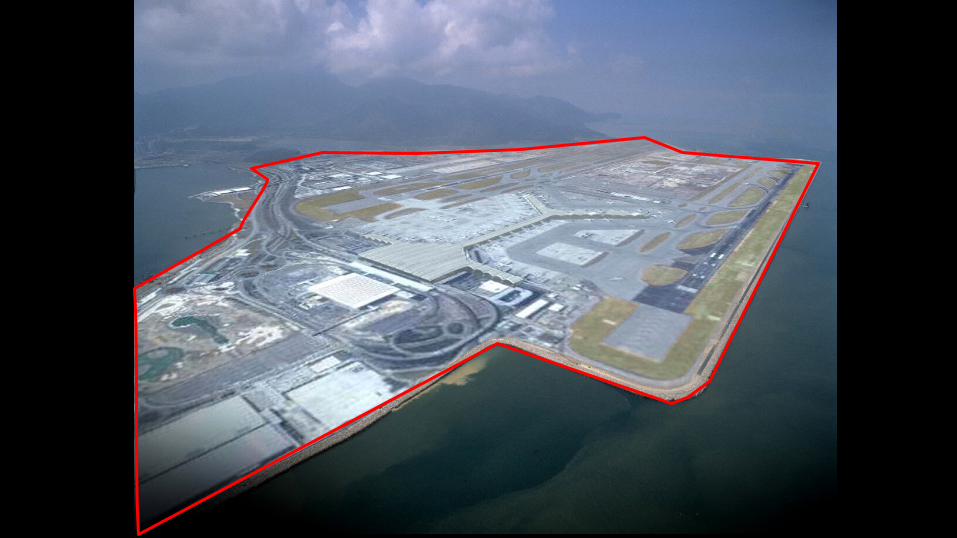
Coastal Airports
Tokyo International Airport Hong Kong International Airport Singapore Changi Airport
Ataturk International Airport John F. Kennedy International Airport San Francisco International Airport
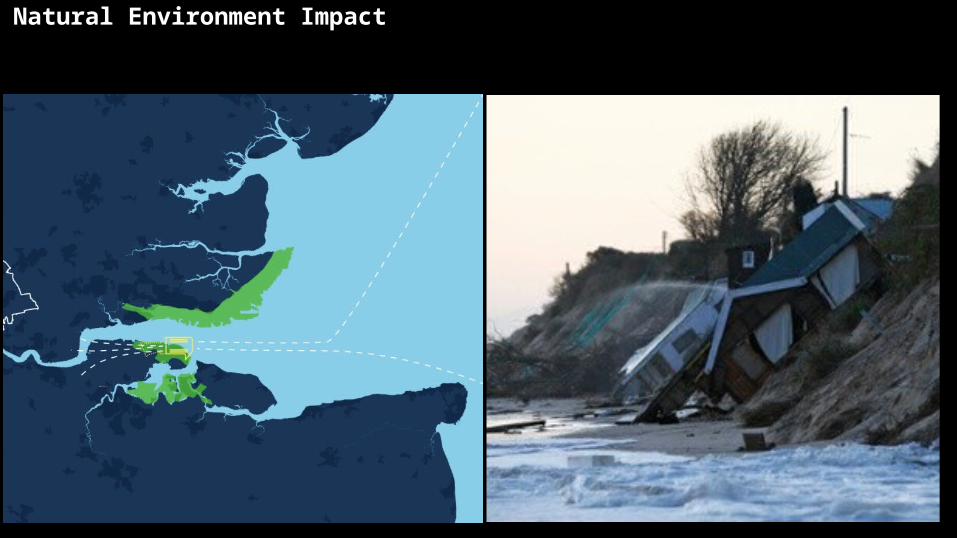
Natural Environment Impact
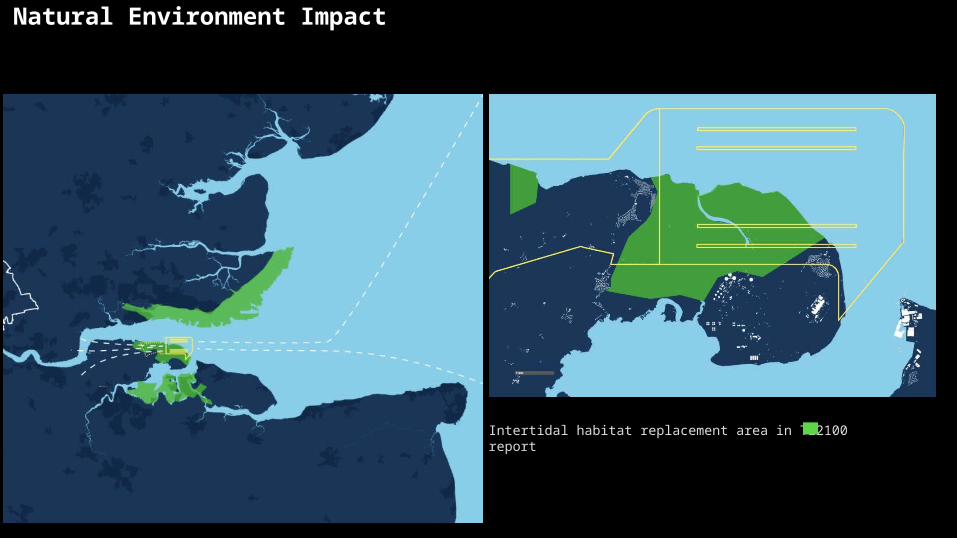
Natural Environment Impact
Intertidal habitat replacement area in TE2100 report
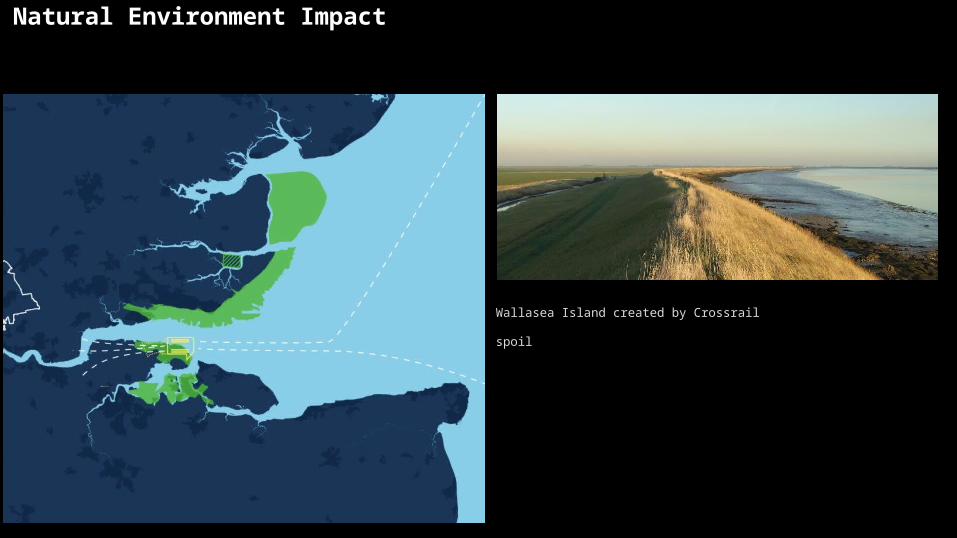
Natural Environment Impact
Wallasea Island created by Crossrail spoil
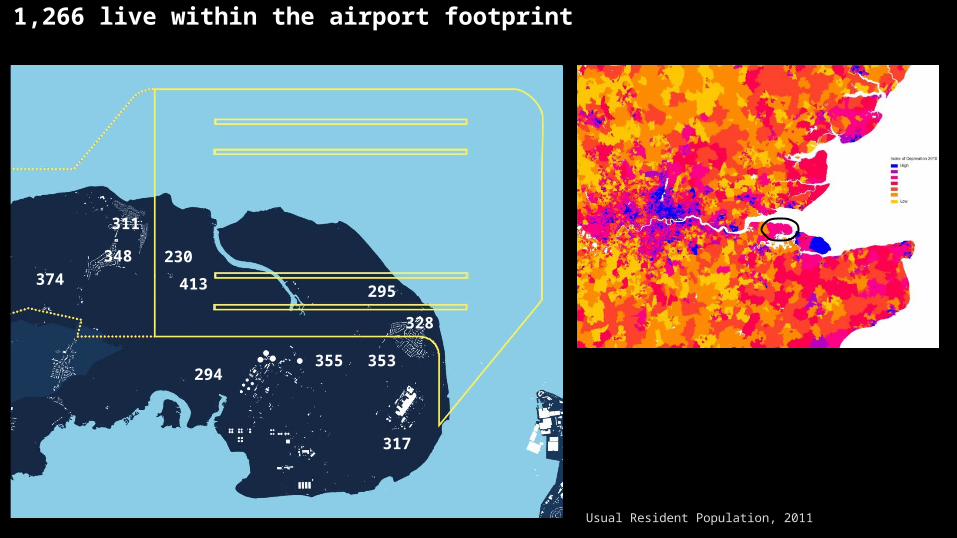
1,266 live within the airport footprint
374
348 230
311
413
294355
317
353
328
295
Usual Resident Population, 2011
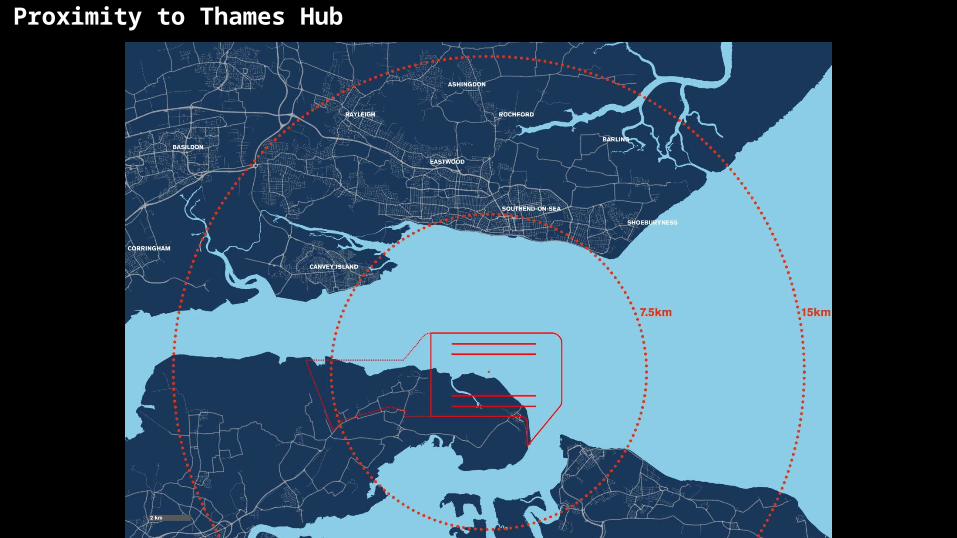
Proximity to Thames Hub
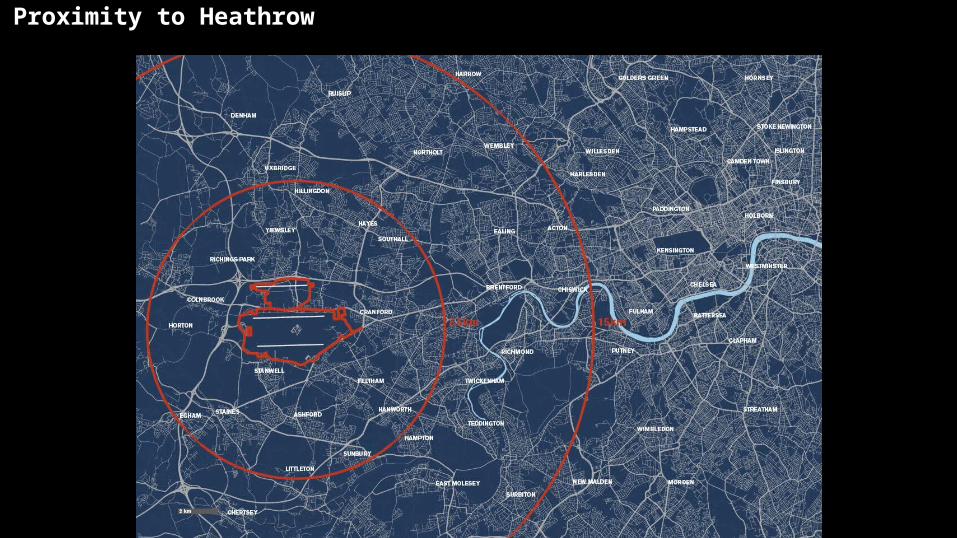
Proximity to Heathrow
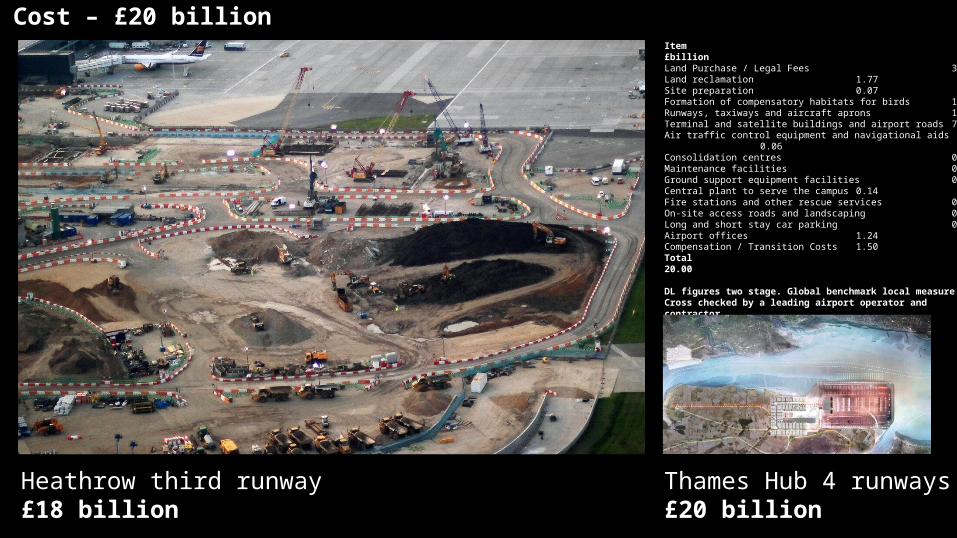
Cost – £20 billionItem £billion Land Purchase / Legal Fees 3.44 Land reclamation 1.77 Site preparation 0.07 Formation of compensatory habitats for birds 1.21 Runways, taxiways and aircraft aprons 1.93 Terminal and satellite buildings and airport roads 7.71 Air traffic control equipment and navigational aids 0.06 Consolidation centres 0.02 Maintenance facilities 0.09 Ground support equipment facilities 0.05 Central plant to serve the campus 0.14 Fire stations and other rescue services 0.10 On-site access roads and landscaping 0.25 Long and short stay car parking 0.42 Airport offices 1.24 Compensation / Transition Costs 1.50 Total 20.00
DL figures two stage. Global benchmark local measure. Cross checked by a leading airport operator and contractor
Heathrow third runway£18 billion
Thames Hub 4 runways£20 billion
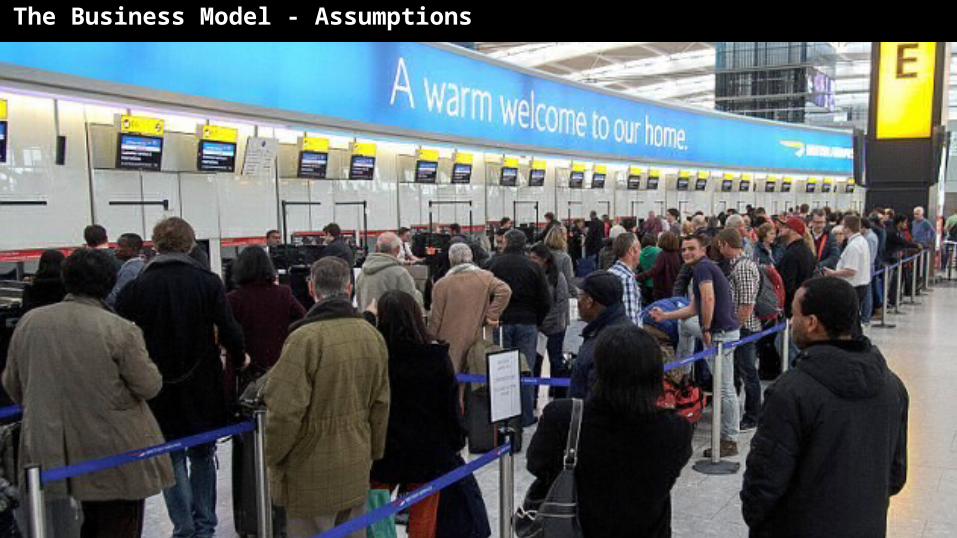
The Business Model - Assumptions
RAB based, only passenger can payPromotion group, delivery sale to operator
Allocation of risk
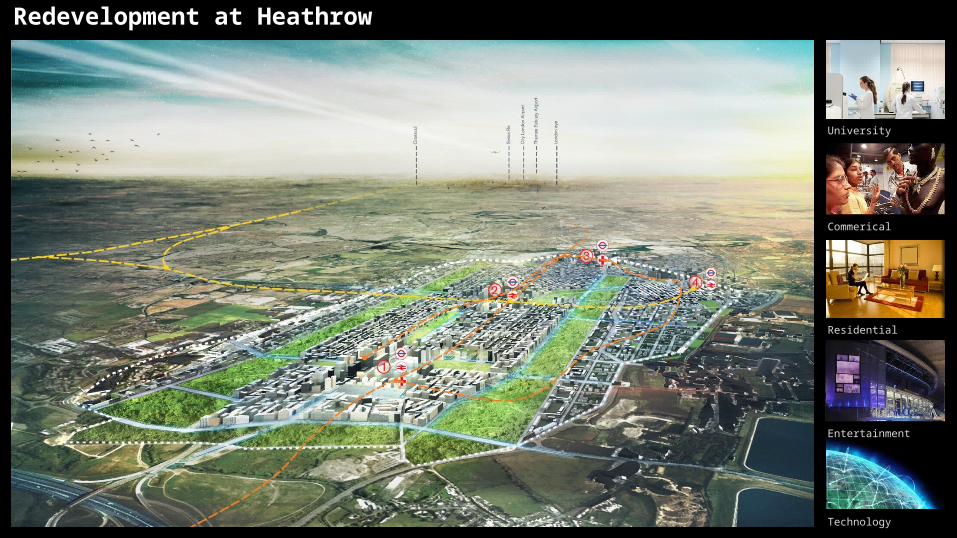
Redevelopment at Heathrow
University
Commerical
Residential
Entertainment
Technology
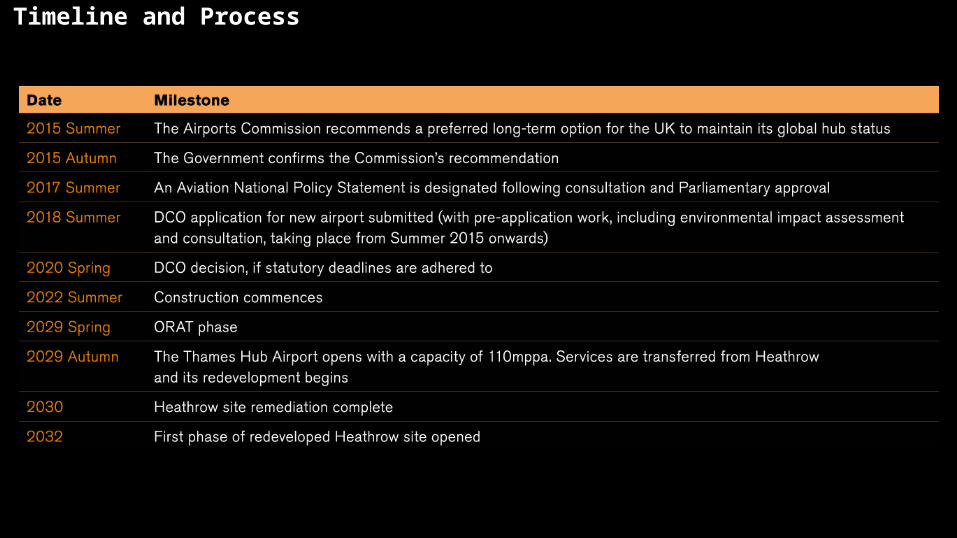
Timeline and Process