Embed Size (px)
Citation preview
TEXTILE INDUSTRY
Output of a Seminar onEnergyConservation in Textile Industry
Sponsored by
United Nations Industrial Development Organization(UNIDO)
and
Ministry of International Trade and Industry(MITI), Japan
Hosted by
Ministry of Telecommu-nications and Post, Malaysia
Ministry of Mines andEnergy, Indonesia
Organized by
The Energy Conservation Center (ECC), Japan
1992
Malaysia Indonesia
HANDY MANUAL
Preface
The conservation of energy is an essential step we can all take towards overcomingthe mounting problems of the worldwide energy crisis and environmental degradation.In particular, developing countries are interested to increase their awareness on theinefficient power generation and energy usage in their countries. However, usually onlylimited information sources on the rational use of energy are available.
The know-how on modern energy saving and conservation technologies should,therefore, be disseminated to governments and industrial managers, as well as toengineers and operators at the plant level in developing countries. It is particularlyimportant that they acquire practical knowledge of the currently available energyconservation technologies and techniques.
In December 1983, UNIDO organized a Regional Meeting on Energy Consumptionas well as an Expert Group Meeting on Energy Conservation in small- and medium-scale industries for Asian countries. During these meetings, it was brought out that, forsome energy intensive industries, savings up to 10% could be achieved through basichousekeeping improvements, such as auditing and energy management.
The rational use of energy calls for a broad application of energy conservationtechnologies in the various industrial sectors where energy is wasted. One of theseenergy intensive industrial sectors to be considered to improve efficiency through theintroduction of modern energy conservation technologies is the textile industry.
In the textile industry, appreciable amounts of energy could be saved or conserved byregulating the temperature in the steam pipes, adjusting the air/fuel ratio in the boilers,and installing heat exchangers using warm waste water.
Currently, UNIDO, with the financial support of the Japanese Government, iscarrying out a regional programme on the promotion and application of energy savingtechnologies in selected Asian developing countries. This programme aims at adoptingthese innovative energy conservation technologies, developed in Japan, to the conditionsof developing countries.
In this programme, we are considering that the transfer of these technologies couldbe achieved through:
(i) Conducting surveys of energy usage and efficiency at the plant level;
(ii) Preparing manuals on energy management and energy conservation/savingtechnologies, based on the findings of the above survey;
(iii) Presenting and discussing the manuals at seminars held for government officials,representatives of industries, plant managers and engineers;
(iv) Disseminating the manuals to other developing countries for their proper utilizationand application by the industrial sector.
The experience obtained through this programme will be applied to otherprogrammes/projects which involve other industrial sectors as well as other developingcountries and regions.
UNIDO has started this programme with the project US/RAS/90/075 -RationalUse of Energy Resources in Steel and Textile Industry in Malaysia and Indonesia.
The present Handy Manual on Textile Industry was prepared by UNIDO, with thecooperation of experts from the Energy Conservation Center (ECC) of Japan, on energysaving technologies in the framework of the above mentioned UNIDO project. It isbased on the results of the surveys carried out, the plant observations and therecommendations and suggestions emanating from the Seminars on EnergyConservation in the Steel and Textile Industries, held under the same project in January1992 in Jakarta, Indonesia, and Kuala Lumpur, Malaysia. The manual will not only beinteresting for government and representatives from industry, but it is, in particular,designed for plant-level engineers and operators in developing countries as a help toimprove energy efficiency in the production process.
Appreciation is expressed for the valuable contribution made by the followinginstitutions to the successful preparation and publication of the manual mentioned above:
Ministry of Mines and Energy, Indonesia
Ministry of Energy, Telecommunications and Posts, Malaysia
Ministry of International Trade and Industry (MITI), Japan
The Energy Conservation Center (ECC), Japan
June 1992
C O N T E N T S
1. Characteristics of the Manual . . . . . . . . . . . .. . . . . . . . . . . . . . . . . . . . . . . . . . . . . . . . . . . . . . . . . . . . . . . . . . . . . . . . . . . . . . . . . . 1
2. Characteristics of Energy Consumption ............................................................... 1
2.1 Types of energy used in the textile industry.. .................................................... 1
2.2 Production process and energy use for each specialized technical field............. 2
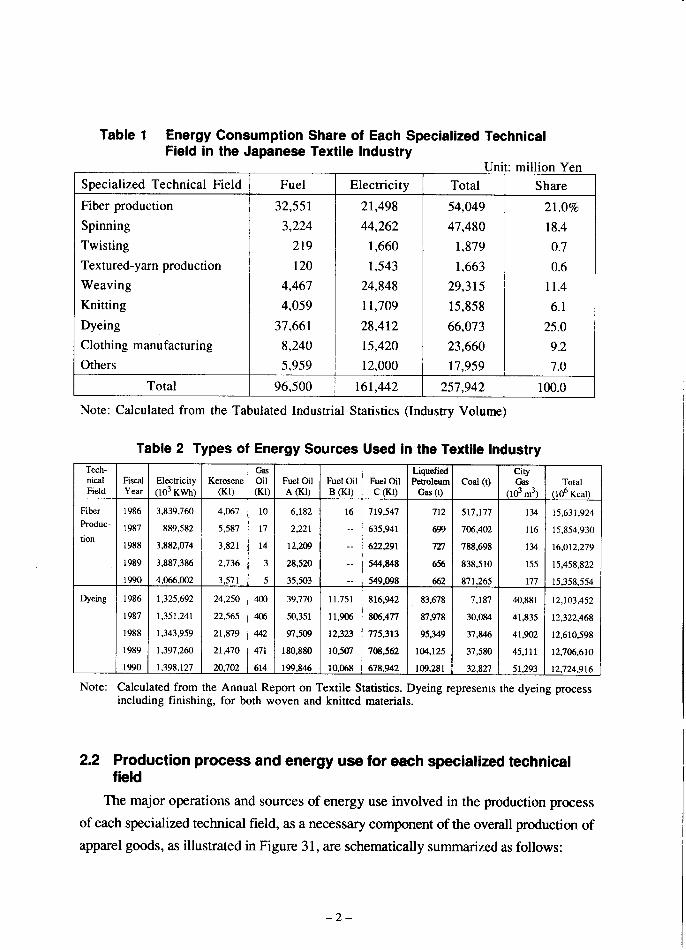
2.2.1 Fiber production.. .................................................................................... 3
2.2.2 Spinning .................................................................................................. 4
2.2.3 Twisting .................................................................................................. 4
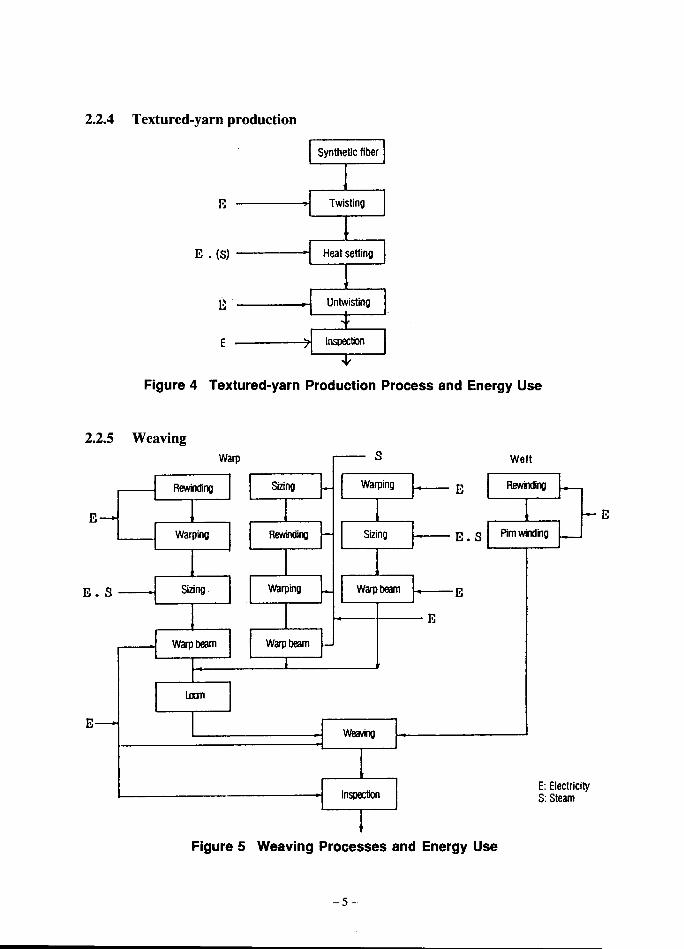
2.2.4 Textured-yam production ........................................................................ 5
2.2.5 Weaving ................................................................................................. 5
2.2.6 Knitting ................................................................................................... 6
2.2.7 Dyeing and finishing.. ............................................................................. 6
2.2.8 Clothing manufacturing.. ....................................................................... 1 1
3. Promotion of Energy Conservation Technologies.. ............................................ .12
3.1 Energy conservation management technologies.. ............................................ 12
3.1.1 Organizational rationalization.. ............................................................... 12
3.1.2 Improving efficiency of electricity use .................................................. 12
3.1.3 Improvements in efficient fuel use ........................................................ 13
3.1.4 Improvement in efficient use of steam.. ................................................. 14
3.1.5 Utilization of heat exchanger ................................................................. 15
3.1.6 Measuring instruments and automatic control ...................................... 15
3.2 Energy use and rational use of energy in process-specific technologies .......... 15
3.2.1 Fiber production.. .................................................................................. 16
3.2.2 Spinning.. .............................................................................................. 17
3.2.3 Textured-yam production ..................................................................... 18
3.2.4 Weaving ............................................................................................... 19
3.2.5 Knitting ................................................................................................. 20
3.2.6 Dyeing and finishing.. ........................................................................... 20
3.2.7 Clothing manufacturing.. ....................................................................... 35
- i -
4. Actual Conditions of the Textile Industry in Japan . . . . . . . . . . . . . . . . . . . . . . . . . . . . . . . . . . . . . . . . . . . . . 35
5. Structures of Textile Markets . . . . . . . . . . . . . . . . . . . . . . . . . . . . . . . . . . . . . . . . . . . . . . . . . . . . . . . . . . . . . . . . . . . . . . . . . . . . . 42
5.1 Basic clothing . . . . . . . . . . . . . . . . . . . . . . . . . . . . . . . . . . . . . . . . . . . . . . . . . . . . . . . . . . . . . . . . . . . . . . . . . . . . . . . . . . . . . . . . . . . . . . . . . . 425.2 Fashion clothing . . . . . . . . . . . . . . . . . . . . . . . . . . . . . . . . . . . . . . . . . . . . . . . . . . . . . . . . . . . . . . . . . . . . . . . . . . . . . . . . . . . . . . . . . . . . . . 44
5.3 Worlds total textile demand and production base distribution . . . . . . . . . . . . . . . . . . . . . . . . 45
5.4 Characteristics of textile market . . . . . . . . . . . . . . . . . . . . . . . . . . . . . . . . . . . . .. . . . . . . . . . . . . . . . . . . . . . . . . . . . . . 47
6. Conclusions . . . . . . . . . . . . . . . . . . . . . . . . . . . . . . . . . . . . . . . . . .. . . . . . . . ...................................................... 51
1. Characteristics of the Manual
In order to promote energy conservation in the textile industry, this manual analyzes
in detail the actual conditions of energy consumption in each field. Thus, it has beencompiled to serve as reference material for the practical application of these techniques
which are always kept available for the engineers. A step-by-step description is included
as to how to implement the energy conservation measures, specifically in the area of the
dyeing and finishing process, where many small- to medium-sized companies areoperating. We strongly hope that this manual will be used as a guide to promote energyconservation in the textile industry and to rationalize the management.
2. Characteristics of Energy Consumption
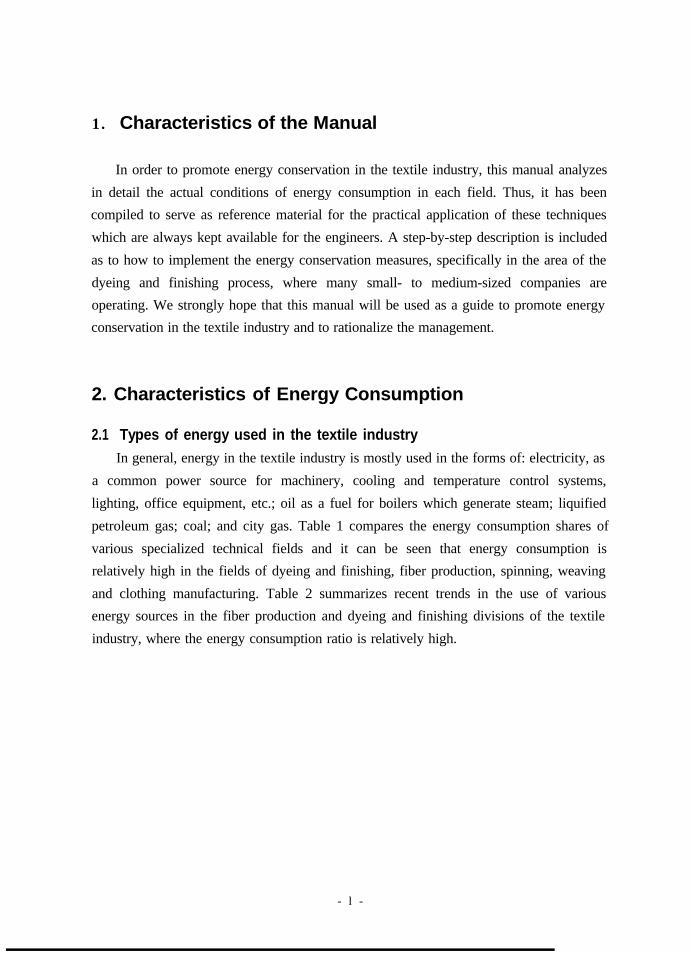
2.1 Types of energy used in the textile industryIn general, energy in the textile industry is mostly used in the forms of: electricity, as
a common power source for machinery, cooling and temperature control systems,
lighting, office equipment, etc.; oil as a fuel for boilers which generate steam; liquified
petroleum gas; coal; and city gas. Table 1 compares the energy consumption shares of
various specialized technical fields and it can be seen that energy consumption isrelatively high in the fields of dyeing and finishing, fiber production, spinning, weaving
and clothing manufacturing. Table 2 summarizes recent trends in the use of variousenergy sources in the fiber production and dyeing and finishing divisions of the textile
industry, where the energy consumption ratio is relatively high.
- l -

3. Promotion of Energy Conservation Technologies
While the significance of energy conservation awareness is relatively easily
understood at home, when a program is introduced into a factory to promote it, itsthorough implementation tends to be delayed at an early stage. Therefore, for its actual
course of implementation, it is desired to devise company-wide coordinated measures
similar to QC activities at factories. Also, in order to promote energy saving measures
efficiently, it is found to be effective to separately consider general management
techniques for “rational use of energy” and process-specific techniques to be developedin each specialized technical field.
3.1 Energy conservation management technologies3.1.1 Organizational rationalization
Since energy management is relevant to a wide range of departments within a
company, it is necessary to enhance the awareness, improve the knowledge and
obtain the participation and cooperation of everybody involved in the production
process. Therefore, while it is necessary for engineers and technicians with specialized
technical knowledge to play a central role in energy conservation efforts, theimplementation of an energy conservation program itself should not be left to a
handful of specialists or specialized sections. Rather, it is desirable to address the taskcompany-wide, for example by setting up an ‘Energy Management Committee’.
3.1.2 Improving efficiency of electricity use(1) Lighting
Due to its nature of operations, the share of lighting in electricity use is relatively
high. After the switch from tungsten bulbs to fluorescent lamps achieved
considerable electricity savings, electricity-saving fluorescent lamps have beendeveloped and marketed for further improvements, including those capable of
reducing electricity use by several percent for the same level of illumination.
In general, the effectiveness of illumination is influenced by various factors, suchas the intensity of light source, the reflection coefficient and shape of the
reflective fitting (lamp shade), the layout of the room to be illuminated, interiorfinish, color and the distance from the light source. Therefore, it is important to
- 1 2 -
re-examine whether the light source is utilized in the most efficient way and take
electricity saving measures, if necessary, such as reducing the number of lampsin use by switching from global lighting to local lighting as much as possible.
(2) Electric motor
(3)
The textile industry uses a vast number of relatively small electric motors.
Notably, while a conventional machine was driven by a single motor with the
generated mechanical power transmitted to various parts of the machine in a
collective manner, many modern machines utilize multiple motors with a controlboard controlling the movement of each motor, which is directly coupled to amachine part to drive it independently from others. This is also a rationalized
feature in terms of energy saving. However, regarding the selection of each
motor, emphasis has been placed on mechanical performance, resulting in amotor with an excessive capacity. This leaves considerable room for re-
examination from a energy conservation point of view.
Electric heatingIn the textile industry, electric heating has largely been replaced by other methods
(steam, gas heating, or direct or indirect fired heating) for some time in order to
achieve cost reductions. However, since electric heating only requires a smallinitial investment as a result of convenience and simplicity in equipment
construction, it is still used for small capacity local heating purposes. Therefore,it is desirable to conduct a comparative investigation into alternative heating
methods, such as far-infrared radiation heating, high frequency dielectric heating
and microwave heating.
3.1.3 Improvements in efficient fuel use(1) Selection of fuel
As is described before, fuels utilized in the textile industry have already gone
through a switch-over from coal to oil. More recently, efficient energy use is
under investigation, including the revival of coal on the way to a further movefrom oil to liquefied and city gases, while reflecting various fuel prices. In
selecting fuels, those with good flue gas characteristics in addition to high
calorific value and ease of combustion are desired, so that air pollution can beprevented as much as possible.
- 1 3 -
(2) Selection of boilerBy and large, boilers used in the Japanese textile industry have experienced achange from Lancastrian- or Scotch-type tubular or smoke tube to water-tube
boilers (natural circulation and forced circulation water-tube boilers and once-through boilers). As a result, boiler efficiency has improved from the
conventional 60’s to 70’s of percentage points to as high as the 90’s. Since highperformance boilers are prone to a rapid growth of scales inside their water
tubes, feed water management becomes important. Furthermore, these boilers
have small amounts of retained water and high evaporation speeds so that manyaspects of their operation are automated, including feed water and combustion
management.
3.1.4 Improvement in efficient use of steam(1) Piping
The noted feature of steam use in the textile industry is that the amount of steam
involved is not so large but the locations where steam is required are widespread
so that steam losses due to heat radiation from steam transportation pipes and
pressure drops are considerable.Therefore, for steam transportation over long distances, high pressure and small-diameter rather than low pressure and large-diameter piping is desired, with
pressure reducing valves placed as necessary to regulate the steam pressure at thepoint of use, thereby curbing heat losses. Also, as pressure losses around bends
are great, it is desirable to make their radii large. In order to prevent steam leaksfrom joints due to the thermal expansion of the pipe, expansion joints should be
placed where required. Furthermore, in order to maintain the temperature inside
the valve, tank and treatment tank as well as the piping, it is necessary to install
them heat-insulated, using appropriate heat insulating materials, so as toefficiently use steam while preventing heat losses.
(2) Steam accumulatorsSince live steam is often used in dyeing factories, fluctuations in steam useduring working hours are large. On the other hand, since high performance
water tube boilers and once-through boilers are designed such that water retainedinside the boiler is very little, the boiler cannot react to momentary and sudden
- 1 4 -
(3)
load changes, while responding to automatically controlled slow load changes is
not a problem. In such a case, a steam accumulator can be installed midwaythrough the heat transporting pipe, between the boiler and the heat consuming
load, in order to store excess steam when the load is light by transforming it toheated water. This then transforms the heated water back to steam when the load
is heavy in order to reinforce supply to the load. This allows the boiler to
continuously operate with the average load and is quite advantageous in view of
energy saving.Recycling of drainSo far, after its heat energy is consumed, steam has been drained off. However,
in view of energy saving, it is necessary to collect and recycle the heat energy
carried by the drain water.
3.1.5 Utilization of heat exchangerIn each production process of the textile industry, the heating and cooling of gases and
liquids as media of heat are frequently required. This is done through heat exchange
between different fluids, and in order to avoid contamination or chemical reaction due
to their direct contact, heat exchangers are used to carry out indirect heating andcooling. It is important to use the right heat exchanger for the intended purpose.
3.1.6 Measuring instruments and automatic controlEnergy saving is an operation to grasp the actual situation of energy use in a factory
precisely and quantitatively and to carry out improvement measures in order torationalize and economize on it. While measuring instruments are needed to obtain
quantitative data, it will become more and more important to investigate the use of
sophisticated measuring instruments based on recent developments in mechanical andelectronic engineering, combined with automatic control systems.
3.2 Energy use and rational use of energy in process-specifictechnologies
Progress in production rationalization is achieved through the implementation of a
comprehensive set of measures, including energy conservation technologies as the
- 1 5 -
centerpiece measure, along with time management, labor saving, natural resourcessaving and space saving. It has been frequently pointed out that, along with management
techniques described earlier, the improvement and development of process-specific
techniques on energy conservation greatly contribute to the rationalization of production.Here, process-specific techniques relating to energy saving are summarized for each
specialized technical field.
3.2.1 Fiber productionExhibiting relatively large-scale structural forms in the textile industry, this division
has already reached a high level of production rationalization, as seen from Figure 24;
as is well known, it is technologically aiming at diversification into such high value-added goods as super extra-fine fiber and inorganic functional fiber, commonly
referred to as shingosen. In particular, the following techniques relate to energy
saving:
(1)
(2)
(3)
(4)
Raw material production processImplementation of energy saving through improvements in the process andreaction conditionsPolymerization processReduction’ in polymerization time by means of high efficiency catalysts,
polymerization methods, etc.
Spinning processPromotion of energy saving through combining the POY (Pre-oriented Yarn:
Yarn with some stability with its molecules partially having gone throughorientation) and DTY (Draw Textured Yam: false twisted yarn producedwhile drawing POY yarn) methods and an expanded use in multi-foldedspinning yarn.Newly built factoriesThe factories built during the high growth period have large margins and
allowances for production increase so that high losses would result if production
decreased. Therefore, suitably sized factories should be constructed.
- 1 6 -
3.2.2 SpinningRegarding technological trends in spinning, moves towards high speed and largepackage size have been investigated in order to achieve labor saving through as much
automation as possible. As a result, energy consumption has been graduallyincreasing, as shown in Figure 24. However, in view of price competition withoverseas companies, further labor saving as well as energy saving is desired.
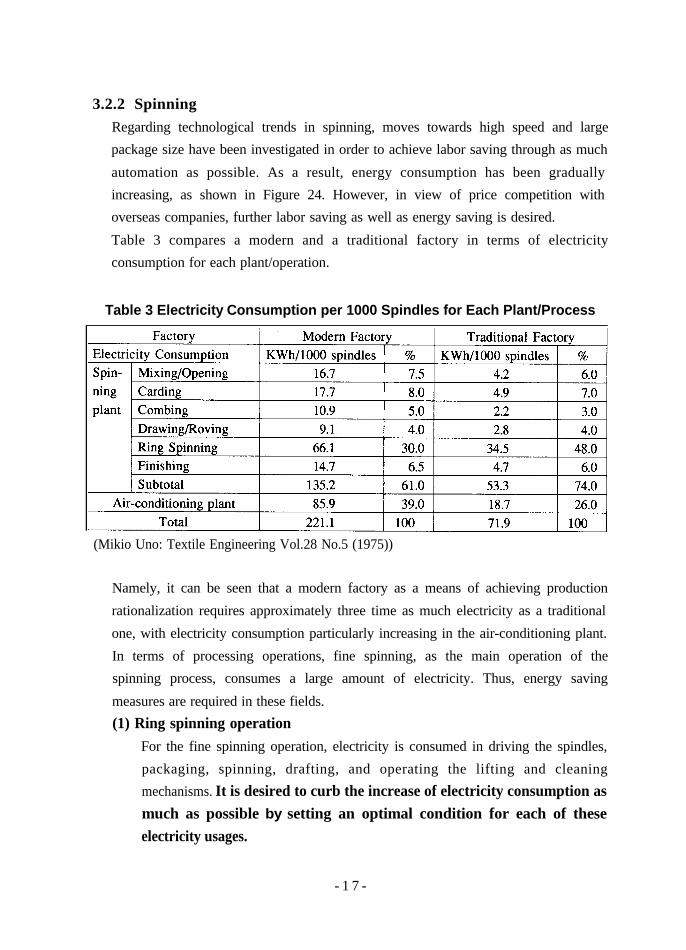
Table 3 compares a modern and a traditional factory in terms of electricityconsumption for each plant/operation.
Table 3 Electricity Consumption per 1000 Spindles for Each Plant/Process
(Mikio Uno: Textile Engineering Vol.28 No.5 (1975))
Namely, it can be seen that a modern factory as a means of achieving production
rationalization requires approximately three time as much electricity as a traditional
one, with electricity consumption particularly increasing in the air-conditioning plant.
In terms of processing operations, fine spinning, as the main operation of thespinning process, consumes a large amount of electricity. Thus, energy saving
measures are required in these fields.(1) Ring spinning operation
For the fine spinning operation, electricity is consumed in driving the spindles,
packaging, spinning, drafting, and operating the lifting and cleaningmechanisms. It is desired to curb the increase of electricity consumption asmuch as possible by setting an optimal condition for each of theseelectricity usages.
- 1 7 -
(2) Air-conditioningAlthough as an ideal working environment a room temperature less than 30°C isdesirable, in cases where the working environment has been drastically
improved in most other aspects with work load also reduced, a slightly increased
room temperature may be permitted. As has been reported, there was a case
where raising the regulated temperature from 30°C to 32°C resulted in areduction in the electric power demand of a carrier with a contract demand ofsome 8,000 kW by 190 kW. Also, there are many instances of seasonal
switch-over from a damper to a pulley as a means of readjusting the blown air
volume; this is in order to recycle the air sucked from the processing machinefor each operation through a filter back to the same room, and it is thereforenecessary to recheck the locations of fans for suction and returning.
3.2.3 Textured-yarn productionWhile synthetic-fiber textured-yam is mostly produced with false twisting machines,
its history of rationalization is characterized by challenges for high speed operation.As their operating speeds increased, driving and heat-curing motors and and other
peripheral equipment became larger, accompanied by an inevitable increase inelectricity consumption. Although this may be acceptable as long as the productionimprovement resulting from a high speed operation covers the increase in electricity
costs, reductions in energy cost would surface as an avoidable urgent task, should a
sharp increase in electricity charge occur. It can reasonably be said that the major form
of energy consumed in the production of synthetic finished-yarn is electricity (RefFigure 26). Although the amount of electricity consumed in each piece of equipment
varies with factory scale and the type of false twist machine, and therefore cannot be
treated in a standardized manner, generally accepted average values may be taken as
3.5 kWh/kg for a single heater system and 5.0 kWh/kg for a double heater system-
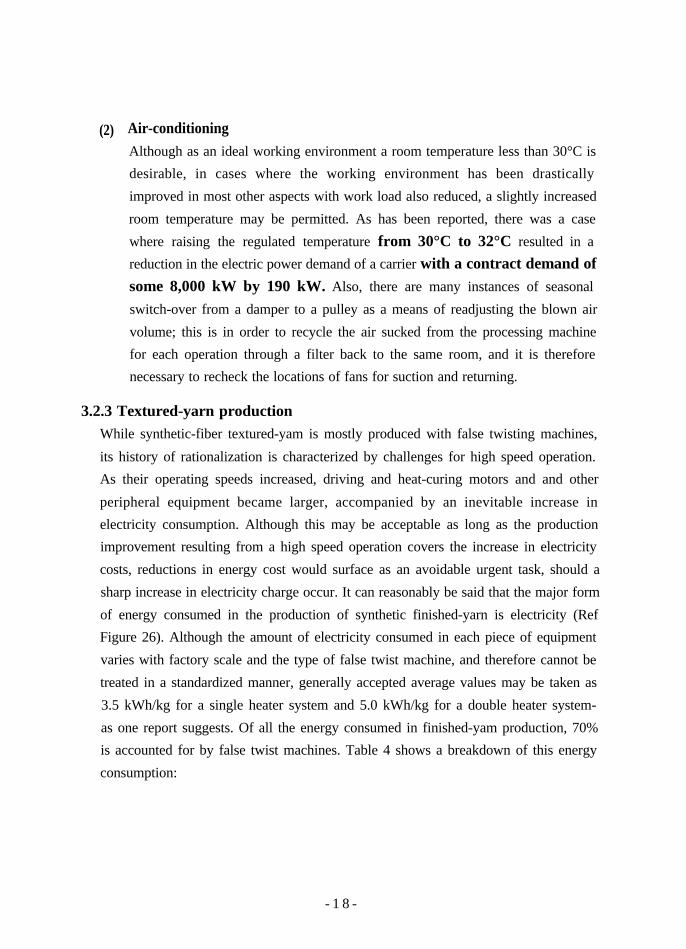
as one report suggests. Of all the energy consumed in finished-yam production, 70%is accounted for by false twist machines. Table 4 shows a breakdown of this energy
consumption:
- 1 8 -
Table 4 Example of False Twisting Machine and Electricity Consumption (kWh)
Processing Machine Single Heater (192 spindles) Double Heater (216 spindles)Equipment Capacity Utilized Capacity Utilized
Main motor 15.0 8.0 13.5 9.5Exhaust motorgas 1.5 1.0 2.2 1.5Yarn sucking motor 2.2 1.5 - -No. 1 heater 32.0 16.0 15.0 7.5No.2 heater - - 11.0 6.0
Total 50.7 26.5 46.7 24.5
(Edited by JTCC: Energy Conservation Techniques in Textile Industry, p.68, 1981)
As is seen from Table 4, 60% of all energy consumption by a false twist machine
occurs in the heater. Therefore, improvements in the heat insulation of the heaterand the lowering of heater temperature may be considered as energy saving
measures. Since the latter has implications in the characteristics of the finished-yam,
whether or not it is adopted should be examined on such occasions as in the
development of a new product.Since air-conditioning plants are designed based on the conditions applicable at the
time of installation, it is desirable that they be re-examined against the present
conditions.
3.2.4 WeavingAs is shown in Figure 24, rationalization in fabric production is such that whilevarious improvements in machinery aimed at high speed operation and labor saving
have been carried out, the amount of energy use per unit of the product has gradually
increased. Regarding loom design, high productivity shuttleless looms such as water
jet, rapier and gripper types have successfully been introduced, with air jet models putin practice in the production area of industrial fabric material. The amount of energy
consumed by each loom during its weaving operation can be estimated from the
motor capacity and weaving speed.Conventional shuttle looms are based on the weft-insertion method, incorporating a
shuttle zooming to and fro with a large inertia mass (approx. 400) and mounted withextra weft, and they also use energy consuming pirns as an integral part of the
machine. For this reason, the shuttleless looms’ contribution to energy saving cannot
be regarded as too high.
- 1 9 -
On the other hand, as a large amount of energy is consumed in sizing, as one of the
preparatory operations for weaving, the introduction of foam and solvent sizingoperations are being investigated. Furthermore, long fiber fabrics usingnonsizing filaments have been developed, eliminating the sizing process altogether.In a reported example, the introduction of a new heat exchanger into a sizingmachine with a very poor sealing capability achieved more than 40% of energysaving.
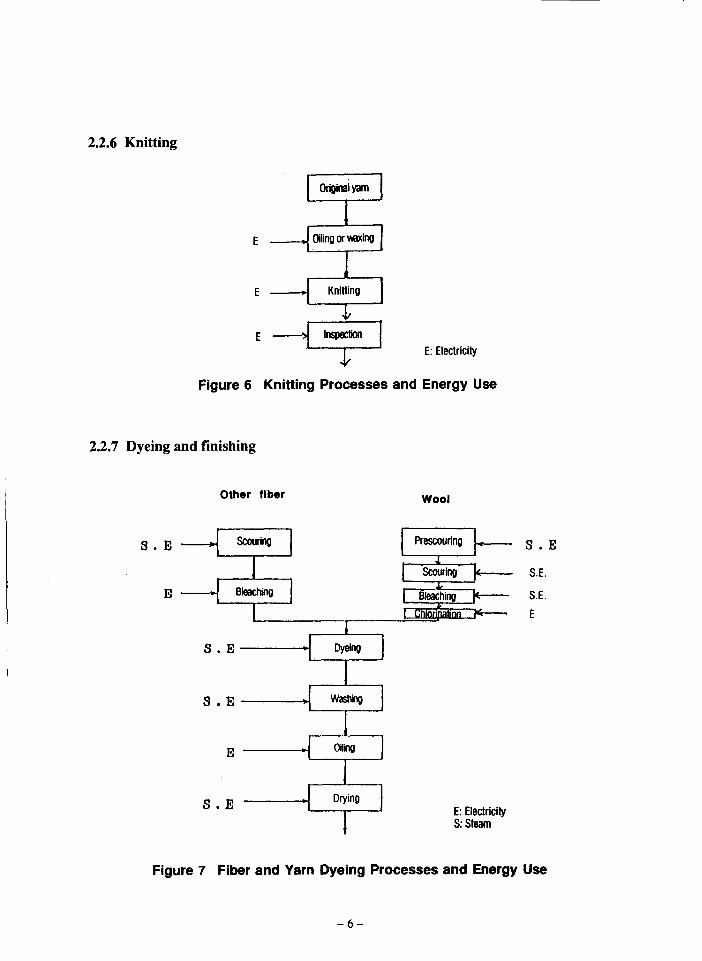
3.2.5 KnittingAs is shown in Table 13, the share of energy cost in the total cost of production is not
necessarily high for the knitting process. However, of the main production facilitiesfor this process, knitting machines have also been undergoing a shift towards high
speed and large capacity and fine gauge features; the current industry trend is for highadded-value goods and multi-line, small-volume production based on advanced
systems such as computer-controlled pattern making mechanisms. Therefore, a
potential tendency for increased energy consumption should be taken into account. Asa result, it is desirable to conduct a comprehensive re-examination of theproduction schedule along with the implementation of actual energyconservation measures in order to reduce or restrain the share of energy cost inthe total production cost.
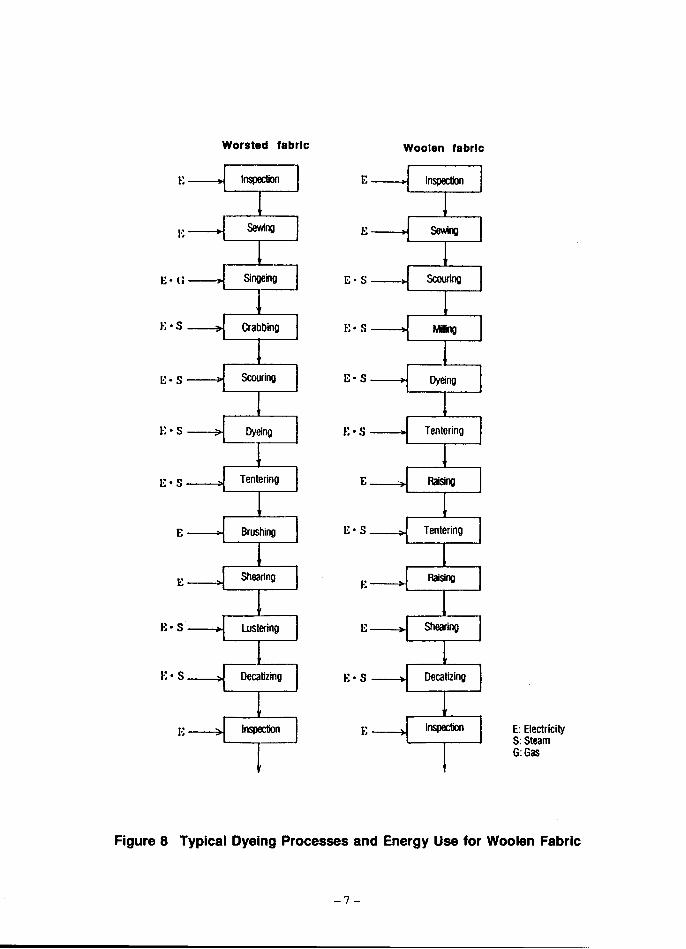
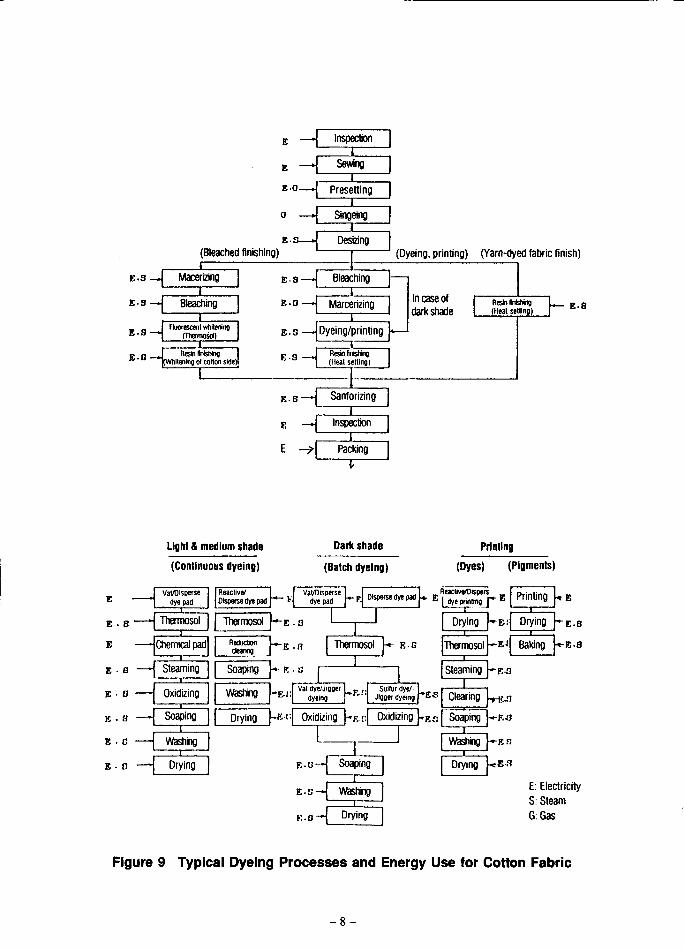
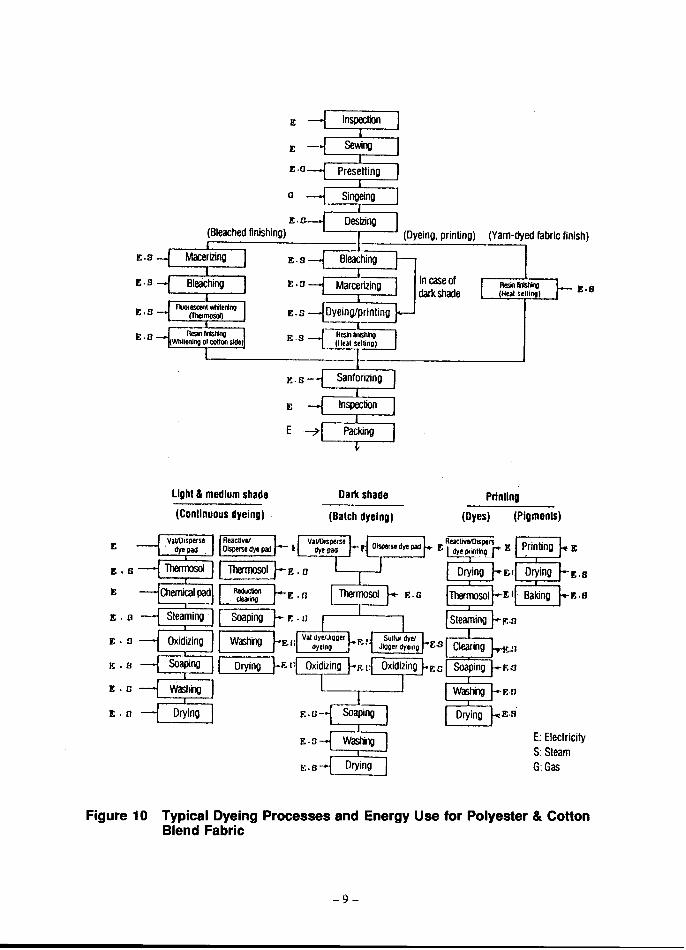
3.2.6 Dyeing and finishingIt is very important to advance energy conservation in the dyeing and finishingfield, which has a high energy consumption share in terms of both the amounts of
money and energy used, as shown in Table 1 and Figure 24.
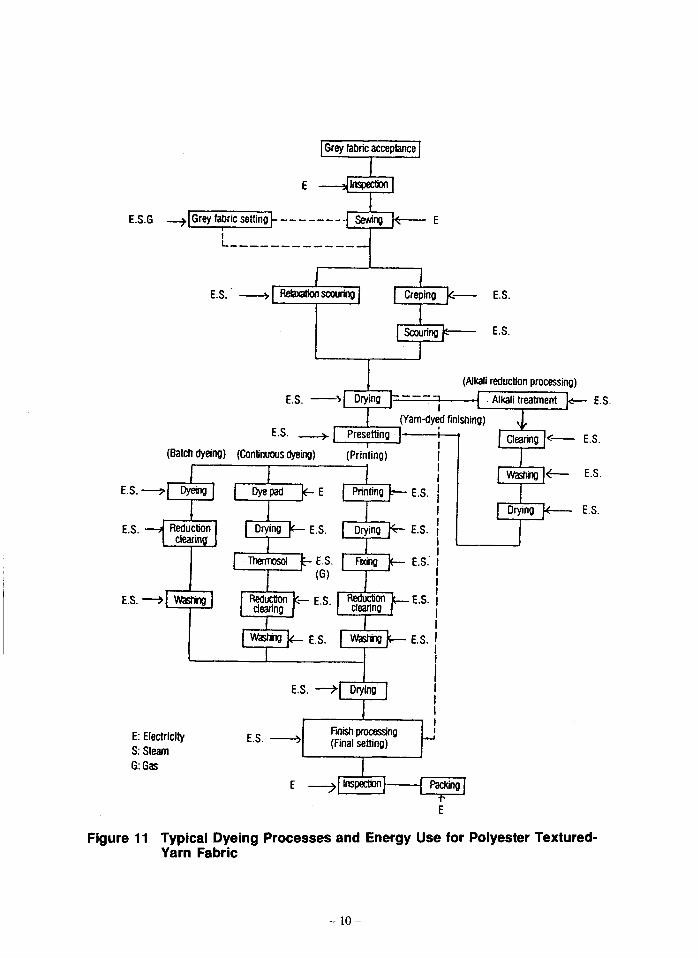
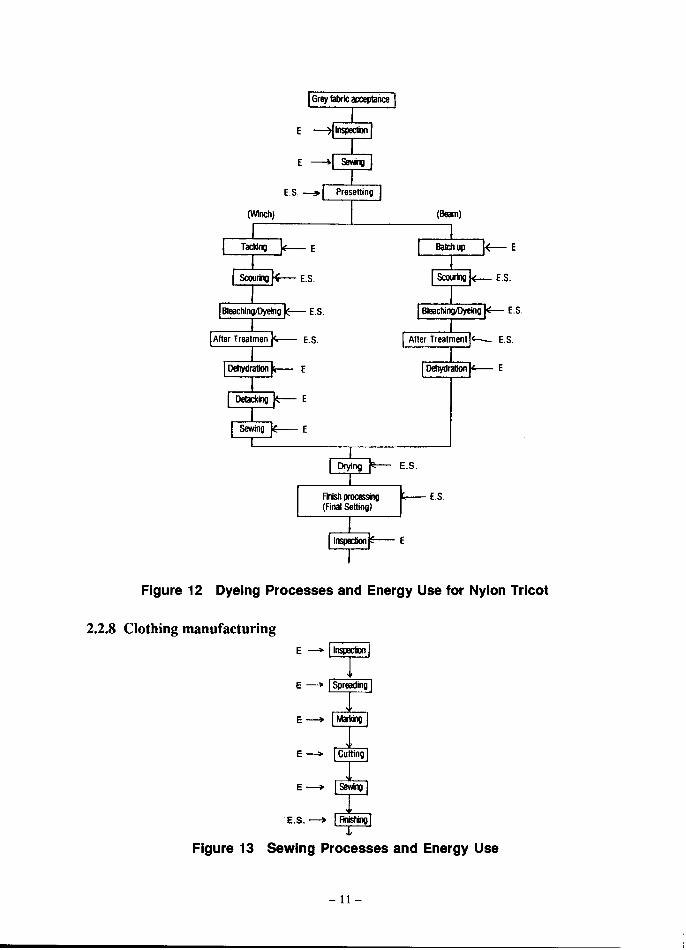
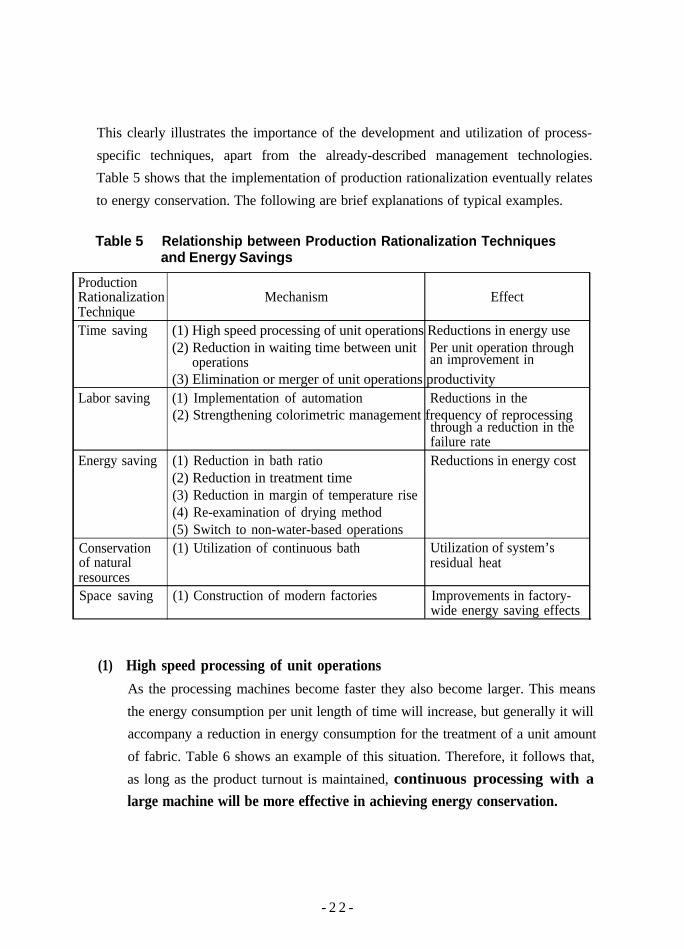
As is illustrated in Figures 7 to 12, the dyeing and finishing process consists of many
interwoven unit operations, and it is well known that the process generally goesthrough repeated wet and dry operations. The heat balance of a unit operation canmainly be considered as the difference between the total supplied heat on the one handand the sum of the heat required by the system and various forms of heat losses on
the other. Figure 14 graphically summarizes the major factors in a thorough
implementation of energy savings. Figure 15 shows an example of heat balance in a
continuous water cleansing machine.
- 2 0 -
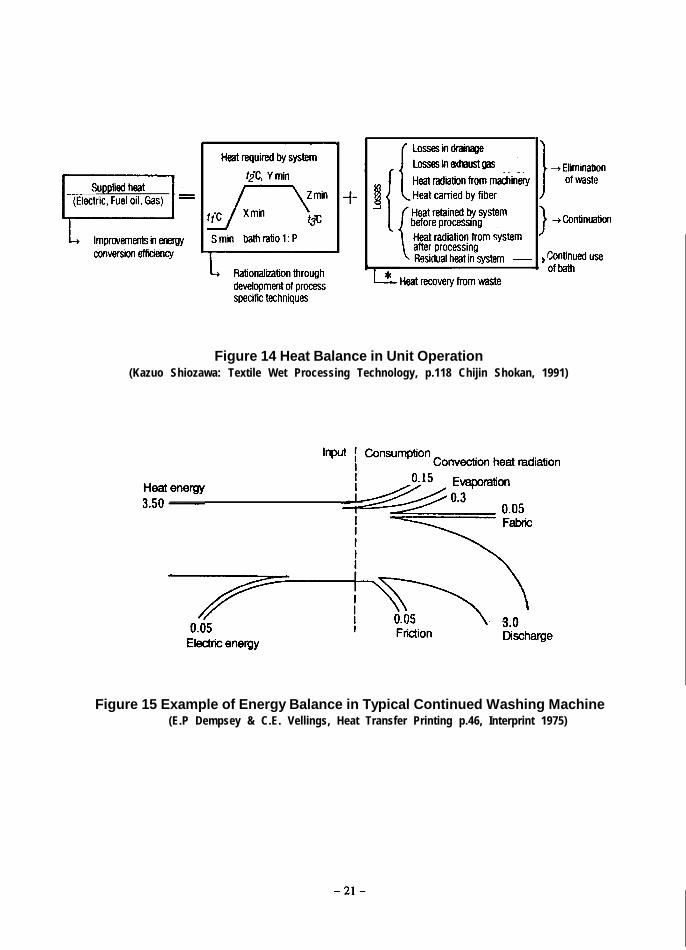
Figure 14 Heat Balance in Unit Operation(Kazuo Shiozawa: Textile Wet Processing Technology, p.118 Chijin Shokan, 1991)
Figure 15 Example of Energy Balance in Typical Continued Washing Machine(E.P Dempsey & C.E. Vellings, Heat Transfer Printing p.46, Interprint 1975)
-2l-
This clearly illustrates the importance of the development and utilization of process-
specific techniques, apart from the already-described management technologies.Table 5 shows that the implementation of production rationalization eventually relates
to energy conservation. The following are brief explanations of typical examples.
Table 5 Relationship between Production Rationalization Techniquesand Energy Savings
ProductionRationalization Mechanism EffectTechniqueTime saving (1) High speed processing of unit operations Reductions in energy use
(2) Reduction in waiting time between unit Per unit operation throughoperations an improvement in
(3) Elimination or merger of unit operations productivityLabor saving (1) Implementation of automation Reductions in the
(2) Strengthening colorimetric management frequency of reprocessingthrough a reduction in thefailure rate
Energy saving (1) Reduction in bath ratio Reductions in energy cost(2) Reduction in treatment time(3) Reduction in margin of temperature rise(4) Re-examination of drying method(5) Switch to non-water-based operations
Conservation (1) Utilization of continuous bath Utilization of system’sof natural residual heatresourcesSpace saving (1) Construction of modern factories Improvements in factory-
wide energy saving effects
(1) High speed processing of unit operationsAs the processing machines become faster they also become larger. This means
the energy consumption per unit length of time will increase, but generally it willaccompany a reduction in energy consumption for the treatment of a unit amount
of fabric. Table 6 shows an example of this situation. Therefore, it follows that,
as long as the product turnout is maintained, continuous processing with alarge machine will be more effective in achieving energy conservation.
- 2 2 -
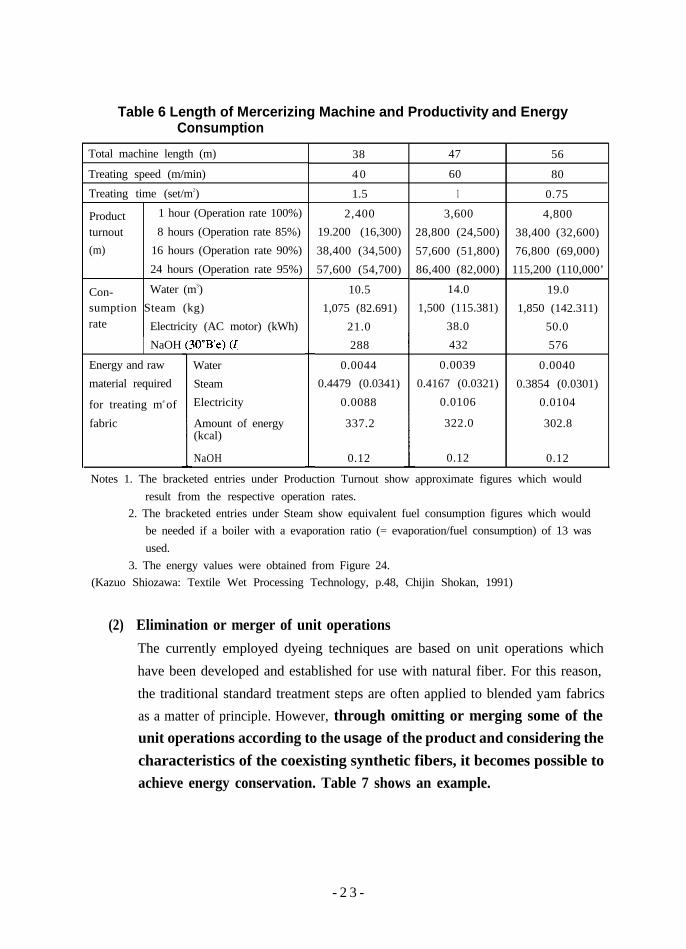
Table 6 Length of Mercerizing Machine and Productivity and EnergyConsumption
Total machine length (m)
Treating speed (m/min)
Treating time (set/m2)
Product 1 hour (Operation rate 100%)
turnout 8 hours (Operation rate 85%)(m) 16 hours (Operation rate 90%)
24 hours (Operation rate 95%)
Con- Water (m3)sumption Steam (kg)rate Electricity (AC motor) (kWh)
NaOH
Energy and rawmaterial required
for treating ma of
fabric
WaterSteamElectricity
Amount of energy(kcal)
NaOH
38 47 56
4 0 60 80
1.5
2,40019.200 (16,300)
38,400 (34,500)
57,600 (54,700)
10.51,075 (82.691)
21.0288
0.00440.4479 (0.0341)
0.0088
337.2
0.12
1
3,600 4,80028,800 (24,500) 38,400 (32,600)57,600 (51,800) 76,800 (69,000)86,400 (82,000) 115,200 (110,000’
14.0 19.01,500 (115.381) 1,850 (142.311)
38.0 50.0432 576
0.0039 0.00400.4167 (0.0321) 0.3854 (0.0301)
0.0106 0.0104
322.0 302.8
0.12 0.12
0.75
Notes 1. The bracketed entries under Production Turnout show approximate figures which wouldresult from the respective operation rates.
2. The bracketed entries under Steam show equivalent fuel consumption figures which wouldbe needed if a boiler with a evaporation ratio (= evaporation/fuel consumption) of 13 wasused.
3. The energy values were obtained from Figure 24.(Kazuo Shiozawa: Textile Wet Processing Technology, p.48, Chijin Shokan, 1991)
(2) Elimination or merger of unit operationsThe currently employed dyeing techniques are based on unit operations which
have been developed and established for use with natural fiber. For this reason,
the traditional standard treatment steps are often applied to blended yam fabricsas a matter of principle. However, through omitting or merging some of theunit operations according to the usage of the product and considering thecharacteristics of the coexisting synthetic fibers, it becomes possible toachieve energy conservation. Table 7 shows an example.
- 2 3 -
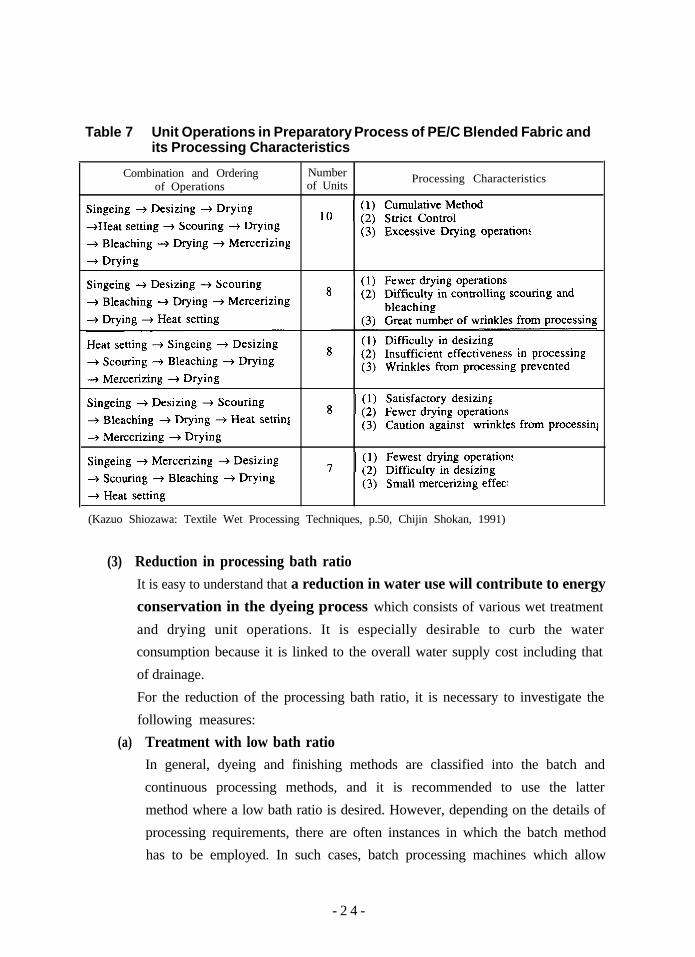
Table 7 Unit Operations in Preparatory Process of PE/C Blended Fabric andits Processing Characteristics
Combination and Ordering Numberof Operations of Units Processing Characteristics
(Kazuo Shiozawa: Textile Wet Processing Techniques, p.50, Chijin Shokan, 1991)
(3) Reduction in processing bath ratioIt is easy to understand that a reduction in water use will contribute to energyconservation in the dyeing process which consists of various wet treatment
and drying unit operations. It is especially desirable to curb the waterconsumption because it is linked to the overall water supply cost including that
of drainage.
For the reduction of the processing bath ratio, it is necessary to investigate the
following measures:
(a) Treatment with low bath ratioIn general, dyeing and finishing methods are classified into the batch and
continuous processing methods, and it is recommended to use the latter
method where a low bath ratio is desired. However, depending on the details of
processing requirements, there are often instances in which the batch methodhas to be employed. In such cases, batch processing machines which allow
- 2 4 -
lower bath ratios such as the jigger, wince, beam, pad roll and jet flow types
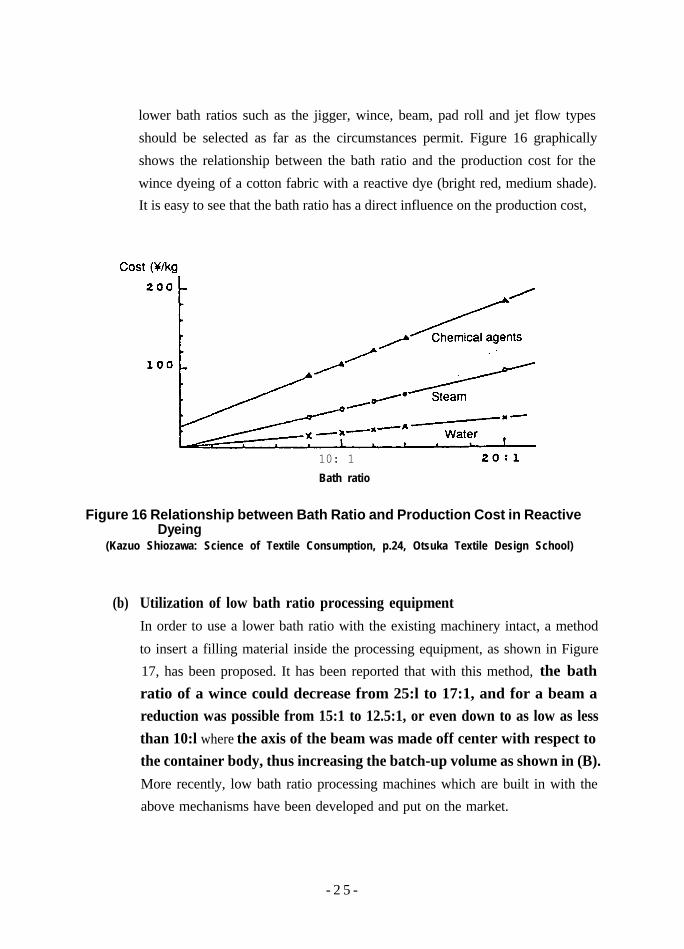
should be selected as far as the circumstances permit. Figure 16 graphically
shows the relationship between the bath ratio and the production cost for the
wince dyeing of a cotton fabric with a reactive dye (bright red, medium shade).It is easy to see that the bath ratio has a direct influence on the production cost,
10: 1Bath ratio
Figure 16 Relationship between Bath Ratio and Production Cost in ReactiveDyeing
(Kazuo Shiozawa: Science of Textile Consumption, p.24, Otsuka Textile Design School)
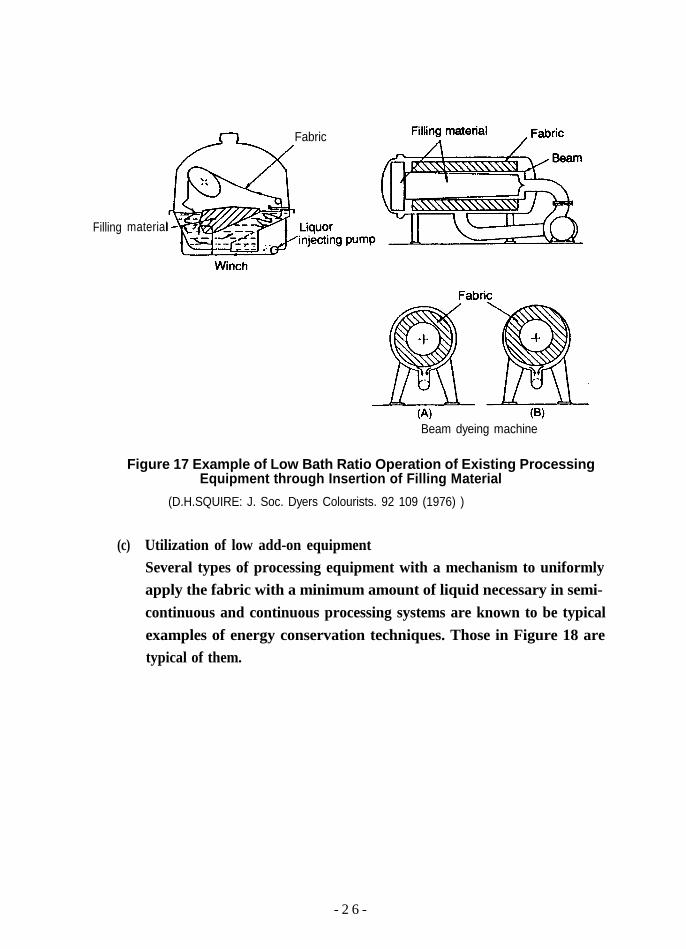
(b) Utilization of low bath ratio processing equipmentIn order to use a lower bath ratio with the existing machinery intact, a method
to insert a filling material inside the processing equipment, as shown in Figure17, has been proposed. It has been reported that with this method, the bathratio of a wince could decrease from 25:l to 17:1, and for a beam areduction was possible from 15:1 to 12.5:1, or even down to as low as lessthan 10:l where the axis of the beam was made off center with respect tothe container body, thus increasing the batch-up volume as shown in (B).More recently, low bath ratio processing machines which are built in with theabove mechanisms have been developed and put on the market.
- 2 5 -
Filling material
Fabric
Beam dyeing machine
Figure 17 Example of Low Bath Ratio Operation of Existing ProcessingEquipment through Insertion of Filling Material
(D.H.SQUIRE: J. Soc. Dyers Colourists. 92 109 (1976) )
(c) Utilization of low add-on equipmentSeveral types of processing equipment with a mechanism to uniformlyapply the fabric with a minimum amount of liquid necessary in semi-continuous and continuous processing systems are known to be typicalexamples of energy conservation techniques. Those in Figure 18 aretypical of them.
- 2 6 -
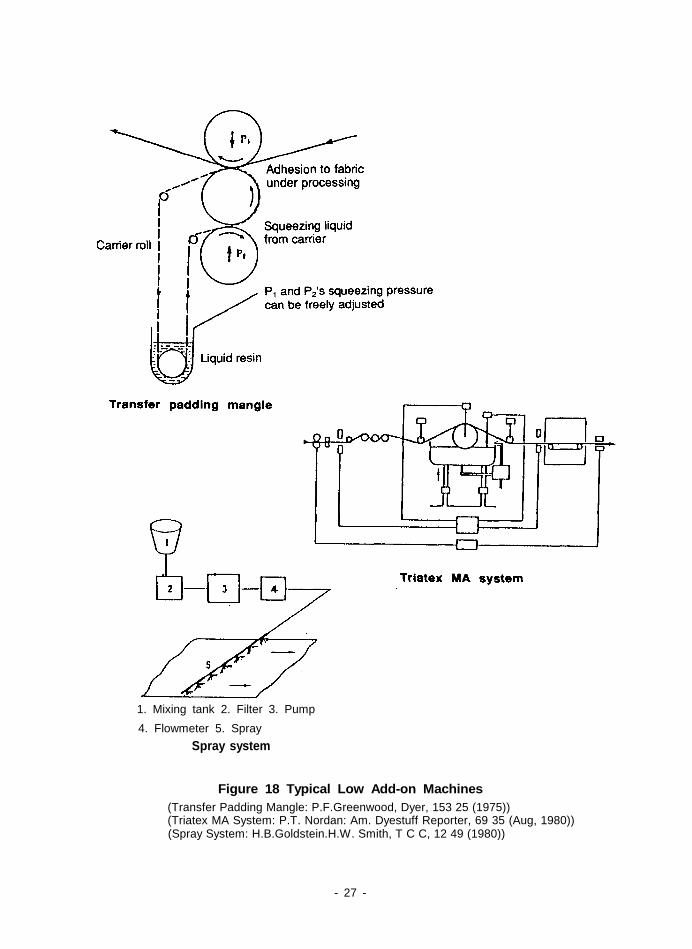
1. Mixing tank 2. Filter 3. Pump
4. Flowmeter 5. SpraySpray system
Figure 18 Typical Low Add-on Machines(Transfer Padding Mangle: P.F.Greenwood, Dyer, 153 25 (1975))(Triatex MA System: P.T. Nordan: Am. Dyestuff Reporter, 69 35 (Aug, 1980))(Spray System: H.B.Goldstein.H.W. Smith, T C C, 12 49 (1980))
- 27 -
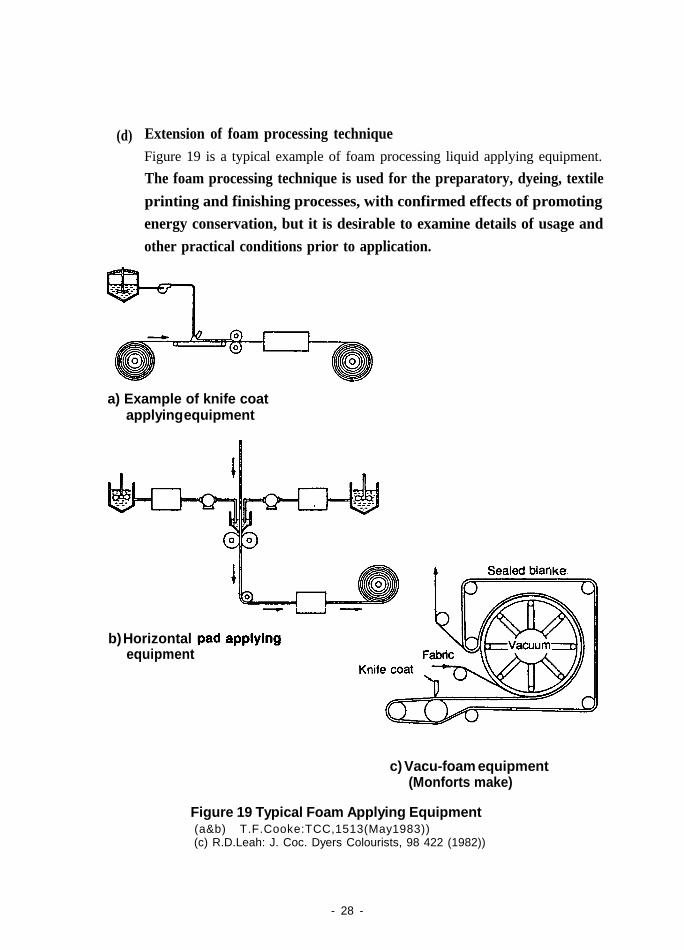
(d) Extension of foam processing techniqueFigure 19 is a typical example of foam processing liquid applying equipment.The foam processing technique is used for the preparatory, dyeing, textileprinting and finishing processes, with confirmed effects of promotingenergy conservation, but it is desirable to examine details of usage andother practical conditions prior to application.
a) Example of knife coatapplying equipment
b) Horizontalequipment
c) Vacu-foam equipment(Monforts make)
Figure 19 Typical Foam Applying Equipment(a&b) T.F.Cooke:TCC,1513(May1983))(c) R.D.Leah: J. Coc. Dyers Colourists, 98 422 (1982))
- 28 -
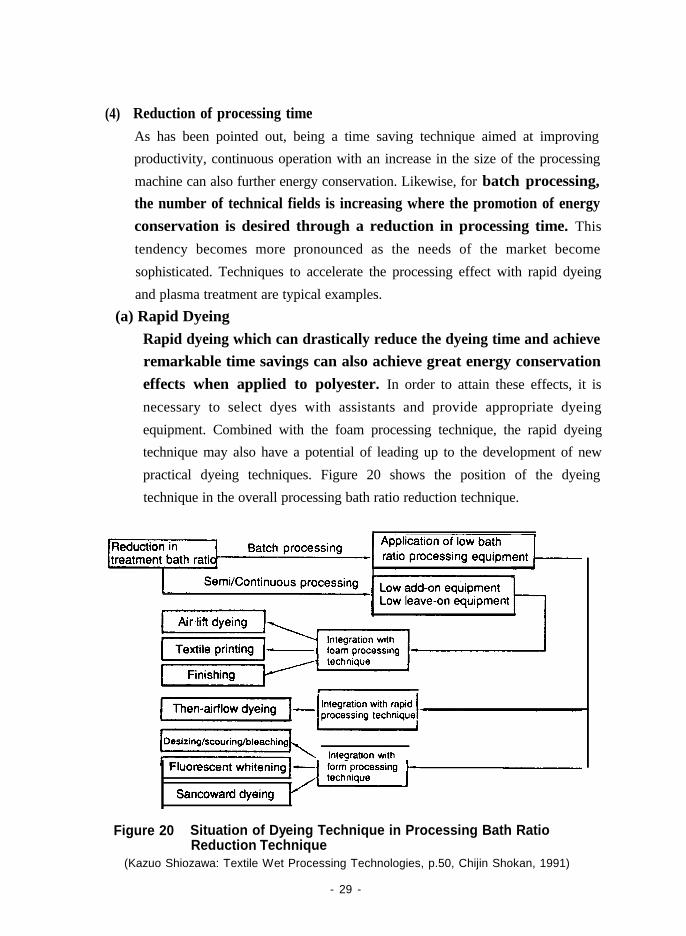
(4) Reduction of processing timeAs has been pointed out, being a time saving technique aimed at improvingproductivity, continuous operation with an increase in the size of the processing
machine can also further energy conservation. Likewise, for batch processing,the number of technical fields is increasing where the promotion of energyconservation is desired through a reduction in processing time. This
tendency becomes more pronounced as the needs of the market become
sophisticated. Techniques to accelerate the processing effect with rapid dyeing
and plasma treatment are typical examples.(a) Rapid Dyeing
Rapid dyeing which can drastically reduce the dyeing time and achieveremarkable time savings can also achieve great energy conservationeffects when applied to polyester. In order to attain these effects, it is
necessary to select dyes with assistants and provide appropriate dyeing
equipment. Combined with the foam processing technique, the rapid dyeingtechnique may also have a potential of leading up to the development of new
practical dyeing techniques. Figure 20 shows the position of the dyeing
technique in the overall processing bath ratio reduction technique.
Figure 20 Situation of Dyeing Technique in Processing Bath RatioReduction Technique
(Kazuo Shiozawa: Textile Wet Processing Technologies, p.50, Chijin Shokan, 1991)
- 29 -
(b) Accelerating techniques for processing effectsAiming at a reduction of processing time, the combined use of a number of
new techniques are being studied and it has been reported that processing with
plasma, ultrasound, magnetism and radioactive rays accelerates processingeffects. Various methods are being investigated to reduce processing time
through accelerating processing effects using these techniques in preprocessing,
postprocessing, simultaneous processing, etc.
(5) Reduction in temperature rise marginIn many cases, unit operations of the dyeing process are carried out at high
temperature. Therefore, to reduce the required margin of temperature risefrom heating is very important in view of achieving funda-mental energyconservation along with reductions in processing time. These measures need
to be addressed from the following two viewpoints:
(a) Raising temperature of inlet waterIf the temperature of the inlet water to be used in the dyeing processbecomes relatively higher, the amount of energy to be consumed inraising it to the predetermined value will be reduced. For that purpose,cooperation within a company, or that involving more than one company
(using low temperature inlet water at the dyeing factory for cooling purposes,and the high temperature discharge from the cooling system for dyeing
purposes) should be investigated, as well as the utilization of natural resources
(for example, geothermal and solar energy)
(b) Development and introduction of low temperature processing techniquesIt is important to continue with technological development aimed specifically at
lowering the processing temperature along with raising the inlet water
temperature. It would naturally involve the integration of this method with theprocessing speed acceleration techniques described in (4) (b). Low temperature
scouring, bleaching, dyeing and curing techniques are some of the practicalexamples of this.
- 3 0 -
(6) Re-examination of drying methodAn important consideration along with the reduction of the processing bath ratio
is a re-examination of drying operations. A drying operation is, in principle,
inserted after every other unit operation and is an important operation which notonly determines drying efficiency as such but also has a direct influence on the
morphological stability and texture of the final product. For this reason, various
types of drying equipment have been selected and put to practical use, depending
on the fiber material and form involved. In view of implementing energy saving
measures, it is particularly important to investigate the following three items:(a) Reduction of drying operations in number
As can be seen from Table 7, a detailed study of typical preparatory processconfigurations reveals that drying operations are involved in relatively high
numbers, ranging from one to four units or 14% to 40% of all unit operationsin the entire process. Therefore, combinations of unit operations should be
sought after such that drying operations between standard unit operations can
be eliminated as much as possible. It is especially necessary to cut down on
drying operations in preparatory processes which will not directly affect the
product’s performance or appearance quality. However, an operation whichwould have come after an eliminated drying operation would have to treat wet
fabrics, thereby necessitating special measures that would enable wet on wet
treatment.(b) Improvements in drying efficiency
It is desirable to investigate possible improvements in the drying efficiency in
terms of efficiencies of both the dewatering and drying steps. While it is well
known that the most efficient methods of dewatering and drying are by means
of a mangle and a cylinder dryer, methods which have been practiced for a long
time, they are also known to have limitations in terms of applicable fibermaterials and forms. It is necessary to investigate new drying methods (high
frequency drying, microwave heating, far infrared radiation heating, etc.)
together with other measures such as utilizing vacuum liquid removal, adding a
drying-facilitating organic solvent to the treatment liquid, and combining foamtreatment systems with non-foam ones.
- 3 1 -
(c) Recovery of heat energyAlong with active energy saving measures, it is important to carry out thecollection and recycling of the energy used in unit operations. The collection of
heat energy should start with thoroughly grasping the basic energy balance of
each unit operation (eg. Ref.Figure 15).
(7) Shift to solvent processingIn the dyeing process, although water has been used as the only abundant and
cheap resource so far, it is becoming difficult to obtain high quality water in large
quantities at a low cost. The worsening of river pollution coinciding with anincrease in population density is inevitably creating a situation where the cost ofwater will gradually increase, including the investment for improvements in
waste-water treatment facilities. In addition, although dry-system processing hasbeen contemplated for a long time due to the fact that most energy is consumed
in the heating and evaporating operations, it has to date only been applied to aspecific area on a limited scale. However, it is a technique which deserves
attention as a promising process in the mid- to long-term future. This techniquehas the following two variations:
(a) Organic solvent processingWhile the solvents to be used for dyeing processing are categorized into fourmain groups--halogenated hydrocarbons, petroleum derivatives, aromatics and
oxygen-containing solvents--halogenated hydrocarbons are generally recom-
mended as they do not cause a fire or explosion (provided that thorough
countermeasures to groundwater pollution are taken). It is well known thatin terms of energy conservation, these solvents have an advantage overwater-based ones in all of these aspects: specific heat, latent heat for
evaporation, heat needed for evaporation and evaporation speed. There are anumber of proposals for solvent scouring, solvent dyeing and solventfinishing, including those already put to practical use as a differentiating
technique.
- 32 -
(b) Inorganic solvent processingLiquid ammonia is one of the agents being considered for dyeing applications
as a inorganic solvent. Of its typical processing techniques, liquid ammoniamercerizing and liquid ammonia dying are given particular attention.
Use of continuous bathWhile textile manufacturing techniques which promote the conservation of
natural resources include grease refinement from raw wool, the collection and
recycling of warp sizing agents, and the re-use of alkaline waste liquid arisingfrom the mercerizing process in a scouring bath, in terms of energyconservation the use of continuous baths which utilize the residual heat ofthe system are particularly important in view of energy conservation.If the continuous use of a processing bath is introduced with the necessaryconditions being met, thus allowing only those materials consumed in the dyeing
process to be replenished, in particular with the unit operations designed for the
batch method, it will greatly contribute to the recycling of heat energy in addition
to achieving the conservation of natural resources and the rationalization of
countermeasures to water waste. In the dyeing process with a high heat
consumption, the use of the continuous bath deserves particular attentionas a technique whose practical application is an urgent task to helpimplement the remaining rationalization measures.
(9) Space savingWith an expansion in the practical use of knit mercerizing and ammonia
mercerizing, the characteristics of the hot mercerizing technique is also attracting
attention. It has been pointed out that, since poor uniformity associated with the
traditional mercerizing due to the hydrophobic nature of cotton grey fabric isdissolved in hot mercerizing which uses heated sodium hydroxide, the
rationalization of the preparatory process can be greatly advanced. Figure 21shows an example of comparing some space saving effects achieved by the
introduction of hot mercerizing. Table 8 compares operating conditions of thesame three factories. At the time a new space-efficient factory is being built, it is
possible to incorporate a program to introduce such facilities as to be completewith factory-wide energy conservation measures.
- 33 -

Note Factory A: Although it has the same types of machines as Factory B, it has introduced adrying operation for each unit operation, emphasizing flexibility.Factory B: Considers the production rationalization resulting from continuous processing./Factory C: It has the same production capability as Factory B, but has reduced thepreparatory process related to mercerizing.
Figure 21 Space Saving Resulting from Introduction of Hot Mercerizing(C. Duckworth, L. M. Wreenall: Soc. Dyers Colour Colourists, 93 407 (1977))
Table 8 Comparison of Actual Operating Conditions of Three Factories
Factory
- 34 -
3.2.7 Clothing manufacturingThe energy consumption share of the clothing manufacturing division which consistsof large numbers of small-sized companies and their employees in the overall textile
industry is not necessarily low, as seen from Table 1, but the ratio of energy cost tothe total cost is relatively low, as can be deduced from Figure 25. However, the
energy cost forecast is inevitably a gradual increase under circumstances where the
production of high value-added goods is required, along with the implementation of
labor saving measures, as a result of the challenging market environment
characterized by personalized and diversified consumer needs, high demand forquality goods, short product cycles, etc. Therefore, it is desirable that a comprehensive
rationalization program be investigated apart from reductions in energy consumption.
4. Actual Conditions of the Textile Industry in Japan
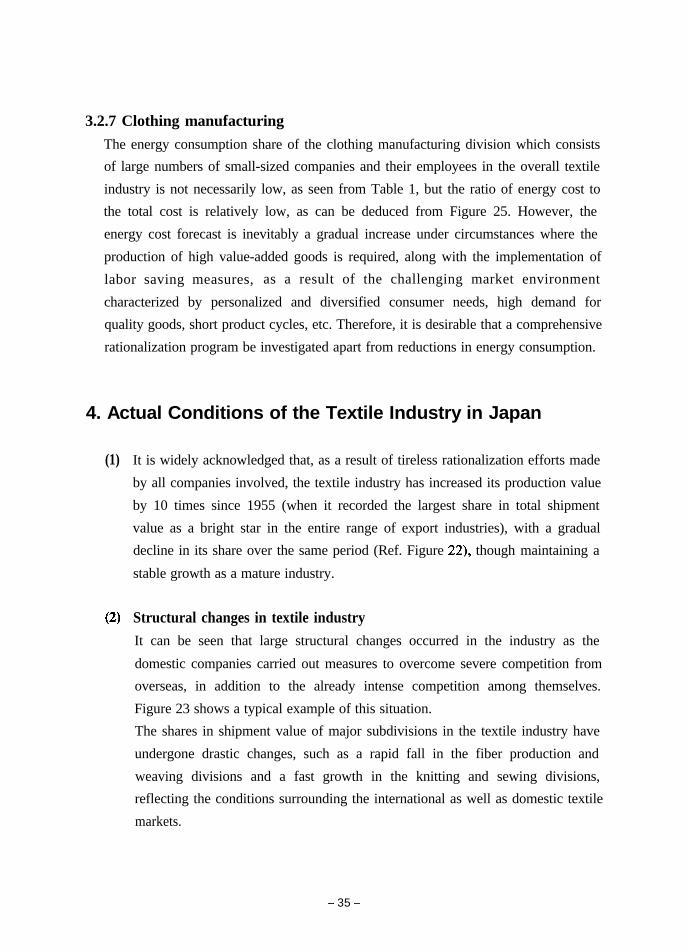
(1) It is widely acknowledged that, as a result of tireless rationalization efforts made
by all companies involved, the textile industry has increased its production value
by 10 times since 1955 (when it recorded the largest share in total shipment
value as a bright star in the entire range of export industries), with a gradualdecline in its share over the same period (Ref. Figure 22), though maintaining a
stable growth as a mature industry.
(2) Structural changes in textile industryIt can be seen that large structural changes occurred in the industry as the
domestic companies carried out measures to overcome severe competition fromoverseas, in addition to the already intense competition among themselves.
Figure 23 shows a typical example of this situation.The shares in shipment value of major subdivisions in the textile industry have
undergone drastic changes, such as a rapid fall in the fiber production and
weaving divisions and a fast growth in the knitting and sewing divisions,reflecting the conditions surrounding the international as well as domestic textile
markets.
- 35 -
Product Shipment Values (MO billion)
100 500 l,ooo zoo0 3,ooo 4,Qm
1966
Chemical industry 7.5
J7.5 1 11 Textile industry 4.5
j
3.3 Publiihfng and printing 3.7
3.4 Ceramic, and earth and quarrying industries 3.4
1.9 Petroleum and coal industries 3.2
Plastic products 3.2
4.2
iI
Pulp, paper and processed paper products 2.8
4.2 Nonferrous metal 2.2
9.9 ~ ! Others 7.6 I
Notes 1. The graphs were drawn using data from the Tabulated Industrial Statistics.2. Figures inside the bar graphs represent shares for the respective fiscal years.
Figure 22 Changes in Product Shipment Values for Various industries
1965
1965
1975
1989
44
8.68.6 28.528.5 31.431.4 i 5.6 6.9i 5.6 6.9 6.66.6 12.412.411::
\\
:: II II44
,A ,/' ',A ,/' '\\ :: . /'. /' ,/,/ ,I/,I/ ii
12.012.0 22.922.9 20.720.7 8.8 12.78.8 12.7 13.213.2II
1'1' .'.' .c.c ...... /*/* /.':/.': ,0',0' III'I' .*.* I*I*
.#.# ,R',R' .*'.*' ,','I'I' ::IIII
8.18.1 i2.ai2.a 18.118.1 11 13.013.0 JO.7JO.7 23.023.0 14.314.3II
II ,, ///*/* ,, //,, ,,//,, // ,','// // 11
15.315.3 10.410.4 32.432.4 14.414.4
C!f.?;yl Spinning Weaving Knitting(Fabric Production)
Dyeing Sewing Others
Note Graphs were drawn using data from the Industrial Statistical Table. Sewing combinesvarious textile manufacturing including clothing manufacturing.
Figure 23 Structural Changes in Textile Industry
- 36 -
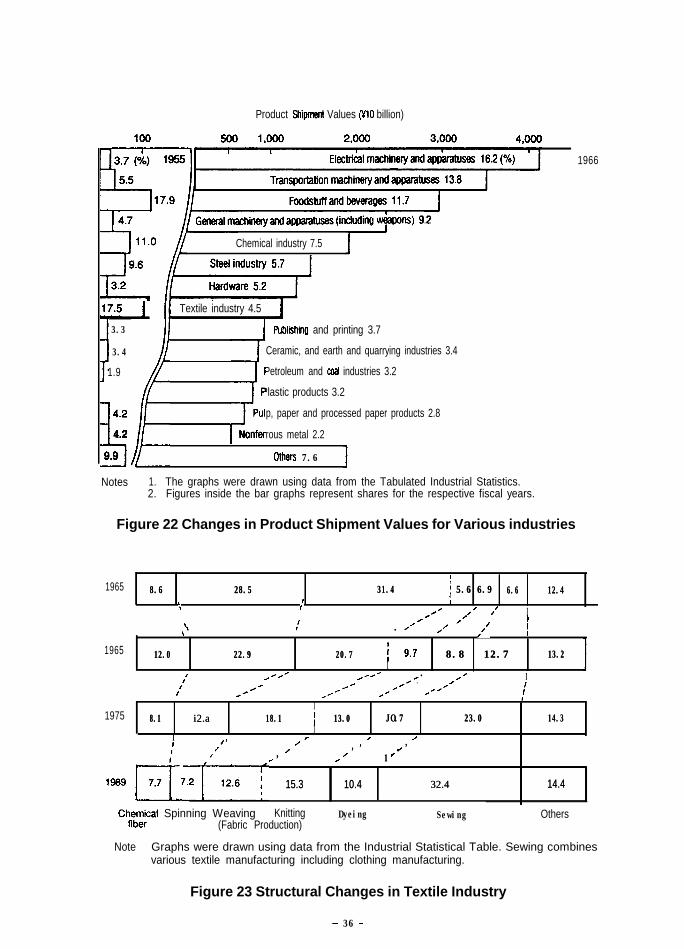
(3) Progress in production rationalizationTable 9 compares and summarizes the progress made in production rationaliza-tion by some typical subdivisions of the textile industry.
Table 9 Progresses in Production Rationalization by Typical Textile IndustrySubdivisions
Subdivision unit Fiscal Year 1955 1960 1965 1970 1973 1975 1980 1985 1990
Fiber kg/person/month 507 672 1,035 2,097 2,759 2,237 4,776 6,021 a.264
Production VlO,OOO/person/month 14.2 24.7 42.4 90.8 106.8 101.9 231.9 286.1 326.5
Spinning kg/person/month 294 375 479 613 734 726 1,166 1,419 1,655
YlO,OOO/person/month 14.9 18.1 24.0 36.2 60.1 64.9 110.2 134.6 131.0
Fabric m2/person/month 917 1,073 1,215 1,603 1,900 1,703 2,464 2,943 3,337
Production YlO,OOO/person/month 8.8 9.7 12.8 25.3 41.8 47.7 74.3 91.4 137.7
Dyeing and m2/person/month 4,907 5,450 7,569 7,431 9,379 9,964 12,028 15,424 16.502
Finishing YlO,OOO/person/month 7.0 11.3 15.1 27.1 42.6 57.3 82.4 104.0 119.3
Notes 1
23
4
Since quantities and sums were taken from the Annual Report on Textile Statistics and theTabulated Industrial Statistics, respectively, they do not necessarily correspond to each other.Fabric only represents woven materials and does not include knitted ones.1973 is the year when the oil shock broke out and as a result textile consumption reachedits maximum.Sums for 1990 are the actual results for 1989.
Despite a strong tendency towards multi-line small-volume production in
response to requirements for high value-added products from the fashionmarket, there is a marked growth in both per capita monthly production volume
and product value. Regarding future trends, while the latter is difficult to estimate
as it depends on the goods’ prices, which are in turn to be determined by a
balance between demand and supply, the former may be more easily foreseen as
continuing with its increasing trend as a result of advances in the sophisticationof production equipment, if profitability is ignored. However, due to the high
level of rationalization already incorporated in such equipment, it will be
reasonable to expect that attempts to achieve further improvements in this respectwill inevitably meet with considerable difficulty.
- 37 -
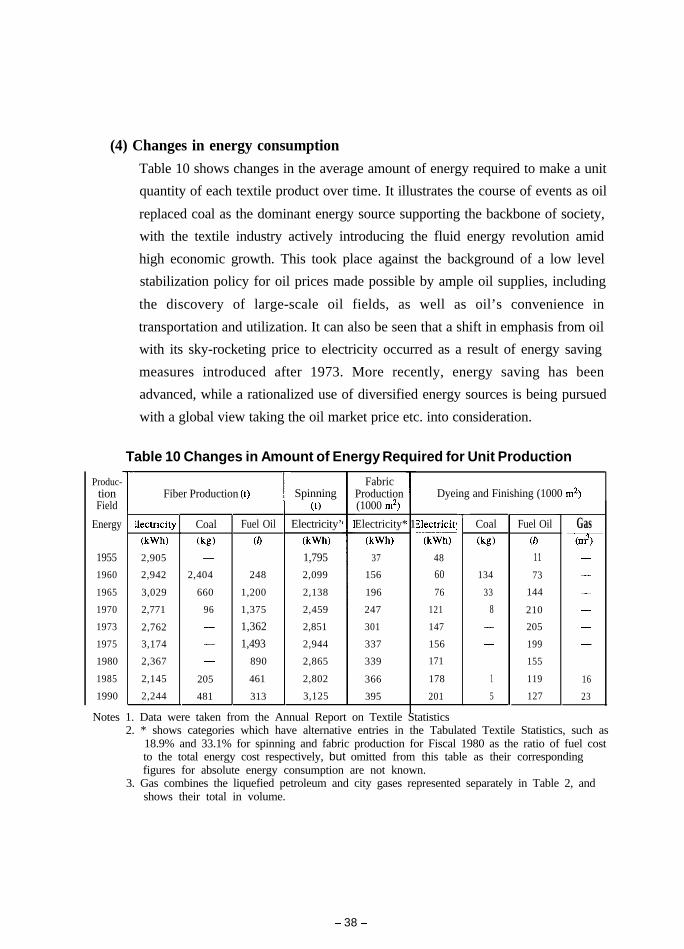
(4) Changes in energy consumptionTable 10 shows changes in the average amount of energy required to make a unitquantity of each textile product over time. It illustrates the course of events as oil
replaced coal as the dominant energy source supporting the backbone of society,with the textile industry actively introducing the fluid energy revolution amid
high economic growth. This took place against the background of a low levelstabilization policy for oil prices made possible by ample oil supplies, including
the discovery of large-scale oil fields, as well as oil’s convenience in
transportation and utilization. It can also be seen that a shift in emphasis from oilwith its sky-rocketing price to electricity occurred as a result of energy saving
measures introduced after 1973. More recently, energy saving has beenadvanced, while a rationalized use of diversified energy sources is being pursued
with a global view taking the oil market price etc. into consideration.
Table 10 Changes in Amount of Energy Required for Unit Production
Produc-tionField
Energy
19551960
1965
1970
1973
1975
1980
1985
1990
T Fiber Production (t) !IectricityWW2,905
2,942
3,029
2,771
2,762
3,174
2,367
2,145
2,244
Coal(kg)-
2,404
660
96---
205
481
Fuel OilVI
248
1,200
1,375
1,3621,493
890
461
313
Spinning(0
Electricity’W’W1,7952,099
2,138
2,459
2,851
2,944
2,865
2,802
3,125
FabricProduction(1000 mZ)Electricity*
WW37
156
196
247
301
337
339
366
395
i 1
Dyeing and Finishing (1000 m*)
3lectricit------L(k-W
48
6076
121
147
156
171
178
201
Coal(kg)
134
33
8--
15
Fuel Oil01173
144
210
205
199
155
119
127
Gas7-F------
16
23
Notes 1. Data were taken from the Annual Report on Textile Statistics2. * shows categories which have alternative entries in the Tabulated Textile Statistics, such as
18.9% and 33.1% for spinning and fabric production for Fiscal 1980 as the ratio of fuel costto the total energy cost respectively, but omitted from this table as their correspondingfigures for absolute energy consumption are not known.
3. Gas combines the liquefied petroleum and city gases represented separately in Table 2, andshows their total in volume.
- 38 -
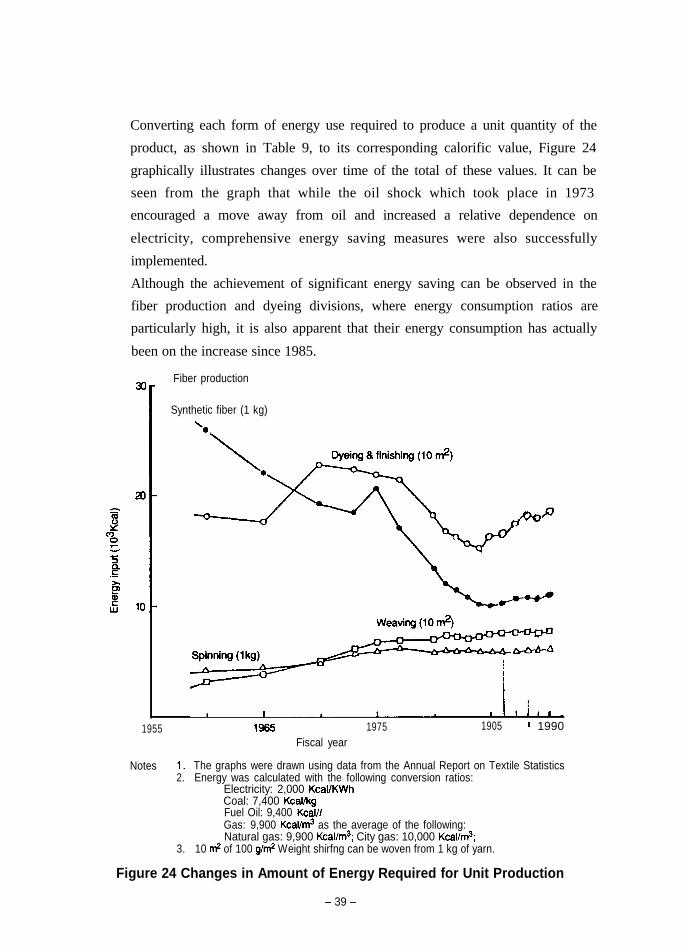
Converting each form of energy use required to produce a unit quantity of the
product, as shown in Table 9, to its corresponding calorific value, Figure 24
graphically illustrates changes over time of the total of these values. It can beseen from the graph that while the oil shock which took place in 1973encouraged a move away from oil and increased a relative dependence on
electricity, comprehensive energy saving measures were also successfully
implemented.
Although the achievement of significant energy saving can be observed in thefiber production and dyeing divisions, where energy consumption ratios areparticularly high, it is also apparent that their energy consumption has actually
been on the increase since 1985.
Fiber production
Synthetic fiber (1 kg)
‘..
1955 1965 1975Fiscal year
1905 ’ 1990
Notes 1. The graphs were drawn using data from the Annual Report on Textile Statistics2. Energy was calculated with the following conversion ratios:
Electricity: 2,000 KcaVKWhCoal: 7,400 KcafikgFuel Oil: 9,400 KcalllGas: 9,900 Kcal/m3 as the average of the following:Natural gas: 9,900 Kcal/m3; City gas: 10,000 Kcal/&;
3. 10 d of 100 g/m2 Weight shirfng can be woven from 1 kg of yarn.
Figure 24 Changes in Amount of Energy Required for Unit Production
- 39 -
Spinning(U million)
Fabric production(U million)
Dyeing(V million)
Sewing(V million)
m PefSOnnel m Energy costcost
m Material cost
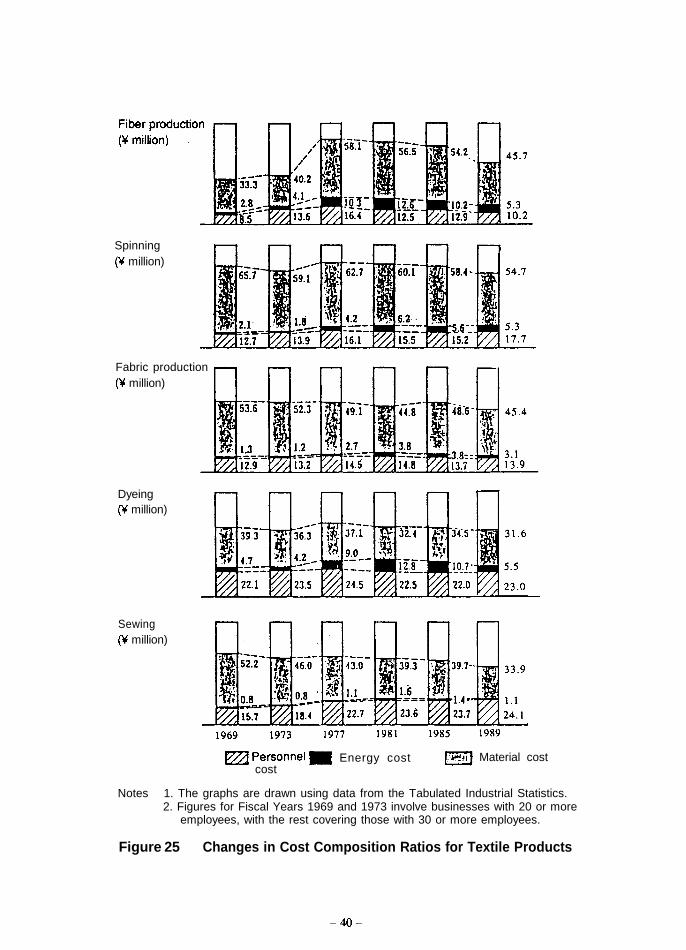
Notes 1. The graphs are drawn using data from the Tabulated Industrial Statistics.2. Figures for Fiscal Years 1969 and 1973 involve businesses with 20 or more
employees, with the rest covering those with 30 or more employees.
Figure 25 Changes in Cost Composition Ratios for Textile Products
-4o-
Given this phenomenon along with the steadily increasing energy use in the
spinning and weaving fields, it can reasonably be assumed that rationalization
efforts are reaching their limits in view of the current production structure
designed to cater for the needs for multi-line, small-volume production from thefashion clothing market. Figure 25 summarizes and graphically illustrates
changes in cost compositions for the production of major textile products, as
shown in Table 13, after the oil shock. It can easily be seen that the influence of
the energy component on the total production cost has been more pronouncedafter 1973, while at the same time effects of energy saving efforts are alsonoticeable. The gradual increase in energy consumption in spinning and fabric
production and the upward trends after 1985 in fiber production and dyeing asshown in Figure 24 are both translated into a decrease in terms of the ratio of
energy cost to the total, illustrating that comprehensive energy saving efforts
have been made by the companies concerned.
(5) Assessment of production rationalization levelAlthough it is generally difficult to assess the level of production rationalization
in the textile manufacturing industry in absolute terms, the dyeing and finishingsubdivision is often put under scrutiny as a typical specialized technical field with
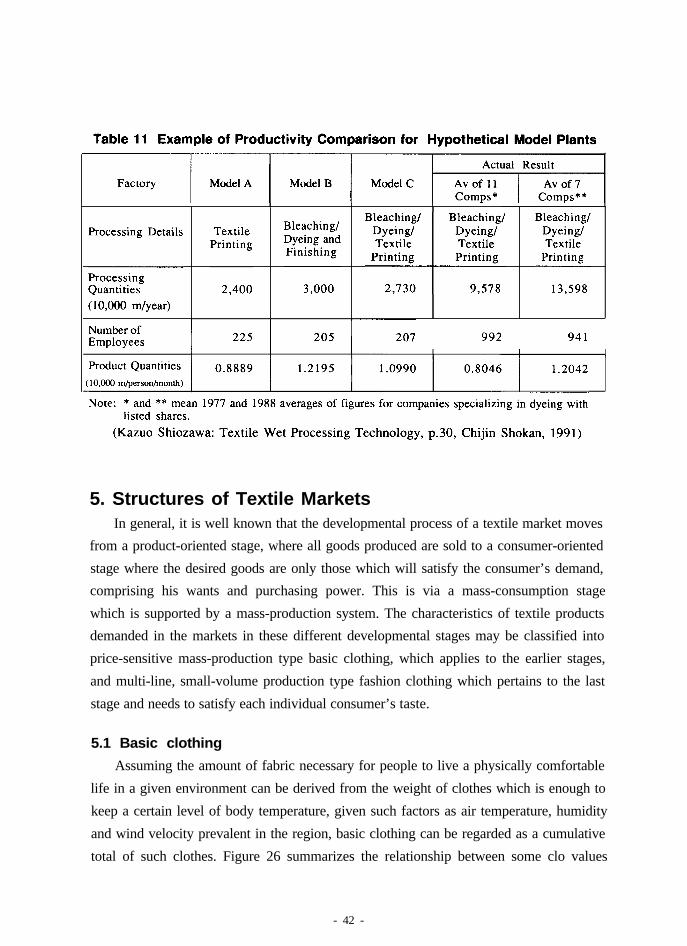
a number of unknown factors. It consumes large quantities of energy carryingout multi-line processing tasks within short periods of time in order to directly
reflect the market’s needs. Table 11 shows the results of calculations to find the
levels of productivity which could be obtained from dyeing operations assumed
to have been conducted in a planned manner at some ideal factories, comparingthem with the corresponding average figures for actual Japanese companies.
Since productivity drastically changes with the texture or structure of the originalfabric and the details of processing, polyester-cotton blend fabric (shirting ofapprox 100 g/m2 assumed), which is more likely to be processed in a uniform
manner, was used as the material for this scenario. The table shows that the latest
figure of average per capita productivity for Japanese companies is alreadycomparable to those for hypothetical model plants, highlighting the fact that with
the current level of technological development Japan has also reached a
considerable level of production rationalization.
-4l-
5. Structures of Textile MarketsIn general, it is well known that the developmental process of a textile market moves
from a product-oriented stage, where all goods produced are sold to a consumer-oriented
stage where the desired goods are only those which will satisfy the consumer’s demand,comprising his wants and purchasing power. This is via a mass-consumption stage
which is supported by a mass-production system. The characteristics of textile productsdemanded in the markets in these different developmental stages may be classified into
price-sensitive mass-production type basic clothing, which applies to the earlier stages,
and multi-line, small-volume production type fashion clothing which pertains to the last
stage and needs to satisfy each individual consumer’s taste.
5.1 Basic clothingAssuming the amount of fabric necessary for people to live a physically comfortable
life in a given environment can be derived from the weight of clothes which is enough to
keep a certain level of body temperature, given such factors as air temperature, humidity
and wind velocity prevalent in the region, basic clothing can be regarded as a cumulative
total of such clothes. Figure 26 summarizes the relationship between some clo values
- 42 -
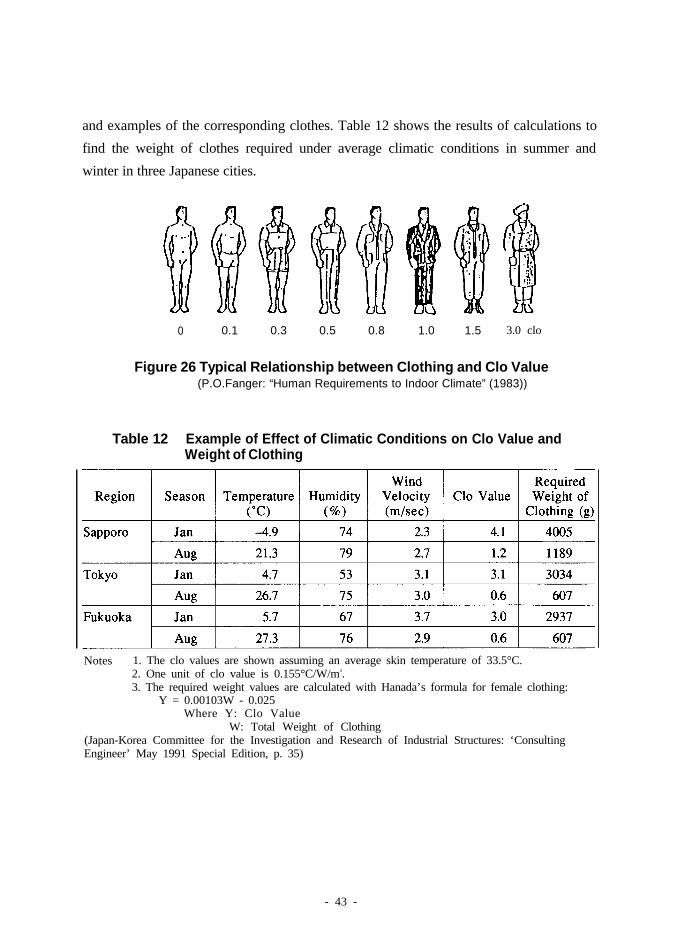
and examples of the corresponding clothes. Table 12 shows the results of calculations to
find the weight of clothes required under average climatic conditions in summer and
winter in three Japanese cities.
0 0.1 0.3 0.5 0.8 1.0 1.5 3.0 clo
Figure 26 Typical Relationship between Clothing and Clo Value(P.O.Fanger: “Human Requirements to Indoor Climate” (1983))
Table 12 Example of Effect of Climatic Conditions on Clo Value andWeight of Clothing
Notes 1. The clo values are shown assuming an average skin temperature of 33.5°C.2. One unit of clo value is 0.155°C/W/mz.3. The required weight values are calculated with Hanada’s formula for female clothing:
Y = 0.00103W - 0.025Where Y: Clo Value
W: Total Weight of Clothing(Japan-Korea Committee for the Investigation and Research of Industrial Structures: ‘ConsultingEngineer’ May 1991 Special Edition, p. 35)
- 43 -
Although the ultimately required quantity is difficult to determine, the per capitaannual textile consumption (kg/person) can be estimated through multiplying the above
weight by coefficient a (obtained from the service life of a textile product and its number
of units demanded per annum).
5.2 Fashion clothing
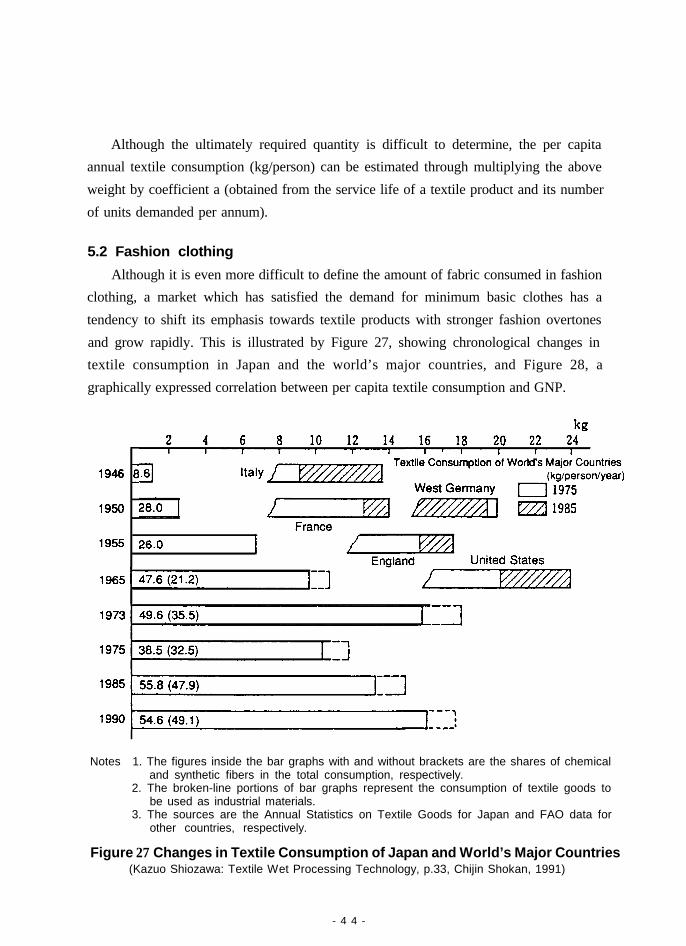
Although it is even more difficult to define the amount of fabric consumed in fashionclothing, a market which has satisfied the demand for minimum basic clothes has a
tendency to shift its emphasis towards textile products with stronger fashion overtones
and grow rapidly. This is illustrated by Figure 27, showing chronological changes intextile consumption in Japan and the world’s major countries, and Figure 28, a
graphically expressed correlation between per capita textile consumption and GNP.
Notes 1. The figures inside the bar graphs with and without brackets are the shares of chemicaland synthetic fibers in the total consumption, respectively.
2. The broken-line portions of bar graphs represent the consumption of textile goods tobe used as industrial materials.
3. The sources are the Annual Statistics on Textile Goods for Japan and FAO data forother countries, respectively.
Figure 27 Changes in Textile Consumption of Japan and World’s Major Countries(Kazuo Shiozawa: Textile Wet Processing Technology, p.33, Chijin Shokan, 1991)
- 4 4 -
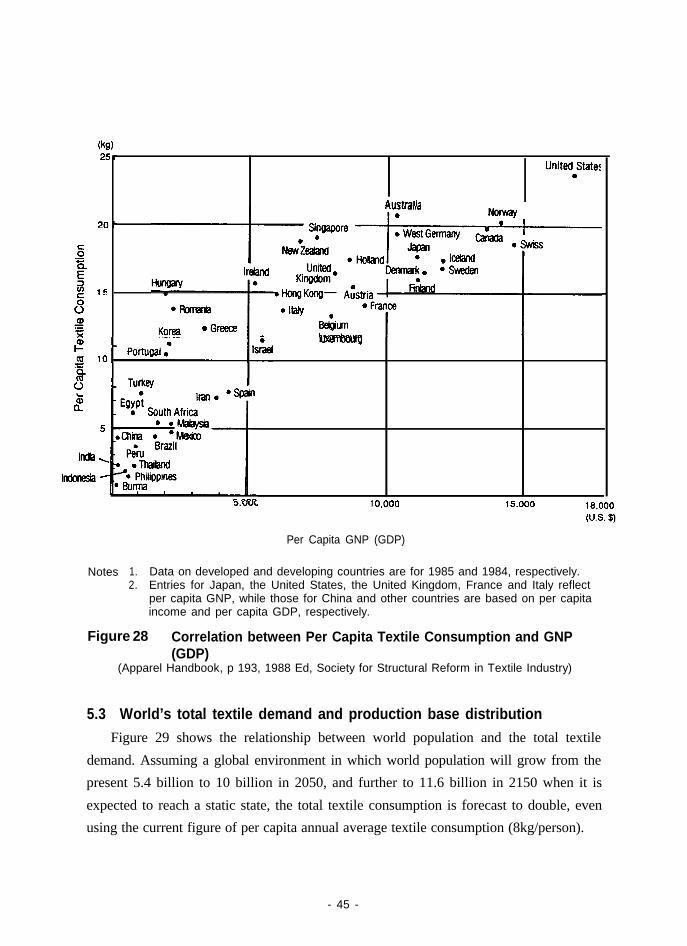
Per Capita GNP (GDP)
Notes 1.2.
Data on developed and developing countries are for 1985 and 1984, respectively.Entries for Japan, the United States, the United Kingdom, France and Italy reflectper capita GNP, while those for China and other countries are based on per capitaincome and per capita GDP, respectively.
Figure 28 Correlation between Per Capita Textile Consumption and GNP(GDP)
(Apparel Handbook, p 193, 1988 Ed, Society for Structural Reform in Textile Industry)
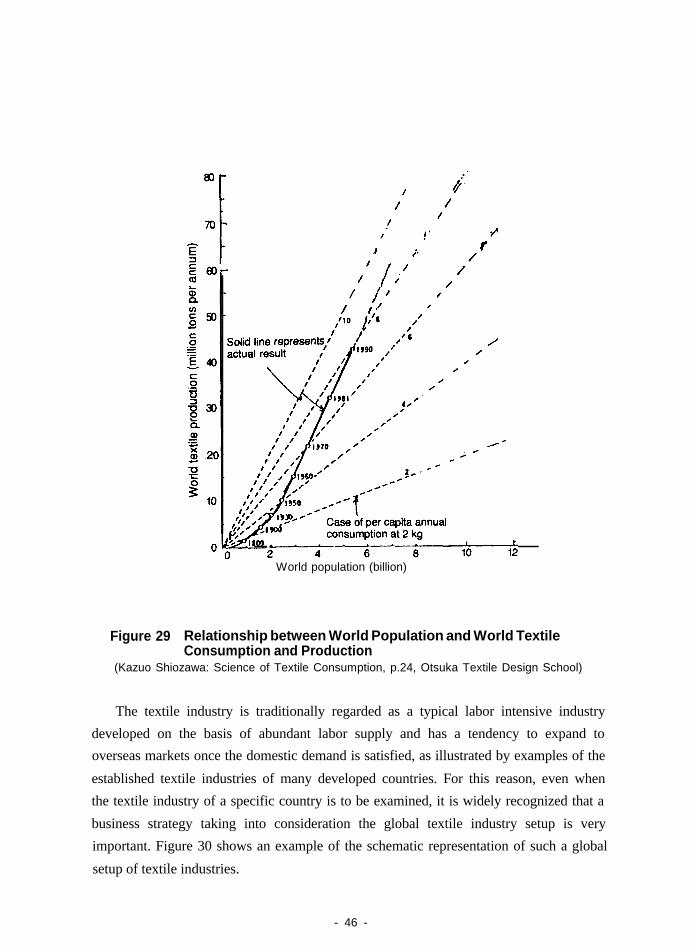
5.3 World’s total textile demand and production base distributionFigure 29 shows the relationship between world population and the total textile
demand. Assuming a global environment in which world population will grow from thepresent 5.4 billion to 10 billion in 2050, and further to 11.6 billion in 2150 when it is
expected to reach a static state, the total textile consumption is forecast to double, evenusing the current figure of per capita annual average textile consumption (8kg/person).
- 45 -
World population (billion)
Figure 29 Relationship between World Population and World TextileConsumption and Production
(Kazuo Shiozawa: Science of Textile Consumption, p.24, Otsuka Textile Design School)
The textile industry is traditionally regarded as a typical labor intensive industrydeveloped on the basis of abundant labor supply and has a tendency to expand tooverseas markets once the domestic demand is satisfied, as illustrated by examples of the
established textile industries of many developed countries. For this reason, even whenthe textile industry of a specific country is to be examined, it is widely recognized that a
business strategy taking into consideration the global textile industry setup is veryimportant. Figure 30 shows an example of the schematic representation of such a global
setup of textile industries.
- 46 -
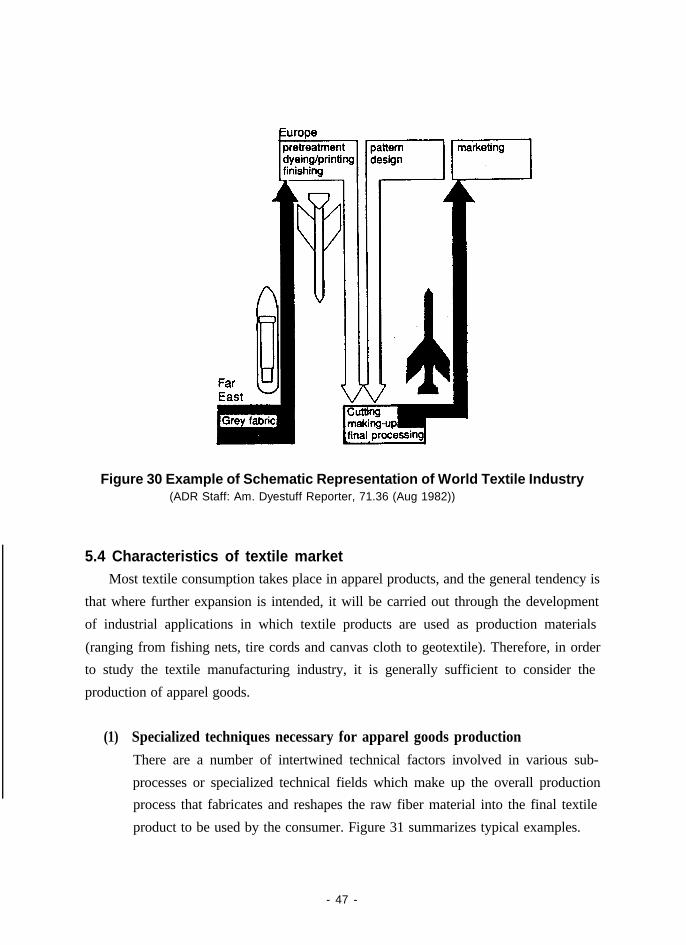
Figure 30 Example of Schematic Representation of World Textile Industry(ADR Staff: Am. Dyestuff Reporter, 71.36 (Aug 1982))
5.4 Characteristics of textile marketMost textile consumption takes place in apparel products, and the general tendency is
that where further expansion is intended, it will be carried out through the development
of industrial applications in which textile products are used as production materials
(ranging from fishing nets, tire cords and canvas cloth to geotextile). Therefore, in orderto study the textile manufacturing industry, it is generally sufficient to consider the
production of apparel goods.
(1) Specialized techniques necessary for apparel goods productionThere are a number of intertwined technical factors involved in various sub-
processes or specialized technical fields which make up the overall productionprocess that fabricates and reshapes the raw fiber material into the final textile
product to be used by the consumer. Figure 31 summarizes typical examples.
- 47 -
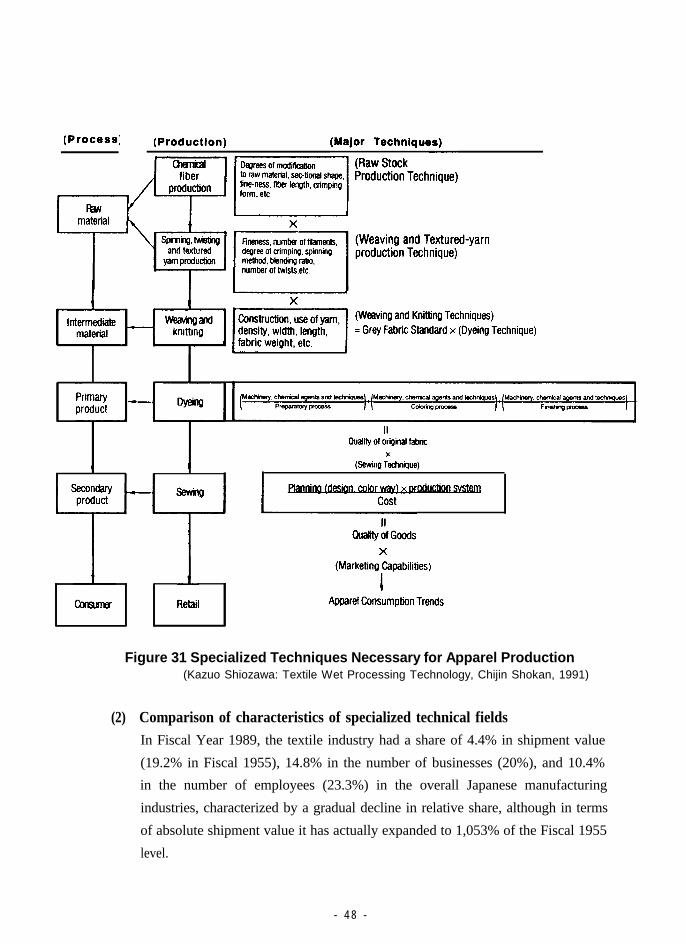
Figure 31 Specialized Techniques Necessary for Apparel Production(Kazuo Shiozawa: Textile Wet Processing Technology, Chijin Shokan, 1991)
(2) Comparison of characteristics of specialized technical fieldsIn Fiscal Year 1989, the textile industry had a share of 4.4% in shipment value
(19.2% in Fiscal 1955), 14.8% in the number of businesses (20%), and 10.4%in the number of employees (23.3%) in the overall Japanese manufacturing
industries, characterized by a gradual decline in relative share, although in terms
of absolute shipment value it has actually expanded to 1,053% of the Fiscal 1955
level.
- 4 8 -
As has been frequently pointed out throughout its development, the Japanese
textile industry has a unique organizational structure consisting of groups ofindependent companies where all companies in a group belong to one of the
above-mentioned specialized technical fields and operate in a horizontalspecialization configuration. Table 13 shows a comparison and summary of the
major indices of these company groups, classifying them in accordance with
their specialized technical fields.
From these indices, common company characteristics for each group mayemerge.Namely, in terms of business size, the fiber production and spinning
subdivisions are in contrast with the rest of the textile industry where relatively
large numbers of small businesses coexist. In addition, these groups of smallcompanies can only stay in business by relying on the supply of abundant cheap
labor, exhibiting a legacy of the textile industry’s past as a labor intensive
industry, even on its path towards modernization. Table 1 compares the energy
consumption shares of various specialized technical fields and it can be seen that
energy consumption is relatively high in the fields of dyeing and finishing, fiber
production, spinning, weaving and clothing manufacturing.As for water consumption, the share of the textile industry in the entire
manufacturing industries is 5.2% for fresh water and 1.1% for sea water.Considering the fact that most of this water is used for easy-to-recycle
temperature control and cooling purposes, the industry’s total water consumptioncannot necessarily be regarded as high. However, as is widely accepted, the
dyeing and finishing division is placed in a special position in that its water
consumption is mainly for processing and washing purposes.
- 49 -
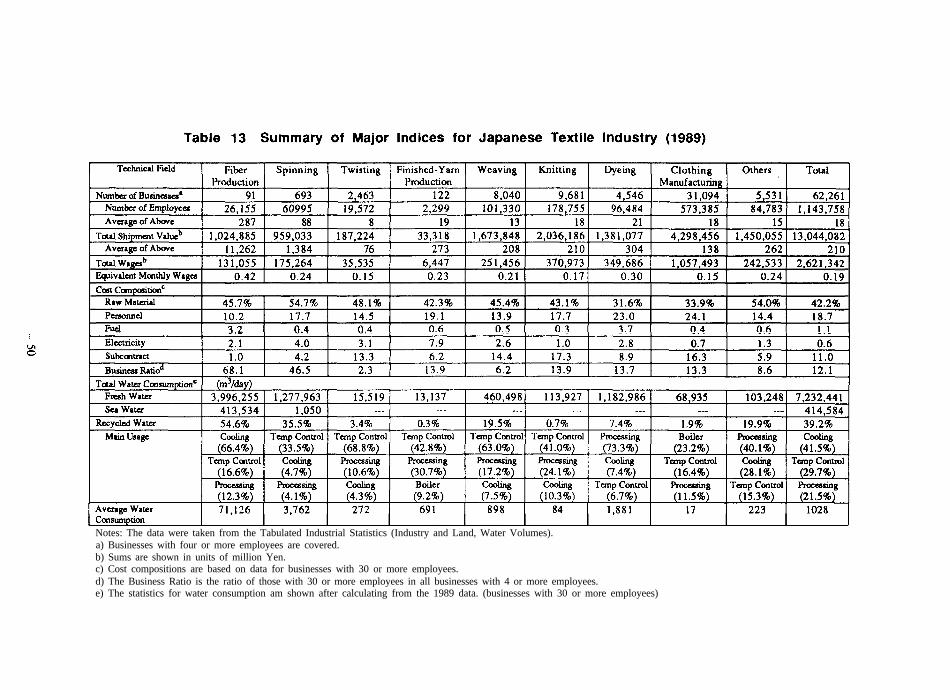
Notes: The data were taken from the Tabulated Industrial Statistics (Industry and Land, Water Volumes).a) Businesses with four or more employees are covered.b) Sums are shown in units of million Yen.c) Cost compositions are based on data for businesses with 30 or more employees.d) The Business Ratio is the ratio of those with 30 or more employees in all businesses with 4 or more employees.e) The statistics for water consumption am shown after calculating from the 1989 data. (businesses with 30 or more employees)
6. Conclusions
(1) There is no panacea for achieving energy conservation in the textile manufactur-ing industry.
(2) With the actual implementation of an energy conservation program, it is
important to grasp the current level of energy consumption and its actual
conditions in detail, set goals (energy consumption and corresponding cost), andachieve the goals through a company-wide effort as far as possible.
(3) In the textile manufacturing industry, it is important to thoroughly understandthat, depending on the trend of the market, the company is targeting, consumer
requirements for the textile products to be supplied differ, thereby urging the
implementation of energy conservation measures which are relevant to the
production of the goods that suit the market.(4) Therefore, it is necessary to expect that, when multi-line, small-volume
production type high value-added goods are produced, energy consumption mayincrease rather than decrease with production rationalization, in contrast with
mass-production type goods.
(5) When differentiated goods are produced, the share of energy costs in the overallproduction cost should be given importance rather than energy consumption.
(6) It is reasonable to consider that ultimately desired energy conservationpromoting techniques will depend on the development and practical application
of innovative technologies in each specialized technical field.
- 5 1 -