Embed Size (px)
Citation preview

Tests on Connections of Earthquake Resisting Precast Reinforced Concrete Perimeter Frames of Buildings
44
Jose I. Restrepo, Ph.D. Post-Doctoral Fellow
Department of Civil Engineering University of Canterbury
Christchurch, New Zealand
Robert Park, Ph.D. Professor of Civil Engineering and Deputy Vice-Chancellor University of Canterbury Christchurch , New Zealand
Andrew H. Buchanan Ph.D.
Associate Professor Department of Civil Engineering
University of Canterbury Christchurch , New Zealand
Moment resisting frames located at the perimeter of buildings are often designed to provide the required earthquake resistance for the building. In some countries, these frames are often constructed incorporating precast reinforced concrete elements that are connected with cast-in-place concrete joints. The aim of such construction is to emulate the behavior of conventional cast-in-place reinforced concrete structures. Such construction incorporating precast concrete elements requires demonstration that the structure shows levels of stiffness, strength, ductility and energy dissipation characteristics that are at least equal to those of the emulated monolithic system. This paper presents results of tests on six subassemblages typical of perimeter frames. Four units were connected at the beam midspan. The two remaining units had the connections at the beam-to-column joint region. The subassemblages were tested under quasi-static cyclic reversed loading. The results show that the connection detail can be successfully designed and constructed to emulate cast-in-place construction.
PCI JOURNAL

P recast reinforced concrete systems with cast-in-place concrete joints designed to behave
as a cast-in-place reinforced concrete structure have been used in the construction of earthquake resisting multistory buildings in New Zealand for many years .'-2
·3 These precast concrete
systems are designed to have levels of strength, stiffness, ductility and energy dissipation characteristics at least equal to those of an equivalent cast-inplace concrete system.
The main design trend in New Zealand for buildings between 9 and 25 stories high, when using frames incorporating precast reinforced concrete elements, is to resist most of the earthquake induced forces using ductile moment resisting perimeter frames . The preferred mode of plastic deformation in the design of such frames is the beam sides way mechanism. 1
Perimeter frames used in buildings of 9 stories or more generally consist of relatively stout elements. The clear span-to-overall depth ratio for beams ranges from 3 to 6. For columns above the first story of the building, the clear height-to-overall depth ratio varies between 2.5 and 4. Precast concrete systems commonly used in New Zealand in the construction of perimeter frames are shown in Fig. 1.
Precast concrete systems for perimeter frames have been designed using design requirements4 for cast-inplace construction. Those design rules have been extrapolated by designers to include connections between precast concrete elements where necessary. Details of the construction and design of these systems are given elsewhere. 1•
2·3
A series of tests was carried out at the University of Canterbury. The precast concrete systems tested are representative of those shown in Fig . 1. This paper presents the results of the experimental investigation.5
TEST PROGRAM The experimental program focused
on connections between precast concrete subassemblages of perimeter frames. A feature of beams of perimeter frames is that the bending moment due to gravity loading is small com-
July-August 1995
pared with that arising from seismic actions. Thus, as Fig. 2 illustrates, the point of contraflexure remains very close to midspan.
Six subassemblages of frames with various connection details between precast concrete elements were subjected to quasi-static cyclic reversed loading. Details of the six subassemblages, referred to as Units 1 to 6, are shown in Figs. 3 to 8.
The design of the subassemblages followed the recommendations of the New Zealand standard for the design of concrete structures , NZS 3101: 1982,4 except for the connection region. The units were representative of a 1 0-story frame that was designed using capacity design4 to form a beam sidesway mechanism.
Details of Units Connected at Midspan of Beams
Four H-shaped units, Units 1 to 4 shown in Figs . 3 to 6, had cast-inplace concrete connections at the beam midspan and represented typical connections in beams of Systems 2 and 3 (see Fig . 1). A clear span-tooverall depth ratio of 3 was chosen for the beams of these units, which is the smallest aspect ratio of beams in precast concrete perimeter frames encountered in practice.
In Units 1, 2, and 3, plastic hinges were expected to develop in the beam at the column faces. The midspan connections contained different details. The main objectives of these tests were to:
1. Evaluate the performance of rather short connection details in transferring the forces at the beam midspan.
2. Observe the effect of the connection detail on the overall response of the subassemblage.
3. Study the effects of the proximity of the lap splices and the construction joints to the critical regions when plastic hinges form at the ends of the beams.
Unit 4 had a midspan connection consisting of diagonal reinforcement and bolted steel plates. Inelastic deformations were expected to concentrate in the diagonal reinforcement. The main objectives of the test on this unit were to:
(a) System 1 - Precast beam units between columns
Precast concrete column
Cost in place column M1dspan
!i.
(b) System 2- Precast beam units through columns
r unil
(c) System 3- Precast Tor cruciform units
Fig. 1. Details of commonly used systems for construction of perimeter frames in New Zealand designed for earthquake resistance.
Earthquake action
(£
I · Point of contra flexure
Fig. 2. Bending moment diagram in a beam of an earthquake resisting perimeter frame.
45

567 567 I. I Kink PLAN VIEW Cl
~.- H "' Kif +-- - t----=:1--@t- 2100
,-t-\} Cost in place t: 5 /
"' concrete ~ "'o
) I:?Q! 5-R10 4-R10 Construction " ;@ stirrups Jko~irruj~ tint
~ 110: 440 0 110:33 3028-1680 (0
-- -- .. ~ fB1 1: :~ ~ w.: :::
+- 1- --- [~: Cl Cl
" 11; ll ~ :~~
·-1
l35mm I \028-1680 'Additional 4-028
cover stirrup
836 4-016. Bull welded Cl
" " - .._35mm cover to main bars
H: ~12-H020 !.± fo ~
Fig. 3. Reinforcing detai ls of Unit 1. Note: Dimensions in mm; D =deformed bar diameter; R =plain bar diameter; 1 mm = 0.0394 in.
1. Study the effect of the bolted steel connection on the overall performance of the subassemblage.
2. Observe the region around the bends of the diagonal reinforcement.
In accordance with the New Zealand (NZS 3101:1982)4 and American Concrete Institute (ACI 352-89)6 standards for the design of concrete structures, no part of the splice of the longitudinal
,. 540 "1 - ] ~ 567 . 567
I PLAN VIEW I
~-;= EE 2100 [£+-- d 567x450
Cl ~ ~~/#2 ~t$fups f;5 ~ Cl J·~&S ~t~{jups fl2. ;r -780 Q!
I I 3-028 @
~::= 1-
n ... ;;
t_ !::: R
I!
'-2-028 LJ 028 rods 3-0281 J
Construction .. drop in .. join t ~~'::,':!::... loo- ~
" I'- 12-HD20
E£ ~ 1- · ~
Fig. 4. Reinforcing detai ls of Unit 2. Note: Dimensions in mm; D = deformed bar diameter; R = plain bar diameter; 1 mm = 0.0394 in.
46
reinforcement in the beam is permitted to occur within a distance of 2d from the column face when plastic hinges are expected to develop in the beams at the column faces. Hence, the clear span of the beam has to be at least 4d + 15 , where dis the effective depth of the beam and 15 the splice length. Units 1, 2, and 3 deliberately contravened this requirement.
For beams with equal amounts of top and bottom longitudinal reinforcement when the nominal shear stress in the plastic hinges exceeds 0.3 {]:, NZS 3101: 19824 requires that diagonal reinforcement be used. The intent of this requirement is to avoid an early loss of energy dissipation capability caused by sliding shear along vertical cracks in the plastic hinge rather than by the desired flexural (plastic hinge) behavior.
The nominal shear stress is defined by NZS 31 01: 19824 as the shear force corresponding to the development of the flexural overstrength in the critical regions of the beams (which is equal to 1.25 times the nominal flexural strength) divided by the width of the web and by the effective depth of the beam. The nominal flexural strength is computed using the amount of longitudinal steel as detailed and considering, if appropriate, a fraction of the slab reinforcement.
The critical region in the beam of Unit 4 had a nominal shear stress equal to 0.58{]: and, hence, required that diagonal reinforcement be used. The nominal shear stresses in the critical regions of Units 1, 2, and 3 were very close to the imposed limit, as is often the case in beams in the lower stories of perimeter frames in New Zealand, and, hence, were not required to have diagonal reinforcement.
For Unit 1, the midspan connection consisted of overlapping 180-degree hooks with the overlap commencing at 1.46d from the column face (see Fig. 3). Four short transverse rods of the same diameter as the longitudinal beam bars were placed in contact with the inside of the bends of the hooks to improve the anchorage conditions. The stirrups that surrounded the connection in the cast-in-place concrete joint were capable of transferring the maximum beam shear force associated with the development of the flexural over-
PCI JOURNAL

strength at the beam plastic hinges , which is the result of a lower bound approach using strut-and-tie models. 3
Unit 2, shown in Fig. 4, was connected at midspan using double 90-degree hooked "drop in" bars . The overlap of the reinforcement of this connection detail commenced at 1.23d from the column face. As in Unit I , short transverse rods were tied in contact with the inside of the hooks of the lapped bars. Two-thirds of the beam longitudinal bars were spliced using this detail at midspan and one-third of the beam longitudinal bars were terminated and anchored within the precast concrete members.
This curtailment was deliberately made to observe the effects of higher stresses in the longitudinal steel, up to yielding, in the connection region. The five stirrups surrounding the connection region were capable of transferri ng 80 percent of the maximum beam shear force associated with the development of the flexural overstrength at the beam plastic hinges.
In Unit 3, the midspan connection detail consisted of non-contact straight lap splices commencing at l.27d from the column face (see Fig. 5). As for Unit 2, only two-thirds of the longitudinal bars were spliced at midspan . The lap len gth for the spliced bars, in terms of the diameter of the spliced bars, db, was 23db. This length was obtained using the provisio ns in NZS 3101:19824 and ACI 318-89,6 considering the direction of casting of the concrete or "top bar" effect and the beneficial effect of the transverse reinforcement surrounding the lapped bars . The transverse reinforcement in the connection region was calculated fo llowing the recommendations given by Paulay.7
The detail used in Unit 4 (see Fig. 6) has occasionally been used in New Zealand when diagonal reinforcement is required in the plastic hinge regions. Because it is difficult to detail diagonal reinforcement in the potential plastic hinge regions at the ends of very short beams of perimeter frames, it has been proposed8 to relocate the plastic hinges and detail the reinforcement in the beam similarly to a diagonally reinforced spandrel beam of coupled structural walls.
July-August 1995
540
Burt ~d) II 460 1
Hlil:l:ih~ 567 567
I l PLAN VIEW
~
J~~ ~ ... 2100 ffi
rc ra 567x450 ...--CtJ,u'""-§-
~ <..<:> .}Q iJ/'2 stirrups ~~ 102:204 02 lA" "' 8 -RIOstirrops I r· 0
C> ii' '7 ....
Q •• Q::~ ";>-
"''" ~-., .... §~ !: .. :.;:~ "';
1--
II
® 102,714 v~ 78J I I
:
I
II ~
.If 11 - ~ ~-aa: ~ ~ ~st ~I · in place concrete
35mm joint cover- i- ~ un-.
94 3~\; 175 4~~ ~~:; SE ~~ ;~t: ~~ ~ r-- 11"' :
: \{: ~= :
Fig. 5. Reinforcing details of Unit 3. Note: Dimensions in mm; 0 =deformed bar diameter; R = plain bar diameter; 1 mm = 0.0394 in.
In the particular case of Unit 4, the connection detail was scaled from an actual structure. The beam of Unit 4 was designed using a simple truss model proposed by Buchanan.3
·8 The
aim of this detailing is to confine the inelastic deformations to within the beam midspan region and prevent plastic hinges from forming at the beam ends, where the maximum bending moment occurs in the beam. The diagonal bars were MIG-welded to 16 mm (0.63 in.) thick steel plates at midspan. The midspan connection was achieved by bolting a sandwich 20 mm (0.79 in .) thick steel plate between the 16 mm (0.63 in .) thick steel plates using high strength friction grip bolts.
Details of Units Connected at the Beam-to-Column Joint Region
A second series of units was constructed and tested to evaluate the performance of two different details for connecting precast concrete beam ele-
ments and cast-in -place concrete columns in the beam-to-column joint region. The two test specimens, Units 5 and 6, were of cruciform shape, extending from midspan to midspan of beams and midheight to midheight of columns (see Figs. 7 and 8).
These units were typical of components from the upper levels of a perimeter frame with beams having a clear span-to-overall depth ratio of 4.6. Both units had identical dimensions and were designed to develop plastic hinges in the beams at the column faces. Unit 5, shown in Fig. 7, was typical of System 1 shown in Fig. l(a). Unit 6, shown in Fig. 8, represented System 2 depicted in Fig. 1 (b) .
For Unit 5, the main objectives of the test were to:
1. Observe the influence of the vertical cold joint between the end of the precast concrete beam and the column face when the plastic hinge develops in this region.
2. Observe the influence of the
47

16mm plate 20mm sandwich
,~~::JtlfrJ ,,0
,
PLAN VIEW
567 567
~r- EE 2100 H: 18
g f-- r?Q - 567x450
~2 4 -4RIO \61 column
stirrups!IJJ 93 195 4-2R10stirrups, 645 ~ ·- <6 127d81 '" .. 13> 200= 600
1j I Construction " £1~ a:- fA 12-M22 HSFGB JOml
:6<!1 13>56 [ 4-02~ 4-028
~ f-- ... .....• · .... • . ' .. I _L 1-
. . . @»!.. 1-- . .
~ ~~ 0
7: ~ ~~ ~
{:·f. "'"' .... 0:~ ':: 0 0 0
~ ·~ ~ ~ 0 0
~ ~ 0 0 ., '--- . 0 Q
:).:-:- ~ ..
2 - 10x30 ~ 4 -024-. ( \2-RI6l ~- 02B j M~. s 1rops ,J,~':::ded 2 -R/6 -700 1!/,':J,'J!
A 3 -R6sllrrups ~ G 80 35mm ~
• Diagonal bars cove__c_ ;- "
12_H028 • Strong end bars
~ 3-HD20 0 0
"' ~ .....
SEGnONA-A
Fig . 6. Reinforcing details of Unit 4. Note: Dimensions in mm; D =deformed bar diameter; R = plain bar diameter; 1 mm = 0.0394 in.
12 mm ~nd. plate weld~d to main bars
o 8HD20
"' ... -
6 -3 RIO hoops ® 120
hooked anchorage of the bottom bars of the beams inside the beam-tocolumn joint core.
For Unit 6, the main objectives of the test were to:
1. Observe the effectiveness of the grout around the longitudinal column bars.
2. Observe the performance of the grouted horizontal construction joint between the precast concrete beam and the cast-in-place concrete lower column.
In Unit 5, the lower portion of the beams was precast. The precast concrete beams were seated on the 30 mrn (1.2 in.) thickness of cover concrete of the column below. The beam bottom bars were anchored inside the core of the beam-to-column joint . This detail contravened a provision of NZS 3101: 19824 that requires the longitudinal beam bars that are intended to be terminated at an interior column to be passed directly through the core of the column and terminated with a standard hook immediately outside the far side of the hoops enclosing the beam-to-column joint.
• - l ··~g 30mm 0 • • 0 ....,....,..._ .... _.., _ _____________ ___ ..L.
seating SECTION C-C (Hoops not shown)
Fig. 7. Reinforcing details of Unit 5. Note: Dimensions in mm; D =deformed bar diameter; R =plain bar diameter; 1 mm = 0.0394 in.
48 PCI JOURNAL

1605
SECTIONB·B
600
I() - H024---+~~~::# I--__;;:+
SECTIONC.C
1605
6 ·3RIO hoops ~ 120
Fig. 8. Reinforcing details of Unit 6. Note: Dimensions in mm; D = deformed bar diameter; R = plain bar diameter; 1 mm = 0 .0394 in.
In Unit 6, the precast concrete beam incorporated the beam-to-column joint region. Protruding column longitudinal bars passed through 70 mm (2.8 in.) overall diameter corrugated steel
ducts (similar to those used in grouted post-tensioned construction) in the precast beam element and protruded above the top surface. The precast beam and the column were connected
Table 1. Measured yield strengths of reinforcing steel.
Reinforcement type a nd diameter (mm) Location
R6 Unit4
RIO All units
Rl2 Unit 3
Rl2 Unit4
Rl6 Units I, 4, 5, and 6
020 Unit 3 r--
024 Unit4
024 Units 5 and 6
028 Unit I, 2, and 4
028 Unit5
H020 Units I, 2, 3, and 5
HD24 Units 5 and 6
H028 Unit4
Note: I mm = 0.0394 in .; I MPa = 145 psi. The 30 x I 0 mm straps of Unit 4 had a measured yield strength of 3 15 MPa.
R = plain round Grade 300 steel ( 43.5 ksi) HD = deformed Grade 430 steel (62.4 ksi)
D =deformed Grade 300 steel (43.5 ksi)
July-August 1995
!y (MPa)
364
356
324
317
298
307
320
285
313
32 1
456
486
440
by grouting the corrugated ducts and the gap between the lower column and the beam unit.
Note that the grout needs to provide adequate bond conditions for the vertical column bars. Also, because there will be a thickness of grout between the joint hoops and the vertical column bars, the grout needs to provide adequate transfer of the transverse forces from the joint hoops to the column bars.
CONSTRUCTION OF TEST UNITS
The precast concrete elements of the H-shaped Units 1 to 4 were cast in the horizontal plane but were connected in the upright position in the test frame. The precast and cast-in-place concrete elements of Units 5 and 6 and their connections were cast in the upright position. In Unit 5, excessive bleeding and plastic settlement of the fresh concrete was observed in the beam-tocolumn joint region after the concrete set. The combination of these two factors affected the bond conditions of
49

0
(a) Midspan joint of Unit 2 before placing cast-in-place concrete
(c) Unit 5 before placing cast-in-place concrete in beam-tocolumn joint
Fig. 9. Construction of the units.
(b) Midspan joint of Unit 4 before placing cast-in-place concrete
(d) Lowering of precast beam element on to lower column of Unit 6
Table 2. Measured compressive cylinder strengths of concrete and grout. the top beam bars during the test.
Casting
! Age a t test
num ber Location (days)
1 Unit 1, Precast members I 116
2 Unit 1, Connection 64
3 Unit 2, Precast members 168 -r-- -
Unit 2, Connection 48 4
Unit 3, Precast members 96 ----
5 Unit 3, Connection 21 --
6 Unit 4, Precast members 100
Unit 4, Connection 21 7
Unit 5, Precast beams, lower column 207
8 Unit 4, Repair region 32
9 Unit 6, Precast beam, beam-to-column joint and lower column
183
10 Unit 5, Beam-to-column joint, beam top 62 -
II Unit 5, Upper column 61
12 Unit 6, Upper column 20
13 Unit 6, Grout 28
Note: I MPa = 145 psi. J; = concrete compressive strength of 100 percent humidi ty cured 100 nun (3.94 in .) diameter
by 200 mm (7.87 in .) high cylinders J; = grout compressive stength of 100 percent humidi ty cured 50 mm (1.97 in.) diameter
by 100 mm (3.94 in .) high cylinders
50
J;orf; at test (MPa)
29 ~
41 ·=
33 -
32 ·-
38
29
35
36 -
41
62
44
27 -
43
35
63
A coat of concrete retarder was applied to the formwork of the precast concrete elements at the location of the construction joints. The retarded concrete paste was brushed off, so that the surface of the concrete was clean and free of laitance, but the surface was intentionally left smooth with a total amplitude of about 1 to 2 mm (0.04 to 0 .08 in .) to represent the worst case scenar io encountered in practice. Normally , a roughness of total amplitude 5 mm (0 .2 in .) would be sought , a s specified by NZS 3101:1982.'
In Unit 6, the precast concrete beam was seated on four 10 mm (0.39 in.) thick shims on the lower column. The grout for filling the corrugated ducts in the beam-to-column joint region was poured down one of the ducts for the corner column bars after sealing the sides of the horizontal joint at the bottom of the precas t beam. Outlet ports at the sides of the horizontal
PCI JOURNAL
JOint were shut-off when grout emerged, indicating that the joint was filled. Some topping up of the column bar ducts was necessary to completely fill them. For this type of construction, strict quality control of this grouting procedure is vital to ensure that the operation is successfully completed.1.2
The cold worked regions at the bends of the diagonal bars in Unit 4 were expected to gradually strain age. Strain aging is known to alter the mechanical properties of the steel. 9
•10
Some concern has been expressed about the possible brittle behavior of strain aged reinforcing steels that are subjected to cyclic reversed loading into the inelastic range in or beside the affected region.9 For this reason, it was decided to accelerate the effect produced by strain aging at the bends of the diagonal reinforcement. This was achieved by heating the bars to 97°C (230°F) for 12 hours. This is equivalent to natural strain aging of 23 months at 15°C (85°F).5
Fig. 9 shows Units 2, 4, 5, and 6 during construction.
MATERIALS The longitudinal steel reinforcement
was deformed bars with a lower characteristic yield strength* of 300 MPa (43.5 ksi) for the beams and 430 MPa (62.4 ksi) for the columns, designated as D and HD, respectively, in Figs. 3 to 8. Plain round reinforcement with a nominal yield strength of 300 MPa (43.5 ksi) was used for transverse reinforcement, designated as R in the figures . Table 1 summarizes the measured (actual) yield strengths of the reinforcement used.
The specified concrete compressive strength at 28 days was 30 MPa (4350 psi) for all units except for the precast concrete beams of Unit 4 where 35 MPa (5075 psi) concrete was specified. The concrete was mixed using alluvial sand and coarse aggregates. The maximum coarse aggregate size varied between 12.5 and 19 mm (0.5 and 0.75 in.). A ready mix supplier provided the
* The lower characteristic yield strength is defined as the value of the yield strength below which not more than 5 percent of the production tests in each size fall.
July-August 1995
Hydraulic aduafor
1905
1905
Precast concrete unit
Sliding mechanism
2667 1905
(a) Midspan connection tests
111.3
(b) Beam-to-column connection tests
1905
Fig. 10. Loading frames used in test program. Note: Dimensions in mm; 1 mm = 0.0394 in.
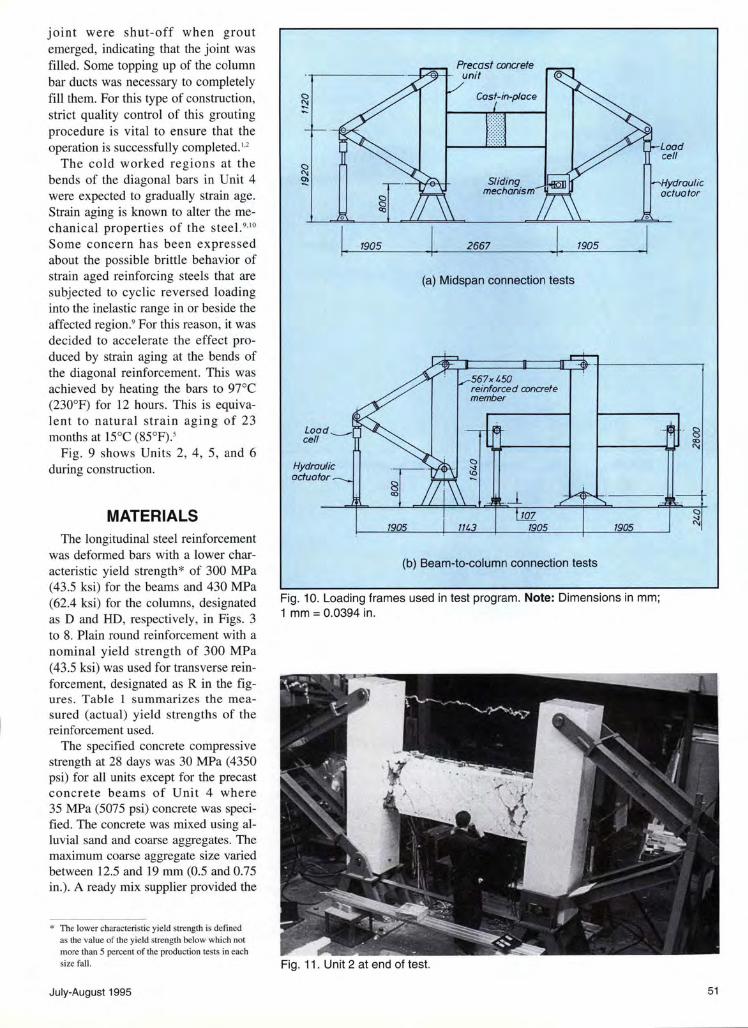
Fig. 11 . Unit 2 at end of test.
Load cell
Hydraulic actuator
51

INTERSTORY DRIFT 1% I
-2% -196 INTERSTORY DRIFT
Fig. 12. Lateral load-lateral displacement response and damage near the end of testing of Unit 1. Note: 1 kN = 0.225 kips; 1 mm = 0.0394 in.
concrete for the test program. The cement-based grout for use in
Unit 6 was prepared at the concrete laboratory of the Department of Civil Engineering at the University of Canterbury. It has been recommended2
that the grouts used to join the precast concrete members of this system should possess a compressive strength that is at least 10 MPa (1450 psi) greater than that of the precast concrete member. The cement-based grout contained alluvial sand, with a fineness modulus of 2.15, water, and shrinkage compensating agents. The fluidity of the grout measured in the flow cone test" was between 40 and 50 seconds.
Table 2 gives the measured cylinder
52
compressive strengths at the time of testing of the concrete and grout.
INSTRUMENTATION The test units were extensively in
strumented both externally and internally. A range of displacement transducers was placed to determine the main sources of the deformation in the units, including those occurring in the connection region or in the smooth construction joints . Electrical resistance foil strain gauges, demountable mechanical gauges and clip gauges were used to measure the strain in the reinforcing bars in the region of interest of each unit. The applied loads were measured with load cells at-
tached to the hydraulic actuators. Load cells were also incorporated in the vertical props at the beam ends of Units 5 and 6. Complete details of the instrumentation are given elsewhere.5
TEST PROCEDURE The H-shaped Units 1 to 4 were
tested using the loading frame illustrated in Fig. lO(a). The loading frame permitted the columns of the test subassemblages to be laterally displaced at the top while remaining parallel. This was attained by applying an upward displacement to a double acting hydraulic actuator at one end while applying a downward displacement to the actuator at the other end and ensuring that the lateral displacement between the top and bottom pin of the two columns was the same.
Thus, the bending moment produced in the beam was similar to that expected in the beams of perimeter frames of buildings subjected to earthquake induced lateral forces (see Fig. 2). Note that a sliding pin was present at the bottom of one column of the test units to ensure that elongation of the beam during loading could occur unimpeded.
Lateral loading was applied to Units 5 and 6 using the loading frame shown in Fig. lO(b). During the test, the tops of columns of the units were laterally displaced while the pinned ends of the beams were kept at the same level. No axial load was applied to the columns.
The test units were subjected to quasi-static reversed cyclic loading. The measured displacements were corrected for any displacements within the pins of the loading frame.
The cyclic loading was applied to predefined levels of load or lateral displacement. The first two cycles were load controlled within the elastic range. In these cycles, the load was applied to ±0.75H0 , where Ha is the theoretical lateral load capacity of the specimen calculated using the NZS 3101:18924 and ACI 318-89 6 rectangular compressive stress block for concrete, a bilinear stress-strain relationship for the steel, the measured material properties and assuming a linear strain variation and a strain of 0.003 in
PCI JOURNAL

the extreme compression fiber. The first yield displacement, L1 y,
was defined as 110.75 times the average positive and negative lateral displacements measured at the peak of the first two loading cycles to 0.75H0 •
Then, displacement controlled cycles were applied in terms of displacement ductility factors , )111 , as follows: two cycles to )111 = ±2; two cycles to )111 = ±4; four cycles to )111 = ±6; and, if possible, cycles to )111 = ±8, where )111
= L1/ L1Y and L1 is the inters tory lateral displacement. The above loading history has been used in quasi-static cyclic loading tests at the University of Canterbury for some years.
The displacement controlled cycles applied to Unit 6 differed from the above history . In this test, the displacement controlled cycles had two cycles to )111 = ±2.4; two cycles to )111
= ±4.9; and four cycles to )111 = ±7.3.
TEST RESULTS
Units 1, 2, and 3 with Midspan Connections
Fig. 11 shows Unit 2 after testing. Figs. 12 to 14 show the measured lateral load-lateral displacement responses of Units l, 2, and 3 and the damage near the end of testing. The lateral load plotted in these figures is equal to the sum of the shear forces, HN and H 5, in each column.
Units 1, 2, and 3 attained the theoretical lateral load, H
0, and showed little
strength degradation up to displacement ductility factors of at least )111 = ±6, which corresponded to interstory drifts of about 2.5 percent. The pinching of the hysteresis loops at large interstory drifts was due to shear deformations in the diagonally cracked end regions of the beams as a result of the relatively small span-to-depth ratio of 3.
The midspan connections of Units 1, 2, and 3 behaved very satisfactorily. Their proximity to the critical regions of the beams, and the smoothness of the construction joints, did not affect the performance of the units. Relative vertical shear deformations in the cold joints accounted for less than 6 percent of the total displacement imposed to the test units at the end test. Only minor cracking was observed to occur in the connection regions.
July-August 1995
500
400
~300 ~ -:(' 200 ..
INTERSTORY DRIFT 3%
I
':r:.:z: 100
L_-:-~8~~~~~~~~~~~~~~~~~ ct' 0 ~ ~ -100 ll)
).. -200 ct e -3oo ll) -400
-500
3% 2% 1% INTERSTORY DRIFT
Fig. 13. Lateral load-lateral displacement response and damage near the end of testing of Unit 2. Note: 1 kN = 0.225 kips; 1 mm = 0.0394 in.
The distribution of stresses in the top beam bars measured by mechanical and electrical resistance strain gauges in the midspan connection region are shown in Fig. 15. It is evident that for the three units, the bars were adequately anchored at midspan . As a result of these tests , the. new Standard for the Design of Concrete Structures• now permits lap splices to commence at a distance d from the faces of the columns .
Diagonally Reinforced Unit 4
Unit 4 displayed only a limited ductile response, as indicated by the lateral load-lateral displacement response shown in Fig. 16(a). At the first cycle to )111 = 2, corresponding to an interstory drift of 1.6 percent, large splitting cracks developed between the inner diagonal bars and the side longitudinal bars in the strong regions of the beam at the commencement of the diagonal re-
inforcement. Fig. 17 shows a plan view of a damaged region. Note that the additional strong end bars next to the sides of the beam are bent outwards.
It has been postulated3•5 that the
main cause for the limited ductile behavior of this unit was the presence of a three-dimensional stress field between the bend of the diagonal bars and the beam longitudinal reinforcement in the strong regions that had not been accounted for during design. This stress field should be considered in detail because the additional longitudinal reinforcement in the strong regions and the diagonal reinforcement lie in different vertical planes (see Section A-A in Fig. 6).
This is a major difference from similar beams tested by Paulay and Bull 13
that had the diagonal bars and the additional bars in the beam strong regions in the same vertical planes. Also, the bearing conditions at the bend of the diagonal bars need to be adequate .
53

H H ().(+) i:
'H ~ a::·
500 ~ H0 :::395.4kN ::t:
400 ----- V)
...... Lu ::... ~ 300 i::: '-' <:(
INTERS TORY DRIFT
:t"' 200 lll ~ a:: :t~ 100
-8 ci 0 <:( Lu :t -100 Vj
).. -200 a:: l2 -300 V)
-400
-500 1.2
3% 2% 1% INTERSTORY DRIFT
Fig. 14. Lateral load-lateral displacement response and damage near the end of testing of Unit 3. Note: 1 kN = 0.225 kips ; 1 mm = 0.0394 in.
Crushing of concrete at the inside of the bends was observed in this test.
Unit 4 was repaired, taking into account the presence of the three-dimensional stress field, to observe the overall performance of this connection detail when properly detailed . The badly cracked concrete in the beam around the bend of the diagonal bars was removed . Extra transverse ties around the bend of the diagonal bars were placed, as illustrated in Fig. 18.
The transverse force requiring the addition of the ties was calculated based on a three-dimensional truss model. 3 In addition, short transverse rods were tied in contact with the inside of the bend of the diagonal bars to improve the bearing conditions. Concrete with 60 MPa (8700 psi) compressive strength at 28 days was specified to replace the removed concrete.
The lateral load-lateral displacement hysteresis loops measured for the repaired unit, Unit 4r, and the damage at
54
the end of testing are depicted in Fig. 16(b). A fully ductile response was attained in this test. The diagonal reinforcement yielded extensively. No distress was observed at the bend of the diagonal reinforcement nor at welds of the bolted connection. The unit displayed a rather large lateral overstrength of 1.4Ha due to three main factors:
1. The reinforcing steel at the beam midspan was strained well into the work hardened region.
2. Strain aging of the diagonal reinforcement that had yielded in the first test occurred during the lapse between the two tests.
3. An axial compressive force in the beam due to friction in the sliding mechanism at the bottom of one of the columns.
The frictional force reacted against the fixed pin at the bottom of the opposite column [see Fig. lO(a)]. This axial force enhanced the beam flexural
capacity by about 4 percent. The large lateral load observed in the
first cycle to flt1 = ±6 induced a bending moment in the beam at the column faces sufficient to cause yielding of the longitudinal reinforcement there. Wide diagonal cracks in this region after yielding of the beam bars resulted in gradual degradation of the shear capacity in this region in the final cycles of the test. Unit 4r failed by sliding shear at one end of the beam at an interstory drift of 2.4 percent.
Units 5 and 6 Connected at the Beam-to-Column Joint
Fig. 19 illustrates the measured lateral load-displacement hysteretic response of Unit 5, and the damage at the end of testing. Neither the vertical nor horizontal construction joints between the precast and cast-in-place concrete, nor the anchorage of the bottom beam bars inside the beam-tocolumn joint region, were observed to affect the cyclic load performance of this unit. The theoretical strength Ha was attained. A displacement ductility of fl t1 = 6, at an interstory drift of about 3.5 percent, was reached with little strength degradation.
The main cracks in the beams of Unit 5 appeared at the column faces. These cracks occurred in the plane containing the face of the column and not in the plane of the vertical cold joints. The rough surface of these cracks was similar to those usually observed to occur in beams cast monolithically with the joint region. The results of this test suggest that, providing that the beams are seated a distance on the cover of the column, there is no need for special detailing on the vertical cold joints, such as shear keys or castellations, to emulate cast-in-place equivalent connections.
In the second cycle to fl t1 = 4, the relative slip between the top beam bars and the surrounding concrete throughout the joint region exceeded the spacing between the bar deformations. This magnitude of movement is the sign of a bond failure. The slippage of the top bars through the beamto-column joint caused the pinching of the hysteresis loops shown in Fig. 19.
It was expected that a bond failure
PCI JOURNAL

224
Average from Eas t and West bar
.._Ill
~-200 l'-1 E:: V)
~ (ll
f Midspan I
102 224
(a) Unit 1
ll:: "{ CXl
..!'
0
~Midspan
I
(c) Unit 3
0
1.0 ~
0.8 ~ .._,., '-
0.6 ~ <::> ;:::
0.4 ~
0.2 ~ l'-1 E::
0 V)
~Midspan
102mm gouge length
(b) Unit 2
rr71l Top bars-
Outer Ioyer
gouge length
1.0
~ 0.8 .._,.,
" 0.6 ~ c:;," ;:::
0.4 ~ ~
0 ~ V)
Fig. 15. Steel stress distri butions measured in the beam bars in the midspan connection region. Note: 1 MPa = 145 psi; 1 mm = 0.0394 in.
would not have occurred, or would have at least been delayed, because the ratio of the diameter of the longitudinal beam bar to column depth was 1/25. This satisfied the apparently conservative requirement for Grade 300 (!y = 43.5 ksi) steel bars given by NZS 3101:19824 for the maximum diameter of beam bars allowed to pass through interior beam-to-column
Ju ly-August 1995
joints. The main reason for this behavior is the poor quality, not strength, of the cast-in-place concrete in the beamto-column joint region, which accentuated the "top bar" effect.
Fig. 20 show~ the measured lateral load-lateral displacement response of Unit 6, and the damage at the end of testing. The load-displacement response was very stable with little
strength degradation right until the end of the test, at an interstory drift of approximately 3.5 percent. No adverse effects were observed to occur due to the grouted vertical corrugated ducts or the horizontal construction joint between the precast beam element and the cast-in-place lower column. Unit 6 performed in the same manner as castin-place concrete construction.
55

Table 3. Measured interstory dri ft at 0.75 H8 .
Unit LJ.y llc (percent)
I 0.32
2 0.26 f---
3 0.25
4 0.29
5 0.44
6 0.37
DISCUSSION OF TEST RESULTS
lnterstory Drift and Initial Stiffness
The first two cycles in the elastic range applied to the units permitted the evaluation of the interstory drift and the secant stiffness at the design lateral force.
Standards contain provisions to limit the interstory drift. The interstory drift limit for ductile moment resisting frames, computed assuming elastic behavior using the design lateral forces given by the New Zealand Code of Practice for General Structural Design'• is 0.33 percent or less. This limitation can be interpreted as a measure to minimize damage to non-engi neered elements such as building partitions during moderate earthquakes.
The design lateral force, Hd, in a test subassemblage designed according to New Zealand Standards4
·12
· '4 to form
plastic hinges in the beam can be approximately related to the theoretical lateral force, Ha, as:
where 1/J is the flexural strength reduction factor, aa is the ratio between the amount of steel provided at the critical section of the beams to that required by the design moments and ay is the ratio between the measured yield strength of the longitudinal steel placed in the critical region of the beams to the lower characteristic yield strength. Typical values of 1/J, aa and ay are:
1/J = 0.85 or 0.9
aa = 1 to 1.05
aY = 1.05 to 1.12
56
INTERSrGRY CRIFT 800
600
:r:_o
" H0 :636kN ___ :r:._ T.O 0:: );:{} "<(
~ 0.8 II)
1.00
~ ~ 0.6 i:::
~
-r 200
l ct 0 "<(
~ II)
-200 )...
gs ...... II)
-1.00
-600
-800
- I.
-1.0
~ O.t.
0:: 0. -2
2"/o 1% JNTERSTOR.Y DRIFT
1/20 1.0 a1
0/SPLACEMENT, /:1 {mm}
O.t.
Fig. 16(a). Lateral load-lateral displacement response and damage near the end of testing of Unit 4. Note: 1 kN = 0.225 kips; 1 mm = 0.0394 in.
The above range of values results in Hd varying between 0.72 and 0.86Ha.
Table 3 presents the interstory drift in Units 1 to 6 computed at 0.75Ha, which is a good approximation for Hd. Units 1 to 4 showed interstory drift levels below 0.33 percent and Unit 6 slightly exceeded this limit. Unit 5 was rather flexible, largely due to the beam end rotation caused by the poor bond conditions of the top bars anchored in the beam-to-column joint region in Unit 5. It is believed that if the concrete cast in the beam-to-column joint of this unit had not accentuated the "top bar" effect, the interstory drift would have been of the same order of that measured in Unit 6.
For the units tested, which were designed to form plastic hinges in the beams at the column faces (Units 1, 2, 3, 5, and 6), the secant stiffness of the test units measured at 0.75Ha was be-
tween 17 to 24 percent of that calculated using the gross section properties of the columns and beams and allowing only for flexural and shear deformations of the columns and beams but not the joint core.
The main reason for such a low value was the large rotation observed to occur in the beams at the column faces due to strain penetration of the longitudinal beam bars into the beamto-column joint region as well as the spread of curvature in the relatively short beams away from the column faces due to the diagonal tension cracking caused by interaction between flexure and shear. For Unit 4, with relocated plastic hinges, the measured secant stiffness at a load level of 0.75Ha was 54 percent of the calculated stiffness using the gross section properties. In this unit, the rotation of the beam at the column faces due to
PCI JOURNAL

strain penetration was not significant. Larger values for the effective mem
ber stiffness are often used to allow for the effects of cracking. Typical values of the moment of inertia to model beams and columns are 50 and 100 percent of the moment of inertia of the gross section. The use of these values will result in much smaller calculated interstory drift values than measured in these tests. It is recommended that the implication of the smaller stiffness values be considered when designing moment resisting frames for earthquake resistance with reinforced short beams, whether they are of precast or cast-inplace concrete.
Strength and Ductility
All subassemblages tested demonstrated that levels of strength and ductility similar to completely cast-inplace concrete construction can be attained by well detailed construction incorporating precast reinforced concrete elements. The construction joints and type of connection detail did not affect the performance of the subassemblages. All units attained at least two cycles to a displacement ductility factor of Jlt. = ±6 and interstory drifts in excess of 2.4 percent while maintaining at least 80 percent of the measured maximum lateral load.
Energy Dissipation Characteristics
Units I , 2, 3, and 5 presented satisfactory energy dissipation characteristics with hysteresis loops showing only minor pinching up to the first cycle to a displacement ductility factor of lit. = ±4 at interstory drifts of about 1.5 percent. The pinching of the hysteresis loops accentuated at larger interstory drifts due to diagonal tension cracking and yielding of the stirrups in the beam hinges in the first three units and to the bond failure in Unit 5. The repaired Units 4 and 6 showed excellent energy dissipation characteristics. Pinching of the hysteresis loops occurred only in the final cycles of the test.
The pinched hysteretic loops observed in some of the units at moderate displacement ductility factors and interstory drifts is anticipated to occur in beams, whether they are precast or
July-August 1995
INTERSTOR'{ DRIFT
1000
800
600
~ 400 ~
-:x:."' + 200
-:x:."'
Q;. 0
~ "3::. V)
:>... -200 Q;
e V)
-400
-600
-800
-1000 2% T"A. INTERSTORY DRIFT
Fig . 16(b}. Lateral load-lateral displacement response and damage near the end of testing of Unit 4. Note: 1 kN = 0.225 kips; 1 mm = 0.0394 in.
Fig. 17. Plan view of a damaged region of beam of Unit 4.
___....To beam midspan
57

024 trans.terse rods 30 x 70 straps
Fig. 18. Repair detail at bend of diagonal reinforcement of Unit 4.
cast-in-place, with small aspect ratios, reinforced without diagonal reinforcement in the beam plastic hinges . It should be noted, however, that short beams are normally used in buildings with fundamental periods of around 1 second or longer. In such buildings, the ductility capacity of the members becomes more important than the shape of the hysteresis loops.15
•16
Beam Elongation
All beams in lateral load moment resisting frames elongate when subjected to bending because the neutral axis moves away from the centroid of the section, particularly when elongation occurs after flexural yielding of the beams. Fig. 21 plots the beam elongation measured in Units 3 and 6 against the interstory drift. In Unit 3, the elongation was measured as the horizontal separation of the two columns. In Unit 6, the elongation was measured as the separation of the pins at the beam ends.
The average beam growth in these units at an interstory drift of 1 percent was 11 mm (0.43 in.) while 28 mm (1.1 in.) of average elongation was observed at an interstory drift of 2 percent. During reversed cyclic loading, the elongation tended to accumulate. This is because the compression reinforcement in the plastic hinge regions retains a significant tensile strain from the previous excursion when it had been in tension.
The beam elongation recorded in these tests indicates that design of fastenings for precast concrete cladding and glazing systems as well as for determining the seating and connection
58
INTERSTORY DRIFT
400 ~
3% 4%
~:t' I I 300 Ha=285kN cS ~
1 ----(..) - .o ....... H M+J ~~ 0.8 ~ 200 :W-l i::: :t: 06 a: + "{ll) •
~ 100 ill a: Vi --6 ~ 0 ::5 c5 1...) -100
-200 -0.6
-0.8
-300 -1.0
I -1.2 4% 3% 2% 196
INTERSTORY DRIFT
Fig . 19. Lateral load-lateral displacement response and damage at end of testing of Unit 5. Note: 1 kN = 0.225 kips ; 1 mm = 0.0394 in.
detailing of precast concrete floor systems should consider this effect.S
CONCLUSIONS This paper presents results of a re
search project on the seismic behavior of connections between precast reinforced concrete beams of ductile perimeter frames designed for earthquake resistance. The precast concrete systems tested are commonly used in regions of high seismicity in New Zealand to emulate cast-in-place concrete construction. The experimental program involved the quasi-static cyclic load testing of six beam-tocolumn subassemblages and the repair and retesting of one of them.
The test results lead to the following main conclusions:
1. None of the connecting details or construction joints had an important influence on the elastic or post-elastic response of the test units . All units, except the first test on Unit 4, attained at least two cycles to a displacement ductility factor of J.lA = ±6 and interstory drifts of 2.4 percent or greater, while maintaining at least 80 percent of the maximum recorded lateral load.
2. All units, except Unit 5, showed interstory drift levels at the design lateral force that are compatible with the limits imposed by the New Zealand Code of Practice for General Structural Design. 14
3. Units 1, 2, and 3 had connections
PCI JOURNAL

400
300
-200
-300
-1.00 I
4% 3% 2% 1% INTERSTORY DRIFT
INTERSTORY DRIFT
2"16
; I
4% I
Fig. 20. Lateral load-lateral displacement response and damage at end of testing of Unit 6. Note: 1 kN = 0.225 kips; 1 mm = 0.0394 in.
50
- 40 E E -c 0 30 ~ 0> c 0 20 w E as (I)
10 m
0
..........
0
Unit3 ........
-/··········; ............................................... ; .... i Unit 6
2
lnterstory Drift (%) 3
Fig. 21. Measured beam elongation for Units 3 and 6. Note: 1 mm = 0.0394 in.
July-August 1995
4
between precast elements at the midspan of beams consisting of overlapping hooks or straight splices in cast-in-place concrete. The behavior of these connections was very satisfactory . During the cyclic loading, the midspan connections displayed excellent performance despite the fact that the start of the connections in the beams was located within 2d of the faces of the columns where the plastic hinges formed.
4. Unit 4 had strong regions at the end of the precast beams and a diagonally reinforced cast-in-place concrete region at the beam midspan, with the diagonal bars connected by bolted steel plates welded to the bars. The test of this unit showed a limited ductile response due to the presence of bursting forces that had not been considered in the initial design. A fully ductile response, with displacement ductilities of at least 6 and interstory drifts of 2.4 percent, was attained after repairing the damaged region with additional transverse reinforcement and bearing rods at the bend of the diagonal bars.
5. Unit 5 had the precast concrete beams placed between the columns and a cast-in-place concrete joint core between the beam ends . The precast concrete beams were seated on 30 mrn (1.2 in.) of cover concrete of the column below and had relatively smooth vertical construction joints. The protruding bottom bars of the precast beams were hooked upwards and anchored in the cast-in-place concrete beam-to-column joint core. The overall behavior of thi s system was excellent in terms of strength and ductility , despite the critical sections of the beams almost coinciding with the smooth construction joints between the end of the precast concrete beams and the cast-in-place concrete joint core. The poor quality concrete placed in the beam-to-column joint region showed excessive bleeding and plastic settlement during casting that had a detrimental effect on the bond of the top beam bars anchored in this region. This, in turn, con tributed to a larger interstory drift in the elastic cycles and to a bond failure of the top bars in the later stages of the test.
59

6. Unit 6 had a precast concrete beam element passing through the column and the longitudinal column bars grouted in vertical corrugated ducts in the beam-to-column joint region. This unit displayed excellent performance. The grouted ducts and the construction joint between the precast concrete beam and the reinforced concrete below had an insignificant effect on the behavior of this test.
7. The secant stiffness measured at 75 percent of the theoretical lateral load strength in the initial loading cycles, for the subassemblages designed to form plastic hinges in the beams at the column faces, ranged between 17 to 24 percent of that calculated using the gross section properties, which took into account flexure and shear deformations only in the beams and the columns. The large reduction in the stiffness was due to the rotation in the beams and the columns at the joint faces caused by the penetration of strains in longitudinal bars into the joint and also to the spread of curvature in the beams away from the column faces due to diagonal tension cracking.
RECOMMENDATIONS 1. Moment resisting frames incor
porating precast concrete systems such as those tested in this investigation can be analyzed and designed to emulate cast-in-place reinforced concrete construction.
60
2. Connections between precast concrete beams involving bar splices can commence at a distance as close as one effective depth of the beam from the critical regions where plastic regions are expected to develop without compromising the strength, ductility or energy dissipation characteristics of the precast concrete member.
3. Precast concrete units involving relocated plastic hinges and diagonal reinforcement at the beam midspan need special consideration in design to account for the presence of out-ofplane bursting forces in the region near the bend of the diagonal reinforcement.
4. Vertical construction joints of beams of System 1, shown in Fig. l(a), require no special detailing, such as shear keys or castellations, if the beams are seated a distance on the concrete cover of the column below. This is because the main flexural crack in the beam at the column face forms in monolithic concrete, as in completely cast-in-place concrete beam-to-column joints.
5. In New Zealand, it is recommended that the compressive strength of the grout used in connections be at least 10 MPa (1450 psi) greater than the compressive strength of the precast concrete elements.2 This recommendation appears to be satisfactory for the design of precast concrete systems of this type. Construction using this system requires strict quality control to ensure that the fluid grout flows through all ducts without leaving air pockets.
6. Suitable values for the second moment of inertia, to recognize the effects of the rotation in the beams and the columns at the joint faces and the spread of curvature in the beams away from the column faces due to diagonal tension cracking, should be chosen to conduct the elastic analysis with the design lateral forces.
7. Allowances for the effects of the elongation of beams in perimeter frames designed for earthquake resistance should be made in the design of fastenings for precast concrete cladding and glazing systems as well as for the seating lengths and end details of proprietary floor systems.
ACKNOWLEDGMENT
This research project was funded by the New Zealand Concrete Society through contributions from its members and by the Earthquake and War Damage Commission.
The authors acknowledge the many · contributions received from different engineering firms in New Zealand, particularly the Holmes Consulting Group, Kingston Morrison Ltd. and Beca Carter Hollings and Ferner Ltd. , from the concrete industry and from Pacific Steel Ltd. Associate Professor R. Fenwick of the University of Auckland, New Zealand, provided many useful ideas and comments on this project.
PCI JOURNAL

1. Park, R., "A Perspective on the Seismic Design of Precast Concrete Structures in New Zealand," PCI JOURNAL, V. 40, No. 3, May-June 1995, pp. 40-60.
2. Guidelines for the Use of Structural Precast Concrete in Buildings, Report of a Study Group of the New Zealand Concrete Society and the New Zealand National Society for Earthquake Engineering, Centre for Advanced Engineering, University of Canterbury, Christchurch, New Zealand, 1991.
3. Restrepo, J. I., Park, R., and Buchanan, A. H., "Design of Connections of Earthquake Resisting Precast Reinforced Concrete Perimeter Frames of Buildings." To be published in PCI JOURNAL.
4. Code of Practice for the Design of Concrete Structures, NZS 3101:1982, Standards Association of New Zealand, Wellington, New Zealand, 1982.
5. Restrepo, J. I., Park, R., and Buchanan, A. H., Seismic Behaviour of Connections Between Precast Concrete Elements, Research Report 93-3, Department of Civil Engineering, University of Canterbury, Christchurch, New
d =effective depth of a beam
db= nominal diameter of reinforcing bar
J; =concrete cylinder compressive strength
J; = grout cylinder compressive strength
/y = yield strength of steel
H =applied lateral force; in Units 1 to4,H=HN+Hs
Ha = theoretical load capacity of a test unit based on measured material properties, assum-
July-August 1995
REFERENCES
Zealand, April1993.
6. ACI Committee 318, "Building Code Requirements for Reinforced Concrete and Commentary (ACI 318-89)," American Concrete Institute, Detroit, MI, 1989.
7. Paulay, T., "Lap Splices in EarthquakeResisting Columns," ACI Journal, V. 79, No. 6, November-December 1982, pp. 459-469.
8. Buchanan, A. H., "Diagonal Beam Reinforcing for Ductile Frames," Bulletin of the New Zealand National Society for Earthquake Engineering, V. 12, No.4, December 1979, pp. 346-356.
9. Erasmus, L.A., "Cold Straightening of Partially Embedded Reinforcing Bars -A Different View," Concrete International, V. 3, No.6, 1981, pp. 47-52.
10. Restrepo, J. I., Dodd, L. L., Park, R., and Cooke, N., "Variables Affecting the Cyclic Behavior of Reinforcing Steels," ASCE Journal of Structural Engineering, V. 120, No. 11, 1994.
11. "Standard Test Method for Flow of Grout for Preplaced-Aggregate Concrete (Flow Cone Method)," ASTM Standard C 939-87, American Society for Testing and Materials, ASTM
APPENDIX- NOTATION
ing the ACI rectangular block of stresses, a bilinear relationship for steel and assuming a linear variation of strain and a strain, of 0.003 at the extreme compression fiber
HN, Hs =column shear forces
lc = distance between top and bottom pinned ends in column
ls = splice length
aa =ratio between amount of longitudinal steel provided in
Standards Volume 04.02, Philadelphia, PA, 1988.
12. Design of Concrete Structures, NZS 3101:1995, Standards New Zealand, Wellington, New Zealand, 1995
13. Paulay, T., and Bull, I. N., "Shear Effect on Plastic Hinges of Earthquake Resisting Reinforced Concrete Frames," Bulletin D'Information 132, Comite Euro-Intemational du Beton, 1979, pp. 165-172
14. Code of Practice for General Structural Design and Design Loadings for Buildings, NZS 4203: 1992, Standards New Zealand, Wellington, New Zealand 1992.
15. Priestley, M. J. N., and Tao, J., "Seismic Response of Precast Prestressed Concrete Frames With Partially Debonded Tendons," PCI JOURNAL, V. 38, No. l, January-February 1993, pp. 58-69.
16. Kitayama, K., Otani, S., and Aoyama, H., "Development of Design Criteria for RC Interior Beam-Column Joints," Design of Beam-Column Joints for Seismic Resistance, ACI Special Publication SP-123, American Concrete Institute, Detroit, MI, 1991, pp. 97-123.
critical region of beam to amount of steel required
ay = ratio between actual yield strength of steel to characteristic yield strength
oel = total beam elongation per span
L1 = interstory displacement
L1Y = interstory displacement at "first" yield
J.l.1 = displacement ductility factor, equal to L1/ Liy
ifJ = strength reduction factor
61