Embed Size (px)
Citation preview
Tests and Quizzes from Math 355 - Fall 1999Future tests and quizzes may be significantly different. Space between the problems has been removed.
Math 355 - Fall 1999 - Test #1
Show ALL your work. Incorrect Solutions with no work will receive NO credit. Neatness counts! Remember to give allof your answers accurate to at least 4 significant digits. For the Multiple Choice problems : Select the answer which bestcompletes the phrase.
1. (3 points) An office supply catalog gives a description of bookshelves which includes the following variables. Whichof these variables is categorical?
(a) The width of a bookshelf in inches.(b) The width of a bookshelf in feet.(c) The color of the bookshelf.(d) The height of a bookshelf in inches.
2. (3 points) The average salary of all female workers is $35,000. The average salary of all male workers is $41,000.What must be true about the average salary of all workers?
(a) It must be $38,000.(b) It must be larger than the median salary.(c) It could be any number between $35,000 and $41,000.(d) It must be larger than $38,000.
3. (3 points) A researcher reports that, on average, the participants in his study lost 10.4 lbs. after two months onhis new diet. A friend of yours comments that she tried the diet for two months and lost no weight, so clearly thereport must be a fraud. Which of the following statements is correct?
(a) Your friend must not have followed the diet correctly, since she did not lose weight.(b) Since your friend did not lose weight, the report must not be correct.(c) The report only gives the average. This does not imply that all participants in the study lost 10.4 lbs. or
even that all lost weight. Your friend’s experience does not necessarily contradict the study results.(d) In order for the study to be correct, we must now add your friend’s results to those of the study and recompute
the new average.4. (12 points) The following data are collected.
11 6 -1 2 10 8 5 6
(a) Find the mean of the data.(b) Find the median of the data.(c) Find the standard deviation of the data.
5. (12 points) The length of human pregnancies from conception to birth varies according to a distribution that isapproximately normal with mean 266 days and standard deviation 16 days.
(a) What percent of pregnancies last less that 249 days?(b) What percent of pregnancies last between 249 and 281 days?(c) How long do the longest 30% of pregnancies last?
6. (8 points) The U.S. Census reports the population in 1998 of the Midwest by age. The data are summarized (androunded) in the following table. (in order to make this a little easier, we will ignore the people older than 100)
Age Group Frequency0 to 24 2200000025 to 49 2300000050 to 74 1300000075 to 99 4000000
Total 62000000
Using this tabled data, sketch a relative frequency histogram for the ages of people in the Midwest in 1998.
7. (21 points) Heights (in inches) and parts of singers in the New York Choral Society were recorded. The data aresummarized in the MINITAB output on the back page. Use the output to answer the following questions.
(a) How tall is the tallest person in the choir?(b) What is the InterQuartile Range for the heights of the sopranos?(c) Exactly what percentage of the choir members were less than 65 inches tall?
(d) The shape of the stemplot is best described byi. Flat.
ii. Roughly symmetric, with some slight skewness to the right.iii. Strongly skewed to the right.iv. Strongly skewed to the left.
(e) Sopranos are the highest voice, next altos, then tenors and basses are the lowest voice. Comment on anypattern in the heights in relation to the highness of the voice.
(f) Are the heights for tenors approximately normally distributed? Explain your answer.
8. (3 points) A study is conducted to determine if one can predict the yield of a crop based on the amount of yearlyrainfall. The response variable in this study is
(a) yield of the crop.
(b) amount of yearly rainfall.(c) the experimenter.(d) the number of crops.
9. (3 points) A lurking variable is(a) the true cause of a response.(b) a variable which is not explicitly measured but which affects the response variable.(c) any variable that produces a large residual.(d) the true variable which is explained by the explanatory variable.
10. (3 points) The owner of a chain of supermarkets notices that there is a positive correlation between the sales ofbeer and the sales of ice cream over the course of the previous year. Weeks when the sales of beer were high thesales of ice cream tended to be high also. Which of the following would be a valid conclusion from these facts?
(a) Sales records must be in error. There should be no association between beer and ice cream sales.(b) Evidently, for a significant proportion of customers, drinking beers causes a desire for ice cream or eating ice
cream causes a thirst for beer.(c) A scatterplot of weekly ice cream sales versus monthly beer sales would show a pattern described by a
horizontal line.(d) None of the above.
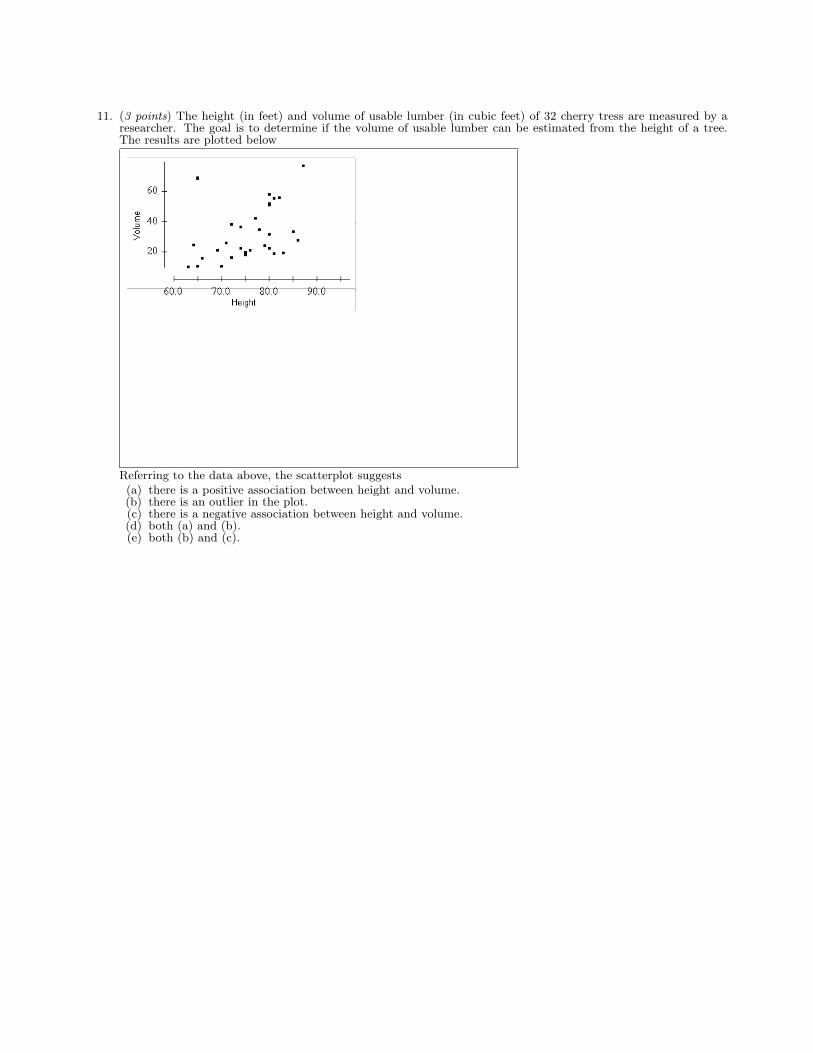
11. (3 points) The height (in feet) and volume of usable lumber (in cubic feet) of 32 cherry tress are measured by aresearcher. The goal is to determine if the volume of usable lumber can be estimated from the height of a tree.The results are plotted below
Referring to the data above, the scatterplot suggests(a) there is a positive association between height and volume.(b) there is an outlier in the plot.(c) there is a negative association between height and volume.(d) both (a) and (b).(e) both (b) and (c).
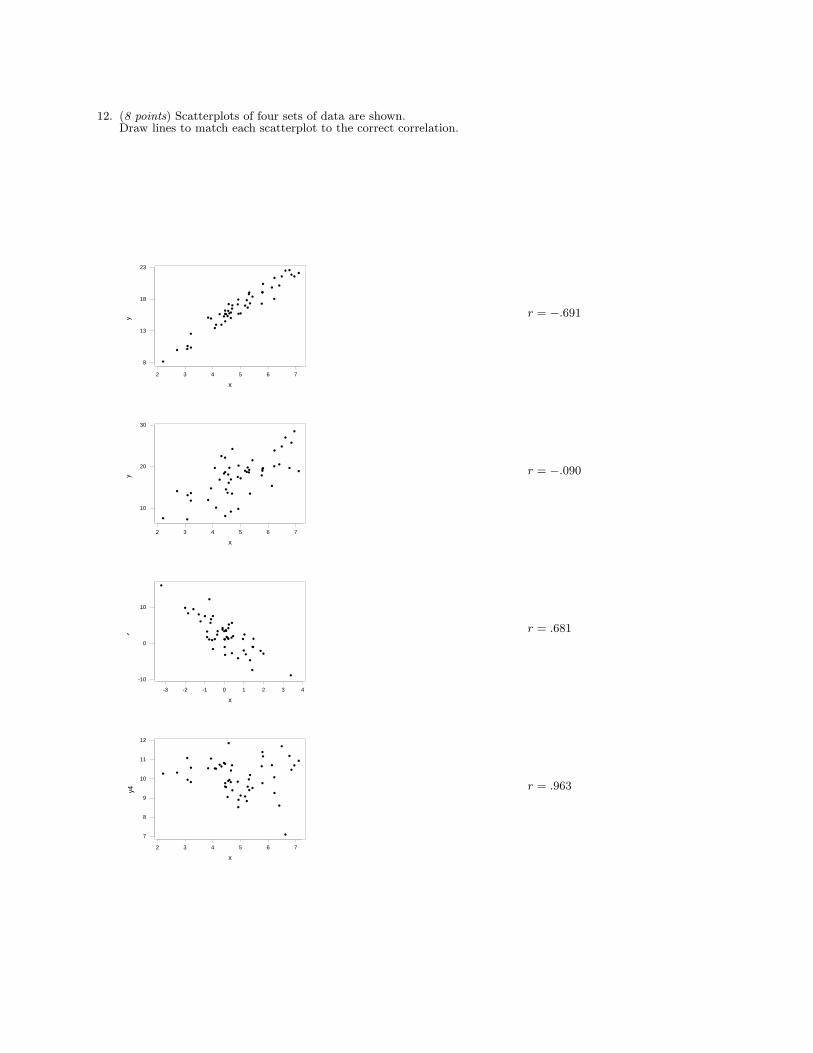
12. (8 points) Scatterplots of four sets of data are shown.Draw lines to match each scatterplot to the correct correlation.
765432
23
18
13
8
x
y r = −.691
765432
30
20
10
x
y r = −.090
43210-1-2-3
10
0
-10
x
y r = .681
765432
12
11
10
9
8
7
x
y4 r = .963
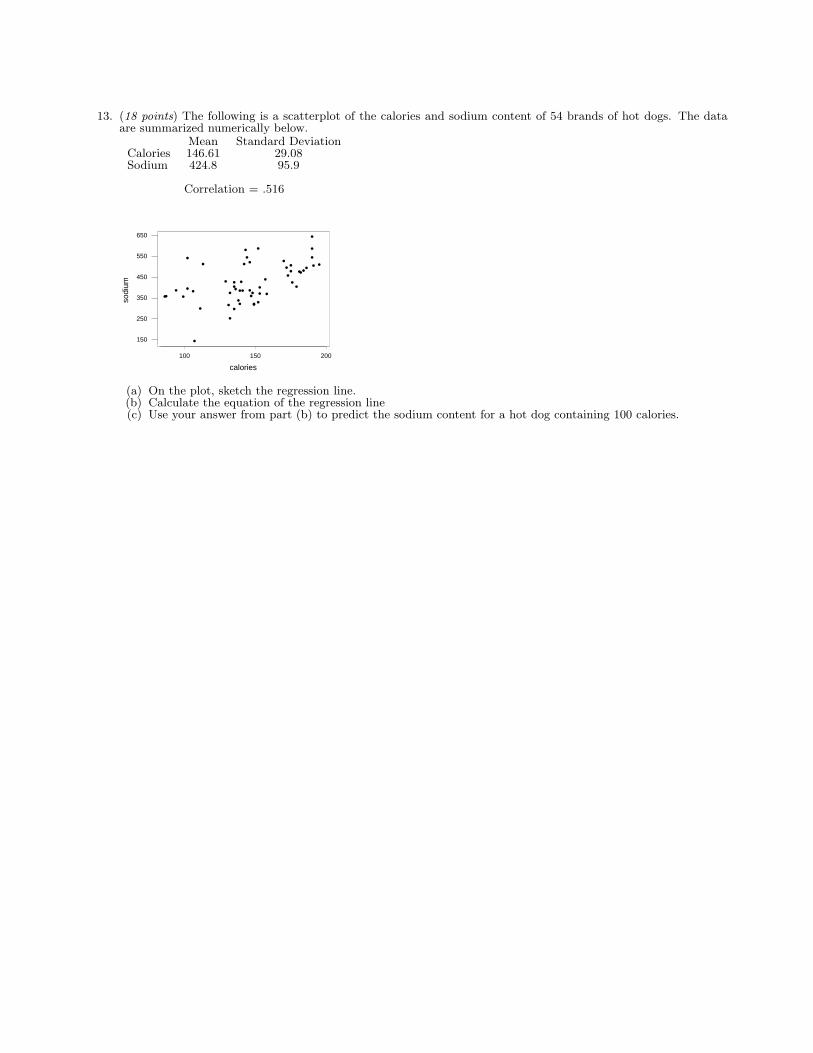
13. (18 points) The following is a scatterplot of the calories and sodium content of 54 brands of hot dogs. The dataare summarized numerically below.
Mean Standard DeviationCalories 146.61 29.08Sodium 424.8 95.9
Correlation = .516
200150100
650
550
450
350
250
150
calories
sodi
um
(a) On the plot, sketch the regression line.(b) Calculate the equation of the regression line(c) Use your answer from part (b) to predict the sodium content for a hot dog containing 100 calories.
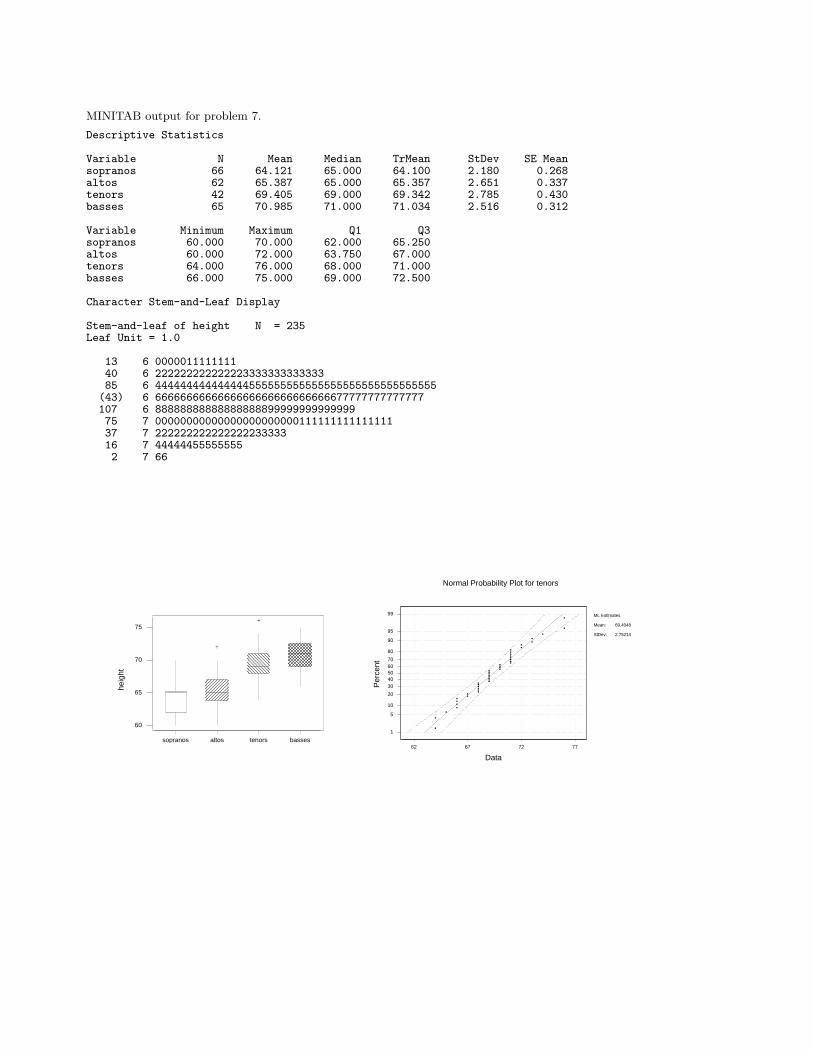
MINITAB output for problem 7.
Descriptive Statistics
Variable N Mean Median TrMean StDev SE Meansopranos 66 64.121 65.000 64.100 2.180 0.268altos 62 65.387 65.000 65.357 2.651 0.337tenors 42 69.405 69.000 69.342 2.785 0.430basses 65 70.985 71.000 71.034 2.516 0.312
Variable Minimum Maximum Q1 Q3sopranos 60.000 70.000 62.000 65.250altos 60.000 72.000 63.750 67.000tenors 64.000 76.000 68.000 71.000basses 66.000 75.000 69.000 72.500
Character Stem-and-Leaf Display
Stem-and-leaf of height N = 235Leaf Unit = 1.0
13 6 000001111111140 6 22222222222222333333333333385 6 444444444444444555555555555555555555555555555
(43) 6 6666666666666666666666666666677777777777777107 6 8888888888888888889999999999999975 7 0000000000000000000000011111111111111137 7 22222222222222223333316 7 444444555555552 7 66
bassestenorsaltossopranos
75
70
65
60
heig
ht
77726762
99
95
90
80
7060504030
20
10
5
1
Data
Per
cent
Normal Probability Plot for tenors
ML Estimates
Mean:
StDev:
69.4048
2.75214
Math 355 - Fall 1999 - Test #2
Show ALL your work. Incorrect Solutions with no work will receive NO credit. Neatness counts! Remember to give allof your answers accurate to at least 4 significant digits. For the Multiple Choice problems : Select the answer which bestcompletes the phrase.
1. (3 points) If changes in an explanatory and a response variable are caused by changes in a lurking variable, anyobserved association between the explanatory variable and the response variable is due to
(a) common response.(b) confounding.(c) a cause-and-effect relation between the explanatory and response variables.(d) condensation.(e) correlation.
2. (3 points) A researcher observes that, on average, the number of divorces in cities with major league baseballteams is larger than in cities without major league baseball teams. The most plausible explanation for thisobserved association is
(a) the presence of a major league baseball team causes the number of divorces to rise (perhaps husbands arespending too much time at the ballpark).
(b) the association is due to common response (major league teams tend to be in large cities with more peoplehence a greater number of divorces).
(c) the observed association is purely coincidental. It is implausible to believe the observed association could beanything other than accidental.
(d) the high number of divorces is responsible for the presence of a major league baseball team (more single menmeans potentially more fans at the ballpark, making it attractive for an owner to relocate to such cities).
3. (3 points) Two variables in a study are said to be confounded if(a) they are highly correlated.(b) one cannot separate their effects on a response variable.(c) they do not have a normal distribution.(d) one of them is a placebo.
4. (3 points) In order to determine if smoking causes cancer, researchers surveyed a large sample of adults. For eachadult they recorded whether the person had smoked regularly at any period in his or her life and whether theperson had cancer. They then compared the proportion of cancer cases in those who had smoked regularly at sometime in their life with the proportion of cases in those who had never smoked regularly at any point in their life.The researchers found there was a higher proportion of cancer cases among those who had smoked regularly thanamong those who had never smoked regularly. This is
(a) an experiment, but not a double-blind experiment.(b) a double-blind experiment.(c) an observational study.(d) a block design.
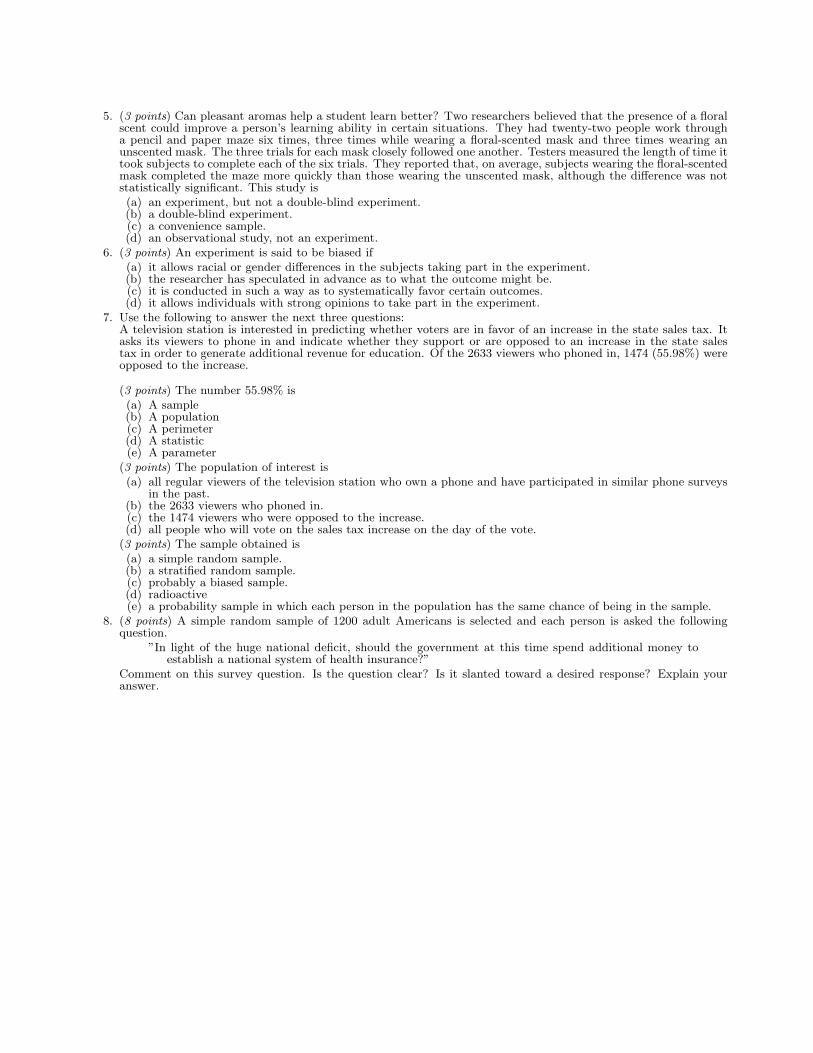
5. (3 points) Can pleasant aromas help a student learn better? Two researchers believed that the presence of a floralscent could improve a person’s learning ability in certain situations. They had twenty-two people work througha pencil and paper maze six times, three times while wearing a floral-scented mask and three times wearing anunscented mask. The three trials for each mask closely followed one another. Testers measured the length of time ittook subjects to complete each of the six trials. They reported that, on average, subjects wearing the floral-scentedmask completed the maze more quickly than those wearing the unscented mask, although the difference was notstatistically significant. This study is
(a) an experiment, but not a double-blind experiment.(b) a double-blind experiment.(c) a convenience sample.(d) an observational study, not an experiment.
6. (3 points) An experiment is said to be biased if(a) it allows racial or gender differences in the subjects taking part in the experiment.(b) the researcher has speculated in advance as to what the outcome might be.(c) it is conducted in such a way as to systematically favor certain outcomes.(d) it allows individuals with strong opinions to take part in the experiment.
7. Use the following to answer the next three questions:A television station is interested in predicting whether voters are in favor of an increase in the state sales tax. Itasks its viewers to phone in and indicate whether they support or are opposed to an increase in the state salestax in order to generate additional revenue for education. Of the 2633 viewers who phoned in, 1474 (55.98%) wereopposed to the increase.
(3 points) The number 55.98% is(a) A sample(b) A population(c) A perimeter(d) A statistic(e) A parameter
(3 points) The population of interest is(a) all regular viewers of the television station who own a phone and have participated in similar phone surveys
in the past.(b) the 2633 viewers who phoned in.(c) the 1474 viewers who were opposed to the increase.(d) all people who will vote on the sales tax increase on the day of the vote.
(3 points) The sample obtained is(a) a simple random sample.(b) a stratified random sample.(c) probably a biased sample.(d) radioactive(e) a probability sample in which each person in the population has the same chance of being in the sample.
8. (8 points) A simple random sample of 1200 adult Americans is selected and each person is asked the followingquestion.
”In light of the huge national deficit, should the government at this time spend additional money toestablish a national system of health insurance?”
Comment on this survey question. Is the question clear? Is it slanted toward a desired response? Explain youranswer.
9. (10 points) A study of human development showed two types of movies (one animated and one non-animated) togroups of children. 100 children were randomly split into two groups of 50, one group was shown the animatedmovie and the other group was shown the non-animated movie. Crackers were available in a bowl, and the inves-tigators compared the number of crackers eaten by children watching the different kinds of movies. The animatedmovie was shown at 8 A.M. (after breakfast). and the non-animated movie at 11 A.M. (before lunch). It wasfound that during the non-animated, more crackers were eaten than during the animated movie. The investigatorsconcluded that the non-animated movies are associated with an increase in appetite.
(a) Give one lurking variable which might be affecting the results of this study. Explain your answer.(b) Briefly describe how you would redesign the experiment to account for the lurking variable you chose in part
(a).10. (10 points) Cocaine addiction is hard to break. Addicts need cocaine to feel any pleasure so perhaps giving them
an antidepressant drug will help. A 3-year study with 72 chronic cocaine users compared an anti-depressant drugcalled desipramine with lithium and a placebo. (Lithium is a standard drug to treat cocaine addiction.) One thirdof the subjects chosen at random received each drug. Here are the results
Cocaine Relapse?Yes No
Desipramine 10 14Lithium 18 6Placebo 20 4
(a) Find the marginal distribution for Cocaine Relapse.(b) Use percents to compare the effectiveness of the three treatments. Using complete sentences, briefly summa-
rize your conclusions.
11. (3 points) Which of the following is ALWAYS true:(a) all probabilities are between 0 and 1, inclusive(b) P (A and B) = P (A)P (B)(c) P (A or B) = P (A) + P (B)(d) statements (a) and (b) are always true(e) statements (a) and (c) are always true
12. (3 points) I toss a penny and observe whether it lands heads up or tails up. Suppose the penny is fair, i.e., theprobability of heads is 1/2 and the probability of tails is 1/2. This means
(a) every occurrence of a head must be balanced by a tail in one of the next two or three tosses.(b) regardless of the number of flips, half will be heads and half tails.(c) if I flip the coin many, many times, the proportion of heads will be approximately 1/2 and this proportion
will tend to get closer and closer to 1/2 as the number of tosses increases.(d) all of the above.
13. (3 points) Suppose we roll a red die and a green die. Let A be the event that the number of spots showing on thered die is three or less and B be the event that the number of spots showing on the green die is more than three.The events A and B are
(a) disjoint.(b) complements.(c) independent.(d) reciprocals.(e) conditional
14. (8 points) Match each statement on the left with a probability on the right. Use the answer that best matches thestatement. Put the roman numeral in the appropriate blank.
I probability is 0
(a) This event is certain. It will occur on every trial of therandom phenomenon.
II probability is .01
(b) This event is impossible. It can never occur III probability is .3
(c) This event is very unlikely, but will occur once in awhile in a long sequence of trials.
IV probability is .6
(d) This event is not extremely likely, but it will occurmore often than not.
V probability is .99
VI probability is 1
15. (6 points) I select two cards from a deck of 52 cards and observe the color of each (26 cards in the deck are redand 26 are black). Write down the sample space for this situation.
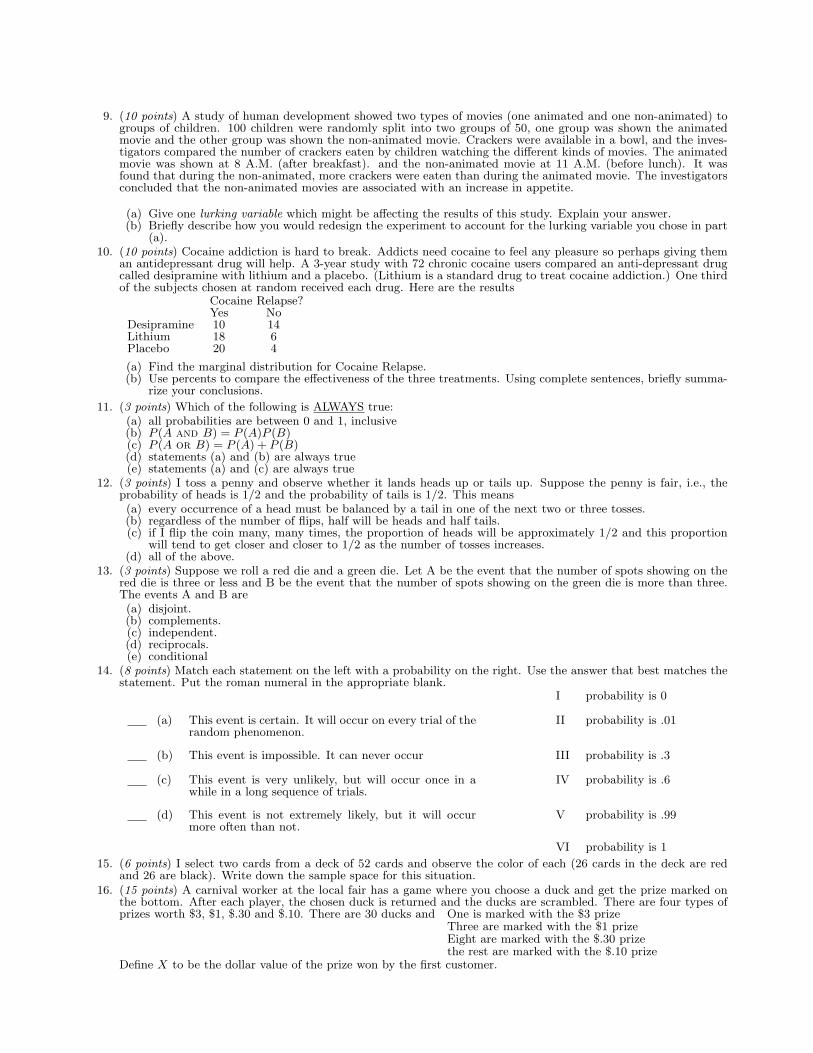
16. (15 points) A carnival worker at the local fair has a game where you choose a duck and get the prize marked onthe bottom. After each player, the chosen duck is returned and the ducks are scrambled. There are four types ofprizes worth $3, $1, $.30 and $.10. There are 30 ducks and One is marked with the $3 prize
Three are marked with the $1 prizeEight are marked with the $.30 prizethe rest are marked with the $.10 prize
Define X to be the dollar value of the prize won by the first customer.

(a) Fill in the missing values in the probability distribution table.X $3.00 $1.00 $0.30 $0.10Probability
(b) Find the mean for the random variable X.(c) The carnival worker charges $1 to play the game. On average, what will his profit be (per customer).
17. (7 points) A string of Christmas lights contains 28 lights. The lights are wired in series, so that if any lightfails the whole string will go dark. Each light has a probability of .04 of failing during this year. The lights failindependently of each other. What is the probability that the string of lights will remain bright for this year?
Math 355 - Fall 1999 - Test #3Show ALL your work. Incorrect Solutions with no work will receive NO credit. Neatness counts! Remember to give allof your answers accurate to at least 4 significant digits. For the Multiple Choice problems : Select the answer which bestcompletes the phrase.
1. (3 points) A random sample of size 25 is to be taken from a population which is normally distributed with mean60 and standard deviation 10. The average x of the observations in our sample is to be computed. The samplingdistribution of x is
(a) binomial with mean 60 and standard deviation 10(b) normal with mean 60 and standard deviation 10.(c) normal with mean 60 and standard deviation 0.4.(d) normal with mean 12 and standard deviation 2.(e) normal with mean 60 and standard deviation 2.
2. (3 points) A random variable X has mean µ and standard deviation σ. Suppose n independent observations ofX are taken and the average x of these n observations is computed. We can assert that if n is very large, thesampling distribution of x is approximately normal. This assertion follows from
(a) the law of large numbers(b) the definition of the sampling distribution(c) the bell curve(d) the central limit theorem(e) the Binomial Setting
3. (3 points A random variable X has mean µ and standard deviation σ. Suppose n independent observations ofX are taken and the average x of there n observations is computed. The standard deviation of the samplingdistribution of x is
(a) σ/√n
(b)
rp(1− p)
n
(c)x− µσ√n
(d) 1(e) σ
4. (15 points) A survey asks a random sample of 1500 adults in Ohio if they support an increase in the state salestax from 5% to 6%, with the additional revenue going to education. Let p̂ denote the proportion in the samplethat say they support the increase. Suppose the in fact 40% of all adults in Ohio support the increase.
(a) Find the mean µp̂ for p̂. Find the standard deviation σp̂ for p̂.(b) Find the probability that p̂ will be more than .42
5. (12 points) The weights of oranges packed at a particular orchard are normally distributed with a mean of 14ounces and a standard deviation of 2 ounces. Take a SRS of 20 oranges
(a) What are the mean and standard deviation of the mean weight x of these 20 oranges?(b) Use Table A to calculate the probability that the mean weight x of these oranges will be more than 17 ounces?(c) Explain why it is valid to use Table A for your calculation in the part (b).
6. (3 points) When calculating confidence intervals (with all other things remaining the same): as the confidence level decreases,the width of the confidence interval
(a) increases.(b) decreases.(c) does not change.(d) There is not enough information to answer.
7. (3 points) When calculating confidence intervals (with all other things remaining the same): as the sample mean increases,the width of the confidence interval
(a) increases.(b) decreases.(c) does not change.(d) There is not enough information to answer.
8. (3 points) Which of the following will increase the value of the power in a statistical test of hypotheses?
(a) Decrease the significance level α.(b) Increase the sample size.

(c) Consider computing the power for a value of the alternative which is farther from the value of the parameterof interest under the null hypothesis.
(d) both (b) and (c)(e) All of the above.
9. (3 points) In formulating hypotheses for a statistical test of significance, the null hypothesis is often
(a) a statement of “no effect” or “no difference’.”(b) the probability or observing data as or more extreme as the data you obtained.(c) a statement that all of the data are 0.(d) α = .05
10. (3 points) In their advertisements, the marketers of a new diet program would like to claim that their methodsresult in a mean weight loss of more than 10 pounds in two weeks. In order to determine if this is a valid claim,they hire an independent testing agency which then selects 25 people to be placed on this diet. The agency shouldbe testing the null hypothesis H0 : µ = 10 and the alternative hypothesis
(a) Ha : µ < 10(b) Ha : µ > 10(c) Ha : µ 6= 10(d) Ha : µ 6= 10± σ√
n
11. (3 points) In testing hypotheses, which of the following would be strong evidence against the null hypothesis?
(a) using a small level of significance.(b) using a large level of significance.(c) obtaining data with a small P-value.(d) obtaining data with a large P-value.
12. (2 points each) True or False. Circle the best answer.
True False If we reject H0 when H0 is true, we have made a type I error.
True False If we accept H0 when H0 is false, we have made a type II error.
True False If we accept H0 when H0 is true, we have made a correct decision.
13. (15 points) Radon is a colorless, odorless gas that is naturally released by rocks and soils and may concentratein tightly closed houses. Because radon is radioactive, there is some concern that it may be a health hazard.Radon detectors are sold to homeowners worried about this risk, but the detectors may be inaccurate. Universityresearchers placed 12 detectors in a chamber where they were exposed to 105 picocuries per liter (pCi/l) of radonover 3 days. Here are the readings from the 12 detectors.
91.9 97.8 111.4 122.3 105.4 95.0103.8 99.6 96.6 119.3 104.8 101.7
Assume that σ = 9 and that preliminary analysis indicates that the population of measurements is normallydistributed. Hint: the sum of the data values is 1249.6
(a) Find a 97% confidence interval for the mean reading for all radon detectors.(b) Find the margin of error m for the confidence interval you obtained in part (a).(c) The researchers want a 97% confidence interval with m ≤ 4.6, what is the smallest sample size which will
satisfy them?
14. (10 points) Heights of singers in the New York Choral Society were recorded. The data for the first tenor sectionare summarized by MINITAB below. Use the summary to answer the question. Assume that the data are arandom sample from the population of all first tenors, and that no outliers are present.
Descriptive Statistics
Variable N Mean Median TrMean StDev SE Meantenors 42 69.405 69.000 69.342 2.785 0.430
Variable Minimum Maximum Q1 Q3tenors 64.000 76.000 68.000 71.000
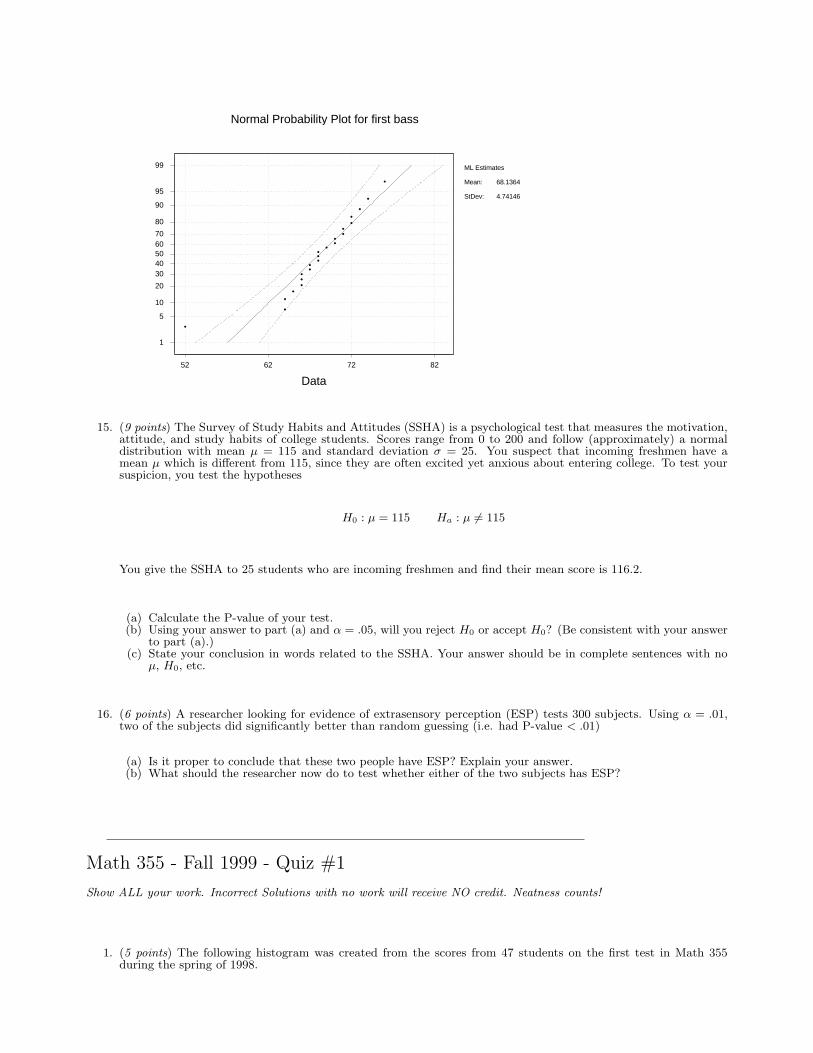
(a) Find a 95% confidence interval for the mean height of all first tenors.(b) A Normal Probability Plot for the heights for the men in the first bass section is shown below. We want a
95% confidence interval for the heights of all first basses. Would the procedure for the confidence intervalsusing the t-statistics be appropriate? Explain your answer.
82726252
99
95
90
80
7060504030
20
10
5
1
Data
Per
cent
Normal Probability Plot for first bass
ML Estimates
Mean:
StDev:
68.1364
4.74146
15. (9 points) The Survey of Study Habits and Attitudes (SSHA) is a psychological test that measures the motivation,attitude, and study habits of college students. Scores range from 0 to 200 and follow (approximately) a normaldistribution with mean µ = 115 and standard deviation σ = 25. You suspect that incoming freshmen have amean µ which is different from 115, since they are often excited yet anxious about entering college. To test yoursuspicion, you test the hypotheses
H0 : µ = 115 Ha : µ 6= 115
You give the SSHA to 25 students who are incoming freshmen and find their mean score is 116.2.
(a) Calculate the P-value of your test.(b) Using your answer to part (a) and α = .05, will you reject H0 or accept H0? (Be consistent with your answer
to part (a).)(c) State your conclusion in words related to the SSHA. Your answer should be in complete sentences with no
µ, H0, etc.
16. (6 points) A researcher looking for evidence of extrasensory perception (ESP) tests 300 subjects. Using α = .01,two of the subjects did significantly better than random guessing (i.e. had P-value < .01)
(a) Is it proper to conclude that these two people have ESP? Explain your answer.(b) What should the researcher now do to test whether either of the two subjects has ESP?
Math 355 - Fall 1999 - Quiz #1
Show ALL your work. Incorrect Solutions with no work will receive NO credit. Neatness counts!
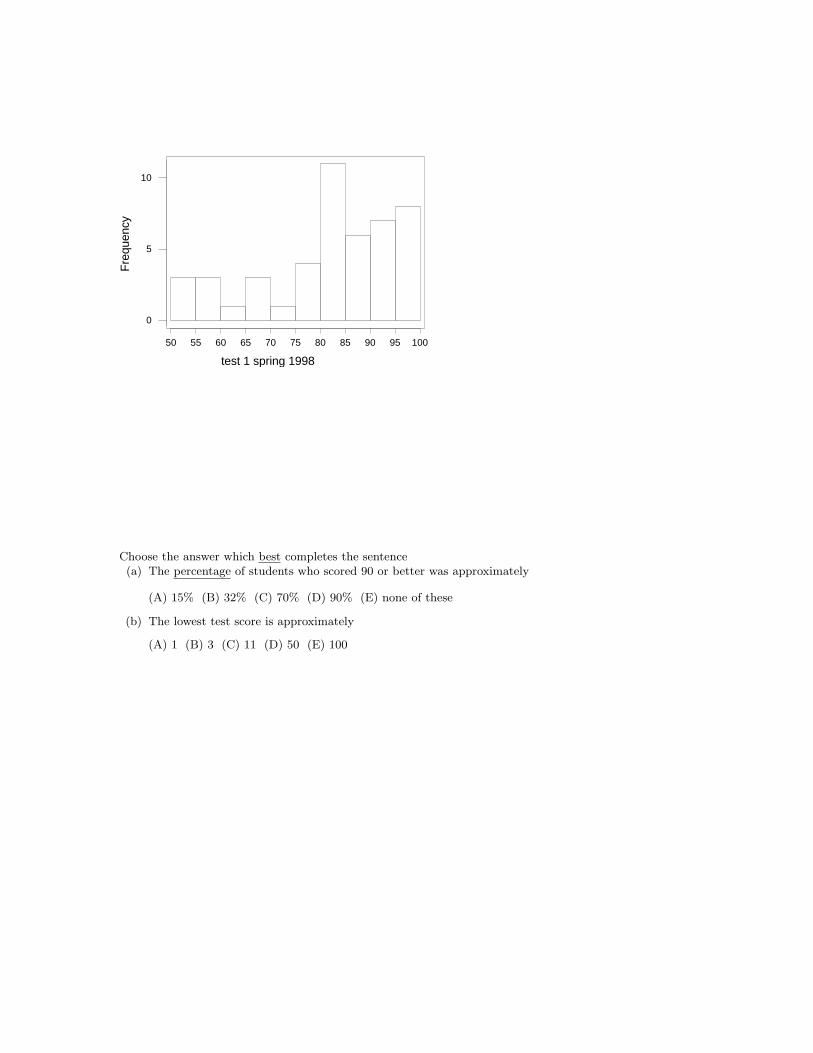
1. (5 points) The following histogram was created from the scores from 47 students on the first test in Math 355during the spring of 1998.
10095908580757065605550
10
5
0
test 1 spring 1998
Fre
quen
cy
Choose the answer which best completes the sentence(a) The percentage of students who scored 90 or better was approximately
(A) 15% (B) 32% (C) 70% (D) 90% (E) none of these
(b) The lowest test score is approximately
(A) 1 (B) 3 (C) 11 (D) 50 (E) 100
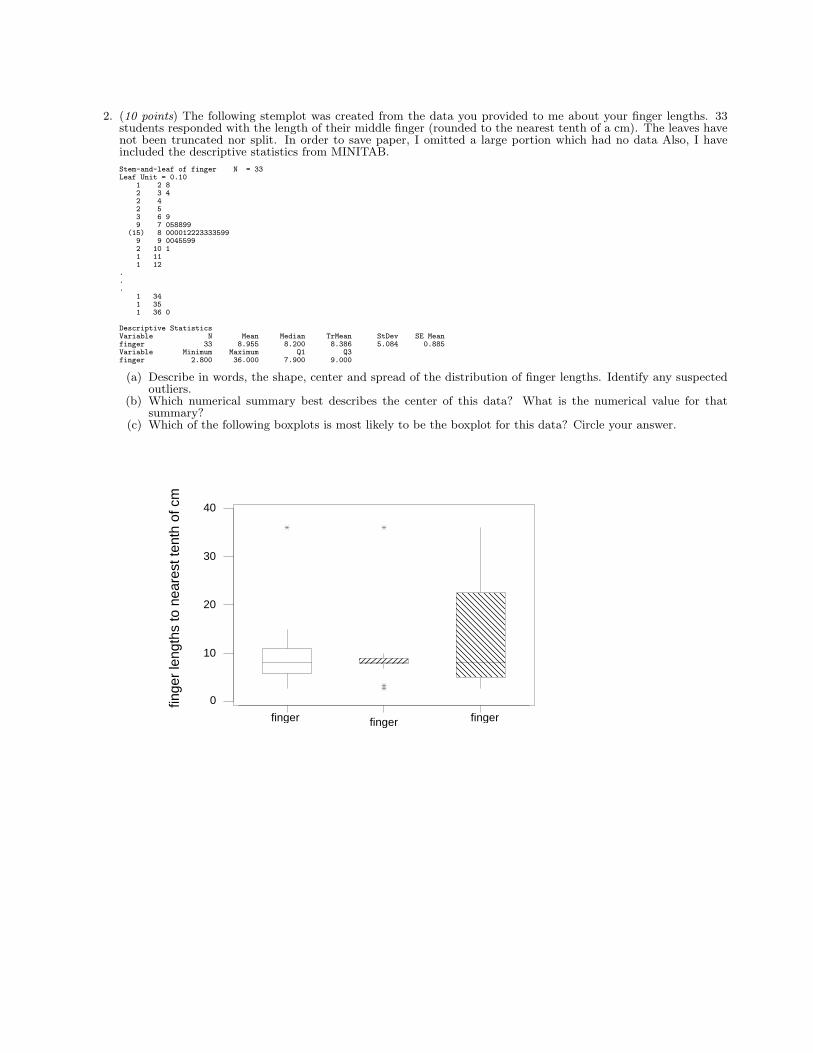
2. (10 points) The following stemplot was created from the data you provided to me about your finger lengths. 33students responded with the length of their middle finger (rounded to the nearest tenth of a cm). The leaves havenot been truncated nor split. In order to save paper, I omitted a large portion which had no data Also, I haveincluded the descriptive statistics from MINITAB.
Stem-and-leaf of finger N = 33Leaf Unit = 0.10
1 2 82 3 42 42 53 6 99 7 058899
(15) 8 0000122233335999 9 00455992 10 11 111 12
.
.
.1 341 351 36 0
Descriptive StatisticsVariable N Mean Median TrMean StDev SE Meanfinger 33 8.955 8.200 8.386 5.084 0.885Variable Minimum Maximum Q1 Q3finger 2.800 36.000 7.900 9.000
(a) Describe in words, the shape, center and spread of the distribution of finger lengths. Identify any suspectedoutliers.
(b) Which numerical summary best describes the center of this data? What is the numerical value for thatsummary?
(c) Which of the following boxplots is most likely to be the boxplot for this data? Circle your answer.
fingerfingerfinger
40
30
20
10
0finge
r le
ngth
s to
nea
rest
tent
h of
cm
Math 355 - Fall 1999 - Quiz #2 - 10-8-1999Show ALL your work. Incorrect Solutions with no work will receive NO credit. Neatness counts!
1. (8 points) The following table describes the age and marital status of American women in 1995. The table entriesare in thousands of women.
Marital StatusAges (years) Never Married Married Widowed Divorced Total
18-24 9289 3046 19 260 1261325-39 6948 21437 206 3408 3200040-64 2307 26679 2219 5508 36713≥ 65 768 7767 8636 1091 18264Total 19312 58931 11080 10266 99588
(a) Give the marginal distribution for the marital status for all women (use percents).(b) Give the conditional distribution for the marital status for women aged 18-24 (use percents).
2. (7 points) An article from the October 6, 1999 issue of the Stevens Point Journal is shown below. Answer thefollowing questions in complete sentences.article omitted
(a) Does this article describe an observational study or an experiment? Explain your answer.(b) Clearly, this data collection would be better with more patients. Give one additional way in which you could
improve the design of the data collection described.
Math 355 - Fall 1999 - Quiz #3 - 11-5-1999Show ALL your work. Incorrect Solutions with no work will receive NO credit. Neatness counts!
1. (6 points) In each of the following cases, decide whether or not the Binomial Setting is an appropriate model forX. If it is appropriate, give n and p, and if it is not appropriate, explain why not.
(a) A study of traffic flow has a person stationed at a particular intersection. X is the number of vehicles whichtravel through the intersection during the next 45 minutes.
(b) A study of traffic flow has a person stationed at a particular intersection. During the next 45 minutes, thisperson counts the total number of vehicles which travel through the intersection and also records how manyare trucks and how many are cars. X is the number of cars.
(c) The pool of potential jurors for a murder case contains 100 persons chosen at random from the adult residentsof a large city. Each person in the pool is asked whether he or she opposes the death penalty; X is the numberwho say “No.”
2. (9 points) The scores on SSHA (Survey of Study Habits and Attitudes) have a normal distribution with meanµ = 120 and a standard deviation of σ = 15.
(a) What is the probability that a single randomly chosen student will score 125 or higher?(b) Now take a SRS of 50 students
i. What are the mean and standard deviation of the sample mean score x of these 50 students?ii. What is the probability that the mean score x of these students will be 125 or higher?
Math 355 - Fall 1999 - Quiz #4 - 12-3-1999Show ALL your work. Incorrect Solutions with no work will receive NO credit. Neatness counts!
1. (15 points) In a packing plant, a machine packs cartons with jars. A salesperson claims that the machine she isselling will pack faster. To test that claim, the times it takes each machine to pack 10 cartons are recorded. Theresults in seconds are summarized in the following table.
New Machine Old MachineSample size 11 10Sample mean 43.291 44.23Sample standard deviation .817 .750
Do the data provide sufficient evidence to conclued that, on average, the new machine packs faster? You shouldassume that the population standard deviations are equal and that both the samples are a SRS from a normalpopulation. Perform a hypothesis test at the .01 significance level.You may use the MINITAB output on the back. Much of the output is not relevant, it is up to you to determinewhich values are appropriate. If you do use the MINITAB output circle the appropriate output.
(a) State the Null and Alternative Hypotheses(b) Calculate the value of the appropriate t statistic.(c) Calculate the P-value.(d) Using your answer to part (b), will you reject H0 or accept H0? (Be consistent with your answer to part (b).)(e) State your conclusion in words related to the two machines. Your answer should be in complete sentences
with no µ, H0, etc.
Assume Equal Variance box is checkedand the alternative is Less ThanTwo Sample T-Test and Confidence Interval
Two sample T for new vs old
N Mean StDev SE Mean
new 11 43.291 0.817 0.25
old 10 44.230 0.750 0.24
95% CI for mu new - mu old: ( -1.66, -0.22)
T-Test mu new = mu old (vs <): T= -2.74 P=0.0066 DF= 19
Both use Pooled StDev = 0.786
Assume Equal Variance box is not checkedand the alternative is Less ThanTwo Sample T-Test and Confidence Interval
Two sample T for new vs old
N Mean StDev SE Mean
new 11 43.291 0.817 0.25
old 10 44.230 0.750 0.24
95% CI for mu new - mu old: ( -1.66, -0.22)
T-Test mu new = mu old (vs <): T= -2.75 P=0.0066 DF= 18
Assume Equal Variance box is checkedand the alternative is Greater ThanTwo Sample T-Test and Confidence Interval
Two sample T for new vs old
N Mean StDev SE Mean
new 11 43.291 0.817 0.25
old 10 44.230 0.750 0.24
95% CI for mu new - mu old: ( -1.66, -0.22)
T-Test mu new = mu old (vs >): T= -2.74 P=0.99 DF= 19
Both use Pooled StDev = 0.786
Assume Equal Variance box is not checkedand the alternative is Greater ThanTwo Sample T-Test and Confidence Interval
Two sample T for new vs old
N Mean StDev SE Mean
new 11 43.291 0.817 0.25
old 10 44.230 0.750 0.24
95% CI for mu new - mu old: ( -1.66, -0.22)
T-Test mu new = mu old (vs >): T= -2.75 P=0.99 DF= 18
Math 355 - Fall 1999 - Quiz #5 - 12-10-1999Show ALL your work. Incorrect Solutions with no work will receive NO credit. Neatness counts!
1. (15 points - 10 points for (a)-(e), 5 points for (f))In 1997 the 27.5% of all UWSP students were freshmen (note: this 27.5% is a fact, and is not based on a sample).In 1998, my students did a survey and found that 113 out of 476 surveyed were freshmen. Assume our surveywas a random sample of all students in the fall of 1998. Is there evidence that the proportion of students who arefreshman has changed since 1997? Use a hypothesis test with α = .05 to answer the question
(a) State the Null and Alternative Hypotheses(b) Calculate the value of the appropriate statistic.(c) Calculate the P-value.(d) Using your answers to parts (b) and (c), will you reject H0 or accept H0? (Be consistent with your answers
to parst (b) and (c).)(e) State your conclusion in words related to the proportion of students who are freshman. Your answer should
be in complete sentences.(f) Calculate a 99% confidence interval for the proportion of students who are freshman.
Selected Answers Caveat: I have not double checked these answers, please let me know if you find any mistakes.
Test 1
1. (c)
2. (c)
3. (c)
4. (a) 5.875 (b) 6 (c) 3.980
5. (a).1446 (b) .6818 (c) longer than 274.3 days
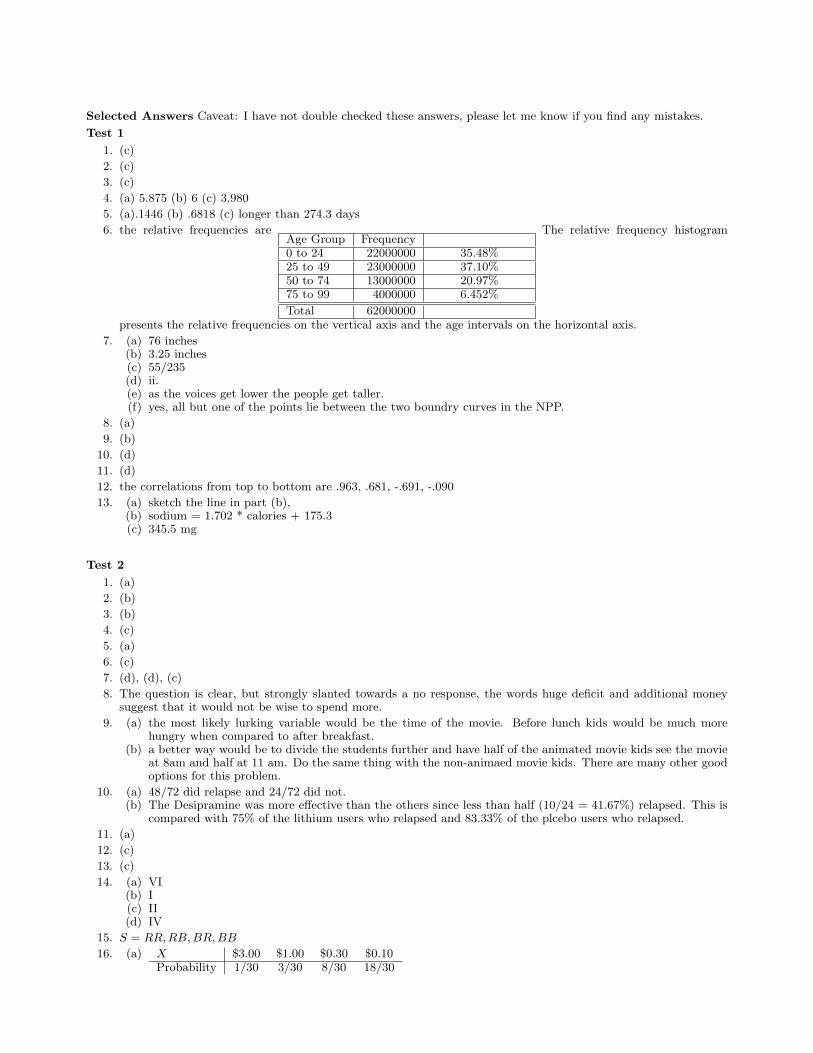
6. the relative frequencies areAge Group Frequency0 to 24 22000000 35.48%25 to 49 23000000 37.10%50 to 74 13000000 20.97%75 to 99 4000000 6.452%
Total 62000000
The relative frequency histogram
presents the relative frequencies on the vertical axis and the age intervals on the horizontal axis.
7. (a) 76 inches(b) 3.25 inches(c) 55/235(d) ii.(e) as the voices get lower the people get taller.(f) yes, all but one of the points lie between the two boundry curves in the NPP.
8. (a)
9. (b)
10. (d)
11. (d)
12. the correlations from top to bottom are .963, .681, -.691, -.090
13. (a) sketch the line in part (b),(b) sodium = 1.702 * calories + 175.3(c) 345.5 mg
Test 2
1. (a)
2. (b)
3. (b)
4. (c)
5. (a)
6. (c)
7. (d), (d), (c)
8. The question is clear, but strongly slanted towards a no response, the words huge deficit and additional moneysuggest that it would not be wise to spend more.
9. (a) the most likely lurking variable would be the time of the movie. Before lunch kids would be much morehungry when compared to after breakfast.
(b) a better way would be to divide the students further and have half of the animated movie kids see the movieat 8am and half at 11 am. Do the same thing with the non-animaed movie kids. There are many other goodoptions for this problem.
10. (a) 48/72 did relapse and 24/72 did not.(b) The Desipramine was more effective than the others since less than half (10/24 = 41.67%) relapsed. This is
compared with 75% of the lithium users who relapsed and 83.33% of the plcebo users who relapsed.
11. (a)
12. (c)
13. (c)
14. (a) VI(b) I(c) II(d) IV
15. S = RR,RB,BR,BB
16. (a) X $3.00 $1.00 $0.30 $0.10Probability 1/30 3/30 8/30 18/30
(b) $.34(c) $.66
17. .9628 ≈ .3189
Test 3
1. (e)
2. (d)
3. (a)
4. (a) µp̂ = .4, σ/hatp = .01265(b) .0571
5. (a) µx = 14, σx = .4472(b) 0(c) Because the distribution of the weights of oranges was normal (given in the problem).
6. (b)
7. (c)
8. (d)
9. (a)
10. (b)
11. (c)
12. True, True, True
13. (a) 98.50 to 109.8(b) 5.638(c) 19
14. (a) 68.54 to 70.27(b) Not appropriate unless you delete the outlier.
15. (a) .8104(b) do not reject H0
(c) The data do not provide enough evidence to indicate that the mean SSHA score for freshman is differentfrom 115.
16. (a) Not necessarily, since we are doing 300 tests and the error rate is 1/100, we would expect about 3 errors.These two people may be the 1/100
(b) We should retest the two subjects that did significantly better than random guessing. This time there willbe only 2 tests instead of 300.
Quiz 1
1. (a) B(b) D
2. (a) The distribution is fairly symmetric except for three possible outliers at 2.8 cm, 3.4 cm and 36.0 cm. Themiddle is about 8.0 cm with a standard deviation of 1 cm or so (ignoring the outliers).
(b) Because of the outliers, the median would be the best description of center. M = 8.2(c) the middle boxplot.
Quiz 2
1.Marital Status
Never Married Married Widowed Divorced19.39% 59.17% 11.13% 10.31%
2.Marital Status for 18-24 year olds
Never Married Married Widowed Divorced73.65% 24.15% .1507% 2.061%
3. I don’t have the article anymore, so I don’t know the answers.
Quiz 3
1. (a) Not Binomial Setting, no fixed number of trials nor an idea of what a success is.(b) Not Binomial Setting, no fixed number of trials.(c) Yes, Binomial Setting, n = 100, p = the true proportion of all people who will say “No”
2. (a) .3707(b) µx = 120, σx ≈ 2.121, probability is .0091
Quiz 4
1. Use the MINITAB output in the upper left.
(a) H0 : µnew = µold, Ha : µnew < µold
(b) t = −2.74(c) P-value = .0066(d) Reject H0
(e) Data indicate that the new machine packs faster than the old machine.
Quiz 5
1. (a) H0 : p = .275, Ha : p 6= .275(b) z = −1.837(c) P-value = .0658(d) Accept H0
(e) Data do not provide evidence that the proportion of students who are freshman has changed since 1997.(f) Using the Wilson estimates: .1894 to .2897