Embed Size (px)
Citation preview

Testing the Case for Contextualisation within the Framework for Excellence
August 2008 Of interest to everyone in the learning and skills sector
Testing the Case for Contextualisation within the Framework for Excellence Contents
Foreword
Executive Summary
Section 1: Introduction
Section 2: Methodology
Section 3: Initial Analysis Responsiveness Dimension
3.1 Learner Views
3.16 Learner Destinations
3.21 Employer Satisfaction
Section 4: Initial Analysis Effectiveness Dimension
4.1 Quality of Outcomes
4.9 Quality of Provision
Section 5: Initial Analysis Finance Dimension
5.1 Financial Health
5.6 Financial Management and Control
5.11 Use of Resources
Section 6: Second-level Testing (Pilot Measure Scores)
Section 7: Third-level Testing (Version 1 Forward Projections)
Section 8: Conclusions and Recommendations

Page 1 of 30
Foreword
I am very pleased to introduce this report on contextual variables and the Framework for Excellence.
To provide a fair and equitable means of measuring performance, the Framework needs to take account of variables which are outside the scope of a college’s or a provider’s control, but which impact on its performance.
Following extensive consultation, the Framework already takes account of some contextual variables, for example in the benchmarks for qualification success rates. We commissioned this independent report from the research consultancy, RCU Limited, to test an extensive set of further variables.
While making a number of recommendations for us to consider, the report concludes that on the basis of current data, the Framework takes sufficient account of variables such as gender, age, ethnicity, deprivation, local context, and range and mix of provision.
When the first full set of data is available in spring 2009, we will commission a further study, respond to findings and publish the results.
In the meantime, we can launch the Framework, confident that it provides a ‘level playing field’ for the FE system.
Verity Bullough
National Director of Funding, Planning and Performance
Page 2 of 30
Executive Summary
• This research was commissioned by the Learning and Skills Council (LSC) and undertaken by RCU Limited. It also forms part of the evidence base for a Single Equality Impact Assessment of the Framework for Excellence (the Framework), also commissioned by the LSC.
• The aim of the research was to test the case for contextualisation in the Framework, a term that refers to adjustments made to correct for the impact of the operating context of a provider or a class of providers. Any such adjustment would have to be based on evidence that providers would otherwise suffer significant and predictable advantage or disadvantage.
• The research was based on the Framework for Excellence pilot, which offered an opportunity to explore the case for contextualisation by analysing the extent to which contextual variables correlated in a positive or negative manner with the grades resulting from the pilot assessment criteria. The methodology included use of multivariate analysis, to identify potential contextual factors, and correlation analysis to test the extent to which Framework measures might require contextualisation.
• More than a dozen potential contextual factors were identified by applying multi-level modelling to learner data sets and correlation analysis was then used to identify the strength of relationship between these factors and the grades and scores gained by providers in the Framework for Excellence pilot.
• The Learner Views score had already been partly contextualised in the pilot. An adjustment was made to correct for the impact of level of study, based on robust evidence from successive waves of the National Learner Satisfaction Survey showing a stable inverse relationship between level of study and satisfaction. No correlations were found during the research that indicated the need for further contextualisation of the Learner Views indicator.
• Analysis of the Learner Destinations indicator raised concerns over a relatively strong correlation between the performance indicator grade and the proportion of adult learners and part-time learners at a provider.
• Analysis of the Employer Satisfaction indicator generally showed weak correlations with external contextual factors, although there was some evidence of a link to factors influenced by the tightness of local labour markets. This would be hard to contextualise due to the fluidity of such factors.
• Correlations within the Effectiveness Dimension were generally weaker than in the Responsiveness Dimension. However, significant evidence was found of a negative correlation between Qualification Success Rates (QSRs) and adult part-time learning, and there was also evidence that QSRs are lower in areas of social disadvantage.
• The Quality of Provision key performance area grade is based on Ofsted Overall Effectiveness grades and already reflects the use of contextual factors to inform Inspectors’ judgements. Correlations for the Framework grades aginst external factors were relatively weak.

Page 3 of 30
• The Financial Health key performance area produced relatively weak correlations and there would be little justification for the inclusion of contextual factors other than the consideration that is already given to differing financial regulations for different types of provider.
• The Financial Control key performance area produced stronger correlations, backed by high levels of statistical confidence. At this stage, the effects are not strong enough to warrant contextualisation, but there is a need for the LSC to examine the reasons why providers in areas of relative disadvantage appear to score less well in this area.
• The Use of Resources key performance area produced relatively weak correlations, but there is a need for the LSC to examine why providers with high proportions of adult and/or part-time provision score less well in capital measures. There is also a need to re-examine the treatment of general FE providers in the Use of Resources efficiency measures.
• Analysis of the level of performance indicator scores indicated a need to examine the results achieved under the Framework by providers with a high concentration of learners taking AS qualifications. Where learners cash in their AS results at the end of Year 12, there are likely to be impacts across all three Dimensions from the Learner Destinations, Qualification Success Rates and Use of Resources measures.
• The report makes a number of recommendations based on these findings:
o there is no compelling case for any further contextualisation at this stage
o the contextualisation of Learner Views by level of study used in the calculation of pilot scores should be carried forward as a methodology into Version 1
o the large and significant correlation between Learner Destinations and age and mode of study should be tackled by a review of the criteria for a successful outcome, and/or the definition of in-scope learners (for example, through the introduction of a minimum qualifying number of guided learning hours), not by contextualisation
o the correlation between Qualification Success Rates and learners’ age band and mode of study should be further examined
o the Learner Destinations Version 1 survey should include a test of learners’ perceptions of the success of their outcomes and should also test for a wider range of impacts of learning (for example increased confidence)
o the LSC should examine negative correlations between Financial Management and Control scores and relative social and economic disadvantage, and should explore a range of further correlations within the Use of resources measure
o the LSC needs to examine the negative correlation between Quality of Outcomes scores and the extent to which providers serve areas of relative disadvantage

Page 4 of 30
o there should be further testing of the influence of external factors on the outcomes of Version 1, and at the earliest possible stage of the introduction of any additional measures into the Framework.

Page 5 of 30
Section 1: Introduction
1.1 This research was commissioned by the LSC supporting the development of the Framework. It is intended to be a free-standing report, contributing to the LSC’s consideration of the case for including contextual factors in the design of the Framework, but also forms a key part of the evidence base for a Single Equality Impact Assessment of the introduction of the Framework, also commissioned by the LSC.
1.2 Contextual factors are geographical, social or structural factors wholly or substantially outside the control of a provider that could lead to a consistent and predictable distortion in the performance measures used in the Framework.
1.3 During 2007/08, an initial version of the Framework was piloted with 100 providers, resulting in scoring systems and assessment criteria being devised in each of the three dimensions of the Framework.1 The broad structure of the pilot Framework is set out below:
1 For more explanation of structural elements of the Framework, please refer to the website: http://ffe.lsc.gov.uk.
Framework for Excellence Structure during the pilot
Effectiveness Responsiveness Finance
Responsiveness to Employers
Responsiveness to Learners
Quality of Outcomes
Quality of Provision
Dimensions
Key Performance Areas
Use of Resources
Financial Management
& Control
Financial Health
Performance Indicators
Employer Satisfaction
Learner Views
Overall Effectiveness
Qualification Success
Rates
Audit Opinion (colleges)
Self-assessment
(others)
Financial Health Rating
Capital
Learner Destinations
Revenue (four
measures)

Page 6 of 30
1.4 Contextualisation refers to adjustments made to correct for the impact of the operating context of a provider or a class of providers, based on evidence that they would suffer significant and predictable advantage or disadvantage resulting from the design of a Framework for Excellence measure or performance indicator.
1.5 An advantage or disadvantage of this kind could derive from a number of circumstances, for example:
• legal constraints on the activities of providers covered by charity regulations or foundation covenants
• characteristics of core recruitment areas (for example, rurality or relative deprivation or industrial structure)
• mission-related concentration on particular segments of provision.
1.6 Contextualisation is different to exemption, although some of the background issues are the same. Exemptions to Performance Indicators may be considered within the Framework where the indicator is not applicable to a provider. Contextualisation may be considered where results can be generated for a provider, but these are skewed in a predictable and measurable way by contextual factors.
1.7 Most measures and performance indicators in the pilot version of the Framework took no account of the impact that a provider’s operating context, or the mix of their learners, might have on the resultant assessments. This reflected a principle within the Framework that scoring systems and assessment criteria should be designed where possible in such a way that they are not subject to context.
1.8 However, it was recognised that contextual factors already have some impact upon performance indicators used in the Framework. For example, Ofsted’s overall effectiveness grade, used as the measure of the Quality of Provision, is subject to professional judgements in the course of inspection and qualifications are divided into categories as part of the Qualification Success Rate calculations.
1.9 In the Learner Responsiveness key performance area, considerations of level were built into the scoring system for the Learner Views survey, based on response patterns from the National Learner Satisfaction Survey.
1.10 The LSC made clear in its research specification that it would expect any proposed context variable to be:
• measurable
• outside the control of the provider
• supported by significant impact data from the pilot.
1.11 The aim of the research was, therefore, to prepare a report on the case for any further contextualisation in the current performance indicators, and to measure the impact that the absence of contextual variables has had upon particular provider groups and learner groups. The research question was designed to test a null hypothesis; namely that there is no significant correlation between any potential context variable and the Framework’s performance indicators.

Page 7 of 30
Section 2: Methodology
2.1 The pilot offered an opportunity to explore the case for contextualisation by analysing the extent to which contextual variables correlated in a positive or negative manner with the grades resulting from the pilot assessment criteria. The analysis was carried out on grades initially, with potentially significant results being further tested to see if the correlation held for individual scores. Research began in April 2007, once the overall performance rating (OPR), dimension grades and performance indicator scores became available.
2.2 The research made extensive use of multi-level modelling techniques to identify factors and combinations of factors that gave the most robust prediction of a provider’s grades. The modelling work was carried out in SPSS,2 which was used for initial correlation work, and MLwiN,3 which is a specialist multi-level modelling package created by the Centre for Multi-level Modelling at the University of Bristol. The term multi-level refers to the investigation of a nested membership relation among units in a system. Single-level techniques, such as multiple regression, do not always cope well with hierarchical structures where there is overlap between higher level groupings. For example, learners can belong to a course, which belongs to a department, which belongs to a provider, which belongs to a provider type. However, they are also members of cross-cutting groups, such as socio-demographic groupings, regions, areas of learning, ethnic groupings and so on. Using multi-variate analysis of variance, multi-level modelling can produce odds ratios that show the impact different combinations of factors have upon determining a given outcome.
2.3 The research tested the impact the scoring mechanisms and assessment criteria from the Framework for Excellence pilot had by categorising the pilot providers according to a number of potential contextual factors, including:
• provider type • regional economic health (Gross Domestic Product/Gross Value Added) • gender • ethnicity (proportion of learners in minority ethnic or White Other categories) • relative deprivation (Indices of Multiple Deprivation 2007) • provider size (Standard Learner Numbers or equivalent) • rurality (using relative density/sparsity categories developed by RCU Limited in a
previous project for the LSC) • age structure (proportion aged 19-plus) • mix of levels of provision (proportion of learners with a highest aim below Level 2) • mix of modes of study (proportion in full-time provision) • degree of specialism (concentration of total SLN in top three areas of learning Tier
2)4 • inclusivity (proportion of learners with a learning difficulty and/or disability) • a proxy input factor (average GCSE points score in home5 Local Authority district).
2 Statistical Package for Social Sciences. 3 For more information, please refer to http://www.cmm.bristol.ac.uk/MLwiN/index.shtml. 4 Excluding Area of Learning 14 to avoid distortion by key skills. 5 Local Authority district with highest volume of guided learning hours.
Page 8 of 30
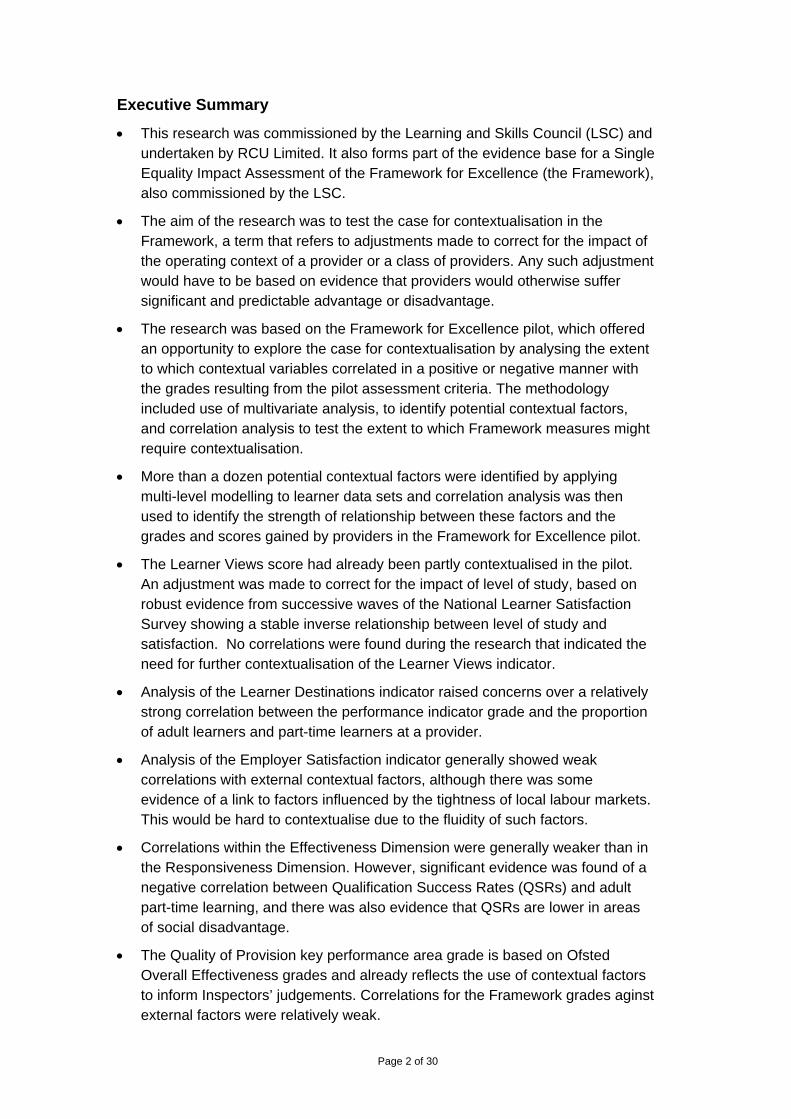
2.4 Although MLwiN proved very useful in identifying priority areas for further correlation analysis, the limited number of providers involved in the pilot meant that few multi-level tests produced robust outcomes. The examples below illustrate the issue; the charts look at how the likelihood of gaining a grade of Outstanding or Good differs, other things being equal, according to a contextual factor. The first category is always used as a baseline and the bars then show variation from its likelihood odds. The blue bars show the degree of variation and the black line shows the confidence interval. Where this is broad we have reason to doubt the finding, and where the confidence interval spans odds of 1:1 we need to accept that there is a chance of there being no relationship.
2.5 This chart looks at the likelihood of a provider gaining a high grade in Learner Destinations, depending on its proportion of full-time learners. Providers with a full-time proportion outside the upper quartile are less likely to have been awarded a Grade 1 (this issue is picked up later in the report in Section 3), but confidence intervals are wide.
2.6 The second chart looks at the impact relative deprivation has on the likelihood of achieving a grade of Outstanding or Good for Quality of Outcomes in the pilot. The results are interesting, with a steady increase in the likelihood as the percentage of learners from areas of deprivation falls, but the confidence intervals are extremely wide, and in two cases span an odds ration of 1:1. Once again, the issue is picked up later in the report (Section 4).
Likelihood of Grade 1 or 2 for Learner Destinations by Percentage of Full-time Learners
Above Upper QuartileUpper Quartile to
MedianMedian to Low er
Quartile Below Low er Quartile
0
0.2
0.4
0.6
0.8
1
1.2
1.4
1.6
1.8
2
Likelihood of Grade 1 or 2 for Quality of Outcomes (QSRs) by Percentage of Learners from Deprived Areas
Below Low er QuartileMedian to Low er
QuartileUpper Quartile to
MedianAbove Upper Quartile
0
1
2
3
4
5
6
7
8
9
10

Page 9 of 30
2.7 This chart shows a test from the Finance Dimension. The chart looks at the likelihood of achieving a grade of Outstanding or Good for the Capital Use of Resources indicator depending on the percentage of a provider’s learners with a highest aim below Level 2. Once again the pattern is interesting (and is picked up in Section 5) but the wide confidence intervals mean we cannot rely on the result.
2.8 As a result of these difficulties, the main form of analysis used in this report is correlation between each of the factors listed on page 4 and the grades/scores providers gained in each performance indicator. The null hypothesis was rejected (that is, a case for contextualisation established) if a factor proved to have a high and statistically robust correlation with a performance indicator. Where few factors proved to have such a correlation, or where the variance was found to be relatively low, this increased the likelihood that measured differences in performance were genuinely reflecting factors within the provider’s control.
2.9 The table below summarises the contextual factors tested for during the research and provides an explanation of their purpose and format. The choice of contextual factors was based on multi-level modelling from a longer list of potential factors derived from either learner data sets or external data. The factors tested had the strongest link to Learner Views scores and success rates at a learner level.
Liklihood of Grade 1 or 2 for Finance (Capital) by Percentage of Learners below Level 2
Below Low er QuartileMedian to Low er Quartile
Upper Quartile to MedianAbove Upper Quartile
0
1
2
3
4
5
6
7
8
9
10
Region Gross Value Added Proxy for local economic conditions% female learners Equality and diversity check% of learners with ethnicity other than white Equality and diversity check% of white other learners Proxy for the influence of recent EU migration% learners aged 19+ Equality and diversity/provider type checkIndex of Multiple Deprivation (IMD) Score Proxy for socio-demographic circumstancesIMD Education Domain Specific measure of educational achievement% of learners from densely populated areas Impact of relative population/industry concentration% of learners from sparsely populated areas Impact of relative population/industry concentration% learners with a highest aim below Level 2 Provider type/specialism check% full-time learners Provider type/specialism checkOverall volume of learning (Standard Learner Number) Impact of economies of scaleDegree of specialisation % of provision in highest 3 Sector Subject Areas (Tier 2)% of learners with a learning difficulty and/or disability Equality and diversity checkAverage GCSE points score in home area Proxy for prior attainment
Explanation and Purpose of Contextual Factors

Page 10 of 30
2.10 In preparation for the correlation analysis, it was necessary to standardise the data on the potential contextual factors. This required categorical data and was achieved by organising the information into quartiles and identifying the quartile into which each provider fell for each factor. The analysis then explored the correlation between each provider’s quartile profile and their Framework grades.
2.11 The research began with discussions with the Framework’s Key Performance Area leads to confirm the process by which each measure and its scoring mechanisms had developed. These discussions included consideration of any elements of contextualisation that had been built into the scoring systems or assessment criteria.
2.12 This was followed by a period of multi-level modelling and correlation analysis, and the results were then fed back to Dimension and Key Performance Area leads. The emerging results of the research were also shared with a number of stakeholder bodies, including DIUS, Ofsted, the Single Voice, and the QIA.

Page 11 of 30
Section 3: Initial Analysis Responsiveness Dimension
Learner Views
3.1 Initial analysis was conducted on the correlation between performance indicator grades and external contextual factors.
3.2 The Learner Views performance indicator was measured in the pilot using the results of a survey of the views of learners in priority provision.6 The resultant measure was a single points score based on a composite score derived from four possible combinations of response method (paper and online) and questionnaire type (variation in response scales). The higher the points score, the greater the proportion of learners selecting the most positive response available to them. Statistical adjustments were made to ensure that any provider’s score was unaffected by the combination of approaches they had used.7
3.3 Prior to calculating the final score for Learner Views, the LSC opted to make an adjustment to each provider’s score based on the pattern of highest level of learning aim among its learners. The justification for this was derived from successive waves of the National Learner Satisfaction Survey (NLSS), which have shown a consistent inverse relationship between learner satisfaction and level of study; the higher the level of study the lower the measured satisfaction level in the NLSS. There are a number of possible explanations for this, including the expectation that learners on lower level courses (whatever their age) are more likely to have negative previous experiences of learning than learners on higher level provision.
3.4 The approach taken in the pilot was to calculate the degree of sensitivity of learner satisfaction to level of study from the NLSS data set, and to use this to calculate a provider adjustment factor, based on the mix of learners at a particular provider. This contextualisation adjustment was approved by the LSC and its Framework partners on the grounds that it was based on a robust historical evidence base.
3.5 In the analysis that follows, the Learner Views grades for 85 providers are correlated against the contextual factors to identify evidence of a statistical link. The figures in the table use the Pearson product-moment correlation coefficient to measure the relationships between performance indicator grade and potential contextual factors. The measure is designed for use with ordinal data and assumes equal distance between each grade within the Framework scale. By convention, correlation scores above 0.5 are considered large and those above 0.3 are considered medium.
3.6 The second column in the table shows the significance level. The smaller the significance score, then the higher the confidence level in the observed correlation. Each significance score is associated with the correlation figure above it. Significance scores are highlighted if they represent confidence levels of 95 per cent or above (pink in the table), or between 90 and 95 per cent (fawn in the table).
6 All 16-18s learners, all work-based learning, all 19-plus on provision contributing to a full Level 2 or full Level 3, all learners on target-bearing Skills for Life provision and all learners with learning difficulties and/or disabilities (subject to provider discretion on the appropriateness for individual learners). 7 This was based on measuring a provider’s score for any particular response method/questionnaire type combination and comparing that to the survey mean for that combination.

Page 12 of 30
3.7 All of the correlations that emerged from the analysis of Learner Views scores are small in size, indicating considerable variation in the relationship. There is a high confidence level in the correlation between Learner Views and regional Gross Value Added, although the strength of the correlation is small. The relationship is a negative one, indicating higher satisfaction in regions with relatively low economic performance.8
3.8 Two other factors also have small negative correlations: the proportion of minority ethnic learners and the proportion of learners with an ethnic category of White Other (often an indication of Eastern European origin), but the confidence level is lower in both cases.
3.9 At this stage, none of the figures in the table indicate a strong or sufficiently robust correlation to warrant consideration of additional contextual factors. However, the results were judged sufficient to progress to correlation at the level of scores and this is reported later in this document.
3.10 Interestingly, the factor of level of study has a low and non-significant correlation with the Learner Views grade. This indicates that the adjustment for the influence of level of study had been effective in removing the effect.
8 This relationship has also been observed in the NLSS data set.
Base number 85 pilot providers Pearson Correlation
Significance (2-tailed)
Region Gross Value Added -0.264 0.015% female learners 0.014 0.901% of learners with ethnicity other than white -0.181 0.097% of white other learners -0.180 0.098% learners aged 19+ -0.031 0.777Index of Multiple Deprivation (IMD) Score -0.111 0.312IMD Education Domain -0.029 0.792% of learners from densely populated areas -0.153 0.162% of learners from sparsely populated areas 0.062 0.571% learners with a highest aim below Level 2 -0.091 0.407% full-time learners 0.184 0.092Overall volume of learning (SLN) -0.134 0.221Degree of specialisation 0.008 0.942% of learners with a learning difficulty and/or disability 0.032 0.769Average GCSE points score in home area 0.031 0.783
>95% confidence>90% confidence
Learner Views

Page 13 of 30
Learner Destinations
3.11 The Learner Destinations performance indicator was measured in the pilot using a combination of:
• learners tracked into a positive continuation in learning using matching within national data sets
• the responses given by learners in an independent central telephone interview
• top-up information on learners progressing to HE supplied by providers as a voluntary data set.
3.12 The measure applied to all learners completing at least one priority learning aim in 2005/06 (see previous section) who were not recorded on the 2005/06 end-year learner record as continuing any aims into the following year. Broadly speaking, a positive learner destination indicated that the learner remained in learning at an equal or higher level, entered employment at a level appropriate to their level of study, or remained in employment with enhanced status or prospects. The Framework’s Learner Destinations score was the number of positive destinations expressed as a percentage of the total number of identified destinations minus those classed as neutral.9
3.13 The table below shows the results of the correlation between Learner Destinations grades and potential contextual factors for 64 providers from the pilot. The remaining providers did not have a grade either because they do not submit an ILR or because their number of tracked learners was below the level considered valid for statistical purposes.
Base number 64 pilot providers Pearson Correlation
Significance (2-tailed)
Region Gross Value Added -0.139 0.272% female learners 0.090 0.481% of learners with ethnicity other than white 0.231 0.066% of white other learners -0.155 0.221% learners aged 19+ -0.502 0.000Index of Multiple Deprivation (IMD) Score 0.178 0.159IMD Education Domain 0.072 0.573% of learners from densely populated areas 0.068 0.591% of learners from sparsely populated areas -0.194 0.125% learners with a highest aim below Level 2 -0.245 0.051% full-time learners 0.430 0.000Overall volume of learning (SLN) 0.074 0.559Degree of specialisation -0.216 0.087% of learners with a learning difficulty and/or disability -0.197 0.398Average GCSE points score in home area -0.054 0.673
>95% confidence>90% confidence
Learner Destinations
9 Some activities such as ill-health or certain caring responsibilities were classed as neutral for the purposes of the measure and counted neither for nor against the provider.

Page 14 of 30
3.14 There were small correlations between Learner Destinations grades and three factors, namely the proportion of minority ethnic learners (positive), the proportion of a provider’s provision below Level 2 (negative) and the degree to which the provider operated a specialised curriculum (negative). However, in each case the small correlation was combined with a confidence level below 95 per cent. The impact of level of study partly arises from the very high progression rates from AS to A-level.
3.15 Levels of confidence above 99 per cent applied to two factors: the proportion of learners aged 19-plus (negative), and the proportion of full-time learners (positive). In both cases the correlation was around the 0.5 level at which the correlation becomes strong. These results indicate a potential issue with the Learner Destinations grades in respect of providers that largely deliver adult and/or part-time provision. As a result, the Learner Destinations data was also judged to require scrutiny at the level of scores.
Employer Satisfaction
3.16 The Employer Satisfaction performance indicator was measured in the pilot using a score out of 10 derived from a composite of ratings given by employers in a survey. The survey methodology varied, with the pilot testing the effectiveness of a number of different approaches, including provider-led postal and telephone surveys, employer self-completion online or on paper, and interviews by a central research organisation.
3.17 The measure related to providers who had engaged in a commercial relationship with employers and who were able to provide contact details to support a survey. Responses were merged into a common ten-point scale and aggregate without weightings (that is, no account was taken of the volume of training to which the ratings referred). The correlation results are shown below:
Base number 45 pilot providers Pearson Correlation
Significance (2-tailed)
Region Gross Value Added 0.037 0.812% female learners -0.047 0.758% of learners with ethnicity other than white -0.001 0.995% of white other learners -0.408 0.005% learners aged 19+ -0.087 0.569Index of Multiple Deprivation (IMD) Score 0.005 0.973IMD Education Domain 0.110 0.472% of learners from densely populated areas 0.085 0.580% of learners from sparsely populated areas -0.127 0.405% learners with a highest aim below Level 2 -0.252 0.095% full-time learners -0.057 0.709Overall volume of learning (SLN) -0.234 0.123Degree of specialisation -0.014 0.926% of learners with a learning difficulty and/or disability 0.001 0.995Average GCSE points score in home area -0.104 0.504
>95% confidence>90% confidence
Employer Satisfaction

Page 15 of 30
3.18 Forty-five of the pilot providers were given grades for the Employer Satisfaction performance indicator. The remainder either did not have commercial relationship with employers or were exempted through achieving the Training Quality Standard, or were unable to provide suitable contacts during the pilot.
3.19 Most of the correlation scores were low for this performance indicator, suggesting no clear relationship to external contextual factors. There was a small negative correlation to the proportion of provision below Level 2, but the confidence level was only just above 90 per cent. There was a much higher confidence level in the correlation (negative) with the proportion of learners with ethnicity of White Other. There is no obvious reason why Employer Satisfaction should be linked to the presence of this group of learners, although there may be a link to the tightness of local labour markets, for which the presence of recent migrants may be a proxy.
3.20 Given the indirect nature of this link and the weak correlations for other aspects, and the low number of providers to which the Employer Satisfaction grade applied, this performance indicator was not subject to further testing at the level of provider scores.
Page 16 of 30
Section 4: Initial Analysis Effectiveness Dimension
Quality of Outcomes
4.1 The Quality of Outcomes performance indicator in the pilot derived from four Qualification Success Rates (QSRs):
• FE long courses, excluding A-levels • FE short courses • A-levels • Apprenticeships and Advanced Apprenticeships (combined).10
4.2 The success rates for the four groups were calculated using the LSC / DIUS / Ofsted
QSR measures used in the annual FE learner outcomes statistical first release for FE colleges and work-based learning respectively. The A-level QSR was supplemented by the A-level value-added outcome from the LSC’s Learner Achievement Tracker.11
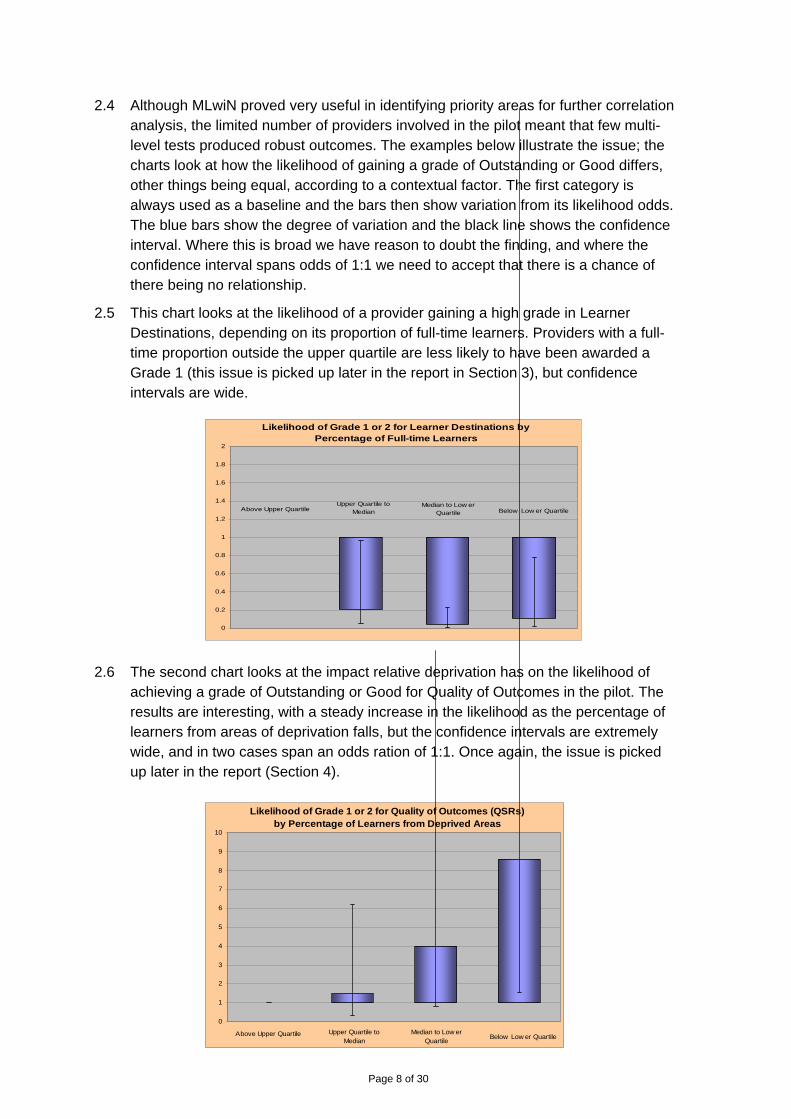
4.3 The table below shows the correlation12 results for 93 pilot providers.13
Base number 93 pilot providers Pearson Correlation
Significance (1-tailed)
Region Gross Value Added 0.100 0.173% female learners -0.036 0.367% of learners with ethnicity other than white 0.145 0.083% of white other learners -0.079 0.225% learners aged 19+ -0.174 0.048Index of Multiple Deprivation (IMD) Score -0.123 0.121IMD Education Domain -0.196 0.030% of learners from densely populated areas 0.105 0.158% of learners from sparsely populated areas -0.036 0.367% learners with a highest aim below Level 2 -0.108 0.152% full-time learners 0.162 0.060Overall volume of learning (SLN) -0.056 0.298Degree of specialisation -0.035 0.370% of learners with a learning difficulty and/or disability 0.050 0.316Average GCSE points score in home area -0.269 0.005
>95% confidence>90% confidence
Qualification Success Rates
4.4 The correlations for Quality of Outcomes are all relatively small, but the three with the highest correlation all display confidence levels above 95 per cent. These are average GCSE points scores in the provider home area (negative correlation), Indices of Multiple Deprivation Education Domain (negative) and the proportion of a provider’s learners who are aged over 19 (again negative). The first two point to potential distortions in the comparability of providers’ QSR scores due to the impact
10 In the pilot, Apprenticeship success rates were averaged across all Apprenticeships, despite the lower measured success rates on Advanced Apprenticeships. This appears anomalous with the Level of Study weightings applied in the Learner Views performance indicator. 11 This is not contextualised, but will reflect variations in GCSE input scores that could be correlated to external factors. 12 A 1-tailed t-test was used for significance testing where the distribution was skewed by the absence of low-performing providers. 13 Higher Education institutions, providers who do not submit an ILR, and providers exclusively delivering Entry to Employment provision are outside the QSR calculations.

Page 17 of 30
of prior educational achievement in the providers’ core areas.14 This supports the need to model the potential for building further value-added and/or distance-travelled measures into the Quality of Outcomes calculation, or changing the weighting of value-added scores for A-levels.
4.5 Although the overall correlation between level of study and QSR scores emerged as weak, the research identified historical evidence of a correlation between learning aim levels and success rates in the Apprenticeships. The LSC is aware of this issue and is seeking to address it in the Version 2 pilot.
4.6 The negative correlation to the proportion of learners aged 19 or over indicates that providers who specialise in meeting the needs of adult learners will, other things being equal, fare less well from a QSR measure than those who specialise in 16-18 year olds. This could be linked to curriculum differences and, in particular, to the impact that “cashed in” AS qualifications have on the QSRs of providers with a significant amount of 16-18 academic provision.
4.7 The correlation analysis found weaker links, with lower confidence levels, between Quality of Outcomes grades and the proportion of minority ethnic learners and the proportion of full-time learners attending a provider. The latter relationship may be influenced by the AS factor cited above.
4.8 The initial analysis gave sufficient indication of a possible correlation with contextual factors to trigger further analysis at the level of Performance Indicator scores.
Quality of Provision
4.9 The Quality of Provision performance indicator was based on Ofsted’s most recent judgement on the overall effectiveness of provider’s provision. It is acknowledged that Ofsted's most recent judgement may not reflect a provider’s current position and, in the light of the pilot, the LSC is working with Ofsted to explore options for using more recent evidence, such as information from monitoring visits and Ofsted’s consideration of a provider’s self-assessment.15
4.10 New colleges or providers that had not been inspected in the current or previous cycles are exempt from the Quality of Provision key performance area.
4.11 This performance area does include an element of contextualisation, since inspectors are expected to take into account the context in which a provider operates in arriving at their judgements. For example, paragraph 147 of the inspection handbook16 states:
Individual circumstances will be taken into account. Inspectors will not disadvantage a successful college because it is already successful. Likewise, the progress made by a college facing particularly challenging circumstances will be judged in the context in which it operates.
14 The interpretation of the significance of average GCSE points scores is difficult because it is based on the whole Year 11 cohort in an area, not just those who progress to further education and training. Some of the highest GCSE points scores are found in areas where further education and training has a relatively low market share and the published points score may be a poor proxy for the input scores of post-16 learners. 15 The pilot included some judgements based on 2003 inspections. 16 Handbook for Inspecting Colleges, Ofsted, April 2007.
Page 18 of 30
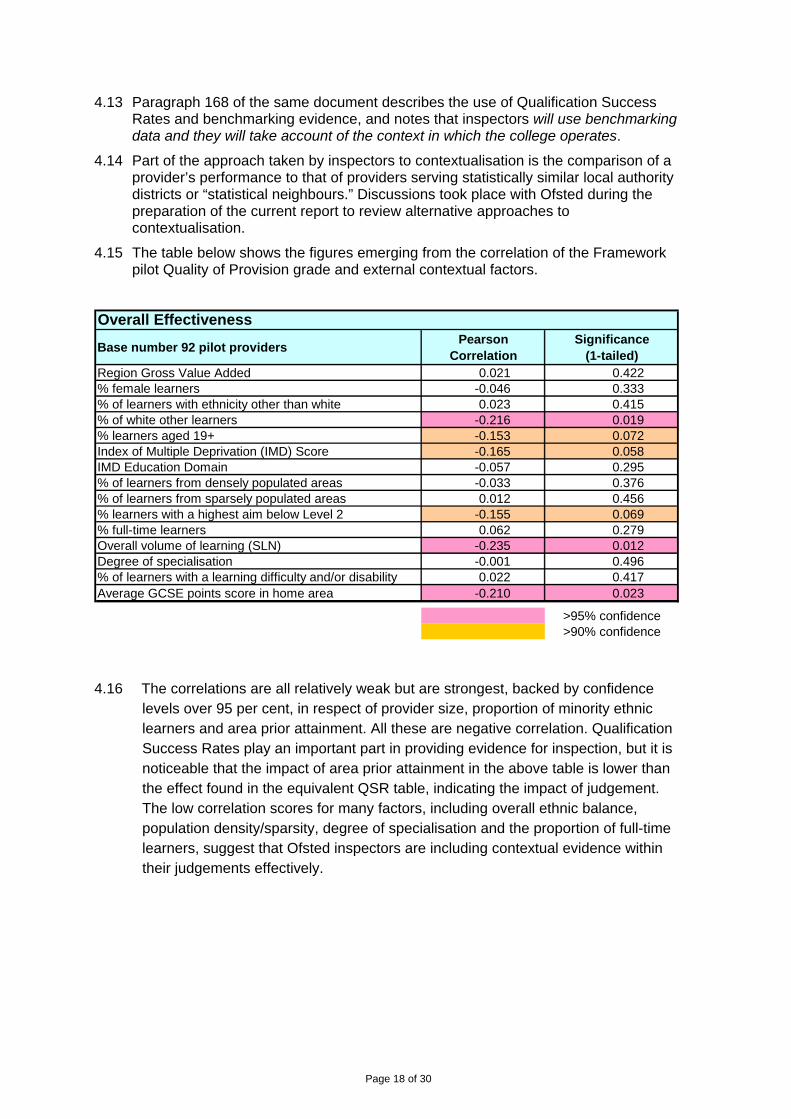
4.13 Paragraph 168 of the same document describes the use of Qualification Success Rates and benchmarking evidence, and notes that inspectors will use benchmarking data and they will take account of the context in which the college operates.
4.14 Part of the approach taken by inspectors to contextualisation is the comparison of a provider’s performance to that of providers serving statistically similar local authority districts or “statistical neighbours.” Discussions took place with Ofsted during the preparation of the current report to review alternative approaches to contextualisation.
4.15 The table below shows the figures emerging from the correlation of the Framework pilot Quality of Provision grade and external contextual factors.
4.16 The correlations are all relatively weak but are strongest, backed by confidence levels over 95 per cent, in respect of provider size, proportion of minority ethnic learners and area prior attainment. All these are negative correlation. Qualification Success Rates play an important part in providing evidence for inspection, but it is noticeable that the impact of area prior attainment in the above table is lower than the effect found in the equivalent QSR table, indicating the impact of judgement. The low correlation scores for many factors, including overall ethnic balance, population density/sparsity, degree of specialisation and the proportion of full-time learners, suggest that Ofsted inspectors are including contextual evidence within their judgements effectively.
Base number 92 pilot providers Pearson Correlation
Significance (1-tailed)
Region Gross Value Added 0.021 0.422% female learners -0.046 0.333% of learners with ethnicity other than white 0.023 0.415% of white other learners -0.216 0.019% learners aged 19+ -0.153 0.072Index of Multiple Deprivation (IMD) Score -0.165 0.058IMD Education Domain -0.057 0.295% of learners from densely populated areas -0.033 0.376% of learners from sparsely populated areas 0.012 0.456% learners with a highest aim below Level 2 -0.155 0.069% full-time learners 0.062 0.279Overall volume of learning (SLN) -0.235 0.012Degree of specialisation -0.001 0.496% of learners with a learning difficulty and/or disability 0.022 0.417Average GCSE points score in home area -0.210 0.023
>95% confidence>90% confidence
Overall Effectiveness

Page 19 of 30
Section 5: Initial Analysis Finance Dimension
Financial Health
5.1 The Framework pilot used well-established LSC procedures for monitoring the financial health of providers, but the mechanism for doing this was reduced to three performance measures from the previous six financial ratios. These three financial health measures relate to the solvency, sustainability and status of a provider, with the definitions differing slightly between FE colleges and other providers, due to differences in their legal and financial reporting status.
5.2 Within the pilot each of the three measures received a score ranging from 0 to 100, and the overall score for a provider was obtained by totalling the scores for the individual measures and adding an adjustment to recognise consistent Good performance across the three ratios.
5.3 Under LSC conventions, FE colleges formally consider whether their automatically calculated Financial Health grade reflects their position appropriately and the LSC carries out the final professional validation of all of the automatically generated Financial Health grades. This allows consideration of extraordinary circumstances but does not represent contextualisation.
5.4 The results of the correlation between Financial Health grades and external contextual factors are given in the table below:
5.5 The correlations are weak and indicate little case for the application of contextual factors. The strongest correlation, which just meets the 95 per cent confidence level, is a weak negative correlation to the economic performance of a provider’s region. This may reflect the impact of a strong regional economy on a provider’s premises and associated business operating costs.
Base number 87 pilot providers Pearson Correlation
Significance (1-tailed)
Region Gross Value Added -0.178 0.049% female learners 0.168 0.060% of learners with ethnicity other than white -0.173 0.055% of white other learners -0.024 0.412% learners aged 19+ 0.024 0.411Index of Multiple Deprivation (IMD) Score 0.029 0.395IMD Education Domain -0.114 0.147% of learners from densely populated areas -0.082 0.224% of learners from sparsely populated areas 0.055 0.306% learners with a highest aim below Level 2 -0.115 0.144% full-time learners 0.174 0.053Overall volume of learning (SLN) -0.002 0.493Degree of specialisation -0.060 0.290% of learners with a learning difficulty and/or disability -0.125 0.125Average GCSE points score in home area 0.001 0.498
>95% confidence>90% confidence
Financial Health
Page 20 of 30
Financial Control
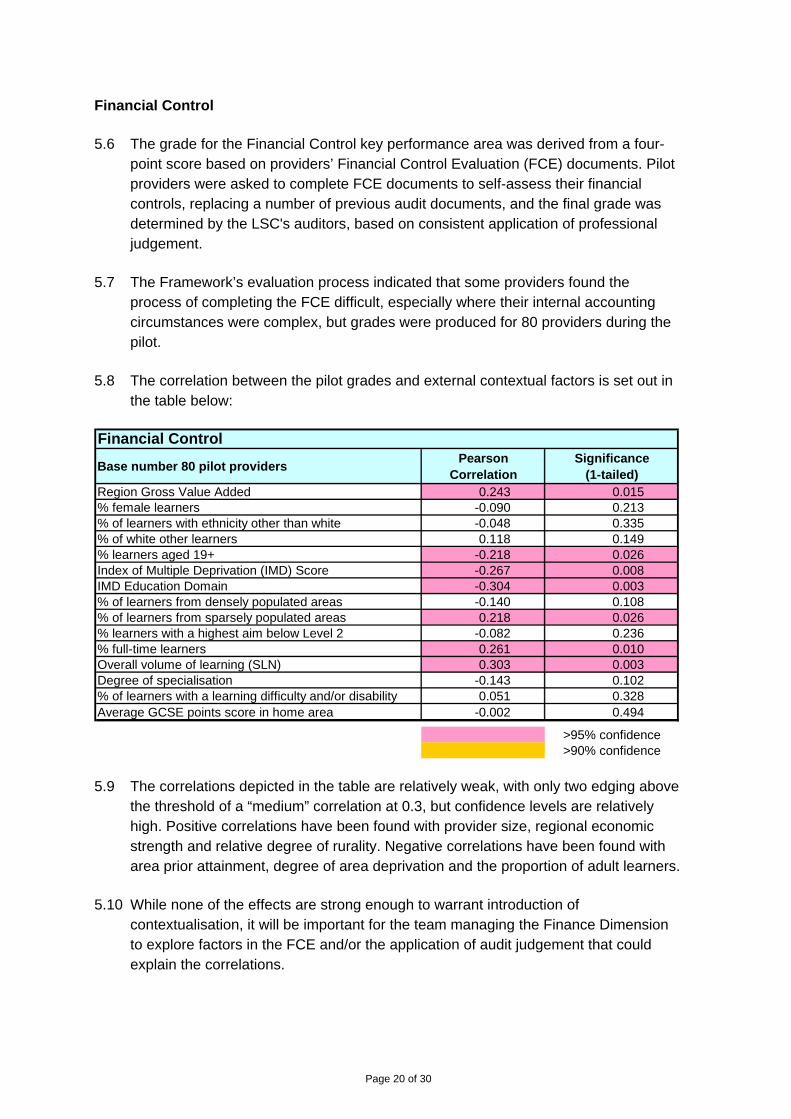
5.6 The grade for the Financial Control key performance area was derived from a four-point score based on providers’ Financial Control Evaluation (FCE) documents. Pilot providers were asked to complete FCE documents to self-assess their financial controls, replacing a number of previous audit documents, and the final grade was determined by the LSC's auditors, based on consistent application of professional judgement.
5.7 The Framework’s evaluation process indicated that some providers found the process of completing the FCE difficult, especially where their internal accounting circumstances were complex, but grades were produced for 80 providers during the pilot.
5.8 The correlation between the pilot grades and external contextual factors is set out in the table below:
5.9 The correlations depicted in the table are relatively weak, with only two edging above the threshold of a “medium” correlation at 0.3, but confidence levels are relatively high. Positive correlations have been found with provider size, regional economic strength and relative degree of rurality. Negative correlations have been found with area prior attainment, degree of area deprivation and the proportion of adult learners.
5.10 While none of the effects are strong enough to warrant introduction of contextualisation, it will be important for the team managing the Finance Dimension to explore factors in the FCE and/or the application of audit judgement that could explain the correlations.
Base number 80 pilot providers Pearson Correlation
Significance (1-tailed)
Region Gross Value Added 0.243 0.015% female learners -0.090 0.213% of learners with ethnicity other than white -0.048 0.335% of white other learners 0.118 0.149% learners aged 19+ -0.218 0.026Index of Multiple Deprivation (IMD) Score -0.267 0.008IMD Education Domain -0.304 0.003% of learners from densely populated areas -0.140 0.108% of learners from sparsely populated areas 0.218 0.026% learners with a highest aim below Level 2 -0.082 0.236% full-time learners 0.261 0.010Overall volume of learning (SLN) 0.303 0.003Degree of specialisation -0.143 0.102% of learners with a learning difficulty and/or disability 0.051 0.328Average GCSE points score in home area -0.002 0.494
>95% confidence>90% confidence
Financial Control
Page 21 of 30
Use of Resources
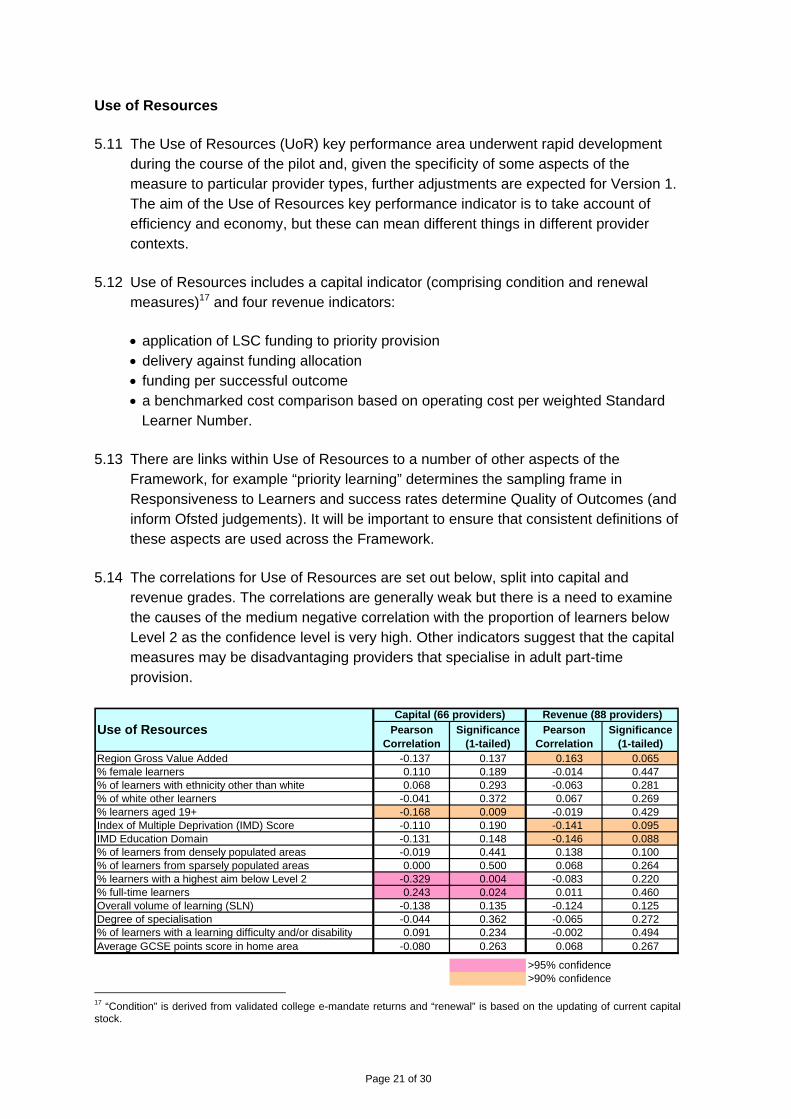
5.11 The Use of Resources (UoR) key performance area underwent rapid development during the course of the pilot and, given the specificity of some aspects of the measure to particular provider types, further adjustments are expected for Version 1. The aim of the Use of Resources key performance indicator is to take account of efficiency and economy, but these can mean different things in different provider contexts.
5.12 Use of Resources includes a capital indicator (comprising condition and renewal measures)17 and four revenue indicators:
• application of LSC funding to priority provision • delivery against funding allocation • funding per successful outcome • a benchmarked cost comparison based on operating cost per weighted Standard
Learner Number.
5.13 There are links within Use of Resources to a number of other aspects of the Framework, for example “priority learning” determines the sampling frame in Responsiveness to Learners and success rates determine Quality of Outcomes (and inform Ofsted judgements). It will be important to ensure that consistent definitions of these aspects are used across the Framework.
5.14 The correlations for Use of Resources are set out below, split into capital and revenue grades. The correlations are generally weak but there is a need to examine the causes of the medium negative correlation with the proportion of learners below Level 2 as the confidence level is very high. Other indicators suggest that the capital measures may be disadvantaging providers that specialise in adult part-time provision.
17 “Condition” is derived from validated college e-mandate returns and “renewal” is based on the updating of current capital stock.
Pearson Correlation
Significance (1-tailed)
Pearson Correlation
Significance (1-tailed)
Region Gross Value Added -0.137 0.137 0.163 0.065% female learners 0.110 0.189 -0.014 0.447% of learners with ethnicity other than white 0.068 0.293 -0.063 0.281% of white other learners -0.041 0.372 0.067 0.269% learners aged 19+ -0.168 0.009 -0.019 0.429Index of Multiple Deprivation (IMD) Score -0.110 0.190 -0.141 0.095IMD Education Domain -0.131 0.148 -0.146 0.088% of learners from densely populated areas -0.019 0.441 0.138 0.100% of learners from sparsely populated areas 0.000 0.500 0.068 0.264% learners with a highest aim below Level 2 -0.329 0.004 -0.083 0.220% full-time learners 0.243 0.024 0.011 0.460Overall volume of learning (SLN) -0.138 0.135 -0.124 0.125Degree of specialisation -0.044 0.362 -0.065 0.272% of learners with a learning difficulty and/or disability 0.091 0.234 -0.002 0.494Average GCSE points score in home area -0.080 0.263 0.068 0.267
>90% confidence
Use of ResourcesCapital (66 providers) Revenue (88 providers)
>95% confidence

Page 22 of 30
Section 6: Second-level Testing (Pilot Measure Scores)
6.1 The second level of testing drilled down to performance indicator scores for three aspects that had generated relatively high and robust correlations when assessed on grades. These were Learner Views, Learner Destinations and Quality of Outcomes (Qualification Success Rates). A further measure, Ofsted’s Overall Effectiveness grade, was added as a comparator to assess the degree of overlap between this measure and over aspects of the Framework. As this related to the Oftsed grade, the numerical value of these was reversed with a grade of “Outstanding” being credited with a high score of 4. This prevented any confusion as all the other variables ran from positive to negative.
6.2 The table below shows the results. On this occasion the colour of the significance row indicates the confidence level and the colour of the cell indicates the strength of the correlation.
6.3 When analysed at the level of the actual score gained in the pilot measure, Learner Views does not generate any large correlations, but there are medium-sized and highly significant negative correlations with population density, the extent to which the provider recruits learners of White Other origin and the breadth of the provider’s curriculum (proportion of all Tier 2 sector subject areas offered). These relationships may indicate the degree of alternative choices easily available to the learner and should be further monitored in the Version 1 data set. However, the effect is not strong enough to warrant contextualisation at this stage.
Pearson Correlation
Sig. (2-tailed)Pearson
CorrelationSig. (2-tailed)
Pearson Correlation
Sig. (2-tailed)
Learner destinations -0.079 0.5478 n/a n/a 0.054 0.6264QSRs 0.054 0.6264 0.478 0.0001 n/a n/aOfsted (high to low) 0.256 0.0201 0.374 0.0028 0.539 0.0000IMD score -0.075 0.4948 0.064 0.6178 -0.144 0.1681IoD Education Domain 0.068 0.5347 -0.046 0.7201 -0.288 0.0052% population density -0.313 0.0036 0.095 0.4539 -0.031 0.7664% population sparsity 0.147 0.1792 -0.005 0.9706 0.092 0.3816% ethnicity not white -0.294 0.0063 0.334 0.0070 0.074 0.4798% ethnicity Other white -0.433 0.0000 -0.173 0.1717 -0.089 0.3962% female -0.100 0.3617 0.058 0.6466 -0.030 0.7787% 19 plus -0.091 0.4052 -0.728 0.0000 -0.328 0.0013% highest aim below L2 -0.182 0.1435 -0.271 0.0458 -0.078 0.5196% learners full-time -0.066 0.5454 0.691 0.0000 0.403 0.0001Degree of specialism 0.268 0.0132 -0.183 0.1484 -0.074 0.4793Curriculum width -0.436 0.0000 0.040 0.7520 -0.159 0.1291% self-declared LDD -0.038 0.7322 -0.046 0.7210 0.176 0.0919GCSE score in area -0.037 0.7364 -0.167 0.1871 -0.011 0.9190
Small RedMedium BlueLarge
Correlations on Measure Scores
Correlation sig. at 0.01 level (99%)Correlation sig. at 0.05 level (95%)
Learner Views Learner Destinations
(adjusted by level)
Qualification Success Rates

Page 23 of 30
6.4 The testing confirmed large and statistically significant negative correlations between Learner Destination scores and the extent to which providers serve adult or part-time learner markets. The effect is strong enough to warrant contextualisation, but we recommend initially that the key performance area lead should re-examine the definition of in-scope learners and/or the judgements used to classify the survey responses of learners on relatively small programmes of learning. Detailed analysis of the Learner Destinations survey responses presented to the LSC and the Framework partners on 29 April 2007, indicated that part-time learners were twice as likely to have their survey responses interpreted as fitting no positive progression categories than full-time learners. The analysis also raised concerns about the impact learners progressing from AS to full A-levels were having on the figures. It is understood that these issues will be taken up by the LSC once a current round of commissioning for a contract to conduct the Version 1 Destinations Survey is complete.

Page 24 of 30
Section 7: Third-level Testing (Version 1 Forward Projections)
7.1 The LSC has carried out forward-modelling in the Effectiveness and Finance Dimensions of the likely pattern of scores for Qualification Success Rates, and the four resources measures within the Use of Resources key performance area.
7.2 Significance levels are much higher due to the increased number of providers on which the data are being modelled. Qualification Success Rates show negative correlations to a number of variables that have importance for equality and diversity monitoring, although the size of the correlation is small. This indicates a need to re-examine the extent to which additional evidence, for example value-added measures in Quality of Outcomes, or ‘participation’ measures in the Responsiveness Dimension, could ensure that providers serving learners from socially or educationally disadvantaged backgrounds are not presented with perverse disincentives to cut back on this provision.
7.3 For Use of Resources (UoR), there is confirmation that current measures in UoR measures 1 and 2 may be impacting upon providers specialising in adult and part-time provision, although the size of the correlation is small. A greater concern is the outcome for the modelling of UoR measures 3 and 4 against curriculum width, since this shows a large and highly significant negative correlation with breadth of provision. It may be that measures of efficiency are not recognising the difficulty of obtaining economies of scale where providers offer provision across a full range of sector subject areas. There is also confirmation that providers offering a high degree of part-time learning to adults may be disadvantaged by UoR measures 3 and 4.
Pearson Correlation Sig. (2-tailed) Pearson
Correlation Sig. (2-tailed) Pearson Correlation Sig. (2-tailed)
IMD Score -0.167 0.0000 0.026 0.3487 0.082 0.0040IMD Education Domain -0.095 0.0007 0.002 0.9428 0.114 0.0001% population density -0.157 0.0000 -0.003 0.9108 -0.046 0.1053% population sparsity 0.093 0.0009 -0.008 0.7679 -0.036 0.2024% ethnicity not white -0.121 0.0000 0.006 0.8229 -0.160 0.0000% ethnicity Other white -0.136 0.0000 0.002 0.9330 -0.214 0.0000% female -0.103 0.0002 -0.023 0.4124 -0.153 0.0000% 19 plus -0.185 0.0000 -0.296 0.0000 -0.001 0.9759% highest aim below L2 -0.175 0.0000 -0.012 0.6745 -0.351 0.0000% learners full-time 0.065 0.0207 0.173 0.0000 -0.376 0.0000Regional Gross Value Added -0.080 0.0042 -0.024 0.3882 -0.086 0.0024Curriculum width -0.057 0.0438 0.029 0.3085 -0.534 0.0000% self-declared LDD -0.009 0.7599 0.132 0.0000 -0.064 0.0239Provider size FTEs FE (519) 0.075 0.0897 -0.079 0.0719 0.010 0.8246Provider size FTEs WBL (1066) 0.030 0.3268 0.035 0.2548 0.032 0.3003
Red SmallBlue Medium
Large
(1,239 providers)Version 1 Projections
Correlation sig. at 0.01 level (99%)Correlation sig. at 0.05 level (95%)
Quality of Outcomes Use of resources
UoR1 and UoR2 combined score UoR3 and UoR4 combined scoreQualification Success Rates(1,270 providers) (1,253 providers)

Page 25 of 30
Section 8: Conclusions and Recommendations
8.1 There is no conclusive case for extending contextualisation at this stage of the development of the Framework for Excellence. Correlations were generally weak and subject to low confidence levels, meaning that any apparent correlation could simply be the result of random variations.
8.2 However, this is partially due to the relatively limited volume of data available as a result of the pilot. A number of potential contextualisation factors have been identified, with weak correlations to performance indicator scores and this indicates a need for further testing of the outcomes of Version 1.
8.3 On 13 May 2007, the LSC and its Framework partners adopted the following recommendations, derived from emerging findings from this research:
8.4 The research identified a number of issues that had arisen in more than one key performance area and stressed the importance of co-ordinating responses to emerging issues. One example is the impact of the separation of AS and A-level qualifications. This issue impacts on all three Dimensions through the Quality of Outcomes, Learner Destinations and Use of Resources indicators.
8.5 There is a need for the team working on the Responsiveness Dimension to assess the implications of including relatively short courses within the scope of the Learner Destinations measure, and either introduce a minimum learning volume threshold or ensure that the criteria determining a positive outcome are appropriate for such provision.
1. That the contextualisation of Learner Views by level of study used in the calculation of pilot scores should be carried forward as a methodology into Version 1.
2. That large and significant correlation between Learner Destinations and age and mode of study should be tackled by a review of the criteria for a successful outcome, and/or a review of the definition of in-scope learners not by contextualisation (for example, through the introduction of a minimum qualifying number of guided learning hours).
3. The correlation between Qualification Success Rates and learners’ age band and mode of study should be further examined.
4. There is no compelling case for any further contextualisation at this stage.
5. The Learner Destinations Version 1 survey should include a test of learners’ perceptions of the success of their outcomes and should also test for a wider range of impacts of learning (for example, increased confidence).
6. There should be further testing of the influence of external factors on the outcomes of Version 1 and at the earliest possible stage of the introduction of any new measures into the Framework.

Page 26 of 30
8.6 There is a need for the team working on the Finance Dimension to investigate possible factors within the Financial Control Evaluation and subsequent judgement process that could be causing negative correlations with economic and social deprivation indicators. Similarly, there is some evidence that providers delivering lower level adult part-time provision may be disadvantaged by the Capital and Use of Resources revenue measures. There is also a need to re-examine the treatment of providers offering provision across a wide range of sector subject areas, as they appear to be significantly disadvantaged by Use of Resources efficiency measures.
8.7 There is a need for the team working on the Effectiveness Dimension to investigate the extent to which additional evidence, for example value-added measures, could be brought into Quality of Outcomes to ensure that providers serving learners from socially or educationally disadvantaged backgrounds are not presented with perverse disincentives to cut back on this provision.
8.8 Alternatively, there may be a need for the team working on the Responsiveness Dimension to explore the potential for a participation measure that could recognise the success of providers who recruit learners from disadvantaged backgrounds.

Page 27 of 30
Glossary
Confidence Interval Agreed limits on the acceptable margins for a sample- based measure either side of the figure Confidence levels A statistical measure of the likelihood of a sample-based
measure being within agreed margins (see confidence interval) of the true figure
Contextualisation Adjustment in a measure or statistic to take account of
external contextual factors beyond the control of the subject being measured
Correlation A measured statistical relationship between two figures that
indicates that the factors they measure are related Dimension One of the three sections of the Framework for Excellence
dealing with a provider’s performance in terms of Responsiveness, Finance or Effectiveness
Financial Control A key performance area within the Finance Dimension
measuring the effectiveness of a provider’s arrangements to ensure it operates efficiently
Financial Health A key performance area within the Finance Dimension
measuring the effectiveness of a provider’s arrangements to ensure it operates efficiently
Framework for Excellence A new performance assessment framework for colleges and
providers
Indices of Multiple An index published by the Department for Communities Deprivation and Local Government combining a number of indicators,
relating to economic, social and housing issues, in a single deprivation score
Minimum Levels Published thresholds for Qualification Success Rates of performance below which formal improvement measures are triggered Mission-related Specialism by a provider in particular areas of learning Concentration based on its institutional mission, for example a specialist
college of Art and Design MLwIN A specialist modelling tool created by the Centre for Multi-
level Modelling at the University of Bristol which finds complex patterns in data sets

Page 28 of 30
Multi-level modelling A statistical technique which considers a range of possible
relationships between a number of variables to find the best explanation of an observed pattern
Multiple regression A relatively simple statistical technique that considers the
relationship between two variables by tracing a straight line when they are plotted together on a graph
Multi-variate analysis Any statistical technique that considers relationships
between two or more variables National Learner The National Learner Satisfaction Survey (NLSS) is Satisfaction Survey large survey of post-16 learners in England commissioned
periodically by the LSC Null hypothesis A statistical convention in which a possible relationship is
deemed not to exist unless proved otherwise beyond an acceptable level of confidence
Ofsted The Office for Standards in Education, Children’s Services
and Skills, which inspects and regulates care for children and young people, and inspects education and training for learners of all ages
Pearson Correlation An approach to measuring the extent to which values of two
variables are proportional to each other Provider home area The immediate geographical area from which a provider
recruits most of its learners Qualification Success Statistics compiled by the LSC on a qualification by Rates (QSRs) qualification basis on the proportion of learners starting a
qualification and those who go on to complete it with successful achievement
Quality of Outcomes A key performance area within the Effectiveness Dimension,
measuring the extent to which learners in a provider succeed Quality of Provision A key performance area within the Effectiveness Dimension
measuring the overall quality of a provider’s operation Quartile analysis An approach to ranking performance based on the number
of an organisation’s clients found in the highest and lowest 25 per cent of any particular overall ranking list (for example, satisfaction level.)

Page 29 of 30
Responsiveness to A key performance area within the Responsiveness Employers Dimension measuring the extent to which a provider
responds effectively to employer’s needs Responsiveness to A key performance area within the Responsiveness Learners Dimension measuring the extent to which a provider
responds effectively to learner’s needs Significant score A measure of the likelihood that an observed effect has
resulted from pure chance; the lower the score the less likelihood that the effect is random
Single Equality Impact A single investigation of the likely impact of a policy or a Assessment technical change on a public sector body’s responsibilities
across all aspects of equal opportunities legislation SPSS Originally the Statistical Package for the Social Science, this
is now an analysis tool used in commercial and academic research
Standard Learner A standard measure of the volume of learning activity Number (SLN) used in funding calculations to compare learning
programmes of different lengths Sustainability In the context of Financial Health this is a measure of
likelihood of a provider’s long-term stability Use of Resources A key performance area within the Finance Dimension
measuring a provider’s overall effectiveness in using the public resources allocated to it
Variance A statistical statement of how widely spread the values of a
variable are likely to be; the larger the variance, the more scattered the likely observations on a chart.

© LSC August 2008 Published by the Learning and Skills Council Extracts from this publication may be reproduced for non-commercial educational or training purposes on condition that the source is acknowledged and the findings are not misrepresented. This publication is available in electronic form on the Learning and Skills Council website: www.lsc.gov.uk If you require this publication in an alternative format or language, please contact the LSC Helpdesk: 0870 900 6800 Publication reference: LSC-P-NAT-080153
Learning and Skills Council National Office
Cheylesmore House Quinton Road Coventry CV1 2WT T 0845 019 4170 F 024 7682 3675 www.lsc.gov.uk