Embed Size (px)
Citation preview
TESTING SPECULATIVE BEHAVIOR IN FARMLAND DEMAND Nicholas Barton, Soji Adelaja, and Saichon Seedang*
Abstract
Substantial increases in farmland demand in sub-urbanization have had profound effects
on agriculture and produced a surge in farmland values. With escalating land values, farmland
can take on the characteristics of a speculative asset and farmland owners may be more
responsive to the investment value of farmland than the productive value. Speculation has been
shown to have a significant impact on the agricultural production decisions of farms, and may
encourage farmers to curtail capital investments and prematurely idle productive farmland.
This paper investigates the effects of farmland value appreciation on agriculture and
isolates the speculative component of land use demand, using New Jersey as a case study. Two
empirical models are used in the analysis; one that accounts for speculation and one that does
not. The former is found to be superior. An inverse relationship is estimated between the rate of
appreciation and the demand for farmland, suggesting a direct relationship between appreciation
and land supplied to development. The relationship, however, is found to be positive at rates of
farmland value appreciation in excess of the risk free rate of return. This suggests an identifiable
speculative demand component whereby farmland owners retain farmland at high rates of
appreciation. Results also support the conjecture that when the rate of appreciation is lower than
the risk free rate, the speculative behavior of farmland owners is to keep less land in agriculture.
Keywords: Speculative behavior, Farmland demand, Farmland appreciation, Risk-free rate
* Selected Paper prepared for presentation at the American Agricultural Economics Association Annual Meeting, Providence, Rhode Island, July 24-27, 2005. Nicholas Barton is Business Analysis at Aventis Corporation, Swiftwater, Pennsylvania. Adesoji Adelaja is John A. Hannah Distinguished Professor in Land Policy and Director of the Land Policy Program, Michigan State University. Saichon Seedang is Research Associate, Institute of Water Research and Land Policy Program, MSU. Soji Adelaja, the contact author, can be reached at Land Policy Program, 317 Manly Miles Building, 1405 South Harrison Rd., East Lansing, MI 48823, USA. Tel: 517-432-8800; Fax: 517-432-8769.
TESTING SPECULATIVE BEHAVIOR IN FARMLAND DEMAND
Speculation in farmland can be described as the tendency of farmland owners to acquire,
dispose or hold on to land based on expectations about the appreciation of land. An investor may
invest in land when the rate of appreciation is high whereas a producer may see high rates of
return as high opportunity costs of a productive asset. Speculation can therefore create dual
motives: land holding for productive purposes and holding for speculative purposes. Speculation
may increase the desire to maintain land in agriculture in anticipation of capital gains. However,
the fact that speculators participate in the farmland market suggests that farmland sales are
motivated by the profits realized from appreciating land values. This destabilizes the farmland
base and discounts the efforts made to sustain farm viability.
During the post war period, New Jersey has experienced a steady flow of population to
increasing distances from city centers. Nearly every city in the state has experienced a decrease
in population, while nearly every suburban town has experienced a rapid increase in population.
This trend of suburbanization has had both direct and indirect effects on New Jersey’s
agriculture. The most obvious direct impact has been the conversion of agriculturally productive
farmland to non-farm uses (Lopez, Adelaja and Andrews 1988). Lopez, Adelaja and Andrews
(1988), also identify speculative forces as an indirect factor associated with suburbanization.
Although some past studies have been able to attribute a portion of rising farmland values to
speculation, few have investigated the role of speculation in the demand for farmland. Land
values in New Jersey are appreciating at rates that exceed the rates of return from most other
investments, including the US Treasury bill rate. This suggests the likelihood of speculation
occurring in New Jersey’s farmland market. There exists a need to explore the role of speculation
in farmland markets.
2
This research centers on the possibility of speculation being a significant factor in the
demand for farmland. New Jersey’s farmland market is an ideal setting for investigating the
nature of speculation and the impact of speculation on the demand for farmland. A better
understanding of the nature of farmland purchases and decisions on the urban fringe and the
speculative land use demand will assist policy makers in designing policies to preserve
agricultural land and promote farm viability in urban-fringe regions.
New Jersey’s Farmland Market
In New Jersey, the strain placed on land resources by the movement of population away
from cities has had a substantial impact on the farmland market. With the entire state enclosed in
a metropolitan area, New Jersey’s farmers face the challenges of farming at the urban fringe (Lee
1993). The consequence of New Jersey’s geographic situation has been the premature
conversion of productive farmland to commercial and residential uses (Lee 1993). Since 1950,
over half (53%) of the farmland in New Jersey has been converted to non-farm uses (Table 1)
compared to the national total for farmland conversion of 20%.
The rising development demand for land resources in New Jersey has resulted in a surge
in farmland prices during the post war period and has raised concern about the speculative
behavior amongst farmers and other farmland market participants. Historically, land values in
the New Jersey have been among the highest in the Northeastern United States and higher than in
any other region of the U.S. (Table 2).
Concern about the loss of income, employment and quality of life resulting from the
decline in agricultural land has fueled an increase in public support for farmland preservation.
Like many suburban regions of the United States, New Jersey has initiated public policies
3
designed to retain land in agriculture. The objective of these regulations is to promote
agricultural land use and discourage conversion to non-farm uses. The most notable of these
agricultural farmland preservation policies is the Farmland Assessment Act of 1964. Land that
qualifies for farmland assessment is taxed on the agricultural productive value rather than the
market value. The act also inhibits farmland conversion though the issuance of fines for
removing land from agricultural production. The tax savings from farmland assessment are
intended to ease the financial burden of farming in the urban-fringe. Overall, zoning and tax
regulations have been effective in limiting the amount of land converted to non-agricultural uses
in New Jersey.
The key to the farmland assessment act’s success has been the provision for farmland to
be taxed at its productive rather than its market value. However, the requirements1 and penalties
in New Jersey are not as strict and severe as those of other states penalty assessments are
insignificant when compared to the potential gains realized from land sale. For this reason, New
Jersey’s farmland market is considered to be conducive to speculation.
Other states in the Northeast’s provisions often require more strict standards to qualify
for farmland assessment and more severe penalties for taking land out of agricultural
production2. A combination of pressures brought about by suburbanization and the relatively
weak zoning and tax regulations has created a climate in which speculative land investors can
easily penetrate the farmland market.
1 To qualify for farmland assessment a farm operation must meet the minimum requirements of 5 acres and $500 in annual agricultural production. 2 Northeastern states including Connecticut and New York require 10 acres of land and $2000 worth of agricultural production to qualify for farmland assessment.
4
Theoretical Framework
Review of Literature
An appropriate starting point for conceptualizing the demand for farmland is the literature
on the effects of suburbanization on farmland demand and farmland investment demand. Land
markets that exist in areas influenced by suburbanization are subject to a number of pressures
that are not present in rural land markets such as population growth, expansion of development,
zoning laws, and increased costs of production. The direct impact of these pressures is higher
farmland prices and an increase in the incidence of farmland sales. The demographics and
market pressures present in highly urbanized New Jersey create a very unique atmosphere for
land investors. These investors have different set of preferences and exhibit different types of
behavior than that of typical farmland investors.
Lopez, Adelaja, and Andrews (1988) studied the effects of suburban population density
and land speculation on agricultural production choices, prices and profits in New Jersey. They
found that suburbanization reduces farm operator responsiveness to agricultural prices and
impedes capital and land use. The result confirmed the ‘impermanence syndrome’ hypothesis
that capital investment is discouraged by land speculation. Parks and Quimio (1996) developed
a conceptual model that links agricultural profits, capital gains, interest rates, and property taxes
to the sale of agricultural land in New Jersey. They found that higher interest rates and property
taxes, and speculative capital gains, are potential causes for the increased conversion of
agricultural land. They also found that the relative significance of capital gains over property
taxes provides support to the notion that farmland assessment may need to be complemented by
other policy instruments in order maintain land in agriculture.
The conversion of land from agricultural to non-agricultural use mainly reflects the
5
interests of large developers, which tends to be speculative in character. As a result, the land
conversion in Firman (1997) examined the impact of economic development on land conversion
in the Northern Region of West Java (NRWJ), Indonesia, and found that the development of
NRWJ has been triggered largely by domestic and foreign investment in the manufacturing,
finance and service sectors. He pointed to the financial deregulation policies of Indonesia as the
stimulus for the increase in capital investment. The transformation of agricultural land into large
new towns and industrial estates is caused primarily by an influx of population to peripheral
areas. Many developers in these areas have misused their building permits for the purposes of
land speculation and profit maximization. NRWJ is highly uncontrolled and extremely rapid.
A review of studies related to asset demand in capital markets is essential to understand
farmland investment demand. Risk aversion, life cycle hypothesis, interest rates and taxation are
considered in the estimation of asset demand with portfolio choice. Several studies (i.e., Barry
1980, Schnitkey, Taylor and Barry 1989, and Leibowitz, Kogelman, Bader and Dravid 1994)
underlie the economic interpretations of asset demand and portfolio theory. For example, Barry
(1980) applied the capital asset pricing model (CAPM) to estimate the risk premiums that are
required to hold farm real estate in a well-diversified market portfolio. It was evident that farm
real estate has offered substantial return premiums above the market premiums. He concluded
that farmland is a favorable source of diversification for well-diversified investors, which may
strengthen the non-farm sources of demand for investment in farmland which has a low risk
premium relative to other investments.
Leibowitz, Kogelman, Bader and Dravid (1994) examined the effect of interest rates on
strategic asset allocation. The purpose of this study was to address related to the traditional risk
measure of volatility. The study showed that an interest rate sensitive asset allocation (IRSA)
6
policy enables investors to maintain a constant shortfall risk position at varying rates of interest.
Because, farmland in the urban fringe is believed to take on characteristics of a financial asset,
the speculative demand for farmland may be comparable to that of capital asset demand in
financial markets and the portfolio holdings of a farmland investor may be a function of the risk-
return relationship of capital assets.
Determinants of farmland demand and theoretical considerations
Traditional farmland demand studies have focused on the productive use of farmland by
conducting analyses that capture agricultural factors and reflect market conditions. Studies
conducted by Lopez, Adelaja, and Andrews (1988), and Parks and Quimio (1996) considered
farm specific factors such as farm income, property taxes, labor and production costs and land
value, as determinants of farmland demand. .
Speculative behavior is a viable component of the demand for farmland in New Jersey.
Speculation may occur in the sense that farmland owners actively seek investors in, or
developers for, their land, curtail investments in their farms, or even cease farming operations
while in search of a suitable buyer. Speculation may also be passive in that the farmer becomes
aware of the appreciating value of the land so that at retirement he or she can count on “cashing
in” on the farm (Berry 1978). The latter of the two previous situations seems to be more
prevalent in New Jersey’s farmland markets.
It is postulated that speculative farmland investors are more responsive to the
investment value of farmland than its productive value (Lopez, Adelaja and Andrews 1988).
Guth (1994) defined the role of a speculator in investment decisions. To meet the three criteria
for speculation an individual must (1) purchase (sell) a good, (2) face price/profit uncertainty,
7
and (3) transact primarily with a capital gains motive. The more a farmland investor weighs the
capital gain potential of his investment as opposed to wanting to capture the benefits from selling
farmland, the more they act as a speculator per se.
Farmland demand in the urban fringe is similar in nature to that of capital asset demand
in financial markets. To explain the speculative behavior of farmland market participants, it is
necessary to understand the theory of portfolio. Portfolio theory provides a straightforward and
logical basis for conducting research related to significant investment decisions. A useful
application of portfolio theory in investment demand is the concept of efficient portfolio
selection.3
Conceptual Model
Using the pre-established determinants for farmland demand forwarded by Lopez,
Adelaja and Andrews and Parks and Quimio, a conceptual model for farmland demand can be
specified. The model for farmland demand without considering the effects of speculation can be
expressed as:
Lt = α0 + α1πt + α2νt + α3λt + α4φt + α5rt + α6τt + µt. (1)
3 Efficient portfolio selection is based upon the premise that an investor, in allocating his wealth
between two different assets, takes into account, not only the returns expected from alternative portfolio combinations, but also the risk attached to each such holding. This risk is usually assumed to arise out of uncertainty over future asset prices, and can occur in any asset where the expected holding period is less than the term to maturity. Farmland investments fall into such a category because prices vary according to market conditions, with the risk of capital losses potentially high. However, even the returns from interest-paying safe assets may involve an element of uncertainty over the holding period, if the interest rate is subject to market variability (Thompson 1993). Efficient portfolio selection assumes that the investor maximizes the expected utility obtainable from his portfolio holding, expressed in terms of expected return and risk, subject to a given budget constraint. Such an approach to portfolio analysis can be exemplified by Tobin’s (1958) paper on liquidity preference.
8
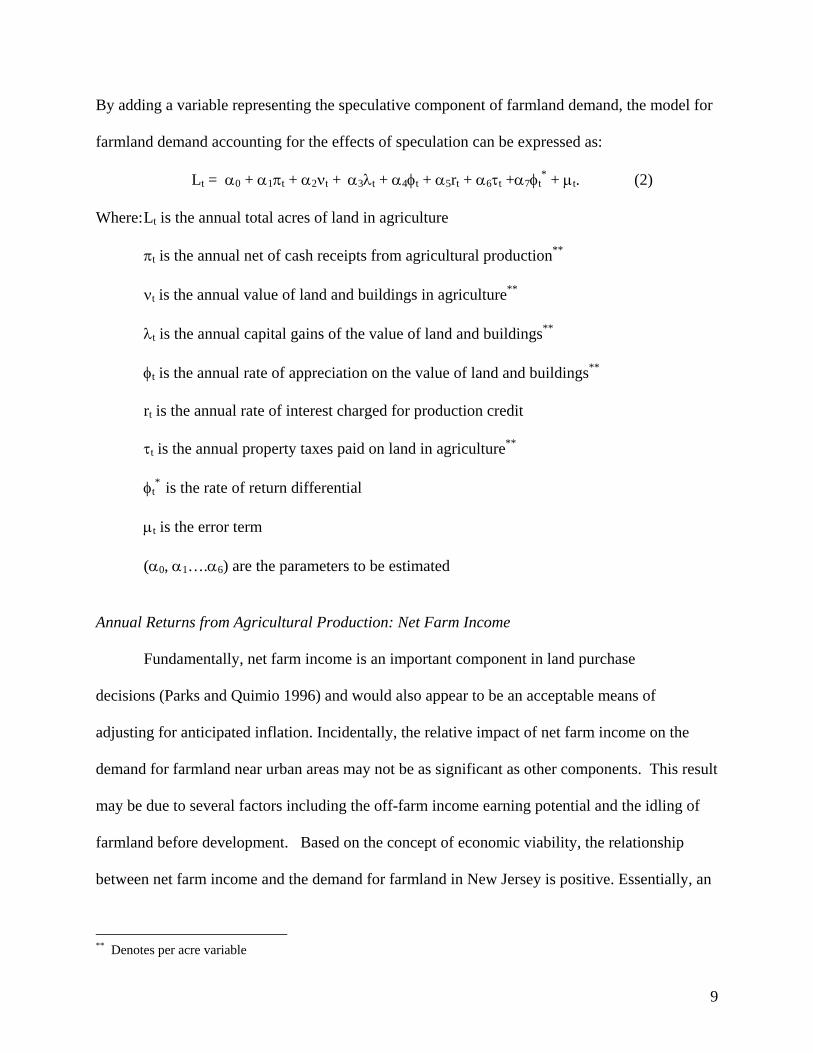
By adding a variable representing the speculative component of farmland demand, the model for
farmland demand accounting for the effects of speculation can be expressed as:
Lt = α0 + α1πt + α2νt + α3λt + α4φt + α5rt + α6τt +α7φt* + µt. (2)
Where: Lt is the annual total acres of land in agriculture
πt is the annual net of cash receipts from agricultural production**
νt is the annual value of land and buildings in agriculture**
λt is the annual capital gains of the value of land and buildings**
φt is the annual rate of appreciation on the value of land and buildings**
rt is the annual rate of interest charged for production credit
τt is the annual property taxes paid on land in agriculture**
φt* is the rate of return differential
µt is the error term
(α0, α1….α6) are the parameters to be estimated
Annual Returns from Agricultural Production: Net Farm Income
Fundamentally, net farm income is an important component in land purchase
decisions (Parks and Quimio 1996) and would also appear to be an acceptable means of
adjusting for anticipated inflation. Incidentally, the relative impact of net farm income on the
demand for farmland near urban areas may not be as significant as other components. This result
may be due to several factors including the off-farm income earning potential and the idling of
farmland before development. Based on the concept of economic viability, the relationship
between net farm income and the demand for farmland in New Jersey is positive. Essentially, an
** Denotes per acre variable
9

increase in income derived from agricultural production will contribute to the desire to retain
land in agriculture.
Farmland Value: Capital Gains and the Rate of Appreciation
A useful derivative of farmland value is the appreciation realized from farmland price
changes over time, usually realized when an asset is sold. Morris (1978) found evidence that
farmland price increases may reflect anticipated changes in farmland values not associated with
changes in the farm income stream. Farmland price increases could reflect anticipated changes
in land use, for example changes associated with urbanization (Morris 1978) or a shift in investor
preferences; indicative of a change in attitude towards land investments as a store of value. A
proper measure of farmland value appreciation is capital gains. An increase in the capital gains is
expected to have a positive impact on the desire to maintain land in agriculture. Since this
change is represented in dollar terms and not a percentage change, the same positive relationship
can be observed for the value of land and buildings.
An alternative way to estimate the impact of farmland value changes on the demand for
farmland is to derive the rate of appreciation. The rate of appreciation in farmland value
represents the annual percentage change in farmland value. In a sense, it measures a rate of
return similar to that of a rate of return on equity. This measure will enable us to determine the
demand response for farmland in relation to changes in the rate of appreciation. An examination
of the rate of appreciation may reveal a switch in investor behavior at specified points such that
the effect of speculation on farmland demand can be more accurately estimated.
A justification for the use of the rate of appreciation in the examination of farmland
demand in New Jersey can be drawn from portfolio theory and efficient portfolio selection.
10
Under the assumptions of the theory, a significant factor in the allocation of individual wealth
between assets is the rate of return and risk generated by those assets. Given that farmland near
urban areas takes on many of the characteristics of a financial asset, the inclusion of a measure
for return becomes imperative. The inherent relationship between rate of appreciation and
farmland demand is negative and can be explained by the concepts of risk and return. As the
expected rate of return from farmland value rises, so too does the risk associated with retaining
that asset. The tendency of a risk-averse individual, therefore, is to sell increasing amounts of
farmland as the rate of appreciation rises.
In the case of speculation, an individual may actually weigh the benefits of the higher
expected return more than the increased risk associated with it. Therefore, it is hypothesized
when the rate of farmland value appreciation exceeds the risk-free T-Bill rate (rate of return
differential), a positive relationship with farmland holdings may be observed. This would be
consistent with the anticipated marginal effect and will support the notion of speculative
behavior occurring in farmland demand.
Opportunity Cost of Capital: Rate of Interest charged for production credit
Opportunity cost reflects the revenue forgone when financial resources are allocated to
something other than the current asset. In the case of a farmland owner, the opportunity cost of
capital is realized through the capitalization or discount rate. A farmer may be reluctant to invest
in capital expenditures for his farm operation if the capitalization rate is high. The direct effect
may be an increase in the incidence of land sales. Based on this fundamental relationship,
opportunity cost of capital can be considered as a viable explanatory variable of farmland
demand.
11
A popular measure for the opportunity cost of capital used in agricultural production is
the real rate of interest charged for production credit associated with lending to farmers. Farm
credit associations are the primary source of lending for farmers and are intended to provide
affordable rates for farmers who wish to invest in their farm operation. The interest rates charged
for production credit is generally accepted as a good proxy for the opportunity cost of capital
(Parks and Quimio 1996).
Parks and Quimio found increases in interest rates to be negatively correlated with
agricultural land area, suggesting that an increase in interest rates (discounted net value of future
agricultural use decreases) would prompt a landowner to prefer selling land instead of
maintaining it in agriculture. In this circumstance, the higher rates of interest charged to farmers
would cause an agricultural landowner to have less access to credit than those offering to buy the
agricultural land. The obvious result would be an increase in land conversion.
Property Taxes
Zoning and tax policies are necessary instruments for maintaining agricultural land in
near-urban areas. Without proper regulations or incentives, the loss of farmland from these
urban fringe areas may be more profound and detrimental. It is commonly understood that
property taxes represent a small portion of land value and that a marginal change in taxes will
have a minimal negative effect on the value of land in agriculture (Parks and Quimio 1996).
Despite this fact, the effects of taxes on the demand for farmland cannot be overlooked,
especially under conditions of speculation where easements in taxes may have a significant
effect on the demand for farmland.
12
Quantifying the effects of property taxes on farmland demand has produced differing
results. Lopez, Shah and Altobello (1994) found a strong negative regional elasticity of land in
agriculture to agricultural property taxes per acre in the Northeastern United States. These
findings provide support to the possible effectiveness of differential assessment programs. Parks
and Quimio (1996) found that changes in the tax rate had a relatively small effect in changing
land allocations in New Jersey. Likewise, the aggregate effect was not quantitatively significant.
Parks and Quimio suggest that there may be large differences in land allocation responsiveness
to property tax rates among states in the Northeast. In general, an increase in farm property taxes
will have a negative effect on farmland holdings and may be due to the fact that property taxes
decrease the value of land in agriculture. (Adelaja and Schilling 1998). For the purposes of this
study, farm property taxes are assumed to have a negative impact on the demand for farmland.
Empirical Result
The analysis begins with an estimation of the base model of farmland demand using the
conceptualized determinants of farmland investment value. Once the fundamental relationships
are confirmed, the objective is then to estimate the speculative model of farmland demand in
order to account for the impact of speculation on farmland demand. The added variable for
speculation will indicate if there is a change in investor behavior with respect to the differential
between the rate of appreciation and the risk free rate. Once the speculative farmland demand
model is estimated, the goal is to search for the threshold at which a change in farmland demand
behavior occurs. The analysis will also include a test of differential slope and intercept to
determine if there is a shift in demand as a result of speculation. Finally, a series of diagnostic
tests are used to ensure the reliability of the model and to test for structural differences.
13
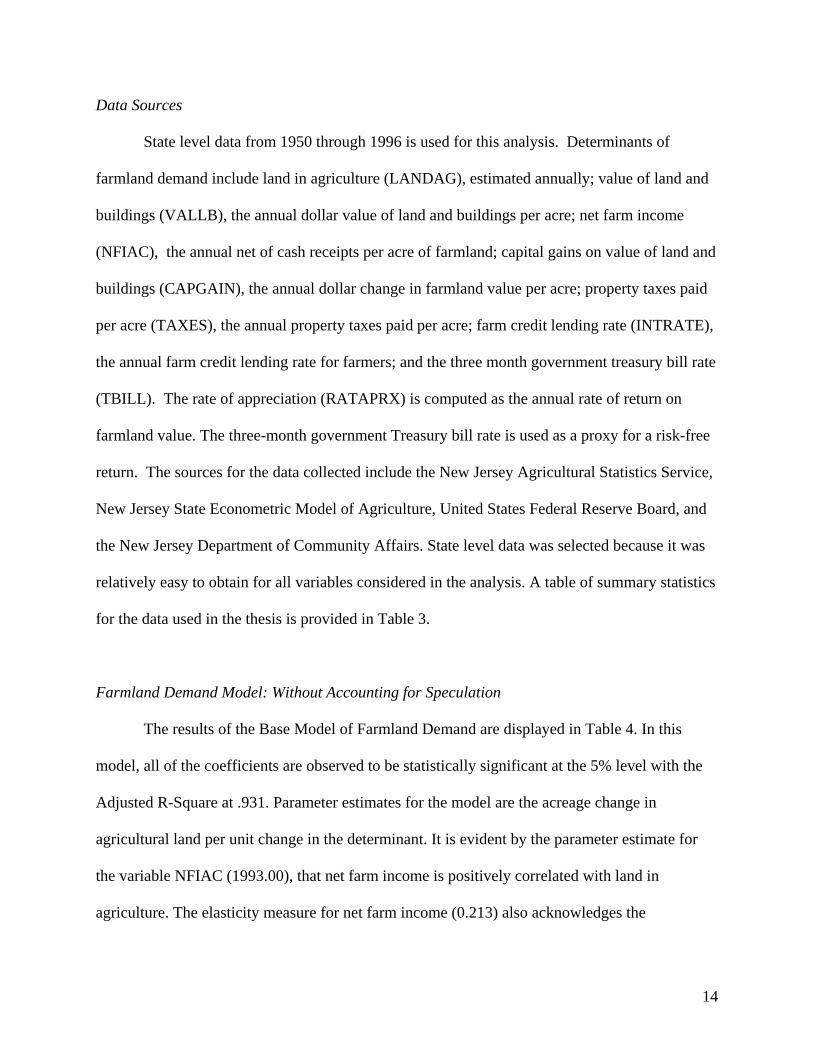
Data Sources
State level data from 1950 through 1996 is used for this analysis. Determinants of
farmland demand include land in agriculture (LANDAG), estimated annually; value of land and
buildings (VALLB), the annual dollar value of land and buildings per acre; net farm income
(NFIAC), the annual net of cash receipts per acre of farmland; capital gains on value of land and
buildings (CAPGAIN), the annual dollar change in farmland value per acre; property taxes paid
per acre (TAXES), the annual property taxes paid per acre; farm credit lending rate (INTRATE),
the annual farm credit lending rate for farmers; and the three month government treasury bill rate
(TBILL). The rate of appreciation (RATAPRX) is computed as the annual rate of return on
farmland value. The three-month government Treasury bill rate is used as a proxy for a risk-free
return. The sources for the data collected include the New Jersey Agricultural Statistics Service,
New Jersey State Econometric Model of Agriculture, United States Federal Reserve Board, and
the New Jersey Department of Community Affairs. State level data was selected because it was
relatively easy to obtain for all variables considered in the analysis. A table of summary statistics
for the data used in the thesis is provided in Table 3.
Farmland Demand Model: Without Accounting for Speculation
The results of the Base Model of Farmland Demand are displayed in Table 4. In this
model, all of the coefficients are observed to be statistically significant at the 5% level with the
Adjusted R-Square at .931. Parameter estimates for the model are the acreage change in
agricultural land per unit change in the determinant. It is evident by the parameter estimate for
the variable NFIAC (1993.00), that net farm income is positively correlated with land in
agriculture. The elasticity measure for net farm income (0.213) also acknowledges the
14
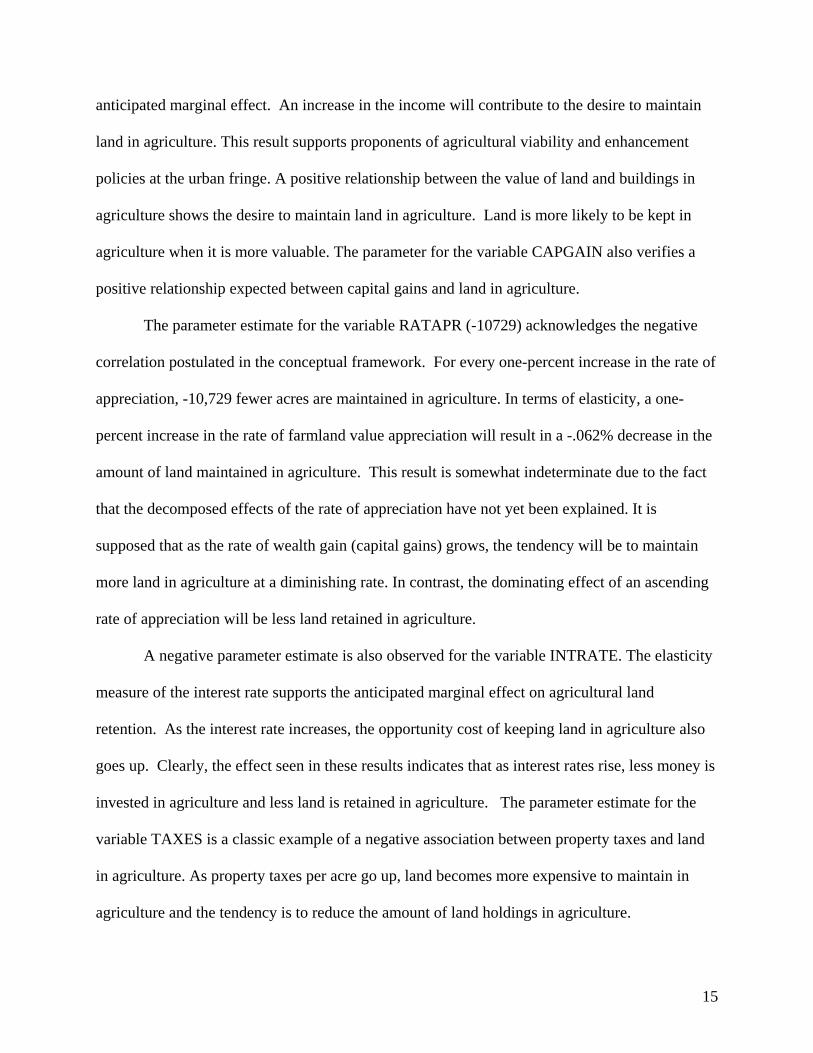
anticipated marginal effect. An increase in the income will contribute to the desire to maintain
land in agriculture. This result supports proponents of agricultural viability and enhancement
policies at the urban fringe. A positive relationship between the value of land and buildings in
agriculture shows the desire to maintain land in agriculture. Land is more likely to be kept in
agriculture when it is more valuable. The parameter for the variable CAPGAIN also verifies a
positive relationship expected between capital gains and land in agriculture.
The parameter estimate for the variable RATAPR (-10729) acknowledges the negative
correlation postulated in the conceptual framework. For every one-percent increase in the rate of
appreciation, -10,729 fewer acres are maintained in agriculture. In terms of elasticity, a one-
percent increase in the rate of farmland value appreciation will result in a -.062% decrease in the
amount of land maintained in agriculture. This result is somewhat indeterminate due to the fact
that the decomposed effects of the rate of appreciation have not yet been explained. It is
supposed that as the rate of wealth gain (capital gains) grows, the tendency will be to maintain
more land in agriculture at a diminishing rate. In contrast, the dominating effect of an ascending
rate of appreciation will be less land retained in agriculture.
A negative parameter estimate is also observed for the variable INTRATE. The elasticity
measure of the interest rate supports the anticipated marginal effect on agricultural land
retention. As the interest rate increases, the opportunity cost of keeping land in agriculture also
goes up. Clearly, the effect seen in these results indicates that as interest rates rise, less money is
invested in agriculture and less land is retained in agriculture. The parameter estimate for the
variable TAXES is a classic example of a negative association between property taxes and land
in agriculture. As property taxes per acre go up, land becomes more expensive to maintain in
agriculture and the tendency is to reduce the amount of land holdings in agriculture.
15
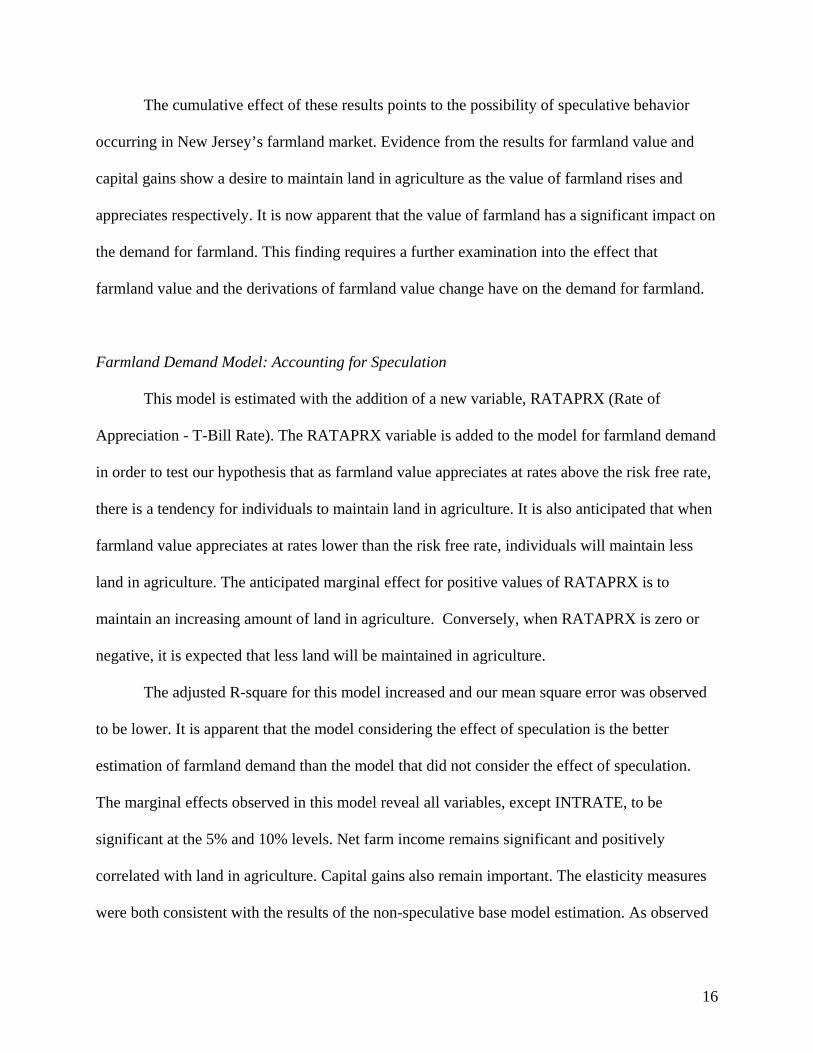
The cumulative effect of these results points to the possibility of speculative behavior
occurring in New Jersey’s farmland market. Evidence from the results for farmland value and
capital gains show a desire to maintain land in agriculture as the value of farmland rises and
appreciates respectively. It is now apparent that the value of farmland has a significant impact on
the demand for farmland. This finding requires a further examination into the effect that
farmland value and the derivations of farmland value change have on the demand for farmland.
Farmland Demand Model: Accounting for Speculation
This model is estimated with the addition of a new variable, RATAPRX (Rate of
Appreciation - T-Bill Rate). The RATAPRX variable is added to the model for farmland demand
in order to test our hypothesis that as farmland value appreciates at rates above the risk free rate,
there is a tendency for individuals to maintain land in agriculture. It is also anticipated that when
farmland value appreciates at rates lower than the risk free rate, individuals will maintain less
land in agriculture. The anticipated marginal effect for positive values of RATAPRX is to
maintain an increasing amount of land in agriculture. Conversely, when RATAPRX is zero or
negative, it is expected that less land will be maintained in agriculture.
The adjusted R-square for this model increased and our mean square error was observed
to be lower. It is apparent that the model considering the effect of speculation is the better
estimation of farmland demand than the model that did not consider the effect of speculation.
The marginal effects observed in this model reveal all variables, except INTRATE, to be
significant at the 5% and 10% levels. Net farm income remains significant and positively
correlated with land in agriculture. Capital gains also remain important. The elasticity measures
were both consistent with the results of the non-speculative base model estimation. As observed
16
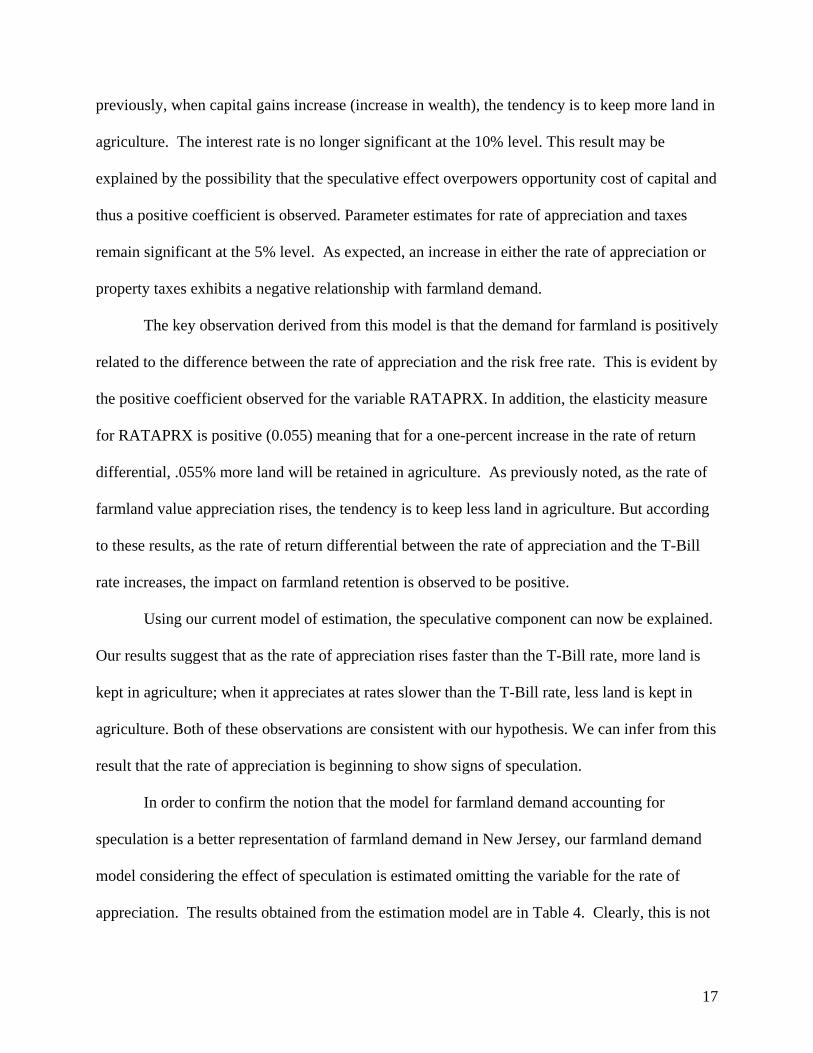
previously, when capital gains increase (increase in wealth), the tendency is to keep more land in
agriculture. The interest rate is no longer significant at the 10% level. This result may be
explained by the possibility that the speculative effect overpowers opportunity cost of capital and
thus a positive coefficient is observed. Parameter estimates for rate of appreciation and taxes
remain significant at the 5% level. As expected, an increase in either the rate of appreciation or
property taxes exhibits a negative relationship with farmland demand.
The key observation derived from this model is that the demand for farmland is positively
related to the difference between the rate of appreciation and the risk free rate. This is evident by
the positive coefficient observed for the variable RATAPRX. In addition, the elasticity measure
for RATAPRX is positive (0.055) meaning that for a one-percent increase in the rate of return
differential, .055% more land will be retained in agriculture. As previously noted, as the rate of
farmland value appreciation rises, the tendency is to keep less land in agriculture. But according
to these results, as the rate of return differential between the rate of appreciation and the T-Bill
rate increases, the impact on farmland retention is observed to be positive.
Using our current model of estimation, the speculative component can now be explained.
Our results suggest that as the rate of appreciation rises faster than the T-Bill rate, more land is
kept in agriculture; when it appreciates at rates slower than the T-Bill rate, less land is kept in
agriculture. Both of these observations are consistent with our hypothesis. We can infer from this
result that the rate of appreciation is beginning to show signs of speculation.
In order to confirm the notion that the model for farmland demand accounting for
speculation is a better representation of farmland demand in New Jersey, our farmland demand
model considering the effect of speculation is estimated omitting the variable for the rate of
appreciation. The results obtained from the estimation model are in Table 4. Clearly, this is not
17
a better estimation of farmland demand than the previous estimation (adjusted R-Square is
.9237). The insignificant parameter estimate for the rate of return differential suggests that
excess returns from farmland are not the dominant effect in the total demand for farmland in
New Jersey. It is evident that the inclusion of the productive use demand and the speculative
demand is necessary to observe the demand for farmland in New Jersey.
Farmland Demand Model: Test of Differential Intercept and Differential Slope
The dummy variable D1 is created for all observations where a positive difference
between the rate of appreciation and the T-Bill rate occurs. This variable will indicate if there is
a differential intercept between those observations and all observations of the rate of return
differential. The model also includes a variable for differential slope (D1RAT). D1RAT is
simply the dummy variable D1 multiplied by RATAPRX. The coefficient derived from the
differential slope variable D1RAT will show evidence of a shift in demand.
The estimation of the dummy variable coefficient D1 is observed to be positive and
significant. This indicates a differential intercept for the total demand for farmland accounting
for speculation. For rates of appreciation in excess or above the T-Bill rate, speculation has the
effect increasing farmland holdings. Conversely, when speculation is introduced to the demand
at rates of appreciation below the T-Bill rate, the effect is a decrease in the amount of land held
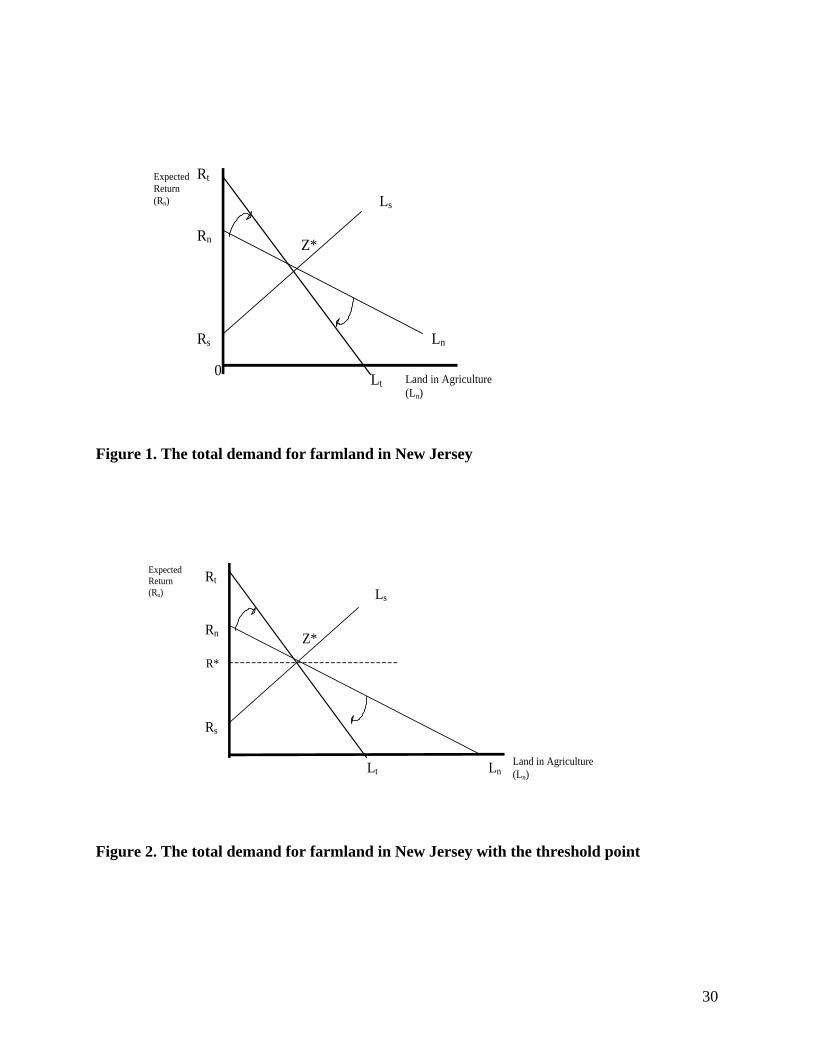
in agriculture. We observe a shift of the total demand curve via the higher intercept at Rt. A
graphical representation of the shift in demand is shown below in Figure 1. The productive use
demand for farmland is represented by the curve RnLn and the speculative demand for farmland
is represented by the line RsLs. The observed impact of the speculation is captured by a pivotal
shift of productive use demand to RtLt,. This is known as the total demand for farmland.
18

The results for the variable D1RAT indicate that there still is an inverse relationship
between the rate of appreciation and land in agriculture. We can infer from these results that
speculation is present, not only for observations where the rate of appreciation is in excess of the
T-Bill rate, but also for observations where the rate of appreciation is below the T-Bill rate.
Farmland Demand Model: Test of Symmetry
A test for the symmetry will enable us to determine whether or not the land use demand
is different for observations above and below the threshold point. A dummy variable
(SYMMETRY) is created for observations where the rate of return differential is above zero.
Observations where the differential is found to be zero is the hypothesized threshold point. The
use of the dummy variable will answer the question concerning curvature above and below the
threshold point. A significant result would indicate that for observations above the threshold
point, the magnitude in the response to a change in the rate of return differential is discernibly
different from observations below the threshold point.
The results of the symmetry test (Table 5) indicate that there is no difference in total
demand behavior above or below the threshold point. The sign of the demand curve remains the
same. Based on this observation, the added benefit of being above or below the switch point is
considered to be symmetrical. When observations for the rate of return differential are above the
zero threshold then the tendency is to keep more land in agriculture, and for those observations
below the threshold, the tendency is to keep less land in agriculture. It is purely market driven,
meaning that there is no ‘stickyness’ (differential behavior). If there had been stickyness, then
the symmetry would have been significant. The combined demand response is shown in Figure
2. The productive use demand for farmland is shown by RnLn and the speculative demand by
19
RsLs. The net effect of the positively sloped speculative demand component and the negatively
sloped productive use demand for farmland is represented by the line RtLt (total demand). R* is
the hypothesized threshold point where the difference between the rate of appreciation and the
risk free rate is equal to zero. Z* is the point at which speculative demand and the productive
use demand for farmland is equal.
If the rate of appreciation is very low, the speculative effect prompts an individual to
keep less land in agriculture. However, a speculator is more likely to maintain land in agriculture
at high rates of appreciation In essence, there is a change in behavior at high rates of
appreciation; but we do not observe a specific switch point. Instead, we acknowledge the finding
of the test for structural change, and speculative behavior is found to be continuously present but
becomes very pronounced at high rates of appreciation as opposed to speculation taking effect at
a specific point. The symmetry test tells us that low ranges of the rate of return differential have
the same slope as high ranges. Therefore, the speculative component may impact the total
demand for farmland but it never dominates the overall relationship.
Test for Structural Change at High Rates of Return
There is evidence of a speculative component in the total demand for farmland. The
challenge then is to determine if the speculative behavior is more acute for higher rate of return
differentials. This objective is accomplished by breaking down the difference between rate of
appreciation and the risk free rate into pivot points. The analysis will allow for the detection of
demand behavior changes when rate of appreciation exceeds the risk free rate by a specified
range. It will show the resistance in the market due to risk and whether the transactions cost will
hinder farmland demand. The dummy variable HDIFF is incorporated into the model to represent
20
each incremental change in the rate of return differential. Separate regressions are run for
observations where the rate of return differential is greater than: .5%, .7%, 1%, 1.3%, 1.5%,
2.0% and 3.0%.
Table 5 showed the results of the test for structural change. None of the parameter
estimates for incremental dummies had significant coefficients. This result supports the finding
that speculative behavior is present in all cases and is not more acute at high rates of
appreciation. The results from the estimation of model show that none of the other pivot points is
a better switch point than the T-Bill rate and that the ideal pivot point is where the rate of
appreciation equals the T-Bill rate. The results also reveal that there is no added benefit to
estimating a model where the switch point is presumed to be higher.
It is apparent that speculative behavior of individuals manifests itself by hoarding
farmland at rates of appreciation that exceed the risk free rate. Speculative behavior by
individuals also manifests itself by selling farmland at rates of appreciation below the T-Bill rate.
The net result is that the speculative and productive use demand components balance out to
create a negatively sloped total demand for farmland alluded to by Lopez, Adelaja and Andrews
and Parks and Quimio.
Conclusion
The general aim of this research is to explore the possibility of speculative behavior in
the demand for farmland in New Jersey. More specifically, this study focuses on those factors
that induce speculative behavior exhibited by farmland investors. Previous studies have already
identified or acknowledged the existence of speculative forces occurring in New Jersey’s
farmland market (Lopez, Adelaja and Andrews 1988, Parks and Quimio 1996). This study has
21
built on the work of past studies by providing supportive evidence of speculation occurring in
New Jersey’s farmland market. The regression results of this study have shown that the demand
for agricultural land in New Jersey is directly affected by the speculative behavior of farmland
market participants.
Two conceptual models of farmland demand in New Jersey are developed using the
determinants of farmland demand forwarded by Lopez, Adelaja and Andrews and Parks and
Quimio. Initially, a base model is developed to capture the net demand for farmland in New
Jersey. This model includes variables for net farm income, value of land and buildings, capital
gains, rate of appreciation, interest rate (opportunity cost of capital) and property taxes. Another
model is specified to account for the impact of speculation in farmland demand. The only
difference between this model and the base model is the inclusion of a rate of return differential
that captures the difference between the risk free rate (T-Bill rate) and the rate of appreciation of
land. This allows us to measure the speculative component.
The empirical estimation of the conceptual models developed for farmland demand is
conducted. Based on the results obtained from the regressions, a comparison is made between the
base model of farmland demand and the speculative model of farmland demand. A tests of
differential intercept and differential slope is performed to determine if demand response varies
significantly for observations above and below the threshold rate of return differential. Finally,
two diagnostic tests are performed in order to ensure the reliability of the results.
The empirical estimations of the conceptualized models indicate that the model
accounting for speculation was a better representation of demand for farmland in New Jersey
than the model that did not consider the effect of speculation. In both models, the overall effect
of an increase in the rate of appreciation was negative. However, in the model accounting for
22
speculation, the rate of return differential has a positively signed coefficient suggesting the
existence of a speculative demand that is positively related to the rate of return from farmland
value appreciation. In addition, the speculative effect offsets the inverse relationship between the
productive use demand and the rate of return from farmland value appreciation.
The empirical analysis also searches for alternative threshold points at which there is a
change in demand response with respect to rates of appreciation that exceed the risk free rate.
The purpose is to pinpoint the exact point where speculative farmland holding begins to occur.
Based on the results of the regression, an alternative threshold point could not be found to exist.
Instead, speculation is determined to exist at observations above and below the threshold point;
but becomes more pronounced at rates of appreciation that exceed the risk free T-Bill rate. A
test of differential slope and differential intercept is also performed to determine if speculation is
always present in the demand for farmland. The results of this test show that the total demand
for land estimated by the speculative model is negatively sloped and is the net of a positively
sloped speculative demand component and a negatively sloped productive use component.
Two diagnostic tests are also performed to ensure the reliability of the results. The first
diagnostic test is used to detect structural changes in observations of the rate of return
differential. The results from this test indicate that there is no structural change for rates of
appreciation that exceed the risk free rate by a specified range. The second diagnostic tests the
symmetry of the farmland demand model that accounts for speculation. The results of the
symmetry test verify that the curvatures of the demand functions remain similar at observations
above and below the threshold point.
It is now apparent that speculation is a major contributor to the desire to maintain land in
agriculture. One must bear in mind that farmland in New Jersey can no longer be viewed only as
23

an input to production. The results of this study have generated supportive evidence that in
addition to its productive use, farmland in New Jersey also exhibits similar characteristics to that
of a financial asset. Therefore, the means by which farmland demand is modeled in New Jersey
and other near-urban areas may need to account for the effects of speculation. More attention
needs to be placed on the rising values of farmland and the increasing opportunity costs
associated with maintaining land in agriculture. A failure to properly compensate for these
factors will generate misleading information and less effective farmland retention policies.
Further research is needed in this area to better understand the causes of speculative
behavior on the part of individuals. For example, an examination of the incentives for farming
(e.g. farmland assessment) may help determine the underlying causes of speculation in New
Jersey’s farmland market. This study has provided supportive evidence for the existence of a
speculative component contributing to New Jersey’s demand for farmland, the direction now is
to explore other possible implications of speculation in other agricultural markets and segments.
24
References
Adelaja, A and B Schilling. 1998. “Farmland Demand at the Urban Fringe: Revisiting
Hypotheses on Farmland Assessment, Impermanence Syndrome and Gentleman
Farming.” Publication Forthcoming June 1998.
Barry, Peter J. 1980. “Capital Asset Pricing and Farm Real Estate.” American Journal of
Agricultural Economics. 62 (3): 549-553.
Berry, David. 1978. “Effects of Urbanization on Agricultural Activities.” Growth and Change.
9 (3):1-8
Firman, Tommy. 1997. “Land Conversion and Urban Development in the Northern Region of
West Java Indonesia.” Urban Studies 34 (7):1027-1046
Guth, Michael A. 1994. Speculative Behavior and the Operation of Competitive Markets Under
Uncertainty. Ashgate Publishers: Brookfield, VT
Lee, Nancy S. 1993. “Analysis of Factors Influencing Fair Market and Restricted Land Use
Values of Farmland in New Jersey’s Purchase of Development Rights Program Via
Hedonic Pricing Models” MS Thesis, Department of Agricultural Economics and
Marketing, Rutgers University; October 1993.
Leibowitz, Martin L; Kogelman, Stanley; Bader, Lawrence N; and Dravid,
Anjay R. 1994. “Interest Rate Sensitive Asset Allocation.” Journal of Portfolio
Management 20 (3): 8-15
Lopez, R., A. Adelaja and M. Andrews. 1988. “The Effects of Suburbanization on Agriculture.”
American Journal of Agricultural Economics May 1988: 346-358.
Lopez, R., F. Shah, and M. Altobello. 1994. “Amenity Benefits and the Optimal Allocation of
Land.” Land Economics 70(1):53-62
25
Morris, Douglas E. 1978. “Farmland Values and Urbanization.” Agricultural Economics
Research 30 (1):44-47. January 1978.
Parks, Peter J. and Wilma Rose H. Quimo. 1996. “Preserving Agricultural Land with Farmland
Assesment: New Jersey as a Case Study.” Agricultural and Resource Economics Review
22-27
Schnitkey, Gary D., Robert Taylor, and Peter Barry. 1989. “Evaluating Farmland Investments
Considering Dynamic Stochastic Returns and Farmland Prices.” Western Journal of
Agricultural Economics 14 (1):143-156
26

Table 1. Land in Farms: 1000 Acres
Year United States New Jersey
1950 1,202,019 1770
1960 1,175,646 1460
1970 1,102,371 1060
1980 1,038,885 1020
1996 970,048 840
Source: New Jersey Agricultural Statistics. 1950-1997.
Table 2. Average Value of Land and Buildings: dollars per acre
Year United States New Jersey
1950 $ 76 $ 293
1960 116 528
1970 193 1092
1980 737 2947
1996 965 8172
Source: New Jersey Agricultural Statistics. 1950-1997.
27
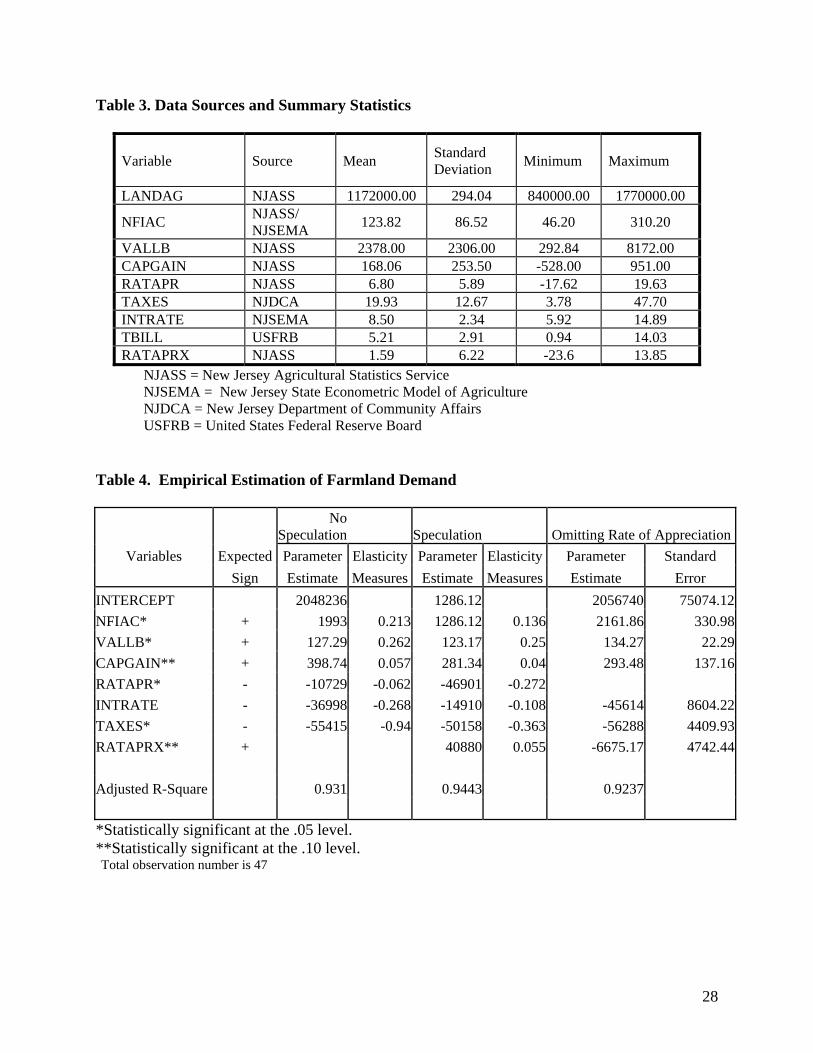
Table 3. Data Sources and Summary Statistics
Variable Source Mean Standard Deviation Minimum Maximum
LANDAG NJASS 1172000.00 294.04 840000.00 1770000.00
NFIAC NJASS/ NJSEMA 123.82 86.52 46.20 310.20
VALLB NJASS 2378.00 2306.00 292.84 8172.00 CAPGAIN NJASS 168.06 253.50 -528.00 951.00 RATAPR NJASS 6.80 5.89 -17.62 19.63 TAXES NJDCA 19.93 12.67 3.78 47.70 INTRATE NJSEMA 8.50 2.34 5.92 14.89 TBILL USFRB 5.21 2.91 0.94 14.03 RATAPRX NJASS 1.59 6.22 -23.6 13.85
NJASS = New Jersey Agricultural Statistics Service NJSEMA = New Jersey State Econometric Model of Agriculture NJDCA = New Jersey Department of Community Affairs USFRB = United States Federal Reserve Board
Table 4. Empirical Estimation of Farmland Demand
No
Speculation Speculation Omitting Rate of AppreciationVariables Expected Parameter Elasticity Parameter Elasticity Parameter Standard
Sign Estimate Measures Estimate Measures Estimate Error INTERCEPT 2048236 1286.12 2056740 75074.12NFIAC* + 1993 0.213 1286.12 0.136 2161.86 330.98VALLB* + 127.29 0.262 123.17 0.25 134.27 22.29CAPGAIN** + 398.74 0.057 281.34 0.04 293.48 137.16RATAPR* - -10729 -0.062 -46901 -0.272 INTRATE - -36998 -0.268 -14910 -0.108 -45614 8604.22TAXES* - -55415 -0.94 -50158 -0.363 -56288 4409.93RATAPRX** + 40880 0.055 -6675.17 4742.44 Adjusted R-Square 0.931 0.9443 0.9237 *Statistically significant at the .05 level. * Total observation number is 47
*Statistically significant at the .10 level.
28
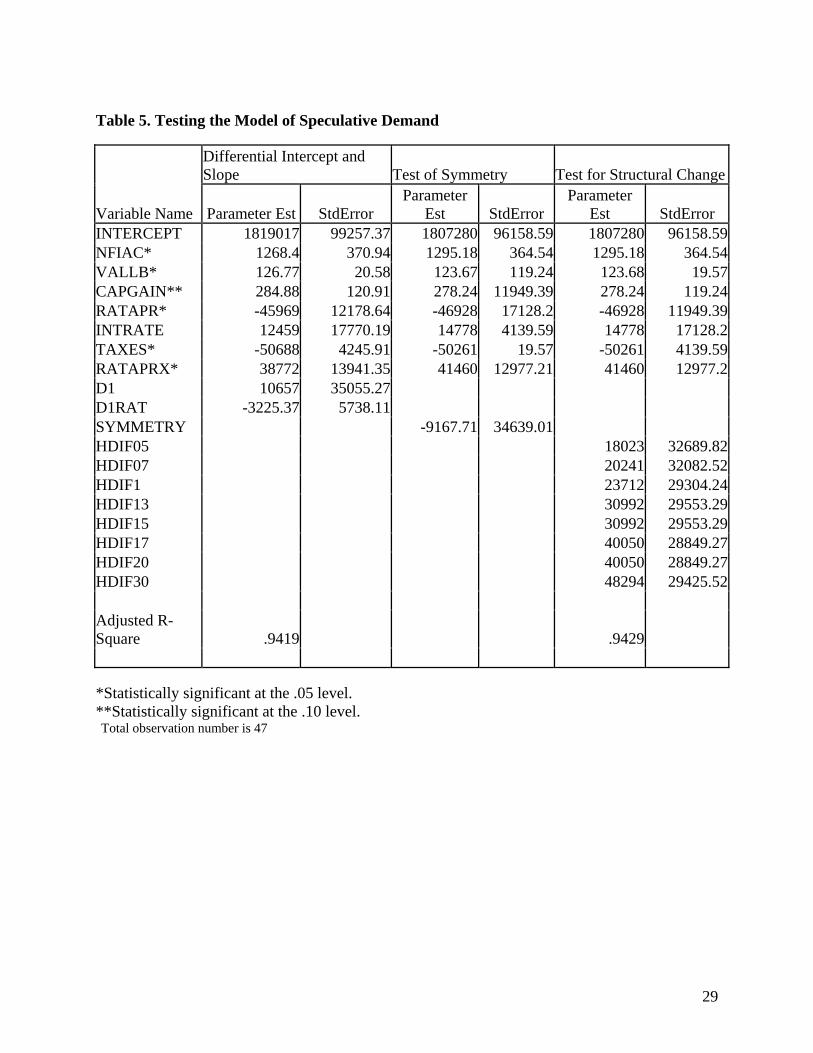
Table 5. Testing the Model of Speculative Demand
Differential Intercept and Slope Test of Symmetry Test for Structural Change
Variable Name Parameter Est StdError Parameter
Est StdError Parameter
Est StdError INTERCEPT 1819017 99257.37 1807280 96158.59 1807280 96158.59NFIAC* 1268.4 370.94 1295.18 364.54 1295.18 364.54VALLB* 126.77 20.58 123.67 119.24 123.68 19.57CAPGAIN** 284.88 120.91 278.24 11949.39 278.24 119.24RATAPR* -45969 12178.64 -46928 17128.2 -46928 11949.39INTRATE 12459 17770.19 14778 4139.59 14778 17128.2TAXES* -50688 4245.91 -50261 19.57 -50261 4139.59RATAPRX* 38772 13941.35 41460 12977.21 41460 12977.2D1 10657 35055.27 D1RAT -3225.37 5738.11 SYMMETRY -9167.71 34639.01 HDIF05 18023 32689.82HDIF07 20241 32082.52HDIF1 23712 29304.24HDIF13 30992 29553.29HDIF15 30992 29553.29HDIF17 40050 28849.27HDIF20 40050 28849.27HDIF30 48294 29425.52 Adjusted R-Square .9419 .9429 *Statistically significant at the .05 level. * Total observation number is 47
*Statistically significant at the .10 level.
29
Expected Return (Rn)
Land in Agriculture (Ln)
Rs
Ls
Rn
Ln
Lt
Rt
Z*
0
Figure 1. The total demand for farmland in New Jersey
Rs
Ls
Rn
LnLt
Rt
R*
Z*
Expected Return (Rn)
Land in Agriculture (Ln)
Figure 2. The total demand for farmland in New Jersey with the threshold point
30