Embed Size (px)
Citation preview
Testingourabilitytoaccuratelymeasurenitrificationratesintheoligotrophicocean:Doesaddingammoniumaffectthenitrifiercommunitycomposition?
CarlyBuchwaldMicrobialDiversity2011
Abstract
Inthismini‐projectI’vetestedtheeffectofaddingammoniumonthenitrifyingcommunityincoastalseawater.Waterwascollectedfrom22metersfromGreatHarbor,WoodsHoleMAandincubatedfor2dayswith3concentrationsofammonium(0,0.1and5µM).Ifoundthatthenitrifyingcommunitysignificantlychangedoverthe48hourtimeperiod.QuantitativePCRshowedthatthetherewasashiftfrom20%AOBtoAOAcommunitytoan80%AOBbytheendofincubationinthehighestammoniumaddition.Therewasn’tasignificantchangeintheAOBtoAOAratiowhennoammoniumor0.1µMammoniumwasadded.AlthoughtheAOBtoAOAratiodidnotchangetherewasstillashiftinspecificspeciesoforganisms,shownbyDGGEinallthreeincubations.Clonelibrariesfromthenoammoniumadditionalsoshowedthatararegroupoforganismsoutnumberedtheoriginal,morediverse,communitywithin48hours.
Introduction
Themostcommonmethodformeasuringnitrificationratesintheoceanistoincubatewithseawaterwith15Nlabeledammoniumfor24‐48hoursandthentomeasurethe15Ninthenitriteandnitrateproduced.Thismethodreliesontheabilitytoaddtracerlevelsofammoniumtonotdrasticallychangethechemicalenvironmentofthenitrifyingcommunity.Inmanyareasoftheoceanthisisimpossible.Ammonium,themostdesirednitrogencompoundintheocean,existsinverylowabundanceinmostofthewatercolumn.Manyoceanographerscontinuewiththeseratemeasurementsbyaddingthesmallamountsofammonium,althoughnottracelevelsandinevitablytheyarestimulatingthegrowthofanewandunnaturalnitrifyingcommunity.
Differentspeciesofnitrifiers,especiallybetweenbacterialandarchaeal,haveawiderangeofaffinitiestowardsammonium.Likely,byaddingammoniumtothesystemwearestimulatingthegrowthofcertainspeciesoverothers(Habbenaetal2009).Historicallyithasbeenmucheasiertoisolateammoniaoxidizingbacteria(AOB)becausetheyoutgrowammoniaoxidizingarchaea(AOA)inhighlevelsofammoniumandhaveafastergrowthrate.AlthoughAOAareinhigherabundanceinoligotrophicseawaterbecausethehaveahigheraffinityforammonium(Habbenaetaal,2009).
Inthisexperimentwewilltestwhetherdifferentammoniumadditionstooligotrophicseawaterwillaffectthenitrificationrateoverallaswellasthemicrobialcommunity,specificallytherelativeabundanceofAOAandAOB.
Methods
ExperimentalDesign
Forthisexperimentwaterwascollectedfrom22metersusinganiskinbottleonasmallboattiedtothebackoftheWHOIdockonJuly8,2011.5different4Lpolycarbonatebottleswerefilledwithseawater.Table1showsthebottlenamesandconditions.
Table1.
BottleName AddedLabeledAmmonium(µM)1a 0.11b 0.12a 52b 5
Control 0
Labeledammoniumwasaddedtobottlesimmediatelyaftersampling,within1hourofreturningtolaboratory.Thensubsamplesweretakenfromeachbottleinitiallyandat12,24and48hoursaftertheammoniumaddition.Eachsubsampleconsistedoffiltering200mLsplitontotwodifferent0.2µmisoporemembranefiltersandfrozenat‐80˚C.50mLofthefiltratewasalsocollectedformeasuringtheisotopesofnitriteandnitrate.Also15mLofseawaterfixedand3and10mLofwaterwerefilteredonto0.2µmisoporemembranefiltersforcellcounts.Alsobeforetheadditionoflabeledammoniumsampleswastakenformeasuringtheinitialnutrientconcentrations(ammonium,nitrite,andnitrate)oftheseawater.Thebottleswereincubatedinthelaboratory,withatempof22˚C,inthedarkforthe48hours.
DNAandRNAExtraction
Filterswereaddedto15mLfalcontubeswith6mLofextractionbuffer.Extractionbufferwasmadewith0.6mLofastockbuffer(250mMEDTAand100mMTrisHCl),30µLof20%SDS,60µL5MNaClandPCRgradewater.Beadswereaddedandthetubeswerebeadbeatedfor5minutesandthenplaceina60˚Cwaterbath.Afterbeingheatto60˚Ctubesweredroppedinliquidnitrogen.Theywereheatedandfrozen3times.ThelysisbufferwasnowwashedwithPCI(phenolchloroforminisoamylalcohol)andcentrifugedfor10minutesat5000rpm.ThePCIwaspouredoffandthelysisbufferwasaddedtoanewconicaltube.SamplesthatstilllookedcloudyafterfirstwashingwerewashedasecondtimewithPCI.NextthelysisbufferwasaddedtoanAmpliconultra‐4centrifugaldevicetocollecttheDNAonthefilter.TheAmplicontubeswerecentrifugedat3000rpmfor7minutes.Bufferhadtobeaddedmultipletimesbecausenotallthematerialcouldfitintothefiltertube.Oncethebufferwasfilteredthefilterswerewashed3timeswith1XTEcentrifugingbetweeneachwashing.ThevolumeofDNAleftinthetopofthefilterwasmeasuredasitwastransferredintoPCRtubesandputinthefreezer.
TheDNAwasthenrunonageltovisualizethatextractionwassuccessful.TheDNAwasalsothenquantifiedusingPicoGreenandafluorometer.1µLofDNAwasaddedwith198.5µLof1xTEand0.5µLPicoGreen.
QuantitativePCR(qPCR)
DNAsamplesweredilutedtenfoldpriortoPCRreaction.PCRreactionwassetupusingamastermixwhichincludedPicomaxxenzyme,Picomaxxextractionbuffer,SYBRgreen,dNTPs(aconcentrationofdivalentions),magnesiumchloride,DNAandprimers.qPCRwasdoneusing3differentprimers:1)amoAinarchaea,clusterA(Francisetal,2005;BemanandFrancis,2008)2)amoAinbacteria(Rotthauweetal,1997)and3)amoAinarchaea,clusterB(Francisetal,2005;BemanandFrancis,2006).StandardsforeachPCRproductwereobtainedfromCorneliaWuchteratWoodsHoleOceanographicInstitution(WHOI).Theywereplacedinathermocyclerusingatemperatureprogramof95˚Cforinitialmelting,58˚Cforprimerannhiling,72˚Cforprimerextensionand80˚Cforfluorescencemeasurement.Also,inhibitiontestswerecarriedoutwithE.coliandfoundthatthe1/10dilutionofourDNAextractdidnotcauseanyinhibition.
DenaturingGradientGelElectrophoresis(DGGE)andSequencing
DGGEwasperformedintheCoolenlaboratoryatWHOIonaIngenyPhorUsystem.Firsttheacrylimidegelwasmadewithagradientfrom20to70%ureumanddeionizedformamidesolutions.Thegelneeds3to4hourstosetupbeforerunning.TheDGGEchamberisfilledwith1xTAEbufferatpH8.Thegelisloadedwitha5µLofloadingdyeand5µLofthePCRproduct.ThePCRisdonewithaspecialreverseprimerwithaGCclamp.Thegelisrunat60˚Cand200Vforatleast5hours,butupto12hours.
Attheendoftherun,thegelisremovedandstainedfor20minutesusingSYBRgold(2µLin8mL1xTAE).Thenitisdestainedinwaterfor30minutes.Thebandsareviewedandphotographedonadarkreader.
Bandscanbeisolatedandsequencedbycuttingcarefullyandthenplacingin75µLof1xTEatpH8.Thebandsareplaced4˚CovernighttoeluteandthentheproductisreamplifiedusingPCRusingnormalprimers.ThisPCRproductwasthenpurifiedusingtheMinElutesystemandthenquantifiedonthenanodropspectrophotomer.TheDNAwasdilutedto20ng/µLandthensubmittedforSangersequencing.ThesesequencesareanalyzedbyBLASTinglocallytoafunctionalgenedatabaseforamoAdownloadedfromFunGene.
CloneLibraryConstructionandPhylogenicAnalysis
Iattemptedtoconstruct8differentclonelibraries,withonly2beingsuccessful.PCRproductsfromarchaealamoAandbacterialamoAfunctionalgeneprimerswerecutandpurifiedusinggelpurification.The8differentsamplesattemptedweretheinitialtimepointinthecontrolandthe348timepointsin1a,
2aandthecontrol,oneforeachcondition.OncetheDNAwaspurified,4µLofDNAwasaddedtoatubewith1µLofTOPOvectorand1µLofsaltsolution.Thesetubeswereallowedtositatroomtemperaturefor15‐30minutes.Then2µLoftheDNAmixturewasaddedto70µLofelectrocompetentE.colicells.Thecellsweretheneletroporatedat2250V.Immediatelyafterelectroporation250µLofcellswereaddedto250µLofSOCmediuminatube.Thetubewasplacedontheshakerfor1hourandthen2and20µLaliquotswereplatedonLBplateswithampicillinandincubatedat37˚Cfor12‐18hours.Platesweremonitoreduntilthereweremanysmallcolonies.Oncetherewerecoloniestheywerepickedandplacedinagrowthblockwith1.2mLofsuperbroth.
NutrientMeasurements
NitritemeasurementsweremadeusingthespectrophotometricdescribedinStricklandandParsons1968.100µLofasulfanilamidereagent(1gsulfanilamidein100mL10%HCl)and100µLof1‐naphthylethylenediaminereagent(0.1gin100mLwater)wereaddedtoa2mLsample.Standardswereruninparallelatconcentrationsof0,0.25,0.5,1and5µM.Standardsweremadeusingsodiumnitritestocksolutionvolumetrically. Ammoniameasurementswerealsomadespectrophotometricallyusingthephenolmethod.100µLofphenol,100µLnitroprussideand200µLofasodiumcitrateandbleach(5:1)reagentwereaddedtoa5mLsamples.Standardsofconcentrations0,0.1,.2,.5,1,2,and5µMwereruninparallel.Thedetectionofthismethodwasonlyabout0.2µMsincetherewasablankofatleast0.1 µM.CatalyzedAutoReporterDepositionFluorescenceInSituHybridization(CARDFISH)
Filterswith3mLoffixedcellswerefirstembeddedin0.1%agarose.Theneachfilterwascutand2smallpieceswereusedforFISHwithaneubacteriaprobe(Eub338,Eub338II,andEub338III)andacrenarchaealprobe(Cren537,Cren554).Forthebacterialprobethefilterwaspermeabilizedinlysozyme(100mglysozyme,1000µL1MTrisHCl,1000µL0.5MEDTA,8mLwater)at40˚Cfor1hour.Forthecrenarchaealprobethefilterwaspermeabilizedinproteinase‐K(100µLproteinase‐Kand1mL1MTrisHCland1mL0.5MEDTAand8mLwater).Followingpermeabilizationfilterswereaddedto0.01MHClfor20‐25minutes,andthenwashedtwiceinwater.Thenfiltersweredippedin95%ethanolanddried.Hybridizationwasdonein0.7mLeppindorftubes.300µLofhybridizationbufferand15µLofprobewereaddedtothetubes.Theywerehybridizedat35˚Cfor12to15hoursinthedark.
FilterswerethenmountedonaslideusingaDAPImountingsolution.Foreachslide10gridsof0.1mmwerecountedforDAPIandbothprobesat100XonaZeissmicroscope.
ResultsandDiscussionHarborwaterchemicalcomposition
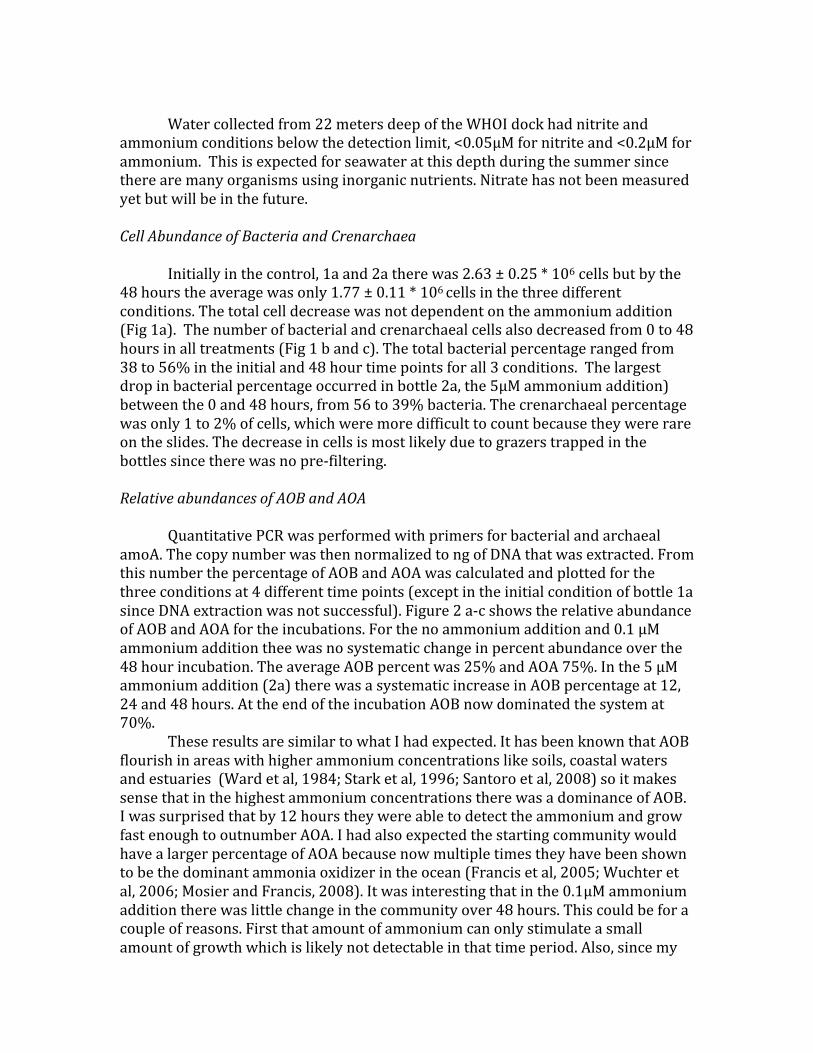
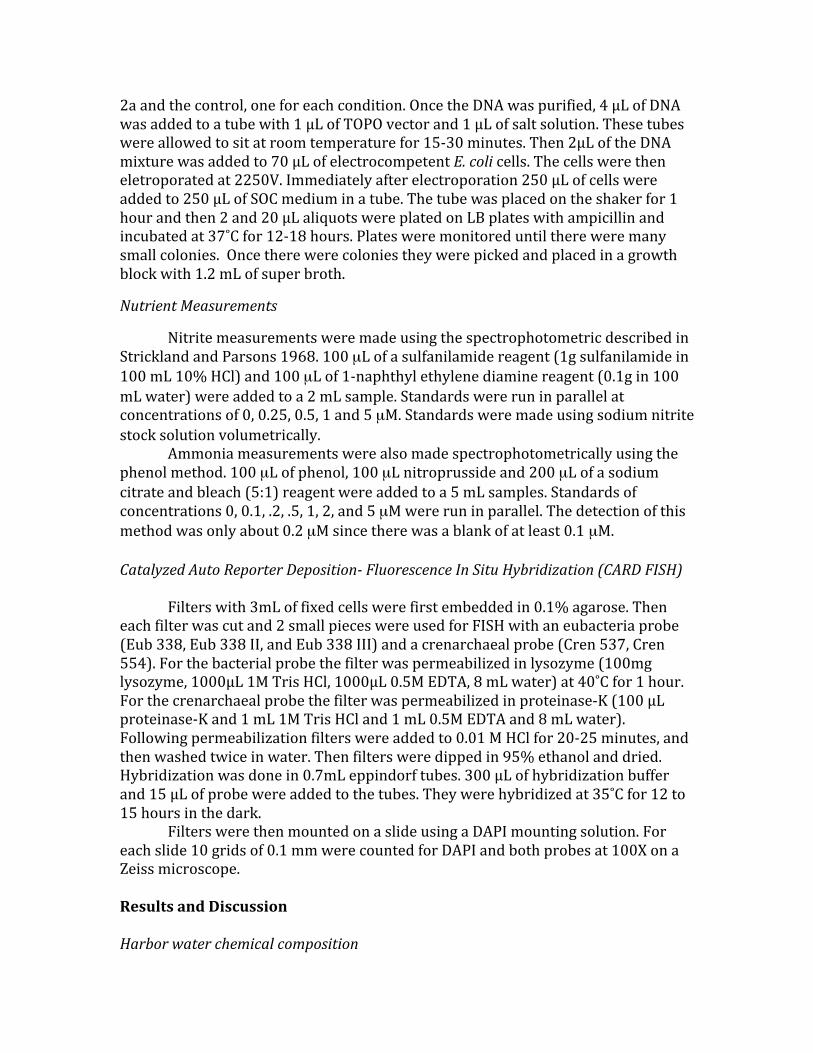
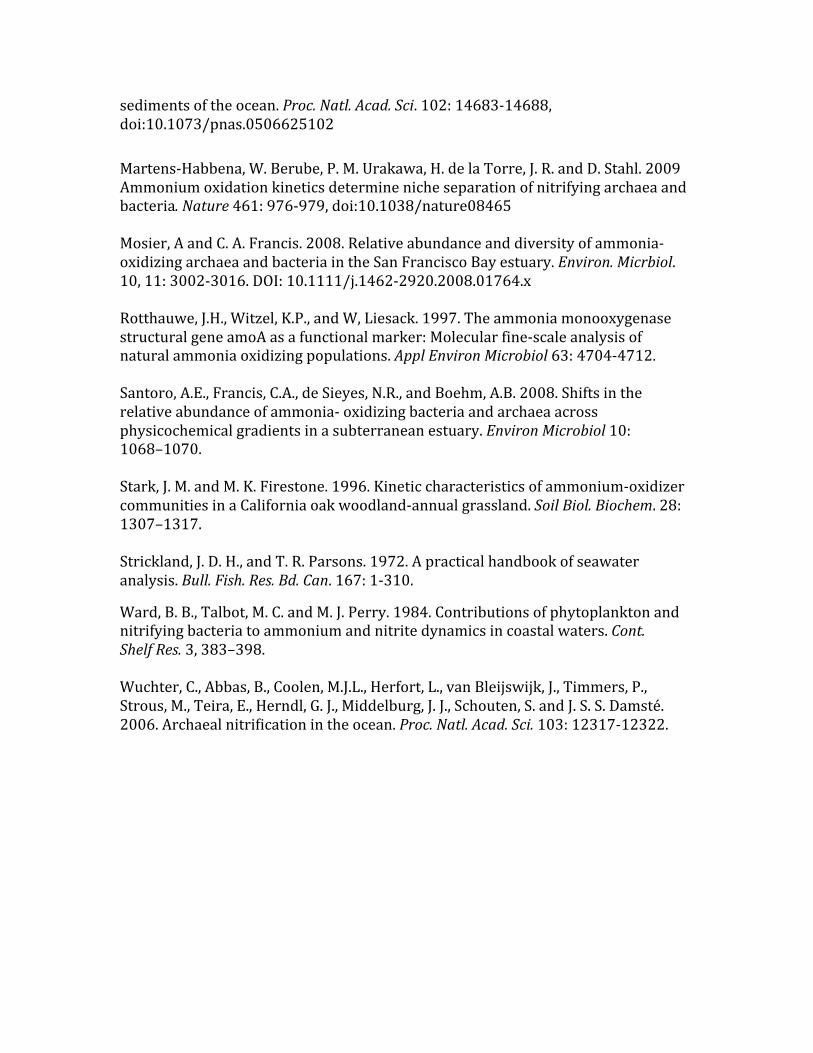
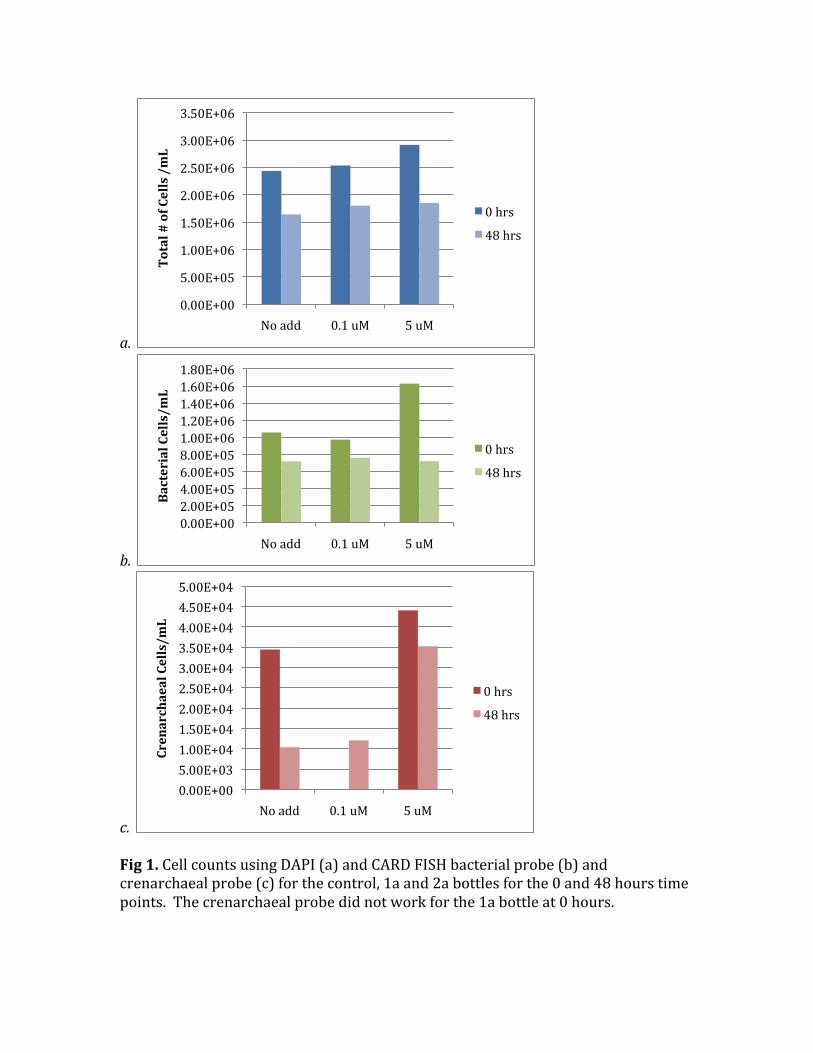
Watercollectedfrom22metersdeepoftheWHOIdockhadnitriteandammoniumconditionsbelowthedetectionlimit,<0.05µMfornitriteand<0.2µMforammonium.Thisisexpectedforseawateratthisdepthduringthesummersincetherearemanyorganismsusinginorganicnutrients.Nitratehasnotbeenmeasuredyetbutwillbeinthefuture.CellAbundanceofBacteriaandCrenarchaea Initiallyinthecontrol,1aand2atherewas2.63±0.25*106cellsbutbythe48hourstheaveragewasonly1.77±0.11*106cellsinthethreedifferentconditions.Thetotalcelldecreasewasnotdependentontheammoniumaddition(Fig1a).Thenumberofbacterialandcrenarchaealcellsalsodecreasedfrom0to48hoursinalltreatments(Fig1bandc).Thetotalbacterialpercentagerangedfrom38to56%intheinitialand48hourtimepointsforall3conditions.Thelargestdropinbacterialpercentageoccurredinbottle2a,the5µMammoniumaddition)betweenthe0and48hours,from56to39%bacteria.Thecrenarchaealpercentagewasonly1to2%ofcells,whichweremoredifficulttocountbecausetheywererareontheslides.Thedecreaseincellsismostlikelyduetograzerstrappedinthebottlessincetherewasnopre‐filtering.RelativeabundancesofAOBandAOA QuantitativePCRwasperformedwithprimersforbacterialandarchaealamoA.ThecopynumberwasthennormalizedtongofDNAthatwasextracted.FromthisnumberthepercentageofAOBandAOAwascalculatedandplottedforthethreeconditionsat4differenttimepoints(exceptintheinitialconditionofbottle1asinceDNAextractionwasnotsuccessful).Figure2a‐cshowstherelativeabundanceofAOBandAOAfortheincubations.Forthenoammoniumadditionand0.1µMammoniumadditiontheewasnosystematicchangeinpercentabundanceoverthe48hourincubation.TheaverageAOBpercentwas25%andAOA75%.Inthe5µMammoniumaddition(2a)therewasasystematicincreaseinAOBpercentageat12,24and48hours.AttheendoftheincubationAOBnowdominatedthesystemat70%. TheseresultsaresimilartowhatIhadexpected.IthasbeenknownthatAOBflourishinareaswithhigherammoniumconcentrationslikesoils,coastalwatersandestuaries(Wardetal,1984;Starketal,1996;Santoroetal,2008)soitmakessensethatinthehighestammoniumconcentrationstherewasadominanceofAOB.Iwassurprisedthatby12hourstheywereabletodetecttheammoniumandgrowfastenoughtooutnumberAOA.IhadalsoexpectedthestartingcommunitywouldhavealargerpercentageofAOAbecausenowmultipletimestheyhavebeenshowntobethedominantammoniaoxidizerintheocean(Francisetal,2005;Wuchteretal,2006;MosierandFrancis,2008).Itwasinterestingthatinthe0.1µMammoniumadditiontherewaslittlechangeinthecommunityover48hours.Thiscouldbeforacoupleofreasons.Firstthatamountofammoniumcanonlystimulateasmallamountofgrowthwhichislikelynotdetectableinthattimeperiod.Also,sincemy
methodformeasuringammoniumhadadetectionlimitgreaterthan0.1µMIcan’tbesurethattheammoniumintheoceanwasalreadyhigherthan0.1µM.Communitycompositionchange
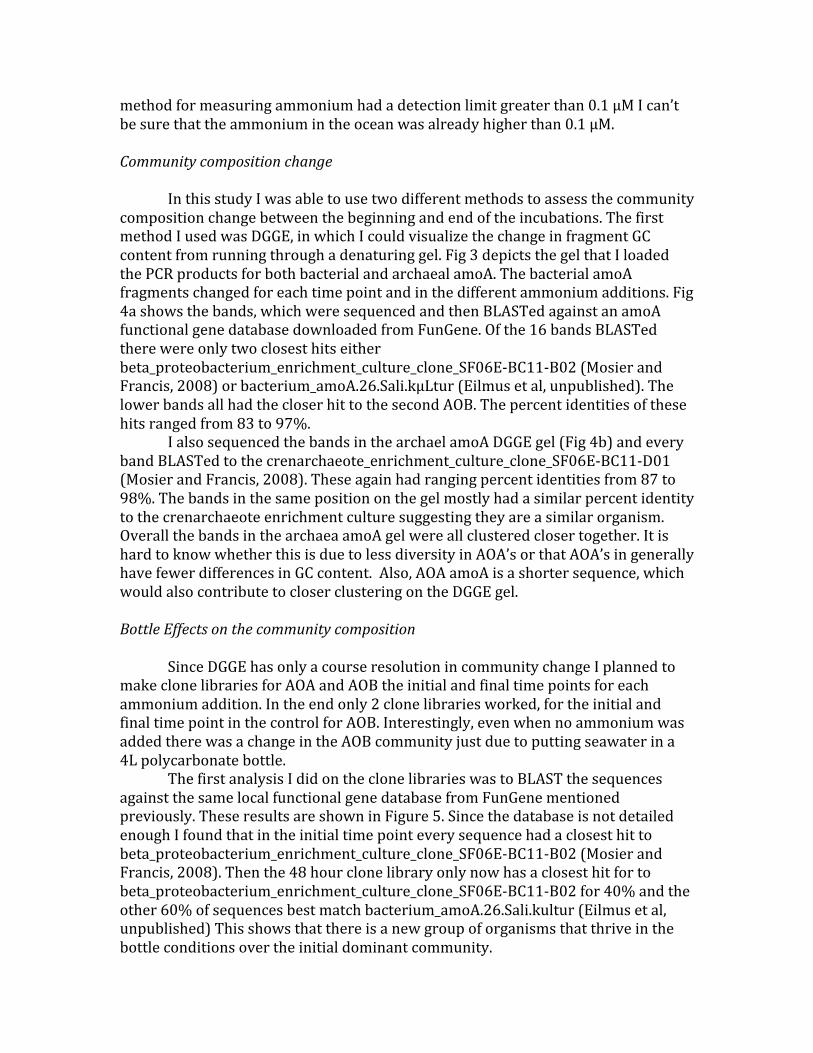
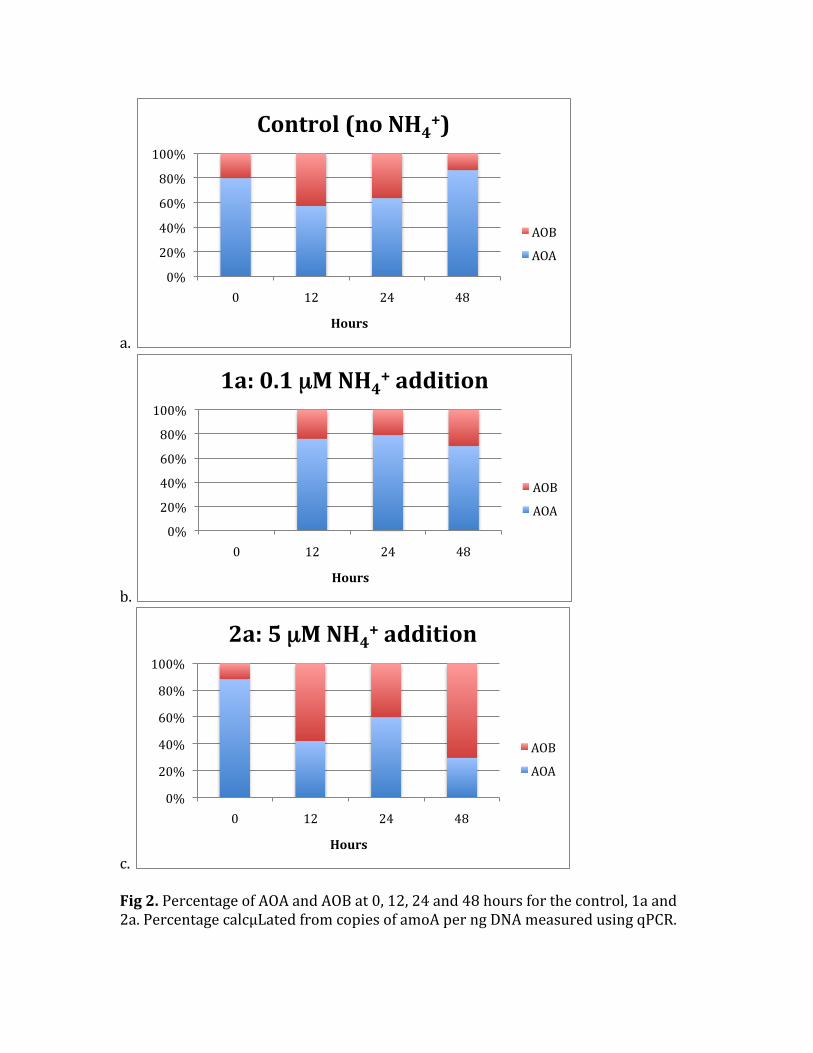
InthisstudyIwasabletousetwodifferentmethodstoassessthecommunitycompositionchangebetweenthebeginningandendoftheincubations.ThefirstmethodIusedwasDGGE,inwhichIcouldvisualizethechangeinfragmentGCcontentfromrunningthroughadenaturinggel.Fig3depictsthegelthatIloadedthePCRproductsforbothbacterialandarchaealamoA.ThebacterialamoAfragmentschangedforeachtimepointandinthedifferentammoniumadditions.Fig4ashowsthebands,whichweresequencedandthenBLASTedagainstanamoAfunctionalgenedatabasedownloadedfromFunGene.Ofthe16bandsBLASTedtherewereonlytwoclosesthitseitherbeta_proteobacterium_enrichment_culture_clone_SF06E‐BC11‐B02(MosierandFrancis,2008)orbacterium_amoA.26.Sali.kµLtur(Eilmusetal,unpublished).ThelowerbandsallhadthecloserhittothesecondAOB.Thepercentidentitiesofthesehitsrangedfrom83to97%.
IalsosequencedthebandsinthearchaelamoADGGEgel(Fig4b)andeverybandBLASTedtothecrenarchaeote_enrichment_culture_clone_SF06E‐BC11‐D01(MosierandFrancis,2008).Theseagainhadrangingpercentidentitiesfrom87to98%.Thebandsinthesamepositiononthegelmostlyhadasimilarpercentidentitytothecrenarchaeoteenrichmentculturesuggestingtheyareasimilarorganism.OverallthebandsinthearchaeaamoAgelwereallclusteredclosertogether.ItishardtoknowwhetherthisisduetolessdiversityinAOA’sorthatAOA’singenerallyhavefewerdifferencesinGCcontent.Also,AOAamoAisashortersequence,whichwouldalsocontributetocloserclusteringontheDGGEgel.
BottleEffectsonthecommunitycomposition
SinceDGGEhasonlyacourseresolutionincommunitychangeIplannedtomakeclonelibrariesforAOAandAOBtheinitialandfinaltimepointsforeachammoniumaddition.Intheendonly2clonelibrariesworked,fortheinitialandfinaltimepointinthecontrolforAOB.Interestingly,evenwhennoammoniumwasaddedtherewasachangeintheAOBcommunityjustduetoputtingseawaterina4Lpolycarbonatebottle.
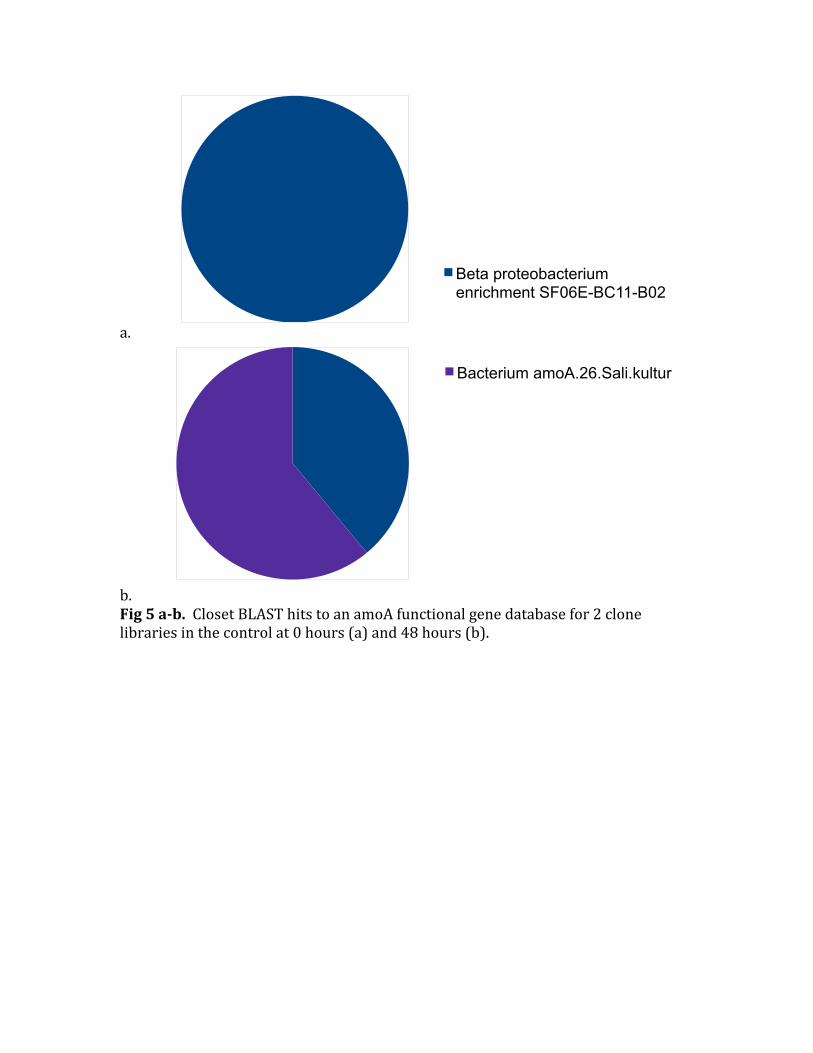
ThefirstanalysisIdidontheclonelibrarieswastoBLASTthesequencesagainstthesamelocalfunctionalgenedatabasefromFunGenementionedpreviously.TheseresultsareshowninFigure5.SincethedatabaseisnotdetailedenoughIfoundthatintheinitialtimepointeverysequencehadaclosesthittobeta_proteobacterium_enrichment_culture_clone_SF06E‐BC11‐B02(MosierandFrancis,2008).Thenthe48hourclonelibraryonlynowhasaclosesthitfortobeta_proteobacterium_enrichment_culture_clone_SF06E‐BC11‐B02for40%andtheother60%ofsequencesbestmatchbacterium_amoA.26.Sali.kultur(Eilmusetal,unpublished)Thisshowsthatthereisanewgroupoforganismsthatthriveinthebottleconditionsovertheinitialdominantcommunity.
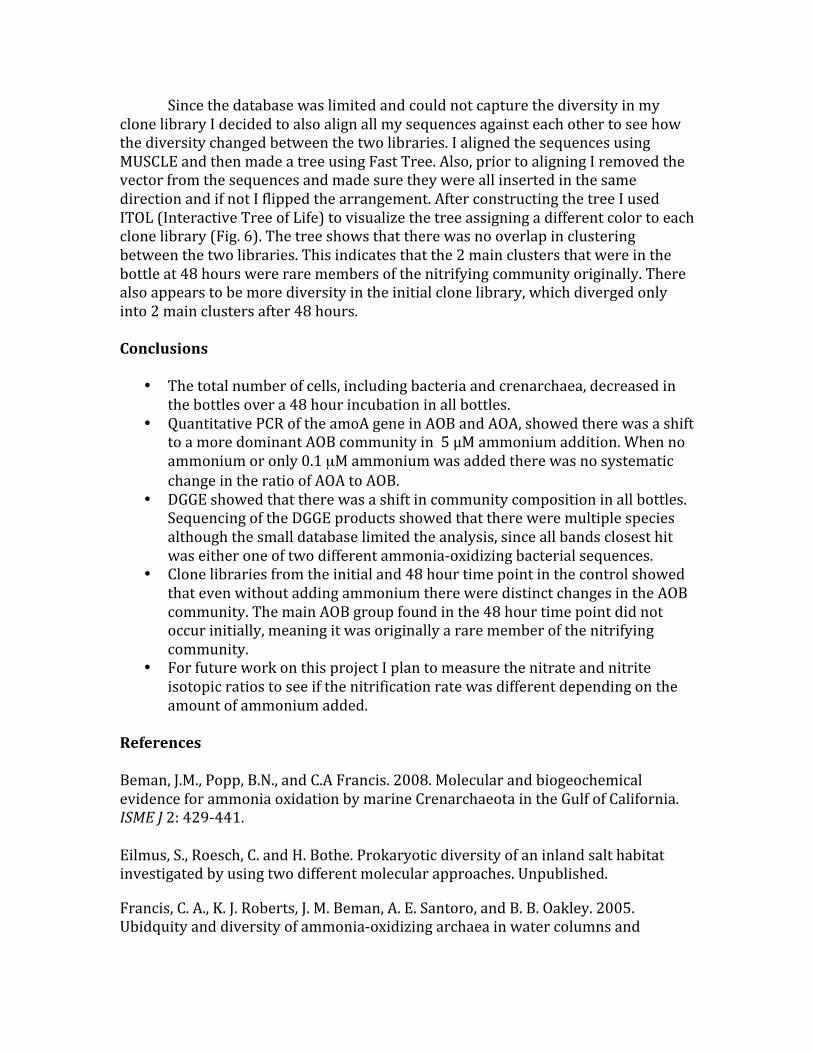
SincethedatabasewaslimitedandcouldnotcapturethediversityinmyclonelibraryIdecidedtoalsoalignallmysequencesagainsteachothertoseehowthediversitychangedbetweenthetwolibraries.IalignedthesequencesusingMUSCLEandthenmadeatreeusingFastTree.Also,priortoaligningIremovedthevectorfromthesequencesandmadesuretheywereallinsertedinthesamedirectionandifnotIflippedthearrangement.AfterconstructingthetreeIusedITOL(InteractiveTreeofLife)tovisualizethetreeassigningadifferentcolortoeachclonelibrary(Fig.6).Thetreeshowsthattherewasnooverlapinclusteringbetweenthetwolibraries.Thisindicatesthatthe2mainclustersthatwereinthebottleat48hourswereraremembersofthenitrifyingcommunityoriginally.Therealsoappearstobemorediversityintheinitialclonelibrary,whichdivergedonlyinto2mainclustersafter48hours.Conclusions
• Thetotalnumberofcells,includingbacteriaandcrenarchaea,decreasedinthebottlesovera48hourincubationinallbottles.
• QuantitativePCRoftheamoAgeneinAOBandAOA,showedtherewasashifttoamoredominantAOBcommunityin5µMammoniumaddition.Whennoammoniumoronly0.1µMammoniumwasaddedtherewasnosystematicchangeintheratioofAOAtoAOB.
• DGGEshowedthattherewasashiftincommunitycompositioninallbottles.SequencingoftheDGGEproductsshowedthatthereweremultiplespeciesalthoughthesmalldatabaselimitedtheanalysis,sinceallbandsclosesthitwaseitheroneoftwodifferentammonia‐oxidizingbacterialsequences.
• Clonelibrariesfromtheinitialand48hourtimepointinthecontrolshowedthatevenwithoutaddingammoniumthereweredistinctchangesintheAOBcommunity.ThemainAOBgroupfoundinthe48hourtimepointdidnotoccurinitially,meaningitwasoriginallyararememberofthenitrifyingcommunity.
• ForfutureworkonthisprojectIplantomeasurethenitrateandnitriteisotopicratiostoseeifthenitrificationratewasdifferentdependingontheamountofammoniumadded.
ReferencesBeman,J.M.,Popp,B.N.,andC.AFrancis.2008.MolecularandbiogeochemicalevidenceforammoniaoxidationbymarineCrenarchaeotaintheGulfofCalifornia.ISMEJ2:429‐441.Eilmus,S.,Roesch,C.andH.Bothe.Prokaryoticdiversityofaninlandsalthabitatinvestigatedbyusingtwodifferentmolecularapproaches.Unpublished.Francis,C.A.,K.J.Roberts,J.M.Beman,A.E.Santoro,andB.B.Oakley.2005.Ubidquityanddiversityofammonia‐oxidizingarchaeainwatercolumnsand
sedimentsoftheocean.Proc.Natl.Acad.Sci.102:14683‐14688,doi:10.1073/pnas.0506625102
Martens‐Habbena,W.Berube,P.M.Urakawa,H.delaTorre,J.R.andD.Stahl.2009Ammoniumoxidationkineticsdeterminenicheseparationofnitrifyingarchaeaandbacteria.Nature461:976‐979,doi:10.1038/nature08465Mosier,AandC.A.Francis.2008.Relativeabundanceanddiversityofammonia‐oxidizingarchaeaandbacteriaintheSanFranciscoBayestuary.Environ.Micrbiol.10,11:3002‐3016.DOI:10.1111/j.1462‐2920.2008.01764.xRotthauwe,J.H.,Witzel,K.P.,andW,Liesack.1997.TheammoniamonooxygenasestructuralgeneamoAasafunctionalmarker:Molecularfine‐scaleanalysisofnaturalammoniaoxidizingpopulations.ApplEnvironMicrobiol63:4704‐4712.Santoro,A.E.,Francis,C.A.,deSieyes,N.R.,andBoehm,A.B.2008.Shiftsintherelativeabundanceofammonia‐oxidizingbacteriaandarchaeaacrossphysicochemicalgradientsinasubterraneanestuary.EnvironMicrobiol10:1068–1070.Stark,J.M.andM.K.Firestone.1996.Kineticcharacteristicsofammonium‐oxidizercommunitiesinaCaliforniaoakwoodland‐annualgrassland.SoilBiol.Biochem.28:1307–1317.Strickland,J.D.H.,andT.R.Parsons.1972.Apracticalhandbookofseawateranalysis.Bull.Fish.Res.Bd.Can.167:1‐310.
Ward,B.B.,Talbot,M.C.andM.J.Perry.1984.Contributionsofphytoplanktonandnitrifyingbacteriatoammoniumandnitritedynamicsincoastalwaters.Cont.ShelfRes.3,383–398.Wuchter,C.,Abbas,B.,Coolen,M.J.L.,Herfort,L.,vanBleijswijk,J.,Timmers,P.,Strous,M.,Teira,E.,Herndl,G.J.,Middelburg,J.J.,Schouten,S.andJ.S.S.Damsté.2006.Archaealnitrificationintheocean.Proc.Natl.Acad.Sci.103:12317‐12322.
a.
b.
c. Fig1.CellcountsusingDAPI(a)andCARDFISHbacterialprobe(b)andcrenarchaealprobe(c)forthecontrol,1aand2abottlesforthe0and48hourstimepoints.Thecrenarchaealprobedidnotworkforthe1abottleat0hours.
0.00E+00
5.00E+05
1.00E+06
1.50E+06
2.00E+06
2.50E+06
3.00E+06
3.50E+06
Noadd 0.1uM 5uM
Total#ofCells/mL
0hrs
48hrs
0.00E+002.00E+054.00E+056.00E+058.00E+051.00E+061.20E+061.40E+061.60E+061.80E+06
Noadd 0.1uM 5uM
BacterialCells/m
L
0hrs
48hrs
0.00E+005.00E+031.00E+041.50E+042.00E+042.50E+043.00E+043.50E+044.00E+044.50E+045.00E+04
Noadd 0.1uM 5uM
CrenarchaealCells/m
L
0hrs
48hrs
a.
b.
c. Fig2.PercentageofAOAandAOBat0,12,24and48hoursforthecontrol,1aand2a.PercentagecalcµLatedfromcopiesofamoAperngDNAmeasuredusingqPCR.
0%
20%
40%
60%
80%
100%
0 12 24 48
Hours
Control(noNH4+)
AOB
AOA
0%
20%
40%
60%
80%
100%
0 12 24 48
Hours
1a:0.1µMNH4+addition
AOB
AOA
0%
20%
40%
60%
80%
100%
0 12 24 48
Hours
2a:5µMNH4+addition
AOB
AOA
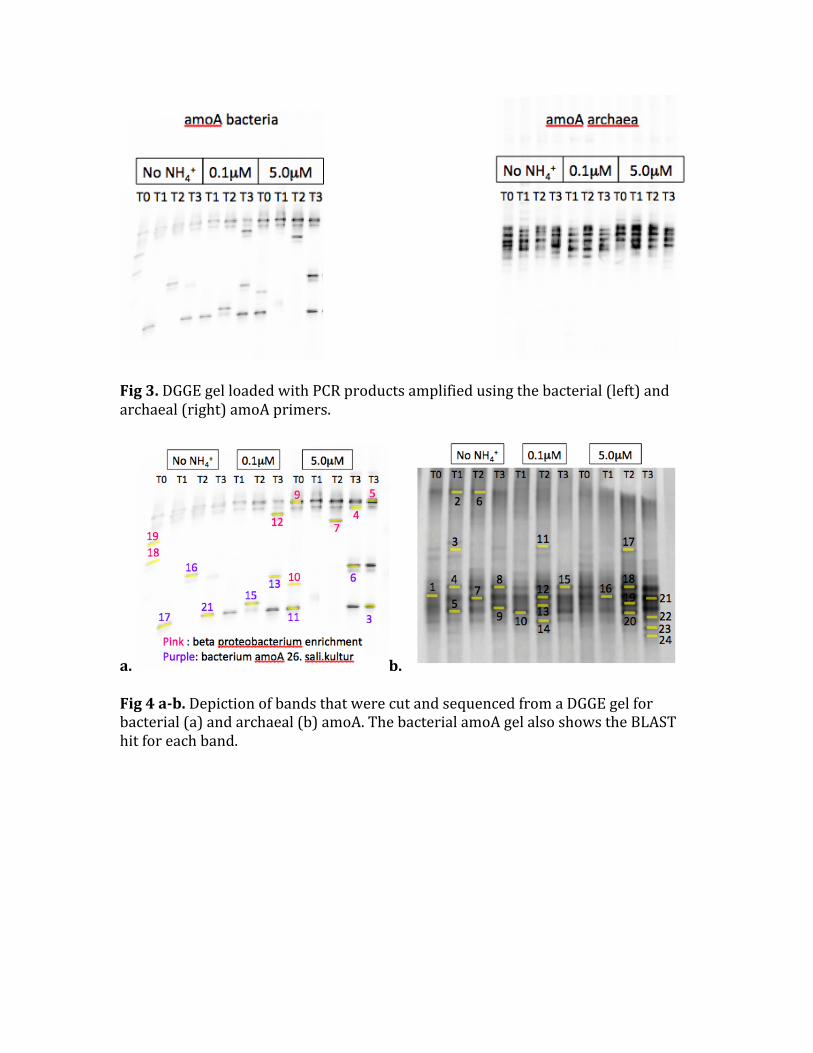
Fig3.DGGEgelloadedwithPCRproductsamplifiedusingthebacterial(left)andarchaeal(right)amoAprimers.
a. b. Fig4ab.DepictionofbandsthatwerecutandsequencedfromaDGGEgelforbacterial(a)andarchaeal(b)amoA.ThebacterialamoAgelalsoshowstheBLASThitforeachband.
a.
b.Fig5ab.ClosetBLASThitstoanamoAfunctionalgenedatabasefor2clonelibrariesinthecontrolat0hours(a)and48hours(b).
Beta proteobacterium enrichment SF06E-BC11-B02
Bacterium amoA.26.Sali.kultur
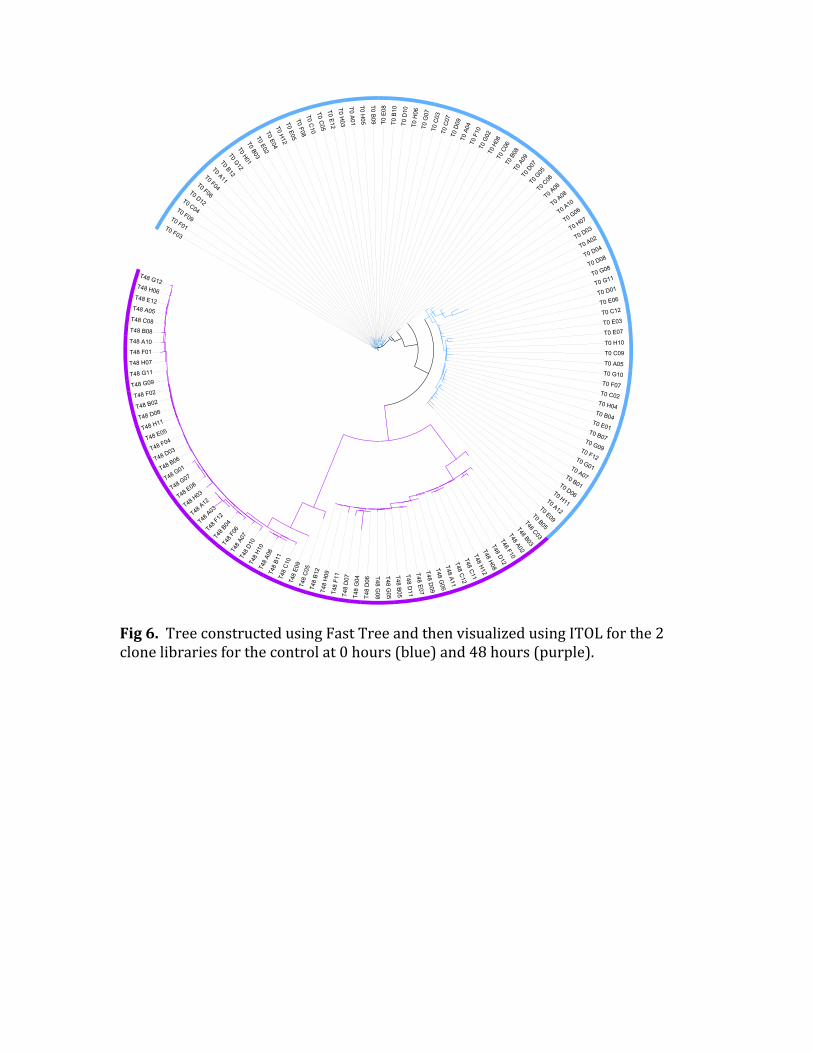
Fig6.TreeconstructedusingFastTreeandthenvisualizedusingITOLforthe2clonelibrariesforthecontrolat0hours(blue)and48hours(purple).
0.01
Legend:
env_fixed
T0 C04
T0 D12
T0 F04
T0 A11
T0 B
12T0 G
12T0 H
01T0 B
03
T0 E
02
T0 E
04
T0 H
12
T0 E
05
T0 F
08
T0 F06
T0 C
05
T0 E
12
T0 H
03
T0 A
01
T0 H
05
T0 C
07
T0 D
09
T0 F
10
T0 G
02
T0 H
08
T0 C
06
T0
B08
T0 A
04
T0 B
09
T0 E
08
T0 B
10
T0 D
10
T0 G
07
T0 C
03
T0 H
06
T0
A09
T0 G
05
T0 A06
T0 A08
T0 G06
T0 D03
T0 A02
T0 D04
T0 H07
T0 A10
T0 G08
T0 G11
T0 D01
T0 E06
T0 E07
T0 H10
T0 A05
T0 G10
T0 F07
T0 C09
T0 G09T0 F12
T0 B07
T0 B04T0 E01
T0 H04
T0 D06T0 A12
T0 E09
T0 B05
T0 H11
T0 B01
T0 G01T0 A07
T0 C02
T0 C12
T0 E03
T0 D08
T48 C
05
T48 E
09
T48
A07
T48 E08
T48 G07T48 G
01
T48 H03
T48 B06T48 D03T48 F04
T48 A10
T48 B08
T48 A05
T48 E12
T48 H06
T48 G12
T48 C08
T48 F01
T48 H07
T48 E05T48 H11
T48 B02T48 F02
T48 G09
T48 G11
T48 D08
T48 F
12
T48 A
03T48
A12
T48
F06
T48
B04
T48 D
10
T48 C
10
T48 B
11
T48 A
06
T48 H
10
T48 B
03
T48 A
02
T48 F
10
T48 A
11
T48 G
06
T48 B
05
T48 G
04
T48 D
07
T48 D
06
T48 F
11
T48 H
09
T48 B
12
T48 G
05
T4
8 G
08
T48 E
07
T48 D
11
T48 D
09
T48 C
11
T48 C
12
T48 H
12
T48 D
12
T48 H
08
T48 C03
T0 C08
T0
D07
T0 C
10
T0 F01
T0 F09
T0 F03