Embed Size (px)
Citation preview
Proceedings World Geothermal Congress 2010 Bali, Indonesia, 25-29 April 2010
1
Test rig Experiments for Silica Scaling Inhibition
Kevin Brown1 and Michael Rock2 1GEOKEM, P.O. Box 95-210, Swanson Auckland, New Zealand, 2Mighty River Power, P.O. Box 445, Hamilton, New Zealand.
[email protected], [email protected]
Keywords: Silica scaling, pilot plant, antimony,arsenic
ABSTRACT
A sophisticated test rig has been constructed and operated to test a number of silica scaling inhibition methods. The test rig is fully instrumented and controlled and can simulate either double or triple flash regimes or a binary/heat exchanger operation. Silica scaling is measured on a number of test pipe sections throughout the test rig, and in a packed bed. The test rig has been operated at the Kawerau and Rotokawa geothermal fields in New Zealand, and has elucidated some of the design parameters and operating conditions for new power stations at these locations.
As a result of the experiments, both new power stations have been designed with pH modification to suppress silica scaling in the brine. However, tests are continuing using organic silica dispersants to control silica scaling. Arsenic and antimony either as sulfides or the elements were the principal non-silica scales that were produced at lower temperatures and lower pH.
1. INTRODUCTION
Mighty River Power was considering the construction of new power plants at the Kawerau and Rotokawa geothermal fields in New Zealand. They wished to optimize the electric power production and yet minimize possible mineral scaling problems. Consequently, it was decided to experimentally investigate a variety of design parameters by building and operating a test rig that would simulate possible development scenarios for a full scale power plant. In order to maximise the power output of the future power plant, it was decided that the final separation temperatures would be below the silica saturation temperature. Therefore, the degree of mineral scaling in the brine collection and disposal system and methods to prevent or ameliorate this scaling was a desired outcome of the experiments. There were no pre-conceived ideas for the type of power plant, and so the test rig was designed to simulate a binary plant operation as well as dual or triple flash operation.
2. TEST RIG DESIGN
The test rig was designed to be semi-portable, and therefore was constructed around two shipping containers. Two separators were incorporated into the design to allow for a dual or triple flash system. Each separator was designed for maximum flows of 8 tonnes/hr. A schematic of the test rig is shown in Figure 1.
2.1 Binary Plant Simulation
A portion of the steam from the HP separator was separately piped to two heat exchangers where the steam was condensed and excess gas was vented to the atmosphere. This was designed to simulate a non-condensing turbine exhausting to a binary plant to condense
the steam. The brine from the HP separator was piped to a shell and tube heat exchanger to simulate a brine binary plant. After the brine was cooled, it was mixed with the steam condensate to simulate a reinjection fluid. One of these combined streams was dosed with sulfuric acid to lower the pH in order to delay silica polymerization. The HP brine was acid dosed before it was cooled and mixed with the condensate. The other stream was used as a control with no pH adjustment. The mixed brine and condensate was then piped to separate hold-up vessels. These vessels had a retention time of ~ 40 minutes to simulate retention in reinjection pipelines and reinjection wells.
In both streams, removable carbon steel test pipe sections were placed after the retention vessels in order to characterize the nature and quantity of any scale deposited. Removable 316L stainless steel tubes were also incorporated into the mixed brine and condensate heat exchangers to characterize the scale deposited in those environments.
2.2 Conventional Steam Turbine Simulation
Brine from the HP separator was lowered in pressure through a control valve and piped to the LP separator. Steam from the LP separator was vented to waste. Two brine outlets were taken from the LP separator. One was dosed with sulfuric acid to inhibit silica deposition, and the other line was not dosed to act as a control. Both LP brine streams were then passed through separate retention vessels that held up the brine for ~ 40 minutes. As for the binary test, in both streams, removable carbon steel test pipe sections were placed after the retention vessels in order to characterize the nature and quantity of any scale deposited. Removable carbon steel test sections were also placed in the HP brine stream between the HP and LP separators.
Initially, the acid dosing into the brine was placed after the LP separator, as the residence time in the separator was considered to be too short to allow the silica to start polymerizing. However, measurements soon showed that the silica was indeed polymerizing within the LP separator, and consequently the acid dosing was placed upstream of the brine pressure reduction valve between the HP and LP separators.
2.3 Silica Polymerisation Apparatus
An apparatus to measure the polymerization rate of the silica was a1so attached to a brine outlet of the LP separator or the outlet from the brine cooler. This apparatus consisted of an inner chamber of ~ 1 litre capacity, surrounded by an outer chamber to maintain temperature control. Brine was fed to the inner chamber and the inner chamber was then closed. Brine was continuously flowing in the outer chamber. At time intervals, a small sample was extracted from the inner chamber and the concentration of monomeric silica analysed.
Brown and Rock
2
Figure 1: A schematic of the silica deposition test rig
3. SILICA POLYMERIZATION EXPERIMENTS
Silica polymerization experiments were conducted before the test rig experiments at both Kawerau and Rotokawa in order to confirm that polymerization was indeed delayed for at least 120 minutes when the pH was lowered to pH25 = 5.0. As well, silica polymerisation was also measured at pH25 = 5.5 and also with no acid addition. Silica polymerization was measured by analyzing the concentration of monomeric silica using the ammonium molydate reaction.
3.1 Kawerau Silica Polymerization Measurements
3.1.1 Flash Experiments with no pH Adjustment
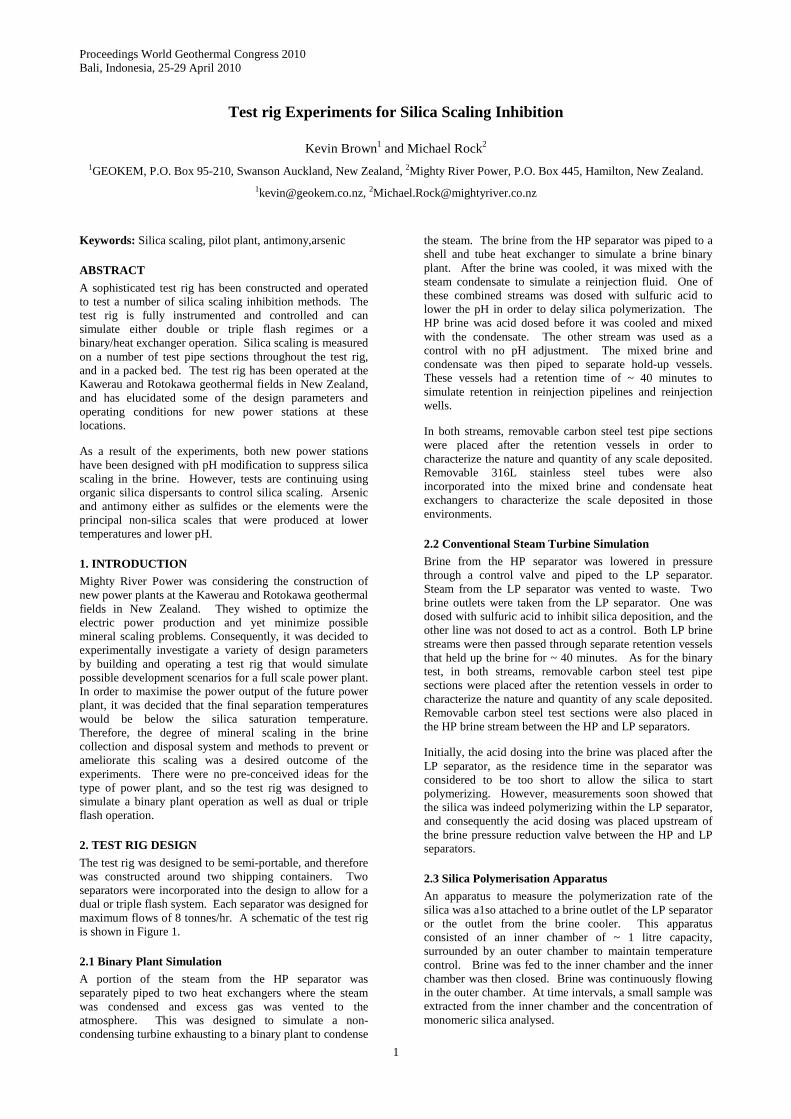
The initial silica polymerization tests at Kawerau were at a series of reducing temperatures for the LP flash and with no pH adjustment of the brine. The HP flash was at 12 bara (188ºC), and the silica polymerization was measured for a number of different pressures for the LP flash. The results are shown in Figure 2. A summary of the test conditions were as follows:
Nominal Temperature
Actual temperature
pH Approximate SSI
102 100.6 8.18 2.43
110 108.2 8.13 2.24
120 120.1 8.20 1.95
140 138.7 8.18 1.60
150 148.7 8.13 1.45
160 157.8 8.10 1.30
At the high silica saturation indices at the lower temperatures, silica polymerization was very rapid. At 150ºC and 160ºC, there is a slight induction period before polymerization takes place. However, at lower temperatures, polymerisation is very rapid, which indicates that there is a significant risk of severe silica scaling.
0 20 40 60 80 100 120Time (minutes)
400
500
600
700
800
900
1000
Mon
omer
ic S
ilica
(pp
m)
160
150
140
120 110102
Figure 2:Silica polymerization at Kawerau – no pH adjustment. The numbers on each curve are the temperatures for the LP flash at each experiment
Brown and Rock.
3
3.1.2 Flash Experiments with pH Adjustment
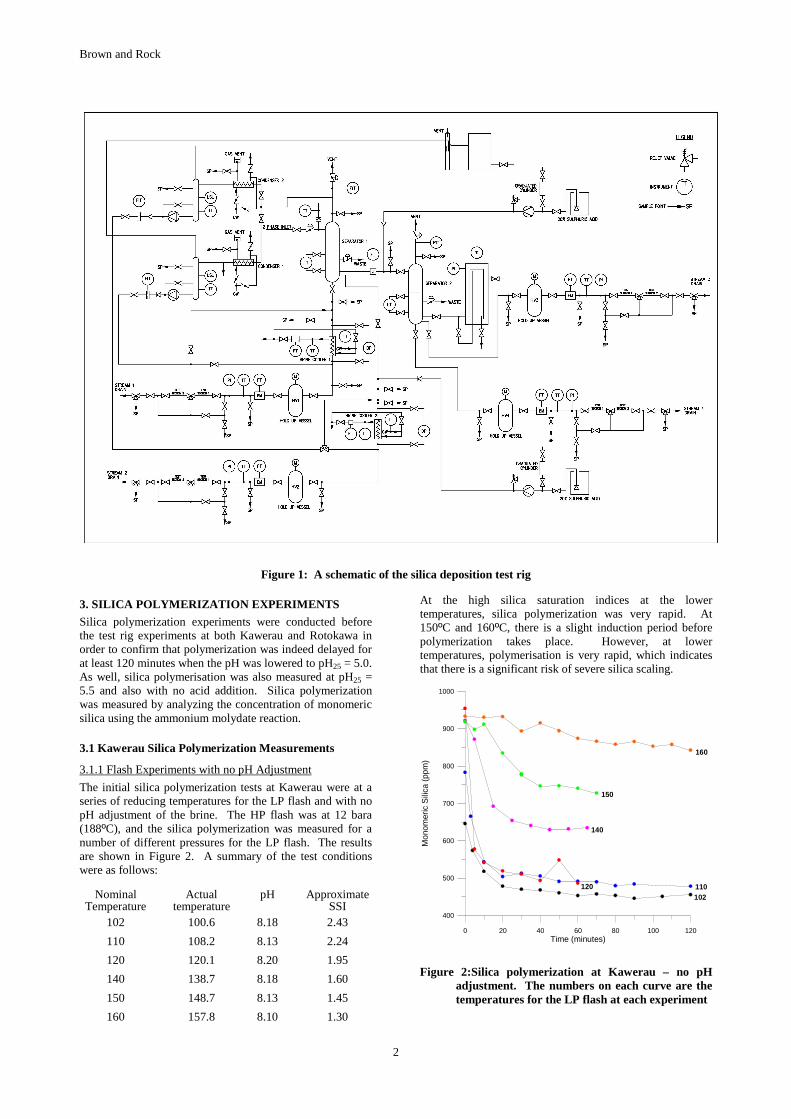
A further set of polymerization experiments were conducted where the pH of the brine was adjusted to pH25 = 5.0. This experiment was conducted with a HP flash temperature of 188ºC, and a LP flash temperature of 120ºC.
It was found that pH control was very difficult for these experiments and the pH increased slightly over the time of the experiment. A typical result is shown in Figure 3.
0 20 40 60 80 100 120Time (minutes)
750
800
850
900
950
1000
Mon
omer
ic s
ilica
(pp
m)
Figure 3: Silica polymerization at pH~5.0 and LP flash of 120ºC
For the initial 40 – 60 minutes, the pH was constant at ~ 5.0 and the silica polymerization was essentially halted. However, when the pH rose slightly, the polymerization rapidly increased. Consequently, it was decided that a pH of 5.0 was required to delay the silica polymerization.
3.1.3 Binary Test Rig Experiments
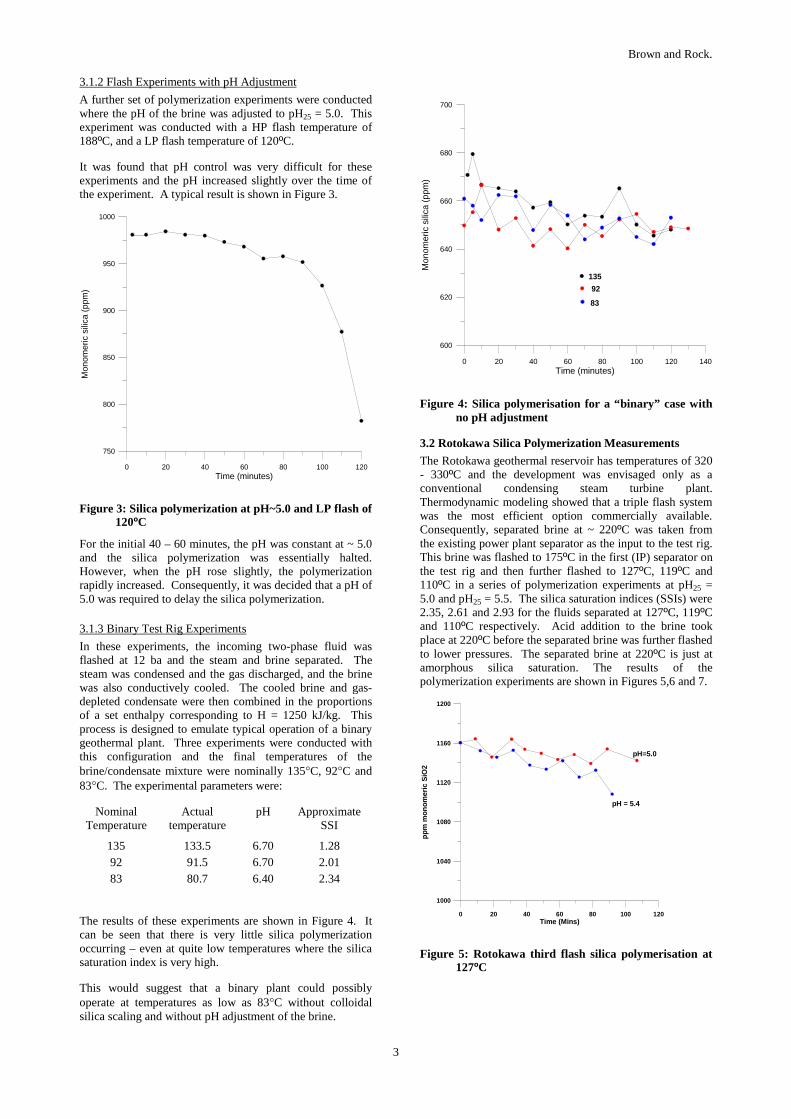
In these experiments, the incoming two-phase fluid was flashed at 12 ba and the steam and brine separated. The steam was condensed and the gas discharged, and the brine was also conductively cooled. The cooled brine and gas-depleted condensate were then combined in the proportions of a set enthalpy corresponding to H = 1250 kJ/kg. This process is designed to emulate typical operation of a binary geothermal plant. Three experiments were conducted with this configuration and the final temperatures of the brine/condensate mixture were nominally 135°C, 92°C and 83°C. The experimental parameters were:
Nominal Temperature
Actual temperature
pH Approximate SSI
135 133.5 6.70 1.28 92 91.5 6.70 2.01 83 80.7 6.40 2.34
The results of these experiments are shown in Figure 4. It can be seen that there is very little silica polymerization occurring – even at quite low temperatures where the silica saturation index is very high.
This would suggest that a binary plant could possibly operate at temperatures as low as 83°C without colloidal silica scaling and without pH adjustment of the brine.
0 20 40 60 80 100 120 140Time (minutes)
600
620
640
660
680
700
Mon
omer
ic s
ilica
(pp
m)
135
92
83
Figure 4: Silica polymerisation for a “binary” case with no pH adjustment
3.2 Rotokawa Silica Polymerization Measurements
The Rotokawa geothermal reservoir has temperatures of 320 - 330ºC and the development was envisaged only as a conventional condensing steam turbine plant. Thermodynamic modeling showed that a triple flash system was the most efficient option commercially available. Consequently, separated brine at ~ 220ºC was taken from the existing power plant separator as the input to the test rig. This brine was flashed to 175ºC in the first (IP) separator on the test rig and then further flashed to 127ºC, 119ºC and 110ºC in a series of polymerization experiments at pH25 = 5.0 and pH25 = 5.5. The silica saturation indices (SSIs) were 2.35, 2.61 and 2.93 for the fluids separated at 127ºC, 119ºC and 110ºC respectively. Acid addition to the brine took place at 220ºC before the separated brine was further flashed to lower pressures. The separated brine at 220ºC is just at amorphous silica saturation. The results of the polymerization experiments are shown in Figures 5,6 and 7.
0 20 40 60 80 100 120Time (Mins)
1000
1040
1080
1120
1160
1200
ppm
mon
omer
ic S
iO2
pH = 5.4
pH=5.0
Figure 5: Rotokawa third flash silica polymerisation at 127ºC
Brown and Rock
4
0 20 40 60 80 100Time (mins)
700
800
900
1000
1100
1200pp
m M
onom
eric
Sili
ca
pH = 5.0
pH=5.5
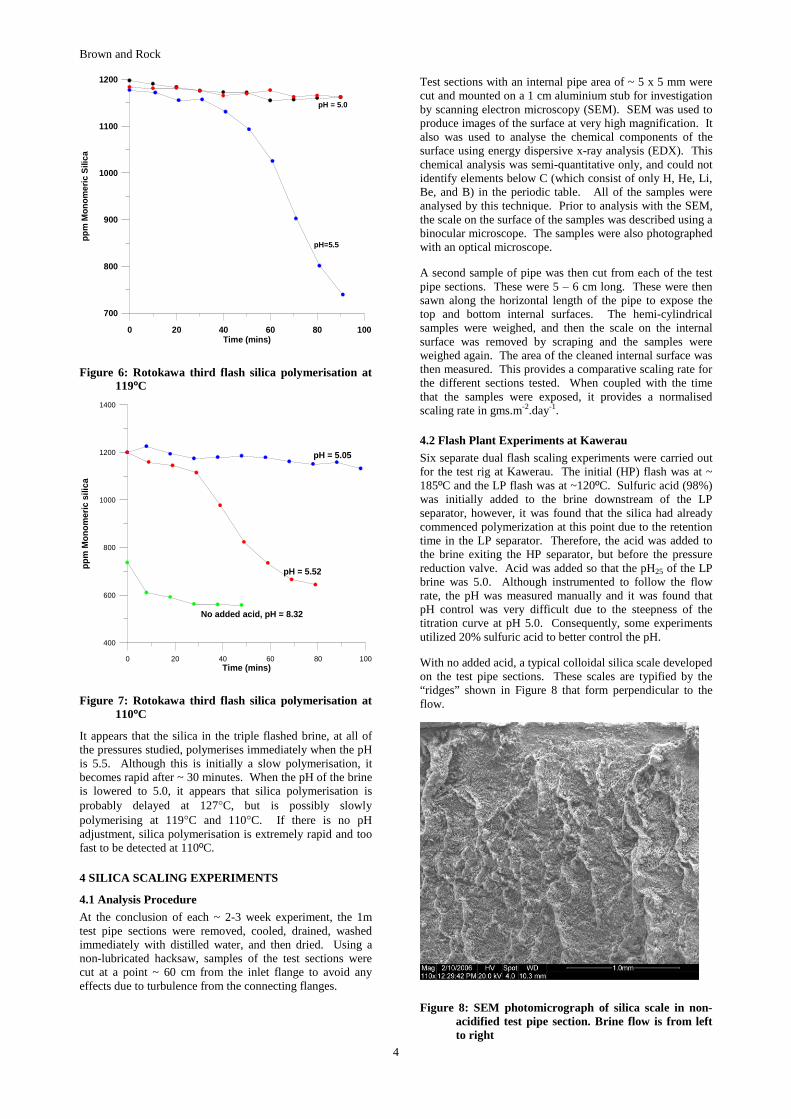
Figure 6: Rotokawa third flash silica polymerisation at 119ºC
0 20 40 60 80 100Time (mins)
400
600
800
1000
1200
1400
ppm
Mon
omer
ic s
ilica
pH = 5.05
pH = 5.52
No added acid, pH = 8.32
Figure 7: Rotokawa third flash silica polymerisation at 110ºC
It appears that the silica in the triple flashed brine, at all of the pressures studied, polymerises immediately when the pH is 5.5. Although this is initially a slow polymerisation, it becomes rapid after ~ 30 minutes. When the pH of the brine is lowered to 5.0, it appears that silica polymerisation is probably delayed at 127°C, but is possibly slowly polymerising at 119°C and 110°C. If there is no pH adjustment, silica polymerisation is extremely rapid and too fast to be detected at 110ºC.
4 SILICA SCALING EXPERIMENTS
4.1 Analysis Procedure
At the conclusion of each ~ 2-3 week experiment, the 1m test pipe sections were removed, cooled, drained, washed immediately with distilled water, and then dried. Using a non-lubricated hacksaw, samples of the test sections were cut at a point ~ 60 cm from the inlet flange to avoid any effects due to turbulence from the connecting flanges.
Test sections with an internal pipe area of ~ 5 x 5 mm were cut and mounted on a 1 cm aluminium stub for investigation by scanning electron microscopy (SEM). SEM was used to produce images of the surface at very high magnification. It also was used to analyse the chemical components of the surface using energy dispersive x-ray analysis (EDX). This chemical analysis was semi-quantitative only, and could not identify elements below C (which consist of only H, He, Li, Be, and B) in the periodic table. All of the samples were analysed by this technique. Prior to analysis with the SEM, the scale on the surface of the samples was described using a binocular microscope. The samples were also photographed with an optical microscope.
A second sample of pipe was then cut from each of the test pipe sections. These were 5 – 6 cm long. These were then sawn along the horizontal length of the pipe to expose the top and bottom internal surfaces. The hemi-cylindrical samples were weighed, and then the scale on the internal surface was removed by scraping and the samples were weighed again. The area of the cleaned internal surface was then measured. This provides a comparative scaling rate for the different sections tested. When coupled with the time that the samples were exposed, it provides a normalised scaling rate in gms.m-2.day-1.
4.2 Flash Plant Experiments at Kawerau
Six separate dual flash scaling experiments were carried out for the test rig at Kawerau. The initial (HP) flash was at ~ 185ºC and the LP flash was at ~120ºC. Sulfuric acid (98%) was initially added to the brine downstream of the LP separator, however, it was found that the silica had already commenced polymerization at this point due to the retention time in the LP separator. Therefore, the acid was added to the brine exiting the HP separator, but before the pressure reduction valve. Acid was added so that the pH25 of the LP brine was 5.0. Although instrumented to follow the flow rate, the pH was measured manually and it was found that pH control was very difficult due to the steepness of the titration curve at pH 5.0. Consequently, some experiments utilized 20% sulfuric acid to better control the pH.
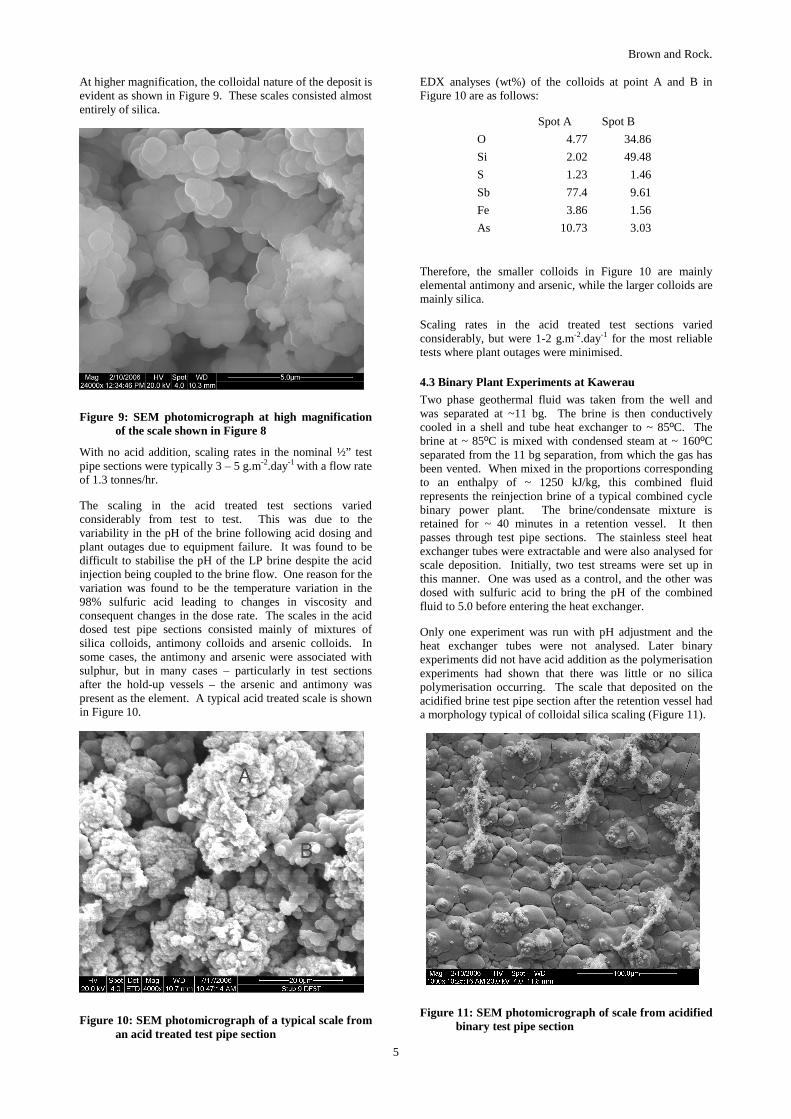
With no added acid, a typical colloidal silica scale developed on the test pipe sections. These scales are typified by the “ridges” shown in Figure 8 that form perpendicular to the flow.
Figure 8: SEM photomicrograph of silica scale in non-acidified test pipe section. Brine flow is from left to right
Brown and Rock.
5
At higher magnification, the colloidal nature of the deposit is evident as shown in Figure 9. These scales consisted almost entirely of silica.
Figure 9: SEM photomicrograph at high magnification of the scale shown in Figure 8
With no acid addition, scaling rates in the nominal ½” test pipe sections were typically 3 – 5 g.m-2.day-1 with a flow rate of 1.3 tonnes/hr.
The scaling in the acid treated test sections varied considerably from test to test. This was due to the variability in the pH of the brine following acid dosing and plant outages due to equipment failure. It was found to be difficult to stabilise the pH of the LP brine despite the acid injection being coupled to the brine flow. One reason for the variation was found to be the temperature variation in the 98% sulfuric acid leading to changes in viscosity and consequent changes in the dose rate. The scales in the acid dosed test pipe sections consisted mainly of mixtures of silica colloids, antimony colloids and arsenic colloids. In some cases, the antimony and arsenic were associated with sulphur, but in many cases – particularly in test sections after the hold-up vessels – the arsenic and antimony was present as the element. A typical acid treated scale is shown in Figure 10.
Figure 10: SEM photomicrograph of a typical scale from an acid treated test pipe section
EDX analyses (wt%) of the colloids at point A and B in Figure 10 are as follows:
Spot A Spot B
O 4.77 34.86
Si 2.02 49.48
S 1.23 1.46
Sb 77.4 9.61
Fe 3.86 1.56
As 10.73 3.03
Therefore, the smaller colloids in Figure 10 are mainly elemental antimony and arsenic, while the larger colloids are mainly silica.
Scaling rates in the acid treated test sections varied considerably, but were 1-2 g.m-2.day-1 for the most reliable tests where plant outages were minimised.
4.3 Binary Plant Experiments at Kawerau
Two phase geothermal fluid was taken from the well and was separated at ~11 bg. The brine is then conductively cooled in a shell and tube heat exchanger to ~ 85ºC. The brine at ~ 85ºC is mixed with condensed steam at ~ 160ºC separated from the 11 bg separation, from which the gas has been vented. When mixed in the proportions corresponding to an enthalpy of ~ 1250 kJ/kg, this combined fluid represents the reinjection brine of a typical combined cycle binary power plant. The brine/condensate mixture is retained for ~ 40 minutes in a retention vessel. It then passes through test pipe sections. The stainless steel heat exchanger tubes were extractable and were also analysed for scale deposition. Initially, two test streams were set up in this manner. One was used as a control, and the other was dosed with sulfuric acid to bring the pH of the combined fluid to 5.0 before entering the heat exchanger.
Only one experiment was run with pH adjustment and the heat exchanger tubes were not analysed. Later binary experiments did not have acid addition as the polymerisation experiments had shown that there was little or no silica polymerisation occurring. The scale that deposited on the acidified brine test pipe section after the retention vessel had a morphology typical of colloidal silica scaling (Figure 11).
Figure 11: SEM photomicrograph of scale from acidified binary test pipe section
Brown and Rock
6
However, EDX analysis of this scale gave the following analysis:
Element Wt %
O 3.96
Si 0.85
S 14.07
Sb 11.07
Fe 2.14
As 67.91
The scale deposit had only very minor amounts of silica present, and the main components were arsenic and antimony. There is not sufficient sulfur present for all of the arsenic and antimony to be present as sulfides. Consequently, at least some of the arsenic and antimony must be present as the element. There is considerably more arsenic than antimony in this scale. Pitting was noticed on the carbon steel pipe surface and it is thought that the native arsenic and antimony is solubilising some iron. Typical scaling rates were 1.7 – 2.5 g.m-2.day-1 .
Colloidal antimony and arsenic were also deposited as scales when no pH adjustment was applied. All of the test sections from the binary line had a scale consisting of a colloidal deposit of arsenic and antimony. The scale deposit also contained significant concentrations of iron. It is not known whether this iron came from the well brine, or as a corrosion product from the steel pipe. It was not possible to elucidate the form of the iron in the deposit, as it appeared to be finely dispersed in the deposit. However, in the deposit from the binary heat exchanger, no iron was found. These have stainless steel pipes. But, after the binary fluid has passed through the carbon steel hold-up vessel and the carbon steel test sections, it precipitates an iron-rich deposit. This suggests that the iron is being sourced from the steel.
A typical scale from the test pipe sections located after the retention vessels is shown in Figure 12.
Figure 12: SEM photomicrograph of scale from the non-acidified test pipe section after the retention vessel. Brine flow is from bottom to top.
The scale shows features of a typical colloidal deposition, with ridges and valleys between the ridges. The EDX analysis of this scale showed that it had a very consistent composition. A typical analysis is:
Element Wt%
S 27.0
Fe 14.0
As 12.2
Sb 46.8
In contrast to the acidified test pipe sections in the same location, these scales have greater antimony than arsenic concentration. They also contain significant iron concentrations. The arsenic and antimony is probably present as sulfides. The scale was amorphous to x-rays, so no crystalline species were detected. The scaling rate here was 4.2 g.m-2.day-1
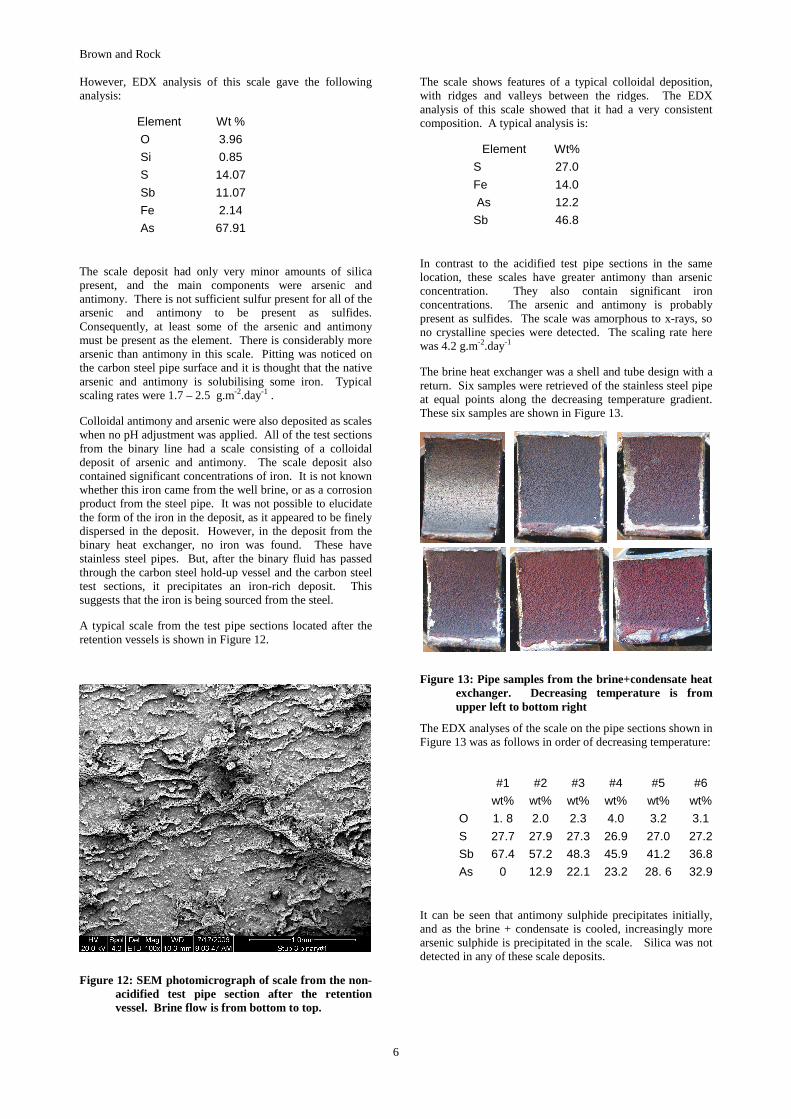
The brine heat exchanger was a shell and tube design with a return. Six samples were retrieved of the stainless steel pipe at equal points along the decreasing temperature gradient. These six samples are shown in Figure 13.
Figure 13: Pipe samples from the brine+condensate heat exchanger. Decreasing temperature is from upper left to bottom right
The EDX analyses of the scale on the pipe sections shown in Figure 13 was as follows in order of decreasing temperature:
It can be seen that antimony sulphide precipitates initially, and as the brine + condensate is cooled, increasingly more arsenic sulphide is precipitated in the scale. Silica was not detected in any of these scale deposits.
#1 #2 #3 #4 #5 #6
wt% wt% wt% wt% wt% wt%
O 1. 8 2.0 2.3 4.0 3.2 3.1
S 27.7 27.9 27.3 26.9 27.0 27.2
Sb 67.4 57.2 48.3 45.9 41.2 36.8
As 0 12.9 22.1 23.2 28. 6 32.9
Brown and Rock.
7
4.4 Flash Plant Experiments at Rotokawa
The test rig was shifted to Rotokawa after conclusion of the Kawerau testing. Thermodynamic and economic considerations showed that a triple flash condensing turbine was the most satisfactory development option for conventional plant due to the high temperature (320 - 330ºC) of the Rotokawa system.
Brine was taken from the accumulator attached to the main separator at the Rotokawa power station. This brine was separated at ~27 ba corresponding to ~226°C. 20% sulfuric acid was pumped into this brine using a dosing pump. The dosing pump rate was instrumented to be controlled by the flow in the brine line from the separator accumulator. The target pH was pH25=5.0 in the LP brine for these experiments. Previous experiments at Ohaaki (Lichti et al (2000)) had shown that if a layer of silica was deposited initially, then carbon steel corrosion was reduced at the low pH. Consequently, in both pH modification tests, the plant was run for 10 hours with no pH modification at the start of each experiment.
After acidification, the brine was further flashed at 8.9 ba (175°C). The steam from this flash was led to waste, and the brine was then further flashed at 2.3 ba (~125°C) or 3.3ba (136ºC). The SSI at this stage was 2.4 – 2.5. The brine resulting from this final flash was passed through hold-up vessels which provided a retention time of ~ 40 minutes. The flow rate of the final flashed brine was 1.3 t/hour in order to simulate typical reinjection line velocities. Due to heat losses, the temperature of the brine exiting the hold-up vessels was slightly less than that expected for the LP separation pressure.
Test pipe sections were placed:
• In the brine line at 27 ba immediately after acid injection
• In the brine line between the second and third separators
• In the brine line after the third separator, and before the hold-up vessel
• In the brine line after the hold-up vessel
The first result that became apparent, that was not noticed as a problem at Kawerau, was that the quill that was used to introduce the acid into the 225ºC brine was corroding rapidly. The quill material was initially Hastelloy C276. A number of different options for quill material were tested, and every metallic quill tested was found to dissolve. Eventually, a PEEK-lined quill was installed which functioned satisfactorily. Unlike the Kawerau experiments, 20% sulfuric acid was exclusively used at Rotokawa. This acid was probably aerated as well as been diluted, which may have contributed to the rapid corrosion.
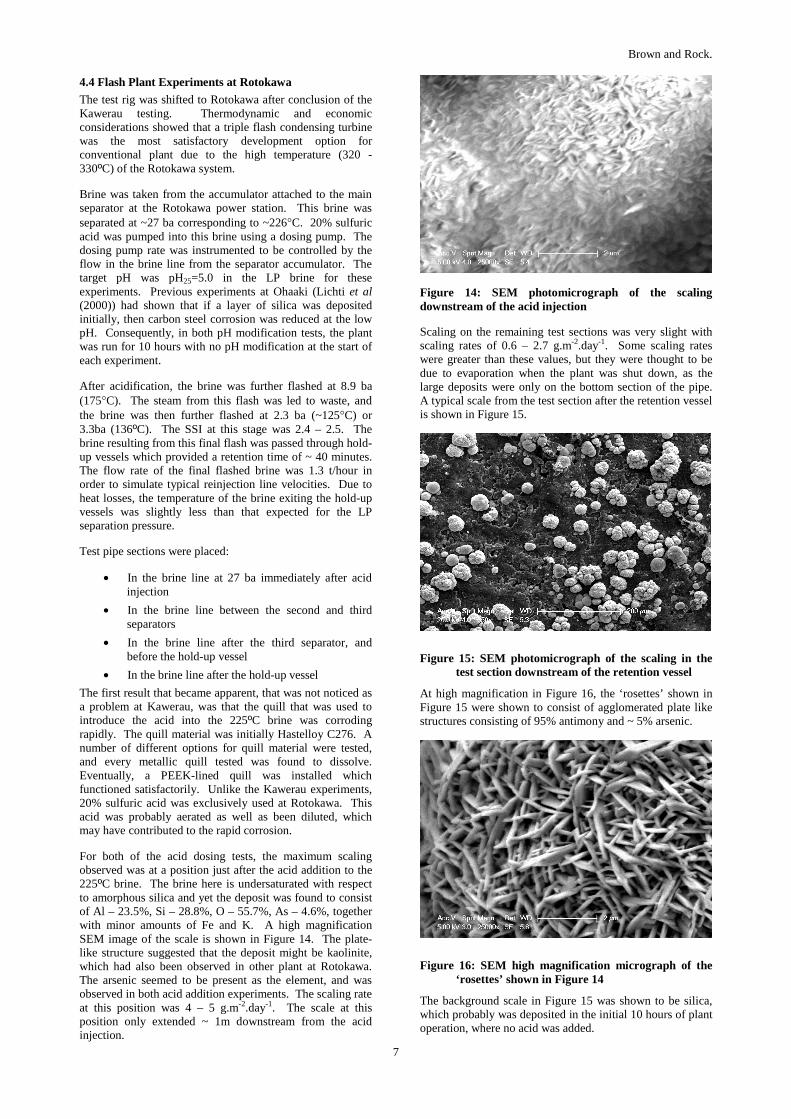
For both of the acid dosing tests, the maximum scaling observed was at a position just after the acid addition to the 225ºC brine. The brine here is undersaturated with respect to amorphous silica and yet the deposit was found to consist of Al – 23.5%, Si – 28.8%, O – 55.7%, As – 4.6%, together with minor amounts of Fe and K. A high magnification SEM image of the scale is shown in Figure 14. The plate-like structure suggested that the deposit might be kaolinite, which had also been observed in other plant at Rotokawa. The arsenic seemed to be present as the element, and was observed in both acid addition experiments. The scaling rate at this position was 4 – 5 g.m-2.day-1. The scale at this position only extended ~ 1m downstream from the acid injection.
Figure 14: SEM photomicrograph of the scaling downstream of the acid injection
Scaling on the remaining test sections was very slight with scaling rates of 0.6 – 2.7 g.m-2.day-1. Some scaling rates were greater than these values, but they were thought to be due to evaporation when the plant was shut down, as the large deposits were only on the bottom section of the pipe. A typical scale from the test section after the retention vessel is shown in Figure 15.
Figure 15: SEM photomicrograph of the scaling in the test section downstream of the retention vessel
At high magnification in Figure 16, the ‘rosettes’ shown in Figure 15 were shown to consist of agglomerated plate like structures consisting of 95% antimony and ~ 5% arsenic.
Figure 16: SEM high magnification micrograph of the ‘rosettes’ shown in Figure 14
The background scale in Figure 15 was shown to be silica, which probably was deposited in the initial 10 hours of plant operation, where no acid was added.
Brown and Rock
8
There was little difference in the scaling between the two experiments where the final LP brine temperature was 130ºC or 120ºC. Assuming a density of 0.5 g/cm3, the extrapolated scaling rate was calculated to be 2-3 mm/year.
Nearly 100% of the mass of scale observed in the low temperature test sections was metallic antimony. The appearance of antimony was predicted from the thermodynamic data, and is a consequence of the reduction in pH coupled with the low temperature. It is calculated that the temperature needed to be greater than ~ 140°C to avoid antimony deposition. The triple flash system reduced the H2S concentration in the final brine to very low levels, and the antimony was observed to be present as the element. This is in contrast to other scaling in the binary heat exchangers at Rotokawa and Ngawha power stations, where antimony sulphide (stibnite Sb2S3) is deposited.
Where slight silica scaling was observed, it formed the typical ridge structures perpendicular to the flow that has been seen before in all silica scaling experiments. There was always significant aluminium concentrations associated with the silica scale. Aluminium is normally quantitatively co-precipitated with amorphous silica.
4.5 Organic Silica Dispersant Experiments at Rotokawa
Three experiments were conducted at Rotokawa where organic silica dispersants were injected into the 225ºC brine at the dose rate recommended by the manufacturers. These experiments had the same separation pressures as the pH modification experiments where the final LP temperature was 130ºC.
Two of the three antiscalants tested produced a significant deposit directly after injection into the brine at 220ºC. This deposit was found to consist mainly of the dispersant plus calcium. There was no antimony, arsenic or silica precipitated at this point.
Scaling rates in the LP brine after the retention vessel were very low – similar in magnitude to the pH modification experiments. However, the scale that was produced was mainly silica. There was no antimony or arsenic deposited, but in one case, quite significant concentrations (~3wt%) of tellurium was observed.
The scaling rate in those test positions where the silica was actively polymerizing, however, was much greater at >10g.m-2.day-1 than that found for the pH modification experiments at the same positions. Furthermore, the silica scale that is produced is very hard and very adherent.
Consequently, it appears that the organic silica dispersants are effective only where the silica colloids have been completely formed and are stable.
Experiments are continuing at Kawerau with organic dispersants to control silica scaling.
CONCLUSIONS
The test rig experiments have shown that silica scaling is minimised when the pH of the final brine is 5.0. At a pH = 5.5, silica polymerization is not delayed for the Rotokawa brines.
Silica polymerization tests of a simulated combined cycle binary plant showed that there was little polymerization of the Kawerau brines at the temperatures studied, without any pH modification. However, at the low temperature, antimony and arsenic sulfides were precipitated in the heat exchangers.
At both Kawerau and Rotokawa, the low pH of the pH modified brine caused antimony and arsenic to deposit as a scale in the lowest temperature environment of the flash plant experiments.
As a result of the experiments, it was decided to develop both Kawerau and Rotokawa geothermal systems as conventional condensing turbine power stations with acid addition to the brine to control silica deposition in the plant and reinjection system. Following the experience in the test plant, the acid used was 98% sulfuric acid, and the feed lines to the acid dosing pumps were lined with heat traces to maintain a constant density and viscosity of the acid. In the full production Kawerau plant this has enabled a stable pH in the LP brine to be maintained.
Organic silica dispersants have been found to be successful in controlling silica scaling where the silica colloids have fully formed and are stable. However, where the silica is actively polymerizing to form colloids, the dispersants tested so far do not appear to be effective.
REFERENCES
Lichti, K.A., Brown, K.L. and Ilao, C.M. (2000). “Scaling and corrosion of pH adjusted separated water” Proceedings of the 22nd New Zealand Geothermal Workshop, pp 169 – 176.