Embed Size (px)
Citation preview

University of Sydney Papers in TESOL 1
Test candidates’ attitudes and their test performance: The case of the Fudan English Test JINSONG FAN
Fudan University
PEIYING JI
Fudan University
ABSTRACT
This study investigated test candidates’ attitudes to the Fudan English Test (FET), a university-based English proficiency test, and explored the relationships between test candidates’ attitudes, test taker characteristics, and test performance. The participants in this study were 157 students who had just attempted the FET. A questionnaire and an interview guide were designed to collect the data. Exploratory factor analysis extracted five attitudinal factors. Descriptive statistics at the factor level indicated that test candidates had the most positive attitudes to test administration and least positive attitudes to the mode of the computer-based speaking test. Factorial MANOVA showed that test candidates’ gender and academic backgrounds had no significant effect on their reported attitudes. Stepwise regression analyses showed that two attitudinal factors, attitude to test washback and attitude to test information explained 9.4% of the test score variance. As well as presenting the FET provider with additional evidence about the quality of the test, this study also lends empirical support to the argument that attitudinal factors need to be taken into serious consideration in test development and validation.
Address for correspondence: Jinsong Fan, Room 509, Building of Humanities and Social Sciences, Fudan University, No. 220, Handan Road, Yangpu District, Shanghai, People’s Republic of China, 200433; Email: [email protected]
University of Sydney Papers in TESOL, 9, 1-35.
©2014 ISSN: 1834-3198 (Print) & 1834-4712 (Online)
Jinsong Fan & Peiying Ji 2
INTRODUCTION
Inspired by Bachman’s (1990) model of language use and language test performance, a number of studies have been conducted in different contexts to investigate the factors which may affect test candidates’ performance on language tests. In this model, four categories are considered to influence test candidates’ performance on a language test: (1) test candidates’ communicative language abilities, comprised of language competencies, strategic competence, and psychophysical mechanisms; (2) test method facets, including environment, rubric, input, expected response, and relationships between input and response; (3) personal characteristics consisting of factors such as cultural background, background knowledge, cognitive abilities, gender and age; and (4) random factors, including interactions among components of communicative language ability, test method facets, and personal characteristics, as well as measurement error (see also Bachman & Palmer, 1996).
Of the factors in Bachman’s model, compared with other personal characteristics such as cognitive abilities, gender, and background knowledge, test candidates’ attitudes towards a language test and their potential impact on test performance have received woefully insufficient attention (Murray, Riazi, & Cross, 2012). Even less attention has been paid to the possible interactions between attitudinal factors and other variables such as gender and background knowledge. In the field of second language acquisition, numerous studies have indicated that language learners’ positive attitudes towards the target language or the target-language culture have a beneficial impact on their language learning (e.g., Brown, 2000; Ellis, 1999; Gardner, 1985). In addition, some studies in language testing have suggested a significant relationship between test candidates’ attitudes and how they prepared for and took a language test (e.g., Elder, Iwashita, & McNamara, 2002; Zhao & Cheng, 2010). Messick (1989) also explicitly recommended that test candidates’ attitudes should be considered as a crucial source of evidence for construct validity. Since test candidates’ attitudes can be considered a possible source of construct-irrelevant variance, it is important that their potential impact on test performance be further explored.
University of Sydney Papers in TESOL 3
Consequently, the present study seeks to investigate test candidates’ attitudes to the Fudan English Test (FET), a university-based English proficiency test, and to determine whether their views towards the test have any significant effect on their performance on the FET. Also of interest in the present study is whether attitudinal factors interact with personal characteristics of test candidates such as gender and background knowledge, and how these interactions may shape their performance on a language test. This study, therefore, seeks to answer the following three research questions:
RQ1. What is the overall pattern of test candidates’ attitudes to the FET?
RQ2. Are there differences in test candidates’ reported attitudes that are related to gender and/or academic background?
RQ3. What is the relationship between test candidates’ reported attitudes to the FET and their test performance?
REVIEW OF LITERATURE
The Fudan English Test (FET)
As the main foreign language in Chinese secondary and tertiary education, English is considered as one of the most essential skills for Chinese university students to compete in today’s globalized world (Dai & Hu, 2009). Though very few subject courses are taught in English at Chinese universities, students are required to take College English courses at the inception of their university study aimed at improving their abilities and skills in English listening, reading, writing, and speaking. After completing the College English courses, students are usually required to take the College English Test (CET), a nationwide standardized English language test which measures students’ English language abilities in the three domains of listening, reading, and writing. Speaking is currently not a compulsory component of the CET, and is only available to a fraction of the candidates who have passed a certain cutoff score on the CET written test (Zheng & Cheng, 2008). In recent years, the CET has come under heavy criticism from some language educators and researchers for its test format (heavy reliance on multiple-choice
Jinsong Fan & Peiying Ji 4
questions), lack of alignment between the CET and the teaching curriculum developed within a particular university, and its rather negative washback effect on English teaching and learning at the tertiary level (e.g., Han, Dan, & Yang, 2004). Though many of these criticisms are politically motivated or emotionally charged rather than empirically grounded, some high-ranking universities in China are attempting to develop their own English language tests in the hopes of addressing deficiencies of the CET and better aligning English testing with English teaching and learning within university settings (e.g., TOPE Project Team, 2013; Tsinghua University Testing Team, 2012). It is in this context that the Fudan English Test (FET) project was initiated.
The developer of the FET is the College English Center of Fudan University, one of the most prestigious institutions of higher learning in China. Currently, the FET is administered to the non-English major undergraduate students once a year by the university’s Academic Affairs Office. According to the FET Test Syllabus (Fudan University Testing Group, 2014, forthcoming), the FET serves two purposes: (1) to accurately measure students’ English abilities and skills as reflected in the English teaching syllabus at Fudan University; and (2) to exercise a more positive washback effect on English teaching and learning within Fudan University. The FET was initially administered to students in December 2011 following a needs assessment study and a number of pilot studies and trials (Fan, 2013a). Since September 2011, all newly enrolled undergraduates at Fudan University have been required to take the FET, and to pass it within the four years of their Bachelor’s program. According to the Academic Affairs Office, the FET counts for four credits in students’ GPA calculations. During their four years of study, students can choose which year to take the FET, and can take the test multiple times. The test results that the students receive include a composite score and four profile scores, all reported on a scale using five levels: A, B, C, D, and F. During the first FET administration in December 2011, 1,337 students took the test1. The number of test candidates increased to 1,831 during the second
1 Typical undergraduate enrollment at Fudan University is around 3,000.

University of Sydney Papers in TESOL 5
FET administration in December 2012 (Fan & Ji, 2013). It is expected that the test population will continue to expand in the future.
Designed on the basis of recent models of communicative language ability (e.g., Bachman, 1990) and communicative language use (Bachman & Palmer, 1996), the FET assesses students’ academic English language abilities in the four modalities of listening, writing, reading, and speaking, each accounting for 25% of the test score (Fudan University Testing Group, 2014, forthcoming). One major difference between the FET and the CET is that in the FET spoken English is placed on a par with the other three language modalities. In addition, thanks to the much smaller scale of operation, the FET is more flexible in its design than the CET. For example, the FET adopts a larger proportion of constructed-response items such as dictation, short answer questions, and essay writing, and a number of multi-modality tasks that reflect the complexity of the context of language use in academic settings (e.g., writing an essay after listening to an academic lecture, Fan & Ji, 2013).
Existing research shows that the FET is on the whole a reliable test, with internal consistency reliability coefficient reported at 0.83 (Fan, 2013b). Confirmatory factor analyses suggest there is a higher-order general language competence factor and four first-order factors representing listening, reading, writing, and speaking, lending support to the current score-reporting policy and the test’s construct validity (Fan, 2013b). Since FET performance counts for four points in students’ GPA, a criterion which is often used to make important decisions such as admissions to MA programs, employment opportunities, or application to study overseas, the FET is a test with reasonably high stakes (see Bachman & Palmer, 1996 about ‘high-stakes testing’). Though there is some research about the psychometric qualities of the FET (e.g., Fan, 2013a, 2013b; Fan & Ji, 2013), no systematic research is currently available on how students perceive this high-stakes test. There is some anecdotal evidence reported by the English teachers and students, indicating their rather negative attitudes to the test in relation to, for example, the mode of the computer-based speaking test, the lack of test-related information, and the policy that FET performance counts for four
Jinsong Fan & Peiying Ji 6
points in students’ GPA. Since test candidates are the most important stakeholders in the testing process and their attitudes towards the test may constitute construct-irrelevant variance, it is vital to invite them to participate in critiquing the test as an important component of test validation (Messick, 1989; see also Hamp-Lyons, 2000; Shohamy, 2001).
Attitude in language testing
Attitude, according to Allport (1971, p. 13), refers to “a mental and neural state of readiness organized through experience, exerting a directive or dynamic influence upon individual’s response to all objects and situations in which it is related”. Following this definition, Baker (1992) identified three components of attitude: affective, cognitive, and conative, and classified the five main characteristics of attitudes, as follows: (1) attitudes are cognitive and affective; (2) attitudes are dimensional rather than bipolar; (3) attitudes predispose a person to act in a certain way, but the relationship between attitudes and actions is not a strong one; (4) attitudes are learnt, not inherited or genetically endowed, and (5) attitudes tend to persist but they can be modified by experience (see also Baker, 1988).
Despite the extensive recognition of Baker’s (1988, 1992) attitudinal framework, the construct ‘attitude’ has been interpreted and operationalized in manifold ways in language testing research. In Rasti’s (2009, p. 111) study of Iranian test candidates’ attitudes to the IELTS, for example, attitude was defined as “a disposition or tendency to respond positively or negatively towards a certain thing such as an idea, object, person or situation”. Based on this definition, the construct was operationalized as Iranian test candidates’ perceptions of the four components in the IELTS: listening, reading, writing, and speaking. In Zhao and Cheng’s (2010) study of Chinese students’ attitudes to the CET, four components were identified to represent students’ attitudes, including test-taking anxiety/lack of concentration, test-taking motivation, belief in CET, and test ease. Murray et al. (2012), in their study of test candidates’ attitudes to the Professional English Assessment for Teachers (PEAT) in Australia, explicitly pointed out the terminological inconsistency when discussing and operationalizing the construct of attitude in language
University of Sydney Papers in TESOL 7
studies. In their study, ‘attitude’ was interpreted as a hypothetical psychological construct consisting of three components: beliefs (that a proposition is or is not true), opinions (that an actual or hypothetical action should or should not happen), and emotions. Other different interpretations of ‘attitude’ can be found in Alderson and Hamp-Lyons (1996), Cheng (2005), Elder et al. (2002), and Gu (2007). The manifold interpretations of ‘attitude’ seem to suggest that, while theoretical frameworks such as Baker’s (1988, 1992) can provide a broad point of reference in the development and validation of the research instrument, how the construct is interpreted and operationalized should depend largely on the purposes of the research and the settings in which it is conducted.
Existing research on test candidates’ attitudes indicates that most of these studies have been conducted on well-established, high-stakes English language tests such as IELTS, TOEFL, and CET. For example, Rasti (2009) used questionnaires, self-report forms, and follow-up interviews to investigate the attitudes of Iranian candidates who had attempted IELTS in order to examine the relationships between test taker characteristics (gender, age, and educational background) and attitudes to the test. The questionnaire in Rasti’s study was informed by Bachman’s (1990) framework of test method facets, and the study was focused on test candidates’ perceptions of the four components of the IELTS: listening, reading, writing, and speaking. The results of the study showed that of 60 participants, almost 80% had an overall positive attitude. No significant relationships were found to exist between test candidates’ attitudes and their gender, age, and educational background. In their TOEFL washback study, Alderson and Hamp-Lyons (1996) observed classes and interviewed both teachers and students about their attitudes to the test. The results showed that a majority of the teachers expressed negative attitudes to the test, feeling that it did not satisfy the criterion of authenticity. The study also found that washback was a more complex phenomenon than had been hitherto acknowledged, and that attitude was influential in determining certain practices.
In China, Han et al. (2004) surveyed 1194 university teachers for their attitudes to the CET. Using a questionnaire as their primary
Jinsong Fan & Peiying Ji 8
data-collection instrument, the three researchers identified teachers’ negative attitudes towards the CET. No students, however, were surveyed in this study. In contrast to Han et al.’s study, Zhao and Cheng (2010) not only investigated test candidates’ attitudes to the CET, but also explored the relationships between test candidates’ attitudes, gender, and test performance on the CET. The participants in Zhao and Cheng’s study were 212 university students who had taken the CET. An attitudinal questionnaire was developed to collect the data, and a number of statistical analyses were performed. The study found a significant relationship between test candidates’ attitudes and gender, with female attitudes significantly more positive than their male counterparts. In addition, the study found that among the four factors identified, two factors, test-taking motivation and test-taking anxiety/lack of concentration, were the best predictors of students’ test performance, explaining about 15.4% of the variance in their test scores.
As suggested by Bachman’s (1990) model of language use and language test performance, test candidates’ attitudes, as a dimension of personal characteristics, have the potential impact on their performance (see also Bachman & Palmer, 1996). Zhao and Cheng’s study (2010), the only reviewed study that examined such a relationship, lent empirical support to this hypothesis. If test candidates’ attitudes are related to construct validity, then the direction and strength of such a relationship warrant more thorough investigation. More empirical data collected from language tests developed and used in different contexts can therefore help to further elucidate such relationships. Also of theoretical and practical interest is the potential interactions between attitudinal factors and personal characteristics in Bachman’s (1990) model such as gender and background knowledge. From a theoretical perspective, a better understanding of these interactions can help language testers more accurately pinpoint the sources of test score variance. From a practical perspective, language test providers can make more informed decisions, controlling for the potential effect of these variables in the process of test development and administration, so as to minimize their possible impact on the test’s construct validity.
University of Sydney Papers in TESOL 9
METHODS
Participants
The participants in this study were 157 students who took the FET in December 2012. Of the 157 participants, 54.1% (n=85) were female and 45.9% (n=72) were male. Because the FET debuted in 2011, and only newly enrolled undergraduates were required to take this test, all participants in this study were Year One (29.3%) and Year Two (70.7%) Bachelor of Arts students. The participants came from different colleges and departments at Fudan University, with 40.8% (n=64) studying subjects in science and engineering, 33.1% (n=52) studying subjects in humanities and social sciences, and 24.6% (n=39) from other academic fields. Two students did not report their majors. After the 157 participants completed the questionnaires, 14 of them also participated in follow-up interviews on a voluntary basis. Of the 14 interviewees, half were male and half were female. At the time of investigation, eight of them were majoring in science and engineering, three in humanities and arts, and the other three came from other academic backgrounds.
Instruments
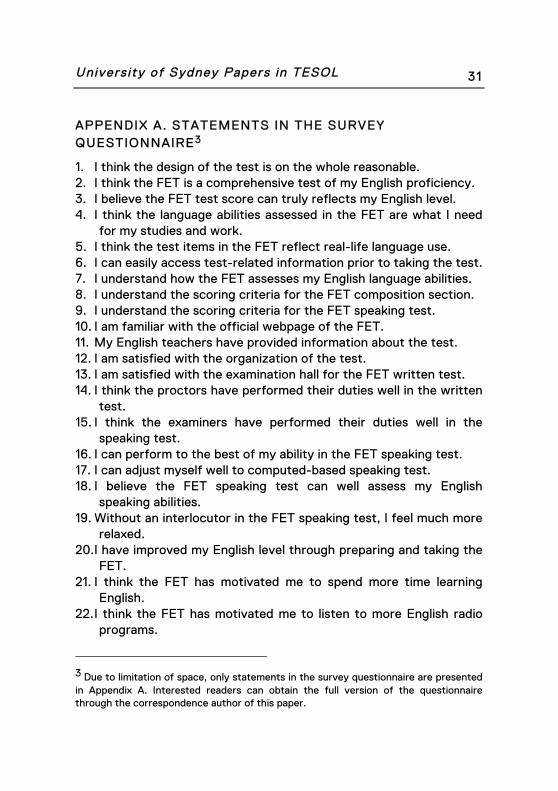
Two instruments were developed for this study: a structured questionnaire and a semi-structured interview guide (see Appendices A and B for the English translation of the two research instruments). Following Rasti’s (2009) study of test candidates’ attitudes to IELTS, attitude in this study was defined as how test candidates perceived the effectiveness or usefulness of the different aspects of the FET, including, for example, test design, test administration, and test washback. Therefore, while adopting Baker’s (1992) attitudinal framework as a point of reference, the design of the questionnaire was largely based on the research instrument used in Rasti’s (2009) study. Concomitantly, anecdotal evidence about the test also played a role in the design of the questionnaire, such as students’ complaints about the lack of test-related information and the computer-based FET speaking test. Twenty-four questions were included in the questionnaire, all on a six-point Likert-scale of agreement. The six-point scale was adopted with a view to avoiding central tendency
Jinsong Fan & Peiying Ji 10
effect when respondents answered the questionnaire items (Dornyei & Taguchi, 2010). The main sections of the questionnaire are as follows:
• Attitude to test design (items 1-5)
• Attitude to the transparency of test information (items 6-11)
• Attitude to test administration (items 12-15)
• Attitude to the mode of the computer-based speaking test (items 16-19)
• Attitude to test washback (items 20-24)
At the end of the questionnaire, students were required to provide personal information, including their gender, year of study, and major. After the questionnaire was designed, it was piloted among a group of 58 Year Two undergraduates at Fudan University. The pilot study indicated that the internal consistency reliability of the questionnaire was satisfactory (Cronbach’s α=.80). No questions were deleted, but a few questions were rephrased to improve their clarity.
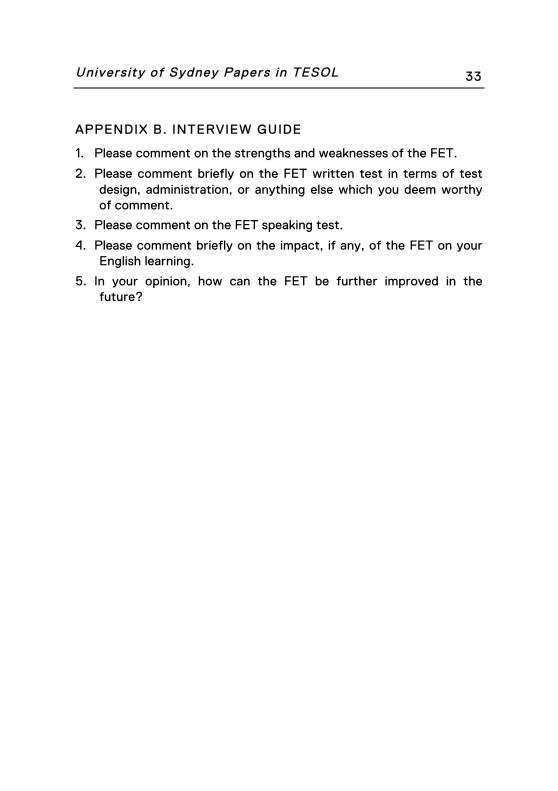
The interview guide, consisting of five questions, was developed on the basis of the questionnaire. Students were encouraged to comment freely on the strengths and weaknesses of the FET, the FET written test, the FET speaking test, and the influence of the FET on their English learning. They were also asked to give suggestions on how the FET could be further improved in the future.
Data col lection
The questionnaire was administered to test candidates immediately after they had finished taking the FET in December 2012. Due to practical constraints, stratified random sampling was not possible. Among the total 1,831 candidates taking the FET in December 2012, six examination rooms with 30 test candidates in each room were randomly selected, and a total of 180 questionnaires were administered to the test candidates after the FET. A consent form was signed before the administration of the questionnaires. Eventually, 157 questionnaires were collected, achieving a response rate of 87.2%. Although students were assured that the information they provided would only be used for this study, complete anonymity
University of Sydney Papers in TESOL 11
was not possible since students were required to provide their student ID number so that their test scores could be retrieved from the test database after all the test papers were marked. After completing the questionnaires, students were encouraged to participate in follow-up interviews conducted by the researchers and their research assistants. All interviews were audio-recorded, and were subsequently transcribed and coded for analysis.
Data analysis
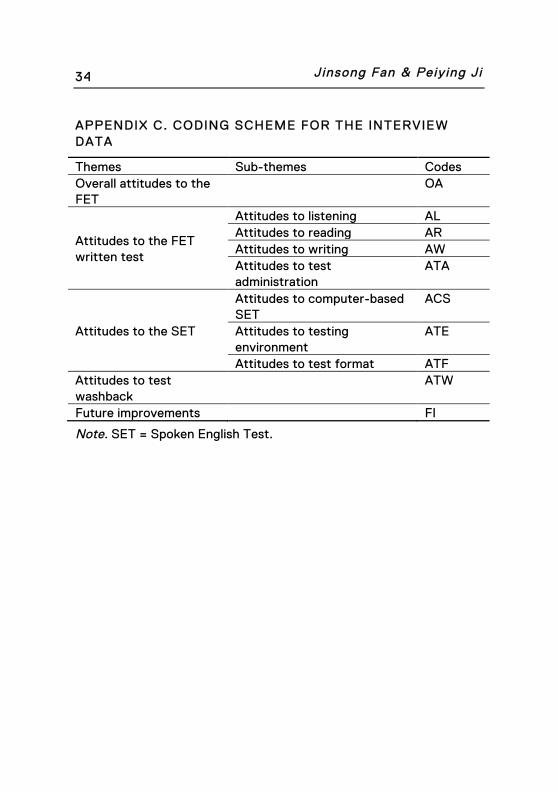
Exploratory factor analysis (EFA) was first of all run to investigate the construct structure of the survey questionnaire. Internal consistency reliability coefficients Cronbach’s α were computed at both the factor and scale levels. To investigate the pattern of test candidates’ attitudes to the FET (RQ1), descriptive statistics at the factor level were computed. To obtain in-depth qualitative information about their reported attitudes, the interview data were transcribed and coded by two researchers according to a coding scheme developed on the basis of several preliminary readings and analyses to identify the salient and recurring themes or patterns in the data (see Appendix C for the English translation of this coding scheme). Inter-coder reliability was confirmed by using the Cohen’s kappa statistic. A satisfactory level of agreement (k=.81) was achieved on overall reliability. In addition, kappa values for each major category were also computed, all suggesting acceptable inter-coder reliability (Overall attitude: k=.90; Attitude to the FET written test: k=.78; Attitude to the FET spoken English test: k=.73; Attitude to test washback: k=.90; Further improvement of the test: k=.90, see Appendix C for the major categories of the coding scheme). The differences arising in the coding process were resolved through follow-up discussions.
To determine whether any differences existed in test candidates’ reported attitudes that were related to their gender and academic background (RQ2), a two-way multivariate analysis of variance (MANOVA) was conducted on the data collected through the structured questionnaire. The relationship between test candidates’ attitudes and test performance (RQ3) was examined through stepwise multiple regression analyses. All quantitative analyses in this
Jinsong Fan & Peiying Ji 12
study were performed in IBM SPSS21.0 (IBM, 2012), and the level of all tests of significance was set at .05. Readers can refer to the details of these analyses in the results section of this paper.
RESULTS AND DISCUSSION
Exploratory factor analysis (EFA)
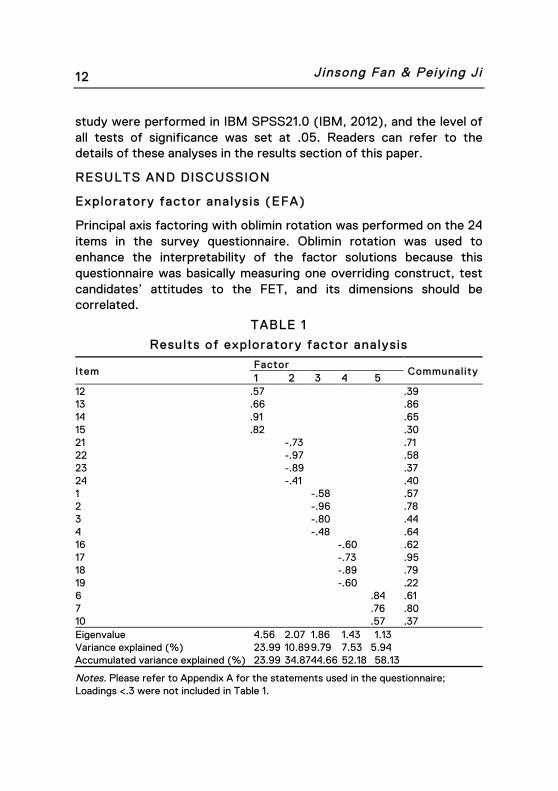
Principal axis factoring with oblimin rotation was performed on the 24 items in the survey questionnaire. Oblimin rotation was used to enhance the interpretability of the factor solutions because this questionnaire was basically measuring one overriding construct, test candidates’ attitudes to the FET, and its dimensions should be correlated.
TABLE 1
Results of exploratory factor analysis
Item Factor
Communality 1 2 3 4 5
12 .57 .39 13 .66 .86 14 .91 .65 15 .82 .30 21 -.73 .71 22 -.97 .58 23 -.89 .37 24 -.41 .40 1 -.58 .57 2 -.96 .78 3 -.80 .44 4 -.48 .64 16 -.60 .62 17 -.73 .95 18 -.89 .79 19 -.60 .22 6 .84 .61 7 .76 .80 10 .57 .37 Eigenvalue 4.56 2.07 1.86 1.43 1.13 Variance explained (%) 23.99 10.89 9.79 7.53 5.94 Accumulated variance explained (%) 23.99 34.87 44.66 52.18 58.13
Notes. Please refer to Appendix A for the statements used in the questionnaire; Loadings <.3 were not included in Table 1.
University of Sydney Papers in TESOL 13
Prior to EFA, univariate normality was checked through examining the skewness and kurtosis of the data at the item level, which were all within the acceptable range. Kaiser-Meyer-Olkin sampling adequacy (.75) and Bartlett’s test of sphericity (p<.001) were examined, both suggesting suitability of the data for factor analysis. The Kaiser Criterion was adopted, which meant only factors with eigenvalues over one would be extracted (Crocker & Algina, 1986). Factor loadings lower than .3 were deleted and were not counted toward any factors. Factor analysis indicated that the five-factor solution was the best in terms of having fewer items with fewer low loadings or cross loadings and easier interpretation. The five factors explained 58.13% of the common variance. Five items (Item 5, 8, 9, 11, 20) were discarded from further analysis, as they had double loadings on two factors and each of the two loadings was higher than .3. The results of factor analysis are presented in Table 1.
Based on the item loadings on the five factors, Factor 1 was interpreted as ‘attitude to test administration’ (Item 12, 13, 14, 15, Cronbach’s α=.82), Factor 2 ‘attitude to test washback’ (Item 21, 22, 23, 24, Cronbach’s α=.83), Factor 3 ‘attitude to test design’ (Item 1, 2, 3, 4, Cronbach’s α=.80), Factor 4 ‘attitude to the mode of the speaking test’ (hereafter ‘attitude to test mode’, Item 16, 17, 18, 19, Cronbach’s α=.80), and Factor 5 ‘attitude to the transparency of test information’ (hereafter ‘attitude to test information’, Item 6, 7, 10, Cronbach’s α=.76). Cronbach’s α for the whole questionnaire was .83 (n=19), suggesting satisfactory internal consistency. The reliability estimates and factor analysis results suggest that the questionnaire was a reliable and valid instrument for the intended purpose.
Test candidates’ attitudes to the FET (RQ1)
To investigate the pattern of test candidates’ attitudes to the FET, descriptive statistics at the factor level were computed. This was done by first adding all the items in the factor, and then dividing the item total by the number of items. The results are presented in Table 2.

Jinsong Fan & Peiying Ji 14
TABLE 2
Descriptive statist ics at the factor level
Factors Mean SD Skewness Kurtosis
1. Attitude to test administration 4.89 .81 -.57 .87
2. Attitude to test washback 4.17 1.09 -.31 -.24
3. Attitude to test design 4.21 .88 -.22 .57
4. Attitude to test mode 3.63 1.18 -.11 -.56
5. Attitude to test information 4.11 1.29 -.36 -.66
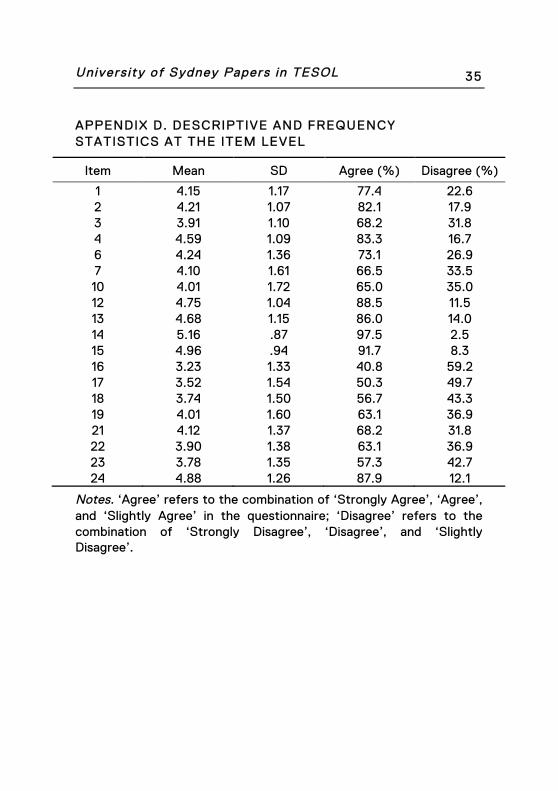
As Table 2 shows, students’ attitude to test administration was the most positive among the five factors (M=4.89), followed by students’ attitude to test design (M=4.21), test washback (M=4.17), and test information (M=4.11). Students’ least positive attitude was to the test mode (M=3.63). Readers can refer to Appendix D for the descriptive statistics at the item level.
The qualitative interview data showed that test candidates commented very positively on the overall design of the FET with the four components of listening, writing, reading, and speaking, believing that it was a comprehensive assessment of their English language abilities. In particular, they commented very positively on the multi-modality tasks in the FET. For example, one candidate commented on the FET writing task which required students to write an essay based on an academic lecture they had heard: ‘Though this is the very first time that I am required to perform such a task in an English test, I think it is a really good test format since we do need such skills when studying in the university’ (Participant 7, p. 10).
In addition to test design, test candidates also commented positively on the administration of the written test, and the current practice of reporting both the composite score and the profile scores on the four components. Similar to the findings derived from the questionnaire data, test candidates commented rather negatively on the computer-based modality that the FET adopted for the speaking test, and in particular, the environment of the speaking test. However, test candidates’ negative attitude to the speaking test was
University of Sydney Papers in TESOL 15
not about the mode of delivery per se since most of the interviewees still believed computer-based speaking test could effectively measure their English speaking ability. The crux of the problem, as one candidate remarked, was that ‘many of us had no experience of taking this kind of spoken English test, and I was feeling nervous because I was not familiar with such a test format’ (Participant 12, p. 17). Talking about the speaking test environment, one candidate complained with a tinge of frustration that ‘even with headphones, I could still hear the students talking around me very clearly’, and therefore, ‘it was so difficult for me to concentrate on my thinking and speaking because of the noise’ (Participant 1, p. 1).
Furthermore, some test candidates also complained about the lack of test information prior to taking the test, and expressed the apprehension that their performance on the FET might not be recognized as adequate proof of their English language abilities when they sought employment or pursued further studies after graduation. They hoped that the test developer could promote the test better within the university, and provide more information on the website. As far as the social recognition of the FET was concerned, a typical comment went like the follows: ‘I don’t like this test because currently it doesn’t enjoy any recognition; if it enjoyed good social recognition like the TOEFL or the CET, then I would probably take it more seriously’ (Participant 8, p. 11). When asked about whether this test influenced their English learning, students tended to agree that this test gave them external motivation to study English, as one student remarked: ‘The most important function of an English test such as the FET is to push us to learn English’ (Participant 9, p. 13).
Though test candidates believed that the FET had some impact on their English learning, they also remarked that the influence was very limited. As Participant 4 (p. 5) put it, ‘I don’t think that this test influenced my English learning very much. I think so long as I reach a certain level, of course I can achieve a high score on the test.’ Another candidate said that he would start preparing specifically for the test one month before the test date by doing simulated exercise.
The findings of this study seemed to indicate, at least from the perspective of the test candidates, that the administration of the FET
Jinsong Fan & Peiying Ji 16
complied with good testing practice as prescribed in some professional standards in language testing (e.g., AERA, APA, & NCME, 1999; ILTA, 2007). In addition, the findings also suggested that some of the test developer’s intentions such as adopting the multi-modality tasks in the test design were endorsed by test candidates who believed that these tasks were more authentic and reflected what they needed in real-life academic settings.
Test candidates’ rather negative attitudes to the speaking component were found not to be about the mode of test delivery per se, but due to their lack of familiarity with the test format, and the noisy test environment which prevented some test candidates from performing to the best of their speaking abilities. On top of that, some candidates also reported that test information was not made transparent to them prior to taking the test. Unfamiliarity with test tasks, noisy environment, as well as the lack of test information all constitute important test fairness concerns (e.g., AERA et al. 1999; Kunnan, 2000) that may give rise to measurement error and eventually compromise test validity. According to Messick (1989), there are two threats to test validity: construct underrepresentation and construct-irrelevant variance. It is very likely that these three issues reported by test candidates resulted in construct-irrelevant variance, thus adversely affecting the test’s construct validity. Taking into consideration the high-stakes nature of the FET, it is very pressing for the test developer to address these concerns properly in future test administrations.
Test candidates’ reported attitudes to test washback seemed mixed. On the one hand, they believed that the test provided them with external motivation to learn English; on the other hand, they believed that the test had little impact on their English learning, especially when the test was remote. This finding is consistent with Cheng and Wang’s (2007) study of the washback of standardized tests on Chinese students’ English learning. In a context imbued with testing culture and traditions, it is understandable that students consider a standardized test, especially one with high stakes, as an instrumental motivator in learning English (e.g., Gu, 2007; Qi, 2005). However, as a newly developed university-based test, the lack of
University of Sydney Papers in TESOL 17
recognition, as reported by test candidates, might explain the limited washback of this test on students’ English learning (Cheng, Watanabe, & Curtis, 2004). An important objective of implementing the FET, according to the FET Test Syllabus (Fudan University Testing Group, 2014, forthcoming), is to exercise more positive washback on students’ academic English learning. It is doubtful, at least based on the findings of the present study, that such an objective has been accomplished.
Test candidates’ attitudes and test taker characteristics (RQ2)
To determine whether any differences existed in test candidates’ reported attitudes that were related to their gender and academic background, a two-way MANOVA was conducted. This statistical procedure was adopted because this study had two independent variables (i.e., test candidates’ gender and academic background) and multiple dependent variables (i.e., test candidates’ average ratings on the five attitudinal factors (attitude to test administration, attitude to test washback, attitude to test design, attitude to test mode, and attitude to test information). MANOVA tests differences between groups with regard to multiple dependent variables simultaneously. Factorial MANOVA which the current study adopted can accomplish the task of examining the effects of independent variables including both main and interaction effects on dependent variables.
Prior to the analysis, statistical assumptions necessary for performing the MANOVA procedure were checked. One assumption to MANOVA is that the data in the samples are each normally distributed and the dependent variables have multivariate normality within groups. Based on histograms and skewness and kurtosis values, all samples in this analysis were shown to be normally distributed. Normalized Mardia’s coefficient estimate 2 was 4.34,
2 This value was computed through EQS 6.0, a Structural Equation Modeling program. Values below 5 were considered as acceptable indicators of multivariate normality (see Bentler, 2005).
Jinsong Fan & Peiying Ji 18
suggesting that the assumption of multivariate normality was not violated (Bentler, 2005). Secondly, though MANOVA could take account of the correlations between dependent variables, the power of MANOVA decreases as the correlation between dependent variables increases (Field, 2009). Therefore, the MANOVA procedure does not work well if the dependent variables are strongly correlated.
In this analysis, Pearson’s product-moment correlation coefficients were computed to investigate the correlations between the five dependent variables, suggesting that these variables were not strongly correlated (Pearson’s r ranging from .19 to .31, p<.05). Thirdly, Box’s Test of Equality of Covariance Matrices demonstrated that the data had homogeneity of variance (Box’s M=91.01, F=1.07, p=.32, df1=75, df2=10871.19). Levene’s test of equality of error also indicated that for each dependent variable in the dataset, the variances were similar across all groups (Attitude to test administration: p=.37; Attitude to test washback, p=.22; Attitude to test design, p=.15; Attitude to test mode, p=.94; Attitude to test information, p=.25; df1=5, df2=142). These analyses demonstrated that the dataset was suitable for the MANOVA procedure. The means and standard deviations of all groups in the analysis are presented in Table 3, and the results of the factorial MANOVA are presented in Table 4.
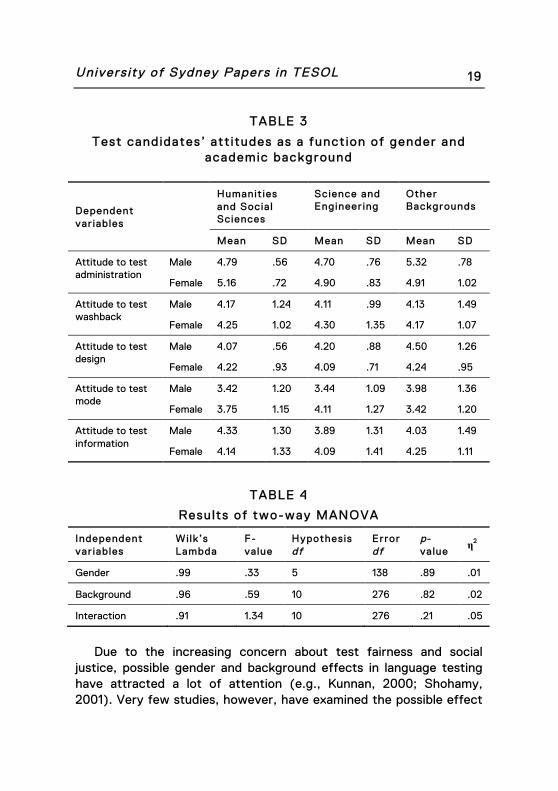
The multivariate test of significance (i.e., Wilks’ Lambda criterion variance, see Table 4) indicated that the main effects of gender and academic background were not statistically significant for the five dependent variables in this study (gender: Wilks’ λ=.99, F=.33, p=.89; academic background: Wilks’ λ=.96, F=.59, p=.82). In addition, the analysis indicated that the interaction effects between gender and academic background on the five attitudinal factors were also not statistically significant (Wilks’ λ=.91, F=1.34, p=.21). The results of factorial MANOVA suggested that gender and academic background, the two variables of test candidates’ personal characteristics, did not affect their reported attitudes to the FET.
University of Sydney Papers in TESOL 19
TABLE 3
Test candidates’ attitudes as a function of gender and academic background
Dependent variables
Humanities and Social Sciences
Science and Engineering
Other Backgrounds
Mean SD Mean SD Mean SD
Attitude to test administration
Male 4.79 .56 4.70 .76 5.32 .78
Female 5.16 .72 4.90 .83 4.91 1.02
Attitude to test washback
Male 4.17 1.24 4.11 .99 4.13 1.49
Female 4.25 1.02 4.30 1.35 4.17 1.07
Attitude to test design
Male 4.07 .56 4.20 .88 4.50 1.26
Female 4.22 .93 4.09 .71 4.24 .95
Attitude to test mode
Male 3.42 1.20 3.44 1.09 3.98 1.36
Female 3.75 1.15 4.11 1.27 3.42 1.20
Attitude to test information
Male 4.33 1.30 3.89 1.31 4.03 1.49
Female 4.14 1.33 4.09 1.41 4.25 1.11
TABLE 4
Results of two-way MANOVA
Independent variables
Wilk’s Lambda
F-value
Hypothesis df
Error df
p-value
η2
Gender .99 .33 5 138 .89 .01
Background .96 .59 10 276 .82 .02
Interaction .91 1.34 10 276 .21 .05
Due to the increasing concern about test fairness and social justice, possible gender and background effects in language testing have attracted a lot of attention (e.g., Kunnan, 2000; Shohamy, 2001). Very few studies, however, have examined the possible effect
Jinsong Fan & Peiying Ji 20
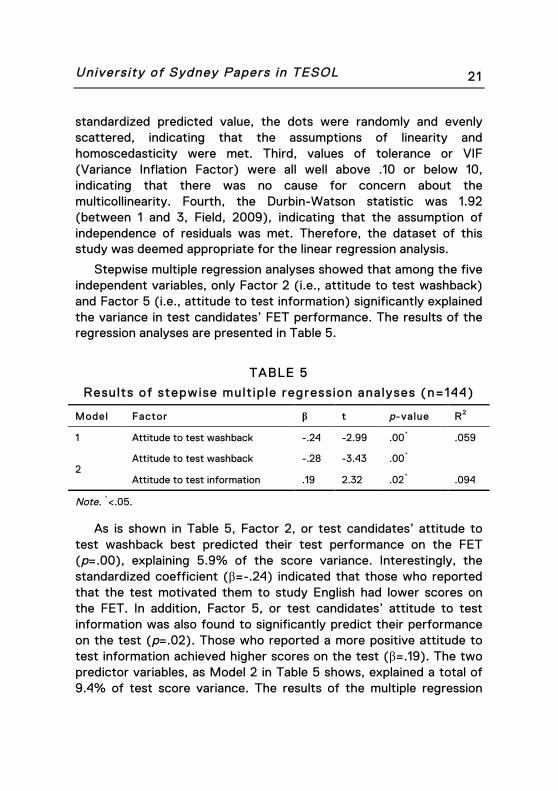
of test candidates’ gender and background on their attitudes towards a language test. This study indicated that test candidates’ gender and academic background did not affect how they perceived the effectiveness and usefulness of the different aspects of the FET. The findings of this study concur with Rasti’s (2009) study, but are not consistent with Zhao and Cheng’s (2010) study which found that female candidates had significantly more positive attitudes than their male counterparts.
The discrepancies in research findings could be attributed to the different operationalizations of the construct ‘attitude’. In the present study, ‘attitude’ was operationalized as test candidates’ perceptions of the different aspects of the FET, an operationalization which was similar to Rasti’s (2009) study. However, in Zhao and Cheng’s (2010) study, four factors were identified to represent students’ attitudes to the CET, including test-taking anxiety/lack of concentration, test-taking motivation, belief in CET, and test ease. In comparison to the factors identified in this study, the four factors in Zhao and Cheng’s study were more relevant to test candidates’ psychological processes when preparing for and taking the test. Given that fairness is an essential foundation of test validity, a test should function equally and appropriately across all groups of test candidates (AERA et al. 1999).Further research is necessary to explore the possible impact of the two variables, i.e., test candidates’ gender and academic backgrounds on the attitudinal factors which are more relevant to their psychological processes such as test anxiety (see also Stricker & Attali, 2010).
Test candidates’ attitudes and test performance (RQ3)
In order to investigate the relationship between test candidates’ attitudes and their test performance, stepwise multiple regression analyses were performed with the five attitudinal factors as the independent variables and test candidates’ test scores on the FET as the dependent variable. Statistical assumptions for the linear regression model were checked before exploring the relationships among variables. First, the histogram of the residual was roughly normally distributed, satisfying the assumption of normality of residuals. Second, in the scatterplot of standardized residual against
University of Sydney Papers in TESOL 21
standardized predicted value, the dots were randomly and evenly scattered, indicating that the assumptions of linearity and homoscedasticity were met. Third, values of tolerance or VIF (Variance Inflation Factor) were all well above .10 or below 10, indicating that there was no cause for concern about the multicollinearity. Fourth, the Durbin-Watson statistic was 1.92 (between 1 and 3, Field, 2009), indicating that the assumption of independence of residuals was met. Therefore, the dataset of this study was deemed appropriate for the linear regression analysis.
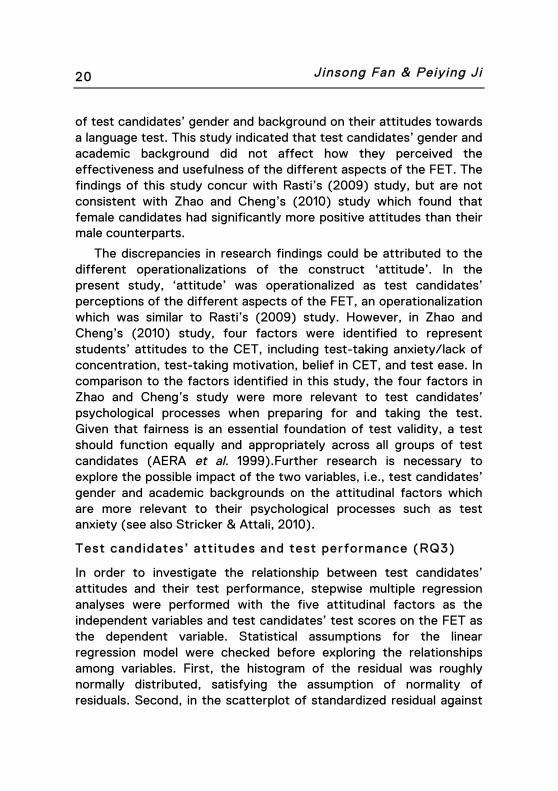
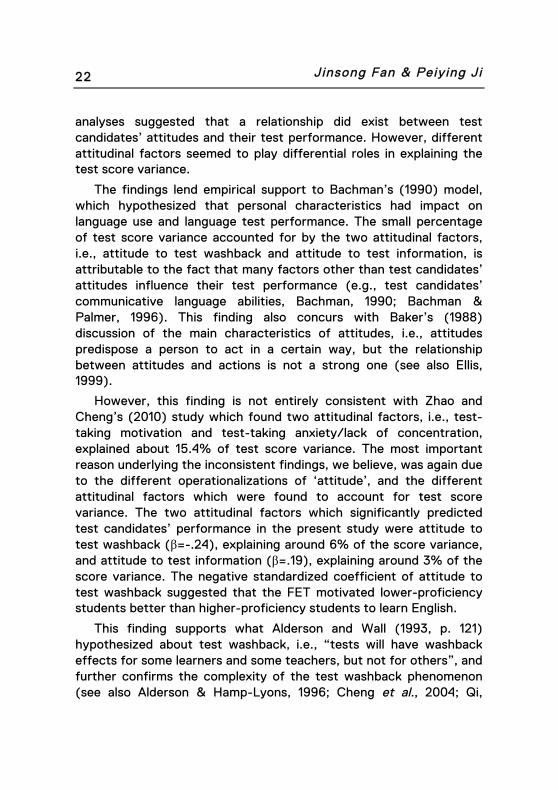
Stepwise multiple regression analyses showed that among the five independent variables, only Factor 2 (i.e., attitude to test washback) and Factor 5 (i.e., attitude to test information) significantly explained the variance in test candidates’ FET performance. The results of the regression analyses are presented in Table 5.
TABLE 5
Results of stepwise multiple regression analyses (n=144)
Model Factor β t p-value R2
1 Attitude to test washback -.24 -2.99 .00* .059
2 Attitude to test washback -.28 -3.43 .00*
.094 Attitude to test information .19 2.32 .02*
Note. *<.05.
As is shown in Table 5, Factor 2, or test candidates’ attitude to test washback best predicted their test performance on the FET (p=.00), explaining 5.9% of the score variance. Interestingly, the standardized coefficient (β=-.24) indicated that those who reported that the test motivated them to study English had lower scores on the FET. In addition, Factor 5, or test candidates’ attitude to test information was also found to significantly predict their performance on the test (p=.02). Those who reported a more positive attitude to test information achieved higher scores on the test (β=.19). The two predictor variables, as Model 2 in Table 5 shows, explained a total of 9.4% of test score variance. The results of the multiple regression
Jinsong Fan & Peiying Ji 22
analyses suggested that a relationship did exist between test candidates’ attitudes and their test performance. However, different attitudinal factors seemed to play differential roles in explaining the test score variance.
The findings lend empirical support to Bachman’s (1990) model, which hypothesized that personal characteristics had impact on language use and language test performance. The small percentage of test score variance accounted for by the two attitudinal factors, i.e., attitude to test washback and attitude to test information, is attributable to the fact that many factors other than test candidates’ attitudes influence their test performance (e.g., test candidates’ communicative language abilities, Bachman, 1990; Bachman & Palmer, 1996). This finding also concurs with Baker’s (1988) discussion of the main characteristics of attitudes, i.e., attitudes predispose a person to act in a certain way, but the relationship between attitudes and actions is not a strong one (see also Ellis, 1999).
However, this finding is not entirely consistent with Zhao and Cheng’s (2010) study which found two attitudinal factors, i.e., test-taking motivation and test-taking anxiety/lack of concentration, explained about 15.4% of test score variance. The most important reason underlying the inconsistent findings, we believe, was again due to the different operationalizations of ‘attitude’, and the different attitudinal factors which were found to account for test score variance. The two attitudinal factors which significantly predicted test candidates’ performance in the present study were attitude to test washback (β=-.24), explaining around 6% of the score variance, and attitude to test information (β=.19), explaining around 3% of the score variance. The negative standardized coefficient of attitude to test washback suggested that the FET motivated lower-proficiency students better than higher-proficiency students to learn English.
This finding supports what Alderson and Wall (1993, p. 121) hypothesized about test washback, i.e., “tests will have washback effects for some learners and some teachers, but not for others”, and further confirms the complexity of the test washback phenomenon (see also Alderson & Hamp-Lyons, 1996; Cheng et al., 2004; Qi,
University of Sydney Papers in TESOL 23
2005). The other predictor variable, attitude to test information, further reiterated the importance of making test information equally accessible to all test candidates since it is related, as argued earlier, to test validity and fairness (AERA et al. 1999; Kunnan, 2000).
CONCLUSIONS, LIMITATIONS, AND IMPLICATIONS
Preparing for and taking language tests can be a stressful and unpleasant experience in many ways. This is particularly true of the Chinese testing context in which results on many English language tests are used to make extremely high-stakes decisions (e.g., Cheng & Curtis, 2010). Motivated by Bachman’s (1990) model of language use and language test performance, this study investigated test candidates’ attitudes to the FET, and explored the relationships between test candidates’ attitudes, test taker characteristics, and test performance. In contrast to what is normally assumed of language tests, the present study found that the overall pattern of test candidates’ attitudes to the FET was positive. More precisely, test candidates’ positive attitudes to the FET were primarily concentrated on the organization and administration of the test, the integrated tasks in the FET which tapped into more than one language modality, and the FET as an external motivator in learning English.
These findings conflicted with the anecdotal evidence reported by some teachers and students which suggested that test candidates had predominantly negative attitudes towards the FET. Since the FET is a newly developed English proficiency test, the test provider should be encouraged by such findings. Nevertheless, this study also identified test candidates’ negative attitudes towards some aspects of the FET that largely corresponded to the anecdotal reports. For example, among the five attitudinal factors, test candidates held the least positive attitude to the mode of the computer-based spoken English test in the FET. The reasons behind this finding, according to the qualitative data, were not related to the mode per se but due to the lack of familiarity with the task format and the noisy environment in the examination hall. Test candidates also held rather negative attitudes to the transparency of test information, an issue which was salient in anecdotal evidence, and to the lack of recognition of the
Jinsong Fan & Peiying Ji 24
test. Results of two-way MANOVA showed that test candidates’ personal characteristics such as gender and academic backgrounds had no significant effect on their reported attitudes to the FET. Stepwise regression analyses showed that two attitudinal factors, attitude to test washback and attitude to test information, significantly predicted test candidates’ performance, explaining 9.4% of test score variance.
Through the investigation of test candidates’ attitudes to the FET, this study has added more empirical evidence as to the relationships between attitudinal factors and test taker characteristics, and how these variables (i.e., attitudes, gender, and background knowledge) interact with each other in shaping test candidates’ performance on a language test. The findings of this study generally concur with other studies investigating test candidates’ attitudes to large-scale high-stakes language tests (e.g., Gu, 2007; Murray et al. 2012; Rasti, 2009; Zhao & Cheng, 2010). First, this study found that on the whole test candidates’ attitudes to the FET were positive. This finding is consistent with Gu (2007) and Murray et al. (2012), suggesting that the high stakes attached to a language test do not necessarily bring about test candidates’ negative feelings or emotions.
Secondly, this study found that variables of personal characteristics (i.e., gender and academic background) did not affect test candidates’ reported attitudes to the FET. This finding is consistent with what Rasti (2009) has reported about test candidates’ attitudes to the IELTS. However, by adopting factorial MANOVA, this study explored both the main and interaction effects of gender and academic background on the five different attitudinal factors simultaneously. In doing so, this study has added to the current understanding about the effects of personal characteristics on attitudes to language tests.
Thirdly, this study found that among the five attitudinal factors extracted by EFA, two factors (i.e., attitude to test washback and attitude to test information) significantly explained test candidates’ performance on the FET. This finding confirmed Zhao and Cheng’s (2010) study of the CET, demonstrating that relationship did exist between attitudinal factors and test performance. Also, this finding
University of Sydney Papers in TESOL 25
lends empirical support to the hypothesis in Bachman’s (1990) model of language use and language test performance that test candidates’ personal characteristics influence their test performance. For language testing practitioners, the findings of this study further confirm the importance of empirically investigating attitudinal factors in the process of test development and construct validation (Messick, 1989). Though attitudinal factors were found in this study to explain only a reasonably small percentage of test score variance, we believe the finding still warrants the attention from high-stakes language test providers since appropriate measures to address these factors in the testing process may help to minimize their adverse impact on the test’s construct validity. Because gender and academic background did not influence test candidates’ attitudes, these variables may not need to be considered seriously in addressing these factors.
A few limitations of this study need to be mentioned. First of all, ‘attitude’ in this study was operationalized as test candidates’ perceptions of the effectiveness and usefulness of the different aspects of the FET. Therefore, the results may not allow for meaningful generalizations if the construct ‘attitude’ is understood in a different sense. Secondly, due to practical constraints, strictly stratified random sampling was not adopted in this study. As a consequence, the representativeness of the sample of the FET candidature could not be guaranteed. It was likely that those who volunteered to participate in the study were those who were more active in learning English, and had more positive attitudes towards English learning and testing.
For future studies, it would be worthwhile to expand the interpretation of ‘attitude’ in the investigation. Theoretical frameworks such as the Expectancy-value theory (EVT) from learning psychology (Jacobs & Eccles, 2000) can be adopted in the interpretation of ‘attitude’, and factors such as expectations of success, test anxiety, and test-taking motivation, as reflected in the EVT, can be included in the investigations. By so doing, language testers and educators would have a better picture of the role of attitudes in language testing.
Jinsong Fan & Peiying Ji 26
In the light of the findings of this study, it would be beneficial for the provider of the FET, and indeed any developer of high-stakes language test to follow Messick’s (1989) suggestion by incorporating the investigation of test candidates’ attitudes as a component of construct validation. In addition, the results of this study suggest that it is important not only to monitor the patterns of test candidates’ attitudes, but also to more closely examine the reasons behind their reported attitudes. Finally, the findings also suggest that test candidates’ attitudes are amenable to modification and intervention. If, for example, test providers could ensure equal access to necessary test information to all test candidates and continuously promote recognition of the test, it is likely that test candidates would have more positive attitudes towards the test.
ACKNOWLEDGEMENTS
The preparation of this manuscript was supported by the National Social Sciences Fund of the People’s Republic of China, or Guojia Sheke Jijin, under the project title ‘The Development and Validation of Standards in Language Testing’ (Grant Number: 13CYY032). We would like to express sincere thanks to Dr. Marie Stevenson, the co-editor of this journal, and two anonymous reviewers for their very insightful comments and suggestions on early versions of this article. Also, we would like to thank all the students who participated in this study.
THE AUTHORS
Jinsong Fan is a lecturer in applied linguistics in the College of Foreign Languages and Literature at Fudan University. He obtained his PhD in language testing from a joint program between Shanghai Jiaotong University and the University of Warwick in 2011. His research interests are language testing and assessment.
Peiying Ji is Professor in applied linguistics in the College of Foreign Languages and Literature at Fudan University. She has had extensive experience teaching English as a foreign language in China for more than twenty years. Her research interests focus on second language acquisition, foreign language teaching and learning, language testing and EFL materials development.
University of Sydney Papers in TESOL 27
REFERENCES
AERA, APA, & NCME (1999). Standards for educational & psychological testing. Washington, DC: AERA.
Alderson, J. C., & Hamp-Lyons, L. (1996). TOEFL preparation course: a study of washback. Language Testing, 13(3), 280-297.
Alderson, J. C., & Wall, D. (1993). Does washback exist? Applied Linguistics, 14(2), 115-129.
Allport, G. W. (1971). Attitudes. In K. Thomas (Ed.), Attitudes and behavior. Harmondsworth, UK: Penguin.
Bachman, L. F. (1990). Fundamental considerations in language testing. Oxford: Oxford University Press.
Bachman, L. F., & Palmer, A. S. (1996). Language testing in practice. Oxford: Oxford University Press.
Baker, C. (1988). Key issues in bilingualism and bilingual education. Clevedon, UK: Multilingual Matters.
Baker, C. (1992). Attitudes and language. Clevedon, UK: Multilingual Matters.
Bentler, P. (2005). EQS 6 Structural equation program manual. Encino, CA: Multivariate Software.
Brown, D. H. (2000). Principles of language learning and teaching (4th edition). New York: Longman.
Cheng, L. (2005). Changing language teaching through language testing. Cambridge: Cambridge University Press.
Cheng, L., & Curtis, A. (Eds) (2010). English language assessment and the Chinese learner. New York: Routledge, Taylor and Francis Group.
Cheng, L., & Wang, X. (2007). Grading, feedback, and reporting in ESL/EFL classrooms. Language Assessment Quarterly, 4(1), 85-107.
Cheng, L., Watanabe, Y., & Curtis, A. (Eds) (2004). Washback in language testing. London: Lawrence.
Crocker, L., & Algina, J. (1986). Introduction to classical and modern test theory. New York: Saunders College Publishing.
Jinsong Fan & Peiying Ji 28
Dai, W., & Hu, W. (Eds) (2009). Research on the development of foreign language education in China. Shanghai: Shanghai Foreign Language Education Press.
Dornyei, Z., & Taguchi, T. (2011). Questionnaires in second language research: Construction, administration and processing. Beijing: Foreign Language Teaching and Research Press.
Elder, C., Iwashita, N., & McNamara, T. (2002). Estimating the difficulty of oral proficiency tasks: What does the test taker have to offer? Language Testing, 19(4), 347-368.
Ellis, R. (1999). Understanding second language acquisition. Shanghai: Shanghai Foreign Language Education Press.
Fan, J. (2013a). The development of the FET test specifications: An empirical investigation into university students’ English language needs. Unpublished research report, Fudan University, Shanghai.
Fan, J. (2013b). Factor structure and factorial invariance of a university-based EAP test. Research paper presented at the 17th Japan Language Testing Association (JLTA) annual conference, Waseda University, Tokyo.
Fan, J., & Ji, P. (2013). Examining the validity of the Fudan English Test: Test data analysis. Foreign Language Testing and Teaching 2, 45-53.
Field, A. (2009). Discovering statistics using SPSS (3rd edition). London: SAGE.
Fudan University Testing Group (2014, forthcoming). The Fudan English Test (FET) Syllabus. Shanghai: Fudan University Press.
Gardner, R. (1985). Social psychology and second language learning: The role of attitude & motivation. London: Edward Arnold.
Gu, X. (2007). Positive or negative: An empirical study of CET washback. Chongqing: Chongqing University Press.
Hamp-Lyons, L. (2000). Social, professional and individual responsibility in language testing. System, 28(4), 579-591.
Han, B., Dai, M., & Yang, L. (2004). Problems with College English Test as emerged from a survey. Foreign Languages and Their Teaching, 179(2), 17-23.
University of Sydney Papers in TESOL 29
IBM (2012). IBM SPSS Statistics 21 core system user’s guide. New York: IMB Corp.
ILTA (2007). The ILTA guidelines for practice. www.iltaonline.com/images/pdfs/ILTA_Guidelines.pdf.
Jacobs, J. E., & Eccles, J. S. (2000). Parents, task values, and real-life achievement-related choices. In C. Sansone & J. M. Harackiewicz (Eds), Intrinsic motivation (pp. 405-439). San Diego, CA: Academic Press.
Kunnan, A. J. (Ed.) (2000). Fairness and validation in language assessment. Cambridge, UK: Cambridge University Press.
Messick, S. (1989). Validity. In R. L. Linn (Ed.), Educational measurement (3rd edition) (pp. 13-103). New York: Macmillan.
Murray, J. C., Riazi, A. M., & Cross, J. L. (2012). Test candidates’ attitudes and their relationship to demographic and experiential variables: The case of overseas trained teachers in NSW, Australia. Language Testing, 29(4), 577-595.
Qi, L. (2005). Stakeholders’ conflicting aims undermine the washback function of a high-stakes test. Language Testing, 22(2), 142-173.
Rasti, I. (2009). Iranian candidates’ attitudes towards IELTS. Asian EFL Journal, 11(3), 110-155.
Shohamy, E. (2001). Democratic assessment as an alternative. Language Testing, 18(4), 373-391.
Stricker, L. J., & Attali, Y. (2010). Test takers’ attitudes about the TOEFL iBT. TOEFL iBT Research Report, 13.
TOPE Project Team (2013). Syllabus for Test of Oral Proficiency in English (TOPE). Beijing: China Renming University Press.
Tsinghua University Testing Team (2012). Syllabus for Tsinghua English Proficiency Test (TEPT). Beijing: Tsinghua University Press.
Zhao, J., & Cheng, L. (2010). Exploring the relationship between Chinese university students’ attitude towards the College English Test and their test performance. In L. Cheng & A. Curtis (Eds), English language assessment and the Chinese learner (pp. 190-201). New York: Routledge, Taylor & Francis Group.
Jinsong Fan & Peiying Ji 30
Zheng, Y., & Cheng, L. (2008). The College English Test (CET) in China. Language Testing, 25(3), 408-417.
University of Sydney Papers in TESOL 31
APPENDIX A. STATEMENTS IN THE SURVEY QUESTIONNAIRE3
1. I think the design of the test is on the whole reasonable. 2. I think the FET is a comprehensive test of my English proficiency. 3. I believe the FET test score can truly reflects my English level. 4. I think the language abilities assessed in the FET are what I need
for my studies and work. 5. I think the test items in the FET reflect real-life language use. 6. I can easily access test-related information prior to taking the test. 7. I understand how the FET assesses my English language abilities. 8. I understand the scoring criteria for the FET composition section. 9. I understand the scoring criteria for the FET speaking test. 10. I am familiar with the official webpage of the FET. 11. My English teachers have provided information about the test. 12. I am satisfied with the organization of the test. 13. I am satisfied with the examination hall for the FET written test. 14. I think the proctors have performed their duties well in the written
test. 15. I think the examiners have performed their duties well in the
speaking test. 16. I can perform to the best of my ability in the FET speaking test. 17. I can adjust myself well to computed-based speaking test. 18. I believe the FET speaking test can well assess my English
speaking abilities. 19. Without an interlocutor in the FET speaking test, I feel much more
relaxed. 20. I have improved my English level through preparing and taking the
FET. 21. I think the FET has motivated me to spend more time learning
English. 22. I think the FET has motivated me to listen to more English radio
programs.
3 Due to limitation of space, only statements in the survey questionnaire are presented in Appendix A. Interested readers can obtain the full version of the questionnaire through the correspondence author of this paper.

Jinsong Fan & Peiying Ji 32
23. I think the FET has motivated me to read more English newspapers and magazines.
24. I believe the FET has pushed me to study harder in English.
University of Sydney Papers in TESOL 33
APPENDIX B. INTERVIEW GUIDE
1. Please comment on the strengths and weaknesses of the FET.
2. Please comment briefly on the FET written test in terms of test design, administration, or anything else which you deem worthy of comment.
3. Please comment on the FET speaking test.
4. Please comment briefly on the impact, if any, of the FET on your English learning.
5. In your opinion, how can the FET be further improved in the future?
Jinsong Fan & Peiying Ji 34
APPENDIX C. CODING SCHEME FOR THE INTERVIEW DATA
Themes Sub-themes Codes Overall attitudes to the FET
OA
Attitudes to the FET written test
Attitudes to listening AL Attitudes to reading AR Attitudes to writing AW Attitudes to test administration
ATA
Attitudes to the SET
Attitudes to computer-based SET
ACS
Attitudes to testing environment
ATE
Attitudes to test format ATF Attitudes to test washback
ATW
Future improvements FI
Note. SET = Spoken English Test.
University of Sydney Papers in TESOL 35
APPENDIX D. DESCRIPTIVE AND FREQUENCY STATISTICS AT THE ITEM LEVEL
Item Mean SD Agree (%) Disagree (%)
1 4.15 1.17 77.4 22.6 2 4.21 1.07 82.1 17.9 3 3.91 1.10 68.2 31.8 4 4.59 1.09 83.3 16.7 6 4.24 1.36 73.1 26.9 7 4.10 1.61 66.5 33.5 10 4.01 1.72 65.0 35.0 12 4.75 1.04 88.5 11.5 13 4.68 1.15 86.0 14.0 14 5.16 .87 97.5 2.5 15 4.96 .94 91.7 8.3 16 3.23 1.33 40.8 59.2 17 3.52 1.54 50.3 49.7 18 3.74 1.50 56.7 43.3 19 4.01 1.60 63.1 36.9 21 4.12 1.37 68.2 31.8 22 3.90 1.38 63.1 36.9 23 3.78 1.35 57.3 42.7 24 4.88 1.26 87.9 12.1
Notes. ‘Agree’ refers to the combination of ‘Strongly Agree’, ‘Agree’, and ‘Slightly Agree’ in the questionnaire; ‘Disagree’ refers to the combination of ‘Strongly Disagree’, ‘Disagree’, and ‘Slightly Disagree’.